1
Market Performance of US Listed Shipping IPOs
Andreas Merikasa,*, Dimitrios Gounopoulosb, and Chrysoula Karli
aDepartment of Shipping, University of Piraeus, Piraeus 18532, Greece. E-mails: [email protected]; [email protected]
bSurrey Business School, University of Surrey, Guildford, Surrey GU2 7XH, UK. E-mail: [email protected]
cDepartment of Economics, University of Athens, Athens 10559, Greece.
E-mail: [email protected]
1This paper empirically analyses the initial and aftermarket returns for US Listed Shipping IPOs. Our main objective is to fulfil the great need for the U.S. Shipping evidence on long run performance of IPOs. We aim to test the extent to which signalling models explain the reasons for the issuance of IPOs using the long-term price performance approach. We concentrate on a sample of 61 IPOs listed during the period 1987–2007 in four major US Stock Exchanges, computing buy-and-hold abnormal returns (BHARs) and cumulative average returns (CARs). The results show that U.S. Listed Shipping IPOs are underpriced on initial trading day on average by only 4.44%, a figure which indicates an outstanding level of maturity for the shipping sector. In the long run, Shipping IPOs listed in the U.S. offer one-, two-, and three-year holding period returns (BHAR) of 7.50%, 7.73%, and 3.26%, respectively. The conclusion suggested by those results is that investing in U.S. is not a guaranteed investment for long-term Shipping IPOs oriented investors.
Keywords: Shipping Finance; Initial Public Offerings; Performance of IPOs; Market Volatility;
1 To whom correspondence should be addressed: e-mail: [email protected]
We thank Ken French for providing access to the historical size and book-to-market breakpoints, portfolio returns,
and factor returns. Ioannis Papadimitriou provided excellent research assistance.

2
INTRODUCTION
Shipping IPOs are distinct from those of ordinary industrial or service companies. The
market value of a shipping company is often closely associated to the underlying value of the
physical assets (vessels). In this respect, shipping IPOs bear similarities to their respective IPOs
of closed-end funds and property companies. Furthermore, due to extensive information flow in
international vessel sales and purchase markets, shipping IPOs tend to exhibit lower information
asymmetry. Due to the cyclical nature of the maritime business, shipping companies tend to
prefer equity markets when shipping market prospects appear promising (Syriopoulos (2007)).
A risky issue involving shipping IPOs has been whether shipping companies would attract
investors‘ funding. However, as it turned out, shipping IPOs have been considered
‗fashionable,‘ although more recently IPOs have experienced increasing investor fatigue for
shipping stocks. As a result, a number of shipping IPOs failed to proceed or withdrew, as was
the case for the initial IPO effort of Aegean Maritime Petroleum and the follow-on share
offering of Diana Shipping. To abstain from such failures, many shipping firms choose to avoid
their local markets and target a listing in one of the US stock exchanges. Managers believe that
a listing in the US will give investors the confidence they need in order to invest their money
and expect some good returns in the future. In order to achieve this, Gounopoulos et al (2009)
report that shipping firms consistently focus on promoting investment plans that bear growth
potential and have positive returns that outperform more than the undertaken required costs.
Previous studies on this subject, and more specifically on the long-term performance,
have the celebrated paper by Ritter (1991) as a starting point for the US market. He reports an
average holding period return of 34.47% in the three years after going public, compared with
the 61.86% over the same period for a sample of matching firms. On every dollar invested in a
portfolio of IPOs purchased at the closing market price, there is a wealth of $1.34, while every
dollar in the matching firm brings a wealth of $1.61. Obviously, Ritter reports
underperformance of the IPOs in the long run.
Specialised publications about shipping IPOs have been covered by Grammenos and
Marcoulis (1996), Grammenos and Arcoulis (1999), Cullinane and Gong (2002) and more
recently by Gounopoulos et. al. (2009). As none of the above studies specifically and
extensively covered the US market, this manuscript‘s main purpose is to fill this gap. It
investigates the short- and long-term performance of initial public offerings (IPOs) of common
stocks in the US Listed Shipping Industry (USSI) and explores the factors influencing their
performance. To do so, it employs 61 IPOs issued on the various stock exchanges of the United
States between January 1987 and December 2007.
There are several reasons why long-run performance of initial public offerings is of
interest in the US market. First, looking from the investors‘ perspectives, the existence of price
patterns may present opportunities for active trading strategies to produce considerable returns
(Ritter (1991)). Second, IPOs‘ volume signals large variations over time. If the periods with
high volume experience poor long-run performance, this can signal the ability of the issuers to
time new issues and take advantage of ‗windows of opportunity.‘ Third, the cost of external
equity capital for shipping firms going to the stock exchange depends not only on the returns
that investors receive in the aftermarket but also on the transaction costs incurred by going
public.
To achieve its targets in terms of the short- and long-term performance, this study
employs a variety of methods for measuring long-term abnormal returns. These are the
cumulative average returns (CARs) on a three-year basis to better test the stability; the buy-and-
hold abnormal returns (BHARs) of the IPOs for 6 months and up to 36 months after listing in

3
the market; and the Fama-French (1996a) three-factor (FF3F) model. We are in the position to
report that, using the BHAR benchmark, there is neither out-performance nor under-
performance, up to a period of three years after going public. The observed outcome is not
confirmed, with the returns of non-IPO firms having been matched in size—an outcome which
is in line with the findings of Ritter (1991).
Our study makes three main contributions. First, using a variety of benchmarks, it
documents the short-term underpricing phenomenon and the long-run performance of US Listed
Shipping IPOs by following an analytical framework. Second, it is one of the few studies
worldwide (and the first in the US shipping industry) to investigate the determinants of long-run
performance by using explanatory variables relating to either market or firm characteristics.
Third, it compares our results with those provided by Ritter ((1991), (2009)) and emphasizes the
changes that the shipping IPO sector is bringing to the US market. We find recent robust stock
price returns supported by low short–term underpricing, a strong signal that indicates how
mature the shipping sector is. Post-IPO shipping stock performance reveals positive (in some
cases by a margin) long-term returns for everyone investing during the offer price period or
those investing at the end of the first day of listing and keeping their stocks for many months of
trading. Key factors for stock performance include efficient management, attractive valuation,
modern corporate governance, robust organic growth prospects, and successful acquisition
plans.
The remainder of this paper is structured as follows. Section 2 reviews the literature
regarding the short- and long-term performance of U.S. IPOs. Section 3 presents the
methodology used and the empirical findings. Section 4 concludes with suggested strategies for
initial public offerings and implications for further studies in the shipping finance field.
PERFORMANCE OF IPOs IN THE US
Table 1 shows historical evidence about IPO performance in the US as reported by Ritter
(1991), Loughran (1993), Brav and Gompers (1997), Brav (2000), Ritter and Welch (2002),
Gompers and Lerner (2003), Loughran et al (2008), and Ritter (2009). As has already been
mentioned, the study conducted by Ritter (1991) is the starting point in the international
literature. Among the interesting points in his study is that the adjusted average three year buy
and hold returns are positive at 34.47% (mean of matching firms at 61.86%). In simple terms,
this means that once we adjust IPO returns for the general index, those become increasingly
positive (i.e., returns of listed firms prove to be a very good investment based on a three-year
strategy period). It does not appear to be a bad idea to buy IPO stocks during the offer price
period and sell them at the end of the first day of trading, as this will give returns of 14.06%.
Table 1: US Evidence on Short and Long term performance of IPOs The equally weighted (EW) average first-day return is measured by Ritter (2009) from the offer price to the first CRSP-listed closing price.
EW average three year buy-and-hold percentage returns (capital gains plus dividends) are calculated from the first closing market price to
the earlier of the three year anniversary price, or December 31, 2007. Market-adjusted returns are calculated as the buy-and-hold return on
an IPO minus the compounded daily return on the CRSP value-weighted index of Amex, Nasdaq, and NYSE firms. Style-adjusted buy-
and-hold returns are calculated as the difference between the return on an IPO and a style-matched firm. For each IPO, a non-IPO matching
firm that has been CRSP-listed for at least five years with the closest market capitalization and book-to-market ratio as the IPO is used. If
this is delisted prior to the IPO return‘s ending date, or if it conducts a follow-on stock offering, a replacement matching firm is spliced in
on a point-forward basis. Data is from Thomson Financial Securities Data, and corrections by Ritter (2009).
Researcher Sample
Size
Time Period Average First
day Return
Average 3 year buy
and hold returns
(IPOs)
Average 3 year buy
and hold returns
(market adjusted) Ritter (1991) 1,526 1975-1984 14.06% 34.47%
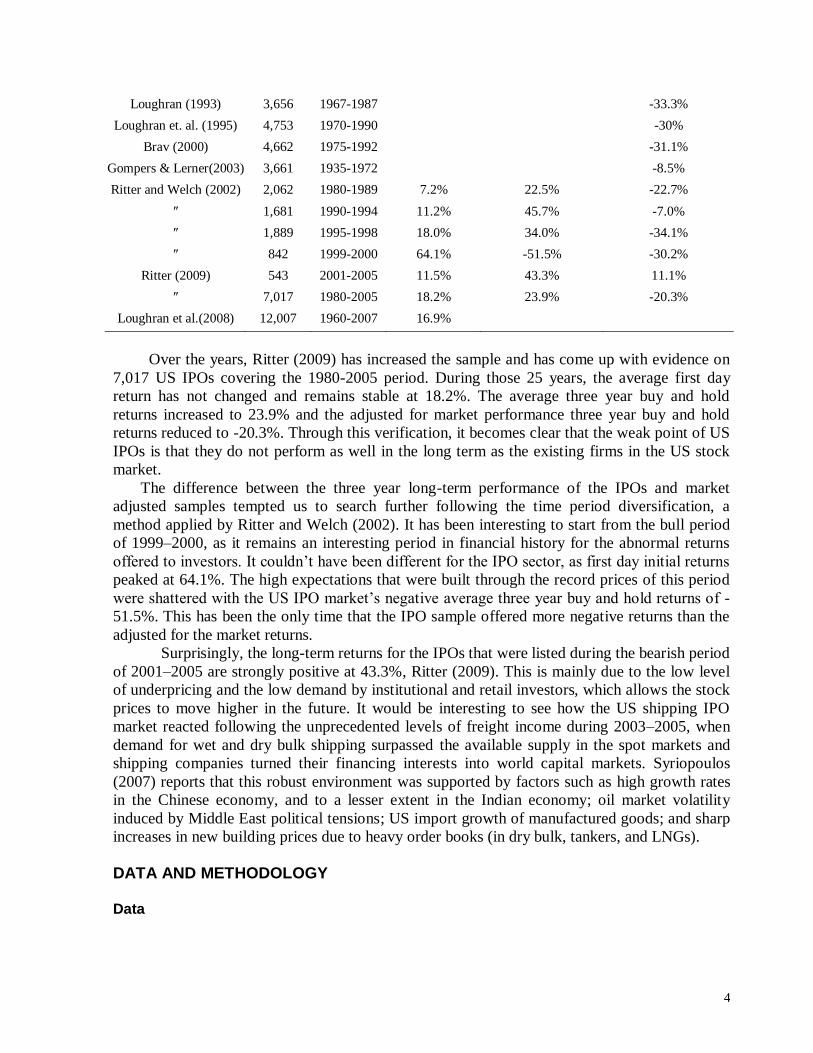
4
Loughran (1993) 3,656 1967-1987 -33.3%
Loughran et. al. (1995) 4,753 1970-1990 -30%
Brav (2000) 4,662 1975-1992 -31.1%
Gompers & Lerner(2003) 3,661 1935-1972 -8.5%
Ritter and Welch (2002) 2,062 1980-1989 7.2% 22.5% -22.7%
″ 1,681 1990-1994 11.2% 45.7% -7.0%
″ 1,889 1995-1998 18.0% 34.0% -34.1%
″ 842 1999-2000 64.1% -51.5% -30.2%
Ritter (2009) 543 2001-2005 11.5% 43.3% 11.1%
″ 7,017 1980-2005 18.2% 23.9% -20.3%
Loughran et al.(2008) 12,007 1960-2007 16.9%
Over the years, Ritter (2009) has increased the sample and has come up with evidence on
7,017 US IPOs covering the 1980-2005 period. During those 25 years, the average first day
return has not changed and remains stable at 18.2%. The average three year buy and hold
returns increased to 23.9% and the adjusted for market performance three year buy and hold
returns reduced to -20.3%. Through this verification, it becomes clear that the weak point of US
IPOs is that they do not perform as well in the long term as the existing firms in the US stock
market.
The difference between the three year long-term performance of the IPOs and market
adjusted samples tempted us to search further following the time period diversification, a
method applied by Ritter and Welch (2002). It has been interesting to start from the bull period
of 1999–2000, as it remains an interesting period in financial history for the abnormal returns
offered to investors. It couldn‘t have been different for the IPO sector, as first day initial returns
peaked at 64.1%. The high expectations that were built through the record prices of this period
were shattered with the US IPO market‘s negative average three year buy and hold returns of -
51.5%. This has been the only time that the IPO sample offered more negative returns than the
adjusted for the market returns.
Surprisingly, the long-term returns for the IPOs that were listed during the bearish period
of 2001–2005 are strongly positive at 43.3%, Ritter (2009). This is mainly due to the low level
of underpricing and the low demand by institutional and retail investors, which allows the stock
prices to move higher in the future. It would be interesting to see how the US shipping IPO
market reacted following the unprecedented levels of freight income during 2003–2005, when
demand for wet and dry bulk shipping surpassed the available supply in the spot markets and
shipping companies turned their financing interests into world capital markets. Syriopoulos
(2007) reports that this robust environment was supported by factors such as high growth rates
in the Chinese economy, and to a lesser extent in the Indian economy; oil market volatility
induced by Middle East political tensions; US import growth of manufactured goods; and sharp
increases in new building prices due to heavy order books (in dry bulk, tankers, and LNGs).
DATA AND METHODOLOGY Data

5
The sample is comprised of 61 US Listed Shipping IPOs obtained for the period 1987–2007,
which meet Ritter‘s (1991) criteria.2 We identify firms that went public during this period from
the Thomson Financial Securities Data Company (SDC) US Common Stock Initial Public
Offerings database, Bloomberg and Datastream. Data were collected from prospectuses of
companies and the annual statistical bulletins of the stock exchanges. Information on long-term
total returns (including both capital gains and dividend payments) was computed from monthly
returns data. Share prices were collected at pre-determined points in time during the first three
years of the stocks‘ trading in the market. Stock return, prices of the general stock exchange
index, and volume data are from the University of Chicago‘s Center for Research in Security
Prices (CRSP). Because there is no ex ante information about a specific weighting scheme, the
initial returns are equally weighted (i.e., the same amount of money is invested in every IPO).
Table 2 compares the initial and three year long-term returns between US IPOs as were
reported by Ritter (2009) and US Listed Shipping IPOs for the period 2002–2007. Inspection of
Table 2 shows that the number of IPOs was not evenly distributed. Only 129 of the 786 US
IPOs and 5 of the 46 US shipping sample offers occurred during the first 2 years of the period.
US IPOs proved to be a better investment in the short term, as they offered better returns to their
investors of 11.5% to 4.37%, and in the long term they offer much better returns of 11.1%
compared to -1.69% for US Listed Shipping IPOs. Yearly studies show stability of investors‘
initial returns, although there is a higher fluctuation on the returns they experience in the long
term. It is worth noting that, in 2005, the US listed IPOs had positive long-term returns of 9.6%
at the same time that US shipping IPOs presented negative returns by 6.37%.
Table 2: Comparison of US IPOs with US Listed Shipping IPOs: Number of IPOs, First-day
Returns, and Long-Run Performance, IPOs from 2002–2007 The equally weighted (EW) average first-day return is measured from the offer price to the first CRSP-listed closing price. EW average three
year buy-and-hold percentage returns (capital gains plus dividends) are calculated from the first closing market price to the earlier of the three
year anniversary price, the delisting price, or December 31, 2007. Market-adjusted returns are calculated as the buy-and-hold return on an IPO
minus the compounded daily return on the CRSP value-weighted index of Amex, Nasdaq, and NYSE firms. Style-adjusted buy-and-hold returns
are calculated as the difference between the return on an IPO and a style-matched firm. Data is from Thomson Financial Securities Data.
Year No of IPOs
Average 1st Day Return
Average 3-year Buy-and-hold Return (market adjusted)
No of Shipping
IPOs
Shipping IPOs Average 1st Day
Return
Shipping IPOs Average 3-year Buy-and-hold
Return(market adjusted)
2002 66 9.1% 38.9% 3 8.87% 34.49%
2003 63 12.2% -6.2% 2 9.45% 14.76%
2004 173 12.2% 7.2% 11 3.37% 19.00%
2005 160 10.2% 9.6% 16 2.25% -6.37%
2006 164 11.3% 6.3% 8 -0.35% -7.28%
2007 160 6.4% - 6 6.69% -24.48%
After 2000 786 11.5% 11.1% 46 4.37% -1.69%
Source: US IPOs data comes from Ritter (1991), US Shipping IPOs have been collected by the authors of this
article
2 Ritter‘s (1991) criteria are: (1) an offer price of $1.00 per share or more; (2) gross proceeds, measured in terms of
2007 purchasing power, of $1,000,000 or more; (3) the offering involved common stocks only (unit offers are
excluded); (4) the company is listed on The CRSP daily Amex-NYSE-NASDAQ or OTC tapes within six months
of the offer date; and (5) investment bankers took the company public in 1987-2007.

6
Methodology
Event-time abnormal returns
This study initially explores the returns offered by the US Listed Shipping IPOs in the end of
first day of trading and the long term returns covering periods of 1, 2 and 3 Years. Then a cross-
sectional analysis is employed to help us examine factors determining IPO performance.
Finally, regression analyses are undertaken.
We measure the underpricing of US Listed Shipping IPOs as the return on the first day
of trading relative to the offering price.
n
i I
i
P
P
nt
1 1
00 )1(
1Re (1)
Where Ret0 is the average return (underpricing) of the IPO on the first trading day (day 0), Pi0 is
the closing price of stock i on day 0, and Pit is the offering price of stock i. We also adjust the
return for the market effect:
n
i mi
mi
i
i
P
P
P
P
nAdjret
1 1,
0,
1
0 )(1
(2)
Where AdjRet0 is the average of the market adjusted returns (including dividends) of
IPOs on day 0, Pi,m0 is the closing value of the corresponding stock exchanges market index on
the first trading day of the new issue i, Pi,m1 is the closing value of the corresponding stock
exchange market index on the offering day of the new issue i.
Brav et al. (2000), indicate that performance highly depends on the selected
methodology. The issue as to whether cumulative abnormal return (CAR) or buy-and-hold
abnormal returns (BHAR) should be used to measure the long-term price performance is widely
debated in the literature. For robustness purposes, we report both the CAR and BHAR in this
study.
We monitor our samples of all, share-only and unit IPOs for a period of 3 years
subsequent to their issuance. Following Cheng (2005) and Mazouz et. al. (2008), we use both
event-induced average buy-and-hold abnormal return (BHAR) and event-induced average
cumulative abnormal return (CAR) to measure the abnormal returns associated with our sample
of IPO firms. The 3-year BHAR and CAR are calculated as follows
n
i
itt arn
AR1
1 (3)
N
I
ii BHARBHAR1
(4)
N
t
IiCARCAR1
(5)

7
where ωi is the weight on firm i and N is the number of firms. The 3-year BHAR and CAR are
calculated using both equally and value-weighted returns. The value weights are based on the
market value of equity at the end of the event month. The firm i‘s buy-and-hold return (BHARi)
and cumulative abnormal return (CARi) are estimated as
36
1
,
36
1
, )1()1(t
tB
t
tiI RRBHAR (6)
36
1
,,
t
tbtii RRCAR (7)
where Ri,t is the monthly return of an event firm i in month t and RB,t is the monthly return of
benchmark firm or portfolio.
Standard Calendar time regressions
Work by Fama and French ((1992), (1993), (1995), (1996a)) indicates that a three-factor model may
explain the cross section of stock returns. Thus we employ the following standard calendar-time
regressions, which both automatically account for the cross-correlation of event firms in the
portfolio variance and test for the performance of a given portfolio beyond the level of which
common risk factors can capture.
ptttftmtftpt HMLSMBRRaRR )[()( (8)
where Rp,t is the monthly return of the portfolio of event firms. At the beginning of each month,
we form an equally and a value-weighted portfolio of firms that issue IPOs within the previous
3 years. The portfolios are rebalanced monthly to ensure that firms that reach the end of their 3-
year period are excluded and new issues are included. Rf,t is the monthly return of 1-month US
Central Bank Borrowing Rate. Rm,t is the monthly return on the value-weighted
NYSE/NASDAQ/AMEX index. Following the same algorithm as Fama and French (1993),
SMBt (small minus big - the return on a zero investment portfolio formed by subtracting the return
on a large firm portfolio from the return on a small firm portfolio) and HMLt (high minus low - the
return on a zero investment portfolio calculated as the return on a portfolio of high book-to-market
stocks minus the return on a portfolio of low book-to-market stocks) are the difference between the
monthly returns of value-weighted portfolios of small minus big stocks and value-weighted
portfolios of high and low book-to-market stocks.
The next step involves the implementation of multivariate regression, in order to check
for explanation of cross-sectional differences of the long-run performance of the US Listed
Shipping IPOs. We have identified a number of potential factors for the short and long term
underperformance of the IPOs, however for the purposes of a study on the shipping industry,
eight of them were selected and their significance levels are going to be examined. Therefore,
the regression model is specified as follows:
8
Pt = a + β1 Size + β2Ln(1+AGE) + β3UND + β4 (MRK) + β5 (GO) + β6 (H/C) + β7 (EXC) + β8 (COUN)+
εi (9)
Where ‗SIZE‘ is the logarithm of the market capitalisation of the firm prior going public,
‗AGE‘, is the operating history of firm prior to going public (this is also employed as a proxy
for ex-ante uncertainty), UND is the Underwriters reputation getting ‗1‘ for reputable
underwriters3 and ‗0‘ for non reputable, ‘MRK‘ is the market where the US Listed Shipping
IPOs has been classified (We insert the value‗1‘ if an IPO listed in Main Market, and ‗0‘ if
listed in Secondary/Parallel/New Market). ‗GO‘ is the proportion of given ownership by the
initial shareholders, H/C describes the period of listing: IPOs listed in the Hot Period get the
value of ‗1‘ and IPOs listed in Cold Period get the value ‗0‘, ‗EXC‘ is the reputation of the stock
exchange US Listed Shipping IPOs is listed, ‗1‘ for reputable New York Stock Exchange and
‗0‘ for less reputable (AMEX, NASDAQ and OTC) and finally ‗COUN‘ is the country where
the IPOs have their headquarters.
Table 3: Distributional statistics for long run average market index adjusted returns and
aftermarket performance categorized by Gross Proceeds, Age of the Issuing Firm and Year of going public Panel A: Three-year holding period returns are calculated as [Π
756(1+ridt)-1]*100 where ridt is the daily return on stock i. For IPOs that were
delisted before the 3-year anniversary, the total return is calculated until the delisting date. The corresponding matching firm‗s total return is
calculated over the same truncated return interval. Panel B: Initial returns are computed as ripo-rmatching firm over the initial return interval. The
three year holding period return is calculated excluding the initial return. Total return includes both capital gains and dividends. Panel C: The
IPOs are categorized based on their age the year of going public. For each IPO, a non-IPO matching firm that has been CRSP-listed for at least
five years with the closest market capitalization and book-to-market ratio as the IPO is used. If this is delisted prior to the IPO return‘s ending
date, or if it conducts a follow-on stock offering, a replacement matching firm is spliced in on a point-forward basis.
Two years holding period total return Three years holding period total return in percent
Rank Initial Public
Offering (%)
Matching Firm
(%)
Initial Public
offering (%)
Matching Firm
(%)
Ritter (1991)
Panel A: Distribution of three year holding period returns
Minimum -86.67 -61.54 -81.01 -65.63 -99.02
25th percentile -29.07 -8.43 -34.91 7.29 -66.25
Median 14.69 34.73 -14.49 41.75 -16.67
75th percentile 63.64 89.12 32.83 93.51 69.59
Maximum 263.47 151.54 307.82 165.95 3,964.43
Panel B: Aftermarket performance categorized by Market Capitalization
Market Cap $ Sample Size
<200 mil 14.82 37.71 -12.03 34.13 14
201 mil – 400 mil 18.03 45.58 -2.49 42.92 20
401 mil – 800 mil 3.58 56.62 -2.50 55.79 13
> 800 mil 62.36 74.94 76.90 88.41 14
Panel C: Aftermarket performance categorized by Age of the Issuing firm
Age in Year Sample Size
0 8.86 52.45 -8.38 47.93 13
3 We consider as reputable underwriters the following five institutions: Citigroup, Goldman Sachs, JPMorgan,
Merrill Lynch and UBS.
9
1 10.31 49.58 -3.19 50.42 15
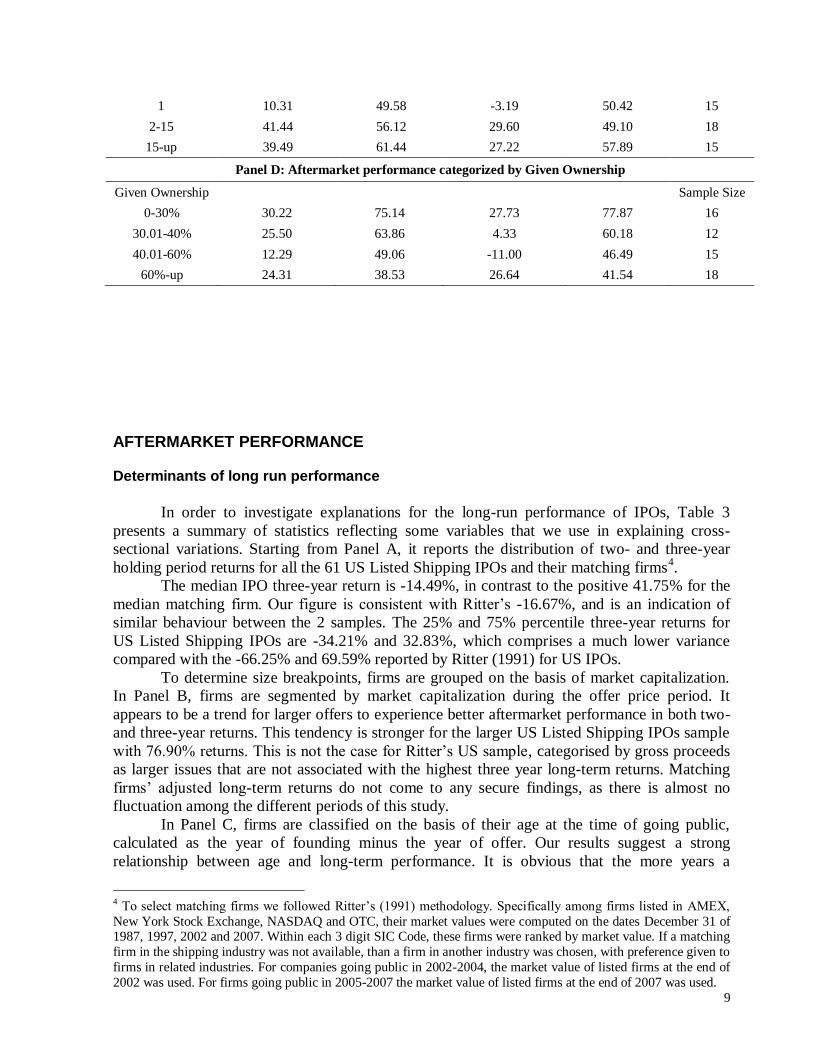
2-15 41.44 56.12 29.60 49.10 18
15-up 39.49 61.44 27.22 57.89 15
Panel D: Aftermarket performance categorized by Given Ownership
Given Ownership Sample Size
0-30% 30.22 75.14 27.73 77.87 16
30.01-40% 25.50 63.86 4.33 60.18 12
40.01-60% 12.29 49.06 -11.00 46.49 15
60%-up 24.31 38.53 26.64 41.54 18
AFTERMARKET PERFORMANCE
Determinants of long run performance
In order to investigate explanations for the long-run performance of IPOs, Table 3
presents a summary of statistics reflecting some variables that we use in explaining cross-
sectional variations. Starting from Panel A, it reports the distribution of two- and three-year
holding period returns for all the 61 US Listed Shipping IPOs and their matching firms4.
The median IPO three-year return is -14.49%, in contrast to the positive 41.75% for the
median matching firm. Our figure is consistent with Ritter‘s -16.67%, and is an indication of
similar behaviour between the 2 samples. The 25% and 75% percentile three-year returns for
US Listed Shipping IPOs are -34.21% and 32.83%, which comprises a much lower variance
compared with the -66.25% and 69.59% reported by Ritter (1991) for US IPOs.
To determine size breakpoints, firms are grouped on the basis of market capitalization.
In Panel B, firms are segmented by market capitalization during the offer price period. It
appears to be a trend for larger offers to experience better aftermarket performance in both two-
and three-year returns. This tendency is stronger for the larger US Listed Shipping IPOs sample
with 76.90% returns. This is not the case for Ritter‘s US sample, categorised by gross proceeds
as larger issues that are not associated with the highest three year long-term returns. Matching
firms‘ adjusted long-term returns do not come to any secure findings, as there is almost no
fluctuation among the different periods of this study.
In Panel C, firms are classified on the basis of their age at the time of going public,
calculated as the year of founding minus the year of offer. Our results suggest a strong
relationship between age and long-term performance. It is obvious that the more years a
4 To select matching firms we followed Ritter‘s (1991) methodology. Specifically among firms listed in AMEX,
New York Stock Exchange, NASDAQ and OTC, their market values were computed on the dates December 31 of 1987, 1997, 2002 and 2007. Within each 3 digit SIC Code, these firms were ranked by market value. If a matching
firm in the shipping industry was not available, than a firm in another industry was chosen, with preference given to
firms in related industries. For companies going public in 2002-2004, the market value of listed firms at the end of
2002 was used. For firms going public in 2005-2007 the market value of listed firms at the end of 2007 was used.

10
shipping firm is in business, the better the long-term performance it experiences. This evidence
is in line with Ritter (1991), who reports a similar trend for US IPOs. Strangely, despite the
positive three year long-term returns, US Listed Shipping firms with a history of more than 15
years before going public do not provide exceptionally high returns to its investors. Direct
comparison between Ritter‘s results and our study indicates that young US Listed Shipping
IPOs provide negative long-term returns to loyal shipping sector investors at the same time that
other young US IPOs can provide positive returns.
In Panel D, categorised IPOs are listed in US Stock Exchanges by given ownership
during the listing period. The results clearly indicate that US Listed Shipping IPOs with small
percentages of given ownership tend to reward their investors with better long-term returns.
Similarly, the case for the sample of matching firms as investing in existing firms in the stock
market with low percentage of given ownership proves to be a very good investment
opportunity. The strategy of investing in US Listed Shipping IPOs at the end of the first day of
public trading and holding them for three years would have left the investor with only 71 cents
relative to each dollar from investing in a group of matching firms.
Table 4: Buy-And-Hold Adjusted Returns for U.S. Listed Shipping IPOs: Time Period 1987-
2007
Panel A: Excess or Adjusted Returns based on the listing price
Return of Mean Return
(%)
Standard
Deviation
(%)
Number of
observations
Median
(%)
Minimum
Return
(%)
Maximum
Return
(%)
1st day 4.44*** 10.74 61 3.53 -6.94 40.81
6 months 5.18 45.46 61 3.78 -74.18 258.37
12 months 7.50 52.42 60 3.28 -74.92 189.67
24 months 7.73 61.60 58 -7.87 -100.30 160.04
36 months 3.26 81.45 53 -16.72 -138.37 324.91
Panel B: Excess or Adjusted Returns based on the first day closing price
Return of Mean Return
(%)
Standard
Deviation
(%)
Number of
observations
Median
(%)
Minimum
Return
(%)
Maximum
Return
(%)
6 months 0.58 46.10 61 -1.84 -71.00 270.57
12 months 3.35 49.87 60 -2.28 -78.50 199.88
24 months 1.13 55.21 58 -5.62 -98.93 133.08
36 months -1.69 75.42 53 -13.12 -132.47 340.88
Panel C: Excess or Adjusted Returns based on the first month closing price
Return of Mean Return
(%)
Standard
Deviation
(%)
Number of
observations
Median
(%)
Minimum
Return
(%)
Maximum
Return
(%)
6 months -0.59 32.51 61 -2.94 -79.56 113.57
12 months 2.17 57.87 60 -8.41 -78.20 235.37
24 months 5.81 61.96 58 -0.38 -101.80 194.29

11
36 months -2.53 70.71 53 -15.43 -138.37 -138.376
Panel D: Excess or Adjusted Returns based on the six months closing price
Return of Mean Return
(%)
Standard
Deviation
(%)
Number of
observations
Median
(%)
Minimum
Return
(%)
Maximum
Return
(%)
12 months 2.10 41,50 60 -7.85 -48.36 244.17
24 months 2.70 51.34 58 -9.59 -85.01 209.85
36 months 0.04 74.92 53 -20.50 -167.46 255.08
***Significance level at 1%, **Significance level at 5%, *Significance level at 10%
Table 5: Cumulative Abnormal Returns (CAR) for US Listed Shipping Initial Public Offerings,
1987-2007 Post listing long run average adjusted returns (ARt) with associated t statistics and cumulative average returns (CARt) for the 36 months (where month one represents the market index adjusted return from the last sale price on the day of listing to the end of that calendar month) after going public, excluding the initial return. Our final sample constitutes with, 61 U.S. Listed Shipping initial public offers of ordinary equity made between January 1987 and December 2007 calculated on the basis of a buy and hold strategy initiated using an equal euro investment in each issue purchased at the offer price for the issue.
Month No of firms trading ARt (%) t-stat CARt (%) t-stat
1 61 0.32 0.54 0.32 0.57
2 61 1.34 2.23 1.66 1.93
3 61 -0.30 -0.50 1.36 1.12
4 61 -0.94 -1.66 0.42 0.23
5 61 -0.61 -0.96 -0.19 -0.13
6 61 -0.27 -0.45 -0.46 -0.27
7 61 -1.22 -2.35 -1.68 -0.96
8 61 -0.84 -1.63 -2.52 -1.29
9 61 -1.41 -2.44 -3.93 -1.83
10 61 -1.26 -2.06 -5.19 -2.27
11 61 -1.71 -2.91 -6.93 -2.71
12 60 -0.92 -1.62 -7.82 -3.12
13 60 -0.26 -0.44 -8.08 -3.31
14 60 -0.42 -0.67 -8.57 -3.44
15 60 -0.76 -1.49 -9.26 -3.53
16 59 1.01 1.70 -8.25 -3.37
17 59 0.61 0.97 -7.64 -3.03
18 59 0.37 0.61 -7.27 -2.74
19 59 -0.81 -1.58 -8.08 -3.23
20 59 -0.12 -0.24 -8.20 -3.29
21 58 -1.47 -2.53 -9.67 -3.67
22 58 -0.20 -0.34 -9.87 -3.74

12
23 58 -1.13 -1.94 -11.00 -3.97
24 58 -1.09 -1.92 -12.09 -4.13
25 58 0.73 1.39 -11.36 -4.07
26 57 -0.42 -0.77 -11.78 -4.16
27 57 -1.72 -3.25 -13.50 -4.42
28 55 -1.13 -2.21 -14.63 -4.36
29 55 -0.83 -1.63 -15.46 -4.54
30 54 -1.42 -2.65 -16.88 -4.43
31 54 -1.37 -2.34 -18.25 -4.50
32 54 -0.81 -1.63 -19.06 -4.62
33 53 -1.59 -3.08 -20.65 -4.76
34 53 -1.55 -3.01 -22.20 -5.02
35 52 -1.28 -1.97 -23.48 -5.18
36 52 -1.17 -2.01 -24.65 -5.29
Summary of statistics for the buy-and-hold abnormal returns (BHARs) of IPOs
Brav and Gompers (1997) note the absence of underperformance for US IPOs.
Abnormal-return calculation was made using either the cumulative or the buy-and-hold method.
Sthele et al (2000) show that underperformance is reduced considerably when the abnormal
return estimate makes reference to size-adjusted portfolios instead of market portfolios.
Espenlaub, Gregory, and Tonks (2000) report a long-run underperformance irrespective of the
benchmark used for UK IPOs. Loughran and Ritter (2000) suggest that adopting the market
return as a benchmark causes a test bias towards no abnormal return, as the benchmark includes
these IPOs. Lyon and Barber (1999) recommend the use of the buy-and-hold abnormal return,
which, without rebalancing, accurately represents the investor experience.
Panel A of Table 4 reveals initial excess returns of 4.44%, which is one of the lowest
percentages ever experienced in an IPO study (Loughran et al 2008), and much lower than the
18.2% reported by Ritter (2008). Gounopoulos et al (2009) report that such a low level of
underpricing signals the quality of shipping industry. When value weighted, US Listed Shipping
IPOs present returns of 7.50%, 7.73%, and 3.26% for the one-, two-, and three-year holding
periods. While value weighting has little impact on the results for our sample, it substantially
reduces the extent of negative abnormal returns for domestic IPOs for the two- and three-year
holding periods.
Once the benchmark changes and we calculate the long-term returns from the first day
closing price, returns to the investors were found to be 3.35%, 1.13%, and –1.69% for the 1-, 2-,
and 3-year holding periods, respectively. The long-run BHARs reported are not statistically
different from zero indicating neither out-performance nor under-performance. The findings
indicate that US-listed shipping issues proved to be a neutral investment for buy and hold
investors, but without good long-term returns for those considering an investment at the end of
the first day of trading. We found evidence that investors who participated in the US-listed
shipping IPOs, buying stocks at the listing price or at the closing first-day price and holding
them for 3 years, obtained even short negative or positive returns because the listing prices of
IPOs were slightly higher or lower than their equilibrium prices during the 36 months of trading.
Table 5 reports the average matching firm adjusted returns (ARt) and cumulative
average matching firm adjusted returns (CAR1,t) for the 36 months after the offering date for 61
US-listed shipping IPOs. The evidence suggests that the U.S. Listed Shipping IPOs

13
underperform in the long term by -24.65%. Thirty of the 36 monthly average adjusted returns
were negative, with 10 having t-statistics lower than 2.00. The figure reported for Shipping
IPOs indicates lower level of cumulative abnormal return underperformance than the –29.13%
for the US figure reported by Ritter (1991).
Factors influencing the performance of IPOs
The literature has indicated a number of factors that may affect the performance of IPOs
in the long term. We employ eight of them based on the characteristics of US Listed Shipping
IPOs and we analyse them. Before this it is useful to indicate the expected signs for the
explanatory variables and support our hypothesis with previous studies in the area. We have to
notice that literature on long term performance relates underpricing with returns in the long
aftermarket period. Ritter (1991) finds negative relationship between initial and subsequent
returns. Rajan and Servaes (1997) argue that issues which are most overpriced and underpriced
will perform relatively poorly in the long term.
Firm Size (SIZE): the logarithm of the total market capitalisation of the firm prior going
public has been employed in this study. Many small firms want to go public to raise a capital to
finance their new investment projects and reduce their high level of debt. If the outcome of
these projects ends up with failure, this situation puts them in a more difficult position, which is
reflected in share prices. Ritter (1991) finds that US IPOs display long run underperformance,
with a tendency for the smaller offers to have the worst aftermarket performance. He also
reports that companies which have the highest mean initial returns also have the poorest long
run returns, consistent with the ‘over reaction’ hypothesis of De Bondt and Thaler ((1985) and
(1987)) or the ‘fad’ hypothesis of Aggarwal and Rivoli (1990). A positive relationship between
firm size and long term returns is also documented by Levis (1993), Jaskiewicz et. al. (2005)
and Ahmad-Zaluki et.al. (2007). A positive coefficient is expected for this variable.
History in operation (AGE): The impact of an IPO's age on the long-run performance is
examined by utilizing ‘Age’ as an explanatory variable which is measured by the difference
between the year of going public and the year of founding. Kooli and Suret (2004) support that
small firms with little or no operating history will have a great deal of uncertainty in the long
term. A positive relation is consistent with the findings of Ritter (1991).
Underwriter reputation (UND): The reputation of underwriters is another factor we used
to categorize our Shipping IPO sample. Carter et al. (1998) show positive relation between the
underwriters‘ reputation and the long-term performance of IPOs. They document that IPOs
managed by good investment banks outperform compared to the performance of IPOs managed
by investment banks that have a relatively poor reputation in the market. A positive coefficient
is expected for underwriter reputation.
Market of Listing (MRK): IPOs are classified among three markets (Main, Parallel,
New). Ritter (1991) reports that IPOs listed in the main market experience much better long
term returns. Schlag and Wodrich (2004) and Thomadakis et. al. (2009) report that IPOs traded
in the primary market yield higher returns in the long-run. We expect this to exert a positive
influence on returns.
Given Ownership (GO): The percentage of given ownership to public may signal the
quality of IPOs to investors. Lee et. al. (1996) surprisingly as they mention report that initial
levels of retained ownership have a statistically significant negative relationship with two and
three years post listing returns. Their results contradict the signalling role for retained ownership
suggested by Leland and Pyle (1977). Additionally Gale and Stinglitz (1989) report positive
relationship between retained ownership and long term returns. A negative coefficient is
expected for given ownership.

14
Market Condition (H/C): The period any Shipping IPO may decide to go public can be
characterized by specific market conditions that can be even ‗hot‘ or ‗cold‘. IPOs made under
‗hot‘ market conditions, which represents heavy interest by investors in the IPO, are expected to
yield larger returns in the first few trading days than IPOs made in a cold market. Bildik and
Kiymaz (2007) report outperformance of cold market IPOs at the end of two years holding
period while ‗cold‘ market IPOs are never subject to an underperformance problem. Those
findings are consistent with Ritter (1991) observation that long run IPO underperformance may
be dominated by a few years consistent with the ‗window of opportunities‘. We expect negative
relationship between Hot market conditions and long term returns.
Exchange of Listing (EXC): United States of America as the capital of the global
economy has the most stock exchanges than any other country in world. Among those, New
York Stock Exchange is the leading by United States dollar value of its listed company‘s
securities. We expect that IPOs listed in this leading global mature market will face better
returns in the long term. A positive coefficient is expected.
Country of Origin for the IPO (COUN): Another factor that is used to classify the
sample of IPOs in this study is the country of origin (place of headquarters) of the shipping
IPOs. This variable looks the maturity of country of origin and classifies them in developed and
emerging. Companies that go public in the U.S. from other developed markets are expected to
experience greater stability in the future, as they come from countries with well established and
strict regulatory framework. During the hot period Gajewski and Gresse (2006), report that the
underperformance spread between new (emerging) and traditional (developed) markets widens
considerably ―the performance of a portfolio invested in New Market IPOs during the years
1998-2000 is one third of the performance of an equivalent portfolio invested on traditional
segments‖. With those in mind, long term oriented investors prefer to invest in U.S. Listed
Shipping IPOs whose shares will provide stable increasing positive returns in the future. A
positive coefficient is expected for country of origin variable.
Table 6 reports the correlation matrix of variables employed as potential explanatory
variables for the cross-sectional differences in the long term performance.
. Table 6: Correlation Matrix
Variables Mean Correlation Matrix
1 2 3 4 5 6 7
1.SIZE 19.743 1.000
2.AGE 14.39 0.119 1.000
3.UND 0.459 0.290 -0.039 1.000
4.MRK 0.196 0.081 -0.484 -0.125 1.000
5.GO 48.583 -0.122 -0.025 -0.228 0.058 1.000
6.H/C 0.098 -0.111 -0.086 0.138 0.114 -0.051 1.000
7.EXC 0.573 0.294 -0.122 0.129 0.093 0.080 -0.049 1.000
8.COUN 0.442 -0.034 0.380 0.040 0.306 0.046 -0.073 0.101
REGRESSION RESULTS Book-to-market characteristics have been documented extensively as important
determinants of stock returns (Chan et al. (1991), Fama and French (1992), Lakonishok et al.

15
(1994), Loughran and Ritter (1995), Davis et al. (2000), Daniel et al. (2001), Thomadakis et al.
(2009)). In our effort to investigate possible explanations for the long-run underperformance of
IPOs, we ran a series of multiple regression models using the BHARs and FF3F as dependent
variables at 1, 2, or 3 years after going public. The regression model is given as:
BHAR or FF3F = a + β1 Size + β2Ln (1+AGE) + β3UND + β4 (MRK) + β5 (GO) + β6 (H/C) + β7 (EXC) +
β8 (COUN) + εi (10)
Cross-sectional regressions in short-run and post-listing returns, initially using BHARs
as the dependent variable, are summarized in Table 7. Column 1 reports the results using
market-adjusted initial returns as the dependent variable. The size of the US-listed shipping
IPOs was statistical significant at 10%, indicating that small IPOs offer satisfactory returns in
the short term to their investors. None of the other variables proved to be statistically significant
despite the expected sign.
Columns 2-5 report the results for long-term–oriented investors who bought US-listed
shipping IPOs at the end of the first trading day and held them for 6, 12, 24, and 36 months. The
most powerful results were obtained at 6 months (column 2), when four coefficients were
statistically significant. Specifically, a positive sign on SIZE, consistent with our hypothesis,
indicates that large firms are associated with better returns over a 6-month period. To a lesser
extent, listing in the New York Stock Exchange instead of AMEX/NASDAQ/OTC and having
the headquarters in any country outside of the United States are signals for better long term
returns. The coefficient on an underwriter‘s reputation indicates that hiring a reputable bank as
an underwriter had no discernible economic impact on underpricing in the earlier period, but
proves to be of modest economic benefit in the later period. Hence, in line with Champers and
Dimson (2009), although certification by simply having an IPO underwritten did not help
underpricing, the added benefit from hiring a prestigious bank was significant over a half-year
period. Over the 6 months, firm age (Ln (1+AGE), market of going public (MAR), given
ownership (GO), and hot and cold period of listing (H/C) are of limited economic significance.
In such a study, it is interesting to see the returns over the very long term. Column 5
explores the determinants that affect the 3-year, long-term performance. The size control
variable with previous cases remains consistently statistically significant, showing that large
US-listed shipping IPOs have very good chances of offering satisfactory returns. Further,
deciding to list in the main or secondary markets of the US Stock Exchange proves significant
regarding investors‘ returns. Listing in the main market is more beneficial to the financial
wealth of investors. Vis-à-vis is the influence of NYSE listing, because this is the only
determinant that consistently signals good returns in the future.
We reran the regressions, replacing the returns from the end of the first day with those
from the end of first month of trading; we then checked how those returns were affected by the
explanatory variables. The results over a 6-month period suggest that firm Size, AGE, MAR,
and COUN significantly affect the returns. In Size and AGE cases, the sign is according to the
hypothesis, whereas in MAR and COUN, the sign is opposite from expectations, indicating that
a secondary market listing of US shipping IPOs and their foreign origin are associated with
positive returns.
Findings on 2-year investment strategies indicate three explanatory variables: reputation of
underwriters (UND), GO, and reputation of stock exchange of listing (EXC). The influence of
an underwriter‘s reputation on investor protection is strong, because going public with a less
reputable underwriter offers better returns. Our result is in line with Beatty and Ritter (1986)
and Dunbar (2000): banks subsequently lose IPO market shares in the long term if they either
underprice or overprice. In a similar vein, Nanda and Yun (1997) report that overpricing led to a
16
decrease in the lead underwriter‘s own stock market value, whereas moderate levels of
underpricing are associated with an increase in stock market value in the long term, perhaps
indicating that underwriters can extract quid pro quo benefits from investors to whom they
allocate moderately underpriced shares.
Last, the Size of US-listed shipping IPOs and MAR are statistically significant in 3-year
periods. Large-size firms continue to be good investments because they offer good returns to
loyal investors. Thus, larger US-listed shipping IPOs have less uncertainty as compared with the
smaller IPOs, which are more speculative. Our results endorse Ljungqvist (2007): size is an
important determinant of institutional investors‘ stock selection and may thus be driving the
higher post-IPO institutional ownership.
In Table 8, the returns are measured according to the FF3F model, which is a strategy for
buying shipping IPO stock at the end of the first trading day and keeping it for the long term.
―Young‖ firms continue to offer better returns up to 1 year, main market-listed IPOs have the
advantage of being more attractive, and NYSE retains its prestige by offering better returns.
Delay in buying US-listed shipping IPOs by 1 month is mainly associated with fewer returns
because the lower percentage of given ownership at 1 year, listing in reputable NYSE at 2 years,
and age history of the shipping IPOs at 3 years are the only significant variables.

17
Table 7: Results of multiple regressions using BHAR Multivariate regression analysis of cross-sectional variation in long run market index adjusted (excess) returns subsequent to listing for 61 U.S. Listed Shipping initial public offers of ordinary equity made between
January 1987 and December 2007, calculated on the basis of an investment in each issue purchased at the closing price of first day and fir st month, for a holding period of one, two and three years for various
explanatory variables, with related t-statistics in parentheses , MAIR – Market Adjusted Initial Returns, ER1Y1D - Adjusted returns from first day price to first year after going public, ER2Y1D - Adjusted returns
from first day price to two years after going public, ER3Y1D - Adjusted returns from first day price to three years after going public, ER1Y1M - Adjusted returns from first month price to one year after going
public, ER2Y1M - Adjusted returns from first month price to two years after going public, ER3Y1M - Adjusted returns from first month price to three years after going public, , SIZE - the logarithm of the total
market capitalisation of an IPO, AGE - The operating history of the firm prior to going public. The age has been calculated as the number of years that each listing firm is in operation since its constitution before the
year of listing, UND - Underwriters reputation: ‗1‘ for reputable underwriters – five older and more experienced in underwriting tasks banking institutions – and ‗0‘ for non reputable, MAR – U.S. Listed Shipping
IPOs are classified among three markets. We insert the value‗1‘ if an IPO listed in Main Market, and ‗0‘ if listed in Seconda ry/Parallel /New Market , GO - proportion of given ownership by the pre-IPO
shareholders H/C - IPOs listed in the Hot Period get the value ‗1‘ and IPOs listed in Cold Period get the value ‗0‘, EXC – reputation of the stock exchange IPOs are listed ‗1‘ for reputable stock exchanges (NYSE,
NASDAQ and LSE) and ‗0‘ for non reputable, COUN – Country of Origin for the IPO, ‗1‘ for IPOs with headquarters in the U.S. and ‗0‘ with headquarters abroad. *** Significant at the one per cent level.
**Significant at the five per cent level *Significant at the ten per cent level, t-statistics are robust for heteroskedasticity using the Newey-West HAC Standard Errors & Covariance process
Specifications
(1)
MAIR
(2)
ER6M1D
(3)
ER1Y1D
(4)
ER2Y1D
(5)
ER3Y1D
(6)
ER6M1M
(7)
ER1Y1M
(8)
ER2Y1M
(9)
ER3Y1M
Constant 44.62 -147.67 -211.435 -54.24 -261.01 -128.47 -209.633 54.56 -201.83
SIZE -0.241 0.312 0.284 0.077 0.233 0.254 0.317 -0.021 0.238
(-1.756)* (2.490)** (1.743)* (0.469) (1.768)* (2.357)** (1.958)* (-0.131) (1.977)*
AGE 0.044 -0.048 -0.231 0.001 -0.038 0.517 -0.282 0.072 -0.073
(0.234) (-0.237) (-1.934)* (-0.004) (-0.372) (3.566)*** (-2.297)** (0.521) (-0.417)
UND 0.164 0.220 0.023 -0.236 0.072 0.125 -0.040 -0.260 -0.101
(1.213) (1.721)* (0.147) (-1.891)* (0.516) (1.035) (-0.298) (-1.977)* (-0.755)
MAR 0.192 0.108 0.370 0.164 0.310 -0.282 0.354 0.071 0.367
(1.056) (0.623) (2.318)** (1.095) (2.049)** (-2.069)** (2.302)** (0.392) (1.979)**
GO -0.022 0.123 -0.121 -0.102 -0.054 -0.069 -0.288 -0.263 -0.202
(-0.174) (1.090) (-0.888) (-0.849) (-0.388) (-0.640) (-2.518)** (-2.198)** (-1.615)
H/C 0.235 -0.085 0.157 0.283 0.087 -0.040 0.086 0.247 0.128
(1.807) (-0.913) (0.952) (1.973)* (0.759) (-0.449) (0.687) (1.457) (1.080)
EXC -0.125 0.216 0.177 0.314 0.237 0.137 0.090 0.272 0.110
(-0.913) (1.968)* (1.784)* (2.976)*** (2.344)** (1.181) (0.790) (2.208)** (0.919)
COUN 0.113 -0.230 -0.112 0.035 -0.159 -0.221 -0.059 0.015 0.004
(0.835) (-1.960)* (-0.987)* (0.273) (-1.324) (-1.967)* (-0.587) (0.112) (0.027)
Adj. R2 0.119 0.230 0.186 0.134 0.153 0.202 0.174 0.088 0.131
No. of IPOs 61 61 61 61 61 61 61 61 61
F-statistic 2.015 3.25 2.61 2.11 2.27 2.90 2.48 1.65 2.06

18
Table 8: Results of multiple regressions using FF3F abnormal returns
Multivariate regression analysis of cross-sectional variation in long run for the Fama and French (FF) three factor model Rpt-Rft=αi+βi(Rmt-Rft)+γiSMBt+δiHMLt+εpt subsequent to listing, 61 U.S. Listed Shipping initial public offers of ordinary equity made between January 1987 and December 2007 calculated on the basis of an investment in each issue purchased at the closing price of first day and first month, for a holding period of one, two and three years for various explanatory variables, with related t-statistics in parentheses, MAIR – Market
Adjusted Initial Returns, ER1Y1D - Adjusted returns from first day price to first year after going public, ER2Y1D - Adjusted returns from first day price to two years after going public, ER3Y1D - Adjusted returns from first day price to three years after going public, ER1Y1M - Adjusted returns from first month price to one year after going public, ER2Y1M - Adjusted returns from first month price to two years after going public, ER3Y1M - Adjusted returns from first month price to three years after going public, SIZE - the logarithm of the total market capitalisation of an IPO, AGE - The age of the issuing firm. The age has been calculated as the number of years that each listing firm is in operation since its constitution before the year of listing, UND - Underwriters reputation: ‗1‘ for reputable underwriters – five older and more experienced in underwriting tasks banking institutions – and ‗0‘ for non reputable, MAR – U.S. Listed Shipping IPOs are classified among three markets. We insert the value‗1‘ if an IPO listed in Main Market, and ‗0‘ if listed in Secondary/Parallel /New Market , GO -
proportion of given ownership by the pre-IPO shareholders H/C - IPOs listed in the Hot Period get the value ‗1‘ and IPOs listed in Cold Period get the value ‗0‘, EXC – reputation of the stock exchange IPOs are listed ‗1‘ for reputable stock exchanges (NYSE, NASDAQ and LSE) and ‗0‘ for non reputable, COUN – country of Origin for the IPO, ‗1‘ for IPOs with headquarters in the U.S. and ‗0‘ with headquarters abroad. *** Significant at the one per cent level. **Significant at the five per cent level *Significant at the ten per cent level, t-statistics are robust for heteroskedasticity using the Newey-West HAC Standard Errors & Covariance process
Specifications
(1)
ER1Y1D
(2)
ER2Y1D
(3)
ER3Y1D
(4)
ER1Y1M
(5)
ER2Y1M
(6)
ER3Y1M
Constant -159.27 2.51 -217.50 -44.30 189.29 -83.92
SIZE 0.218 0.011 0.188 0.120 -0.231 0.085
(1.360) (0.066) (1.517) (0.783) (-1.099) (0.792)
AGE -0.267 -0.024 -0.063 -0.023 0.182 0.468
(-2.423)** (-0.218) (-0.576) (-0.078) (1.184) (2.939)***
UND 0.098 -0.157 0.090 -0.159 -0.166 -0.177
(0.693) (-1.250) (0.651) (-0.998) (-1.304) (-1.424)
MAR 0.474 0.289 0.394 0.222 0.118 0.107
(3.093)*** (1.801)* (2.459)** (0.783) (0.614) (0.550)
GO -0.179 -0.139 -0.108 -0.321 -0.158 -0.107
(-1.464) (-1.213) (-0.843) (-2.148)** (-1.250) (-0.627)
H/C 0.143 0.294 0.075 0.155 0.195 0.131
(0.813) (1.681)* (0.626) (0.834) (1.267) (1.382)
EXC 0.224 0.259 0.245 0.130 0.217 -0.020
(2.261)** (2.209)** (2.198)** (1.082) (1.864)* (-0.179)
COUN -0.183 -0.004 -0.203 0.007 0.032 -0.046
(-1.647) (-0.026) (-1.517) (0.056) (0.228) (-0.351)
Adj. R2 0.289 0.150 0.196 0.075 0.075 0.228
No. of IPOs 61 61 61 61 61 61
F-statistic 3.80 2.17 2.65 1.56 1.55 2.92

19
CONCLUSION This study has focused on the performance of US Listed Shipping IPOs in stock
exchanges after the decision by management to enter the free market in order to raise funds
and fulfil their investment plans. In a sample of 61 shipping IPOs between 1987 and 2007,
we find that the average initial return on the first trading day is 4.44%. The low initial
return on the first day of trading may be due to the long-sightedness of investors, who are
able to fully grasp the extent to which IPO firms will accomplish their proposed investment
strategies. This ability does not unfold in the long term as US Listed Shipping IPOs neither
outperform nor under-perform when we use BHAR as a benchmark in the 12, 24, and 36
months holding periods. On average, the shipping IPOs were offering returns of 7.50%,
7.73%, and 3.26%, to buy and hold investors after one, two, and three years of listing
respectively. It should be noted, however, that use of CAR methodology reveals
economical and statistical underperformance of IPOs in the long term.
Recognizing that long-term IPO performance varies over time and across various
determinants, we considered four different periods and several control variables to test for
those effects. Results indicate a positive relationship between large US Listed Shipping
IPOs and long-term returns, as well as the positive relationship between IPOs launched in
the market after a long operation history and their long run returns up to a six months
period. Long-term returns become negative if the period is expanded to a year. Findings
show that long run underperformance is less severe for IPO stocks associated with less-
prestigious underwriters. This opposes Michaely and Shaw (1994) & Carter et. al. (1998),
who find that IPOs managed by highly prestigious investment bankers tend to have less
negative long run returns than do IPOs handled by underwriters with less-esteemed
reputations. Listing in the major global stock exchange, the NYSE, is a positive signal for
investors to participate in US Shipping Listing IPOs and significantly affects their returns
in a three year period. In total, the results of the multivariate regressions concerning long
run IPO performance revealed six statistically significant variables.
IPOs‘ performance for the hot period of 2002-2007 was supported by robust stock
price returns of the listed shipping companies. However, recent global crises have shown
significant and dramatic downward price adjustments. Investors are cautious with shipping
stocks, as some issuers appear to have an overvalued ship portfolio that is unmatched by
respective charter cover. Furthermore, shipping stock market performance remains directly
subject to freight market volatility (Syriopoulos (2007). It is questionable how long it will
take until shipping stocks become as attractive as they once were, and how long it will take
until the market experiences the next wave of shipping IPOs.
An increased understanding of shipping IPOs‘ performance will improve if further
studies that focus on the accuracy of earning forecasts are implemented. Specifically, firms
making initial public offerings in the United States often include a forecast of the next
year‘s earnings in the new issue prospectus. This forecast is used by investors to help them
value the company, as well as to decide whether to subscribe to the new issue and whether
to invest on the first day of trading (Chen et al (2001). The accuracy of the forecast is
crucial if the forecast is to be a credible signal. A study ought to be produced using a
number of error metrics to examine forecast accuracy of the shipping sector.
Finally, it would be interesting to provide an explanation for the positive buy and
hold returns that US Listed Shipping IPOs experience, even for a period of up to three years
after listing. At a first glance this appears to be a puzzle, as there has been no study to
provide similar evidence in the past. This trend can be explained using the unique
characteristics of the shipping industry as sophistication, innovation, and complexity. This
is due to a number of critical factors, including the derived nature of the demand for
shipping services (which is sensitive to economic growth), the idiosyncratic characteristics
of the shipping industry, and the cyclicality of freight rates and vessel prices.

20
REFERENCES Aggarwal, R., and P. Rivoli, 1990, Fads in the IPO market?, Financial Management 22, 42-
53. Ahmad-Zaluki, N. , K. Campbell, and A. Goodacre, 2007, The long run share price
performance of Malaysian Initial Public Offerings, Journal of Business Finance and Accounting 34, 78.
Beatty, R., and J. Ritter, 1986, Investment banking, reputation, and the underpricing of initial public offerings, Journal of Financial Economics 15, 213-232.
Bildik, R., and M. Yilmaz, 2007, The market performance of Initial Public Offerings in the Istanbul Stock Exchange, Working paper, Istanbul Stock Exchange.
Brav, A., C. Geczy, and P. Gompers, 2000, Is the abnormal return following equity
issuances anomalous?, Journal of Financial Economics 56, 209-249. Brav, A., and P. Gompers, 1997, Myth or reality? The long run underperformance of Initial
Public Offerings: Evidence from Venture and Non Venture Capital Backed Companies, Journal of Finance 32, 1791-1821.
Carter, R., F. Dark, and A. Singh, 1998, Underwriter reputation, initial returns, and the long-run performance of IPO stocks, The Journal of Finance.
Chahine, S., 2008, Underpricing Versus Gross Spreads: New Evidence on the Effects of Sold Shares at the Time of IPOs,, Journal of Multinational Financial Management 18, 180-196.
Champers, D., and E. Dimson, 2009, IPO Underpricing over the Very Long Run, Journal of Finance, forthcoming 64, 1407-1443.
Chan, L., Y. Hamao, and J. Lakonishok, 1991, Fundamentals and stock returns in Japan., Journal of Finance 37, 389-417.
Chen, G., M. Firth, and G. Krishnan, 2001, Earnings forecast errors in IPO prospectuses and their associations with initial stock returns, Journal of Multinational Financial Management 11, 225-240.
Cheng, Y., 2005, Post-listing underperformance: Is it really bad to move trading locations?, Journal of Corporate Finance.
Cullinane, K. , and X. Gong, 2002, The mispricing of transportation initial public offerings
in the Chinese mainland and Hong Kong, Journal of Maritime Policy & Management 29, 1464-5254.
Daniel, K., S. Titman, and K.C. Wei, 2001, Explaining the cross-section of stock returns in Japan: factors or characteristics?, Journal of Finance 56, 743-766.
Davis, J., E. Fama, and K. French, 2000, Characteristics, covariances, and average returns: 1929-1997, Journal of Finance 55, 389-406.
De Bondt, W., and R. Thaler, 1985, Does stock market overreact, Journal of Finance 40, 793-805.
De Bondt, W., and R. Thaler, 1987, Further evidence on investor ovverreaction and stock
market seasonality, Journal of Finance 42, 557-581. Dunbar, C., 2000, Factors affecting investment bank initial public offering market share,
Journal of Financial Economics 55, 3-41. Espenlaub, S., A. Gregory, and I. Tonks, 2000, Re-assessing the long-term
underperformance of UK Initial Public Offerings, European Financial Management. Fama, E., and K. French, 1992, The cross section of expected stock returns, Journal of
Finance 47, 427-465. Fama, E., and K. French, 1993, Common risk factors in the returns on bonds and stocks,
Journal of Financial Economics 33, 3-56.
Fama, E., and K. French, 1995, Size and book to market factors in earning and return, Journal of Finance 50, 131-155.
Fama, E., and K. French, 1996a, Multifactor explanations of asset pricing anomalies, Journal of Finance 51, 55-84.
Franzke, S., and C. Schlag, 2004, Over-Allotment Options in IPOs on Germany’s Neuer Markt– An Empirical Investigation., CFS Working Paper Series.
Gajewski, J. F., and C. Gresse, 2006, A Survey of the European IPO Market, ECMI Paper. Gale, I., and J. Stiglitz, 1989, The information content of initial public offerings, Journal of
Finance 44, 469-477. Gompers, P., and J. Lerner, 2003, The really long-term performance of initial public
offerings: The pre-Nasqad evidence, Journal of Finance 58.

21
Gounopoulos, D, C. Nounis, and A. Merikas, 2009, Global Shipping IPOs Performance, Journal of Maritime Policy & Management 36,
Grammenos, C., and A. Arkoulis, 1999, The Long Run Performance of Shipping Initial Public Offerings, International Journal of Maritime Economics 71-93.
Grammenos, C., and S. Marcoulis, 1996. Shipping Initial Public Offerings: A Cross Country
Analysis (Elsevier - North Holland,, London). Jaskiewicz, P. , V. Gonzαlez, S. Menιndez, and D. Schiereck, 2005, Long-Run IPO
performance analysis of German and Spanish family-owned businesses, Family Business Review 18.
Kooli, M., and J. Suret, 2004, The aftermarket performance of Initial Public Offerings in Canada, Journal of Multinational Financial Management 14, 47-66.
Lakonishok, J., A. Shleifer, and R. Vishny, 1994, Contrarian investment, extrapolation, and risk., Journal of Finance 49.
Lee, P.., Stephen L. Taylor, and Terry S. Walter, 1996, Australian IPO pricing in the short and long-run, Journal of Banking & Finance 20, 1189-1210.
Leland, H., and D. Pyle, 1977, Information Asymmetry, financial structure and financial structure intermediaries, Journal of Finance 32, 317-387.
Levis, M., 1993, The long-run performance of IPOs: The UK experience 1980-1988, Financial Management 22, 28-41.
Ljungqvist, A., 2007, IPO underpricing, in B. Eckbo, ed.: Handbook of Corporate Finance: Empirical Corporate Finance (Elsevier Amsterdam).
Loughran, T., 1993, NYSE vs NASDAQ returns:/ Market microstructure or the poor performance of initial public offerings?, Journal of Financial Economics 33, 241-260.
Loughran, T., and J. Ritter, 1995, The new issues puzzle, Journal of Finance 50, 23-51.
Loughran, T., and J. Ritter, 2000, Uniformly least powerful tests of market efficiency, Journal of Financial Economics 55, 361-389.
Loughran, T., J. Ritter, and K. Rydqvist, 1995, Initial public offerings: International insights, Pacific-Basin Finance Journal 2, 165-199.
Loughran, T., J. Ritter, and K. Rydqvist, 2008, Initial public offerings: International insights, Pacific-Basin Finance Journal 2, 165-199.
Lyon, J., B. Barber, and C. Tsai, 1999, Improved methods for tests of Long-run abnormal stock returns, Journal of Finance 54, 165-201.
Mazouz, K., B. Saadouni, and Y. Shuxing, 2008, The long-term performance of Hong Kong
share-only and unit initial public offerings (IPOs), Journal of Multinational Financial Management 18, 209-228.
Michaely, R., and Wayne H. Shaw, 1994, The pricing of initial public offerings: Tests of adverse selection and signaling theories, Review of Financial Studies 7, 279-319.
Nanda, V., and Y. Yun, 1997, Reputation and financial intermediation: An empirical investigation of the impact of IPO mis-pricing or underwriter market value, Journal of Financial Intermediation 6, 39-63.
Rajan, F., and H. Sarvaes, 1997, Analyst following of initial public offering, Journal of Finance 52, 507-529.
Ritter, J., 1991, The long performance of Initial Public Offerings, Journal of Finance 46, 3-
28. Ritter, J., 2009, Some Factoids About the 2008 IPO Market, Continuously Working Paper. Sthele, R., O. Ehrhardt, and R. Przyborowsky, 2000, Long-run stock performance of
German initial public offerings and seasoned equity issues, European Financial Management 6, 173-196.
Syriopoulos, T., 2007, Financing Greek shipping modern instruments methods and markets, Research in Transportation Economics 21, 171-291.
Thomadakis, S., D. Gounopoulos, and C. Nounis, 2009, The long term performance of Initial Public Offerings in the Athens Stock Exchange (1994-2002), European
Financial Management, under review. Welch, I., and J. Ritter, 2002, A review of IPO activities, pricing and allocation, Journal of
Finance 57, 1795-1828.


