
MAPIE vs MAP in patients with a Poor Response to pre-operative chemotherapy for newly-diagnosed osteosarcoma:
Results from EURAMOS-1
CTOS 2014, Berlin17-Oct-2014
Neyssa Marina, Sigbjørn Smeland, Stefan S Bielack, Mark Bernstein, Gordana Jovic,Jane M Hook, Mark D Krailo, Trüde Butterfass-Bahloul, Thomas Kühne, Mikael Eriksson,Lisa Teot, Hans Gelderblom, Leo Kager, Kirsten Sundby Hall, Richard Gorlick, R. Lor Randall, Pancras W Hogendoorn , Gabriele Calaminus, Matthew R Sydes, Jeremy S Whelanon behalf of the EURAMOS-1 investigators
E UROPEANO STEOSARCOMAI NTERGROUP
Abstract ID: 2055690

Design and eligibility
Biopsy-proven diagnosis of resectable osteosarcoma
REGISTER
MAP (induction)
Surgery
Histological response assessment
Poor Good
RANDOMIZE RANDOMIZE
MAP MAPIE MAP MAPifn
Registration
• Resectable high-grade osteosarcoma
• Extremity or axial
• Localized or metastatic
• Age ≤40yr
• No pretreatment for osteosarcoma
• No previous chemo for any disease
• No contraindication to treatment
• Registration & chemo ≤30day after biopsy
• Written informed consent

Design
Primary tumor
resectionRAP MM
IE M
A MM
wk 1-10 wk 11
wk 12-40
Ai M
wk 12-29
x2
AP MM A MMAP MM
AP MM IE M AP MM IE M Ai MM
MAPIE
MAP
Induction MAP
Eligibility for randomisation• Poor histological response to induction MAP
≥10% viable tumor in resected specimen
• Complete resection of primary tumor
• No progression
• Recovered from prior therapy
Poor Response
Dosing
M Methotrexate 12gm/m2
A Doxorubicin 75mg/m2
P Cisplatin 120mg/m2
I Ifosfamide 14g/m2
i ifosfamide 9g/m2
E Etoposide 500mg/m2

Outcome measures
• Primary
Event-free survival (EFS)• Local recurrence• Progression of existing metastases• New metastatic disease• Secondary malignancy• Death
• Secondary includeOverall survival (OS)Short & long-term toxicityQuality of life

Sample sizeAssumptions• 3yr EFS 45% (MAP) 55% (MAPIE)• Target HR = 0.75• Power 80%• Type I error 0.05
Targets• ≥ 378 EFS events• 693 Poor Response randomizations over 5 years ~ 2000 registrations
Randomisation• Permuted blocks• Stratification factors: data center, metastases status, site and
location of tumor on bone

Analyses• Treatment effect estimated with
1. Hazard Ratio (HR) from adjusted Cox model • Proportionality of hazards tested
Hazards not proportional
2. Restricted Mean Survival Time (RMST)• RMST measures average time event-free
up to a specified time point 5 yearsi.e. area under the curve

Rationale for releasing data now
• Analysis planned at ≥378 EFS events
• Fewer poor responders randomised (618/693)• Event rate is lower than predicted• Results unlikely to change in near future
• IDMC recommended early release and dissemination– After routine review of the data (Jun-2014)– Data released by the Trial Steering Committee
• Analysis includes 300 EFS events (median FU 4.5y)

Recruitment: Apr2005 – Nov2011
Registration2260
Confirmed Poor Responder
1059
Randomized 618
MAP310
MAPIE 308
1201 Not Poor Responder 1041 Confirmed Good Response 160 Response not reported
441 Not Randomized 208 (47%) Non-consent 102 (23%) Progression (local or distant) 51 (12%) Histology reported outside trial timelines 44 (10%) Not 2 cycles induction MAP 17 ( 4%) Other 15 ( 4%) No removal of mets/unresectable disease 4 ( 1%) Reason missing 1 (<1%) Good responder, entered PR rand (MAP)
COG; 313
COSS; 157
EOI; 115
SSG; 33
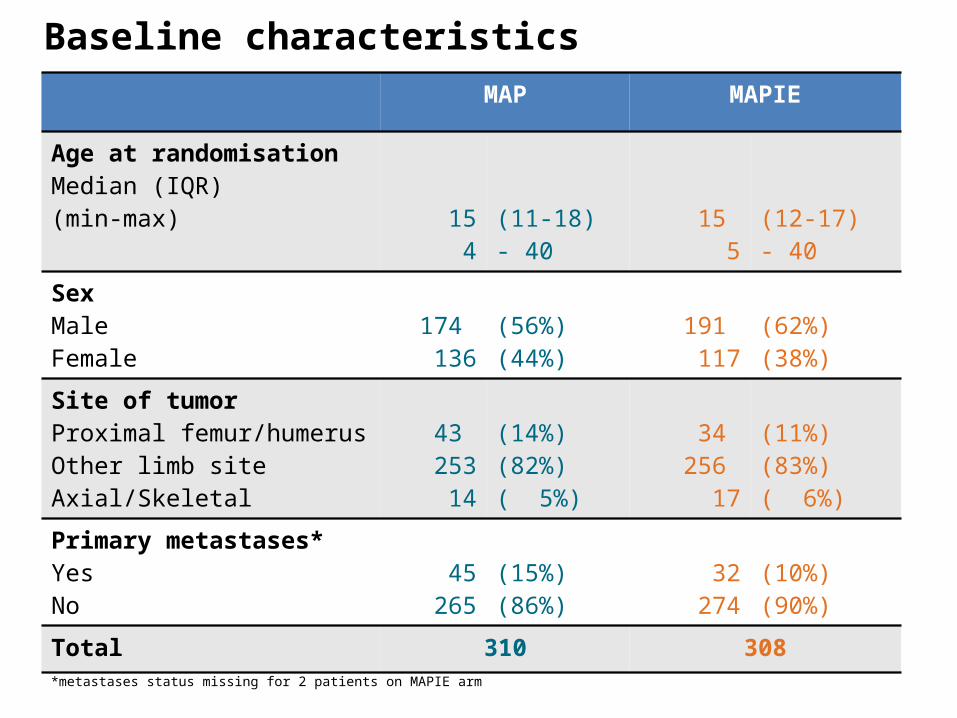
Baseline characteristicsMAP MAPIE
Age at randomisationMedian (IQR)(min-max) 15
4(11-18)- 40
15 5
(12-17)- 40
SexMaleFemale
174 136
(56%)(44%)
191 117
(62%)(38%)
Site of tumorProximal femur/humerusOther limb siteAxial/Skeletal
43 253
14
(14%)(82%)( 5%)
34 256
17
(11%)(83%)( 6%)
Primary metastases*YesNo
45265
(15%)(86%)
32274
(10%)(90%)
Total 310 308
*metastases status missing for 2 patients on MAPIE arm
Cumulative standardised dose
Median (IQR)Target MAP MAPIE
Number of courses
% Received targetTarget MAP MAPIE
M methotrexate (g/m2)
96 8
A doxorubicin (mg/m2)
300 4
P cisplatin (mg/m2)
240 2
I ifosfamide 14g(g/m2)
52 3
i ifosfamide 9g(g/m2)
18 2
E etoposide(g/m2)
1.5 3
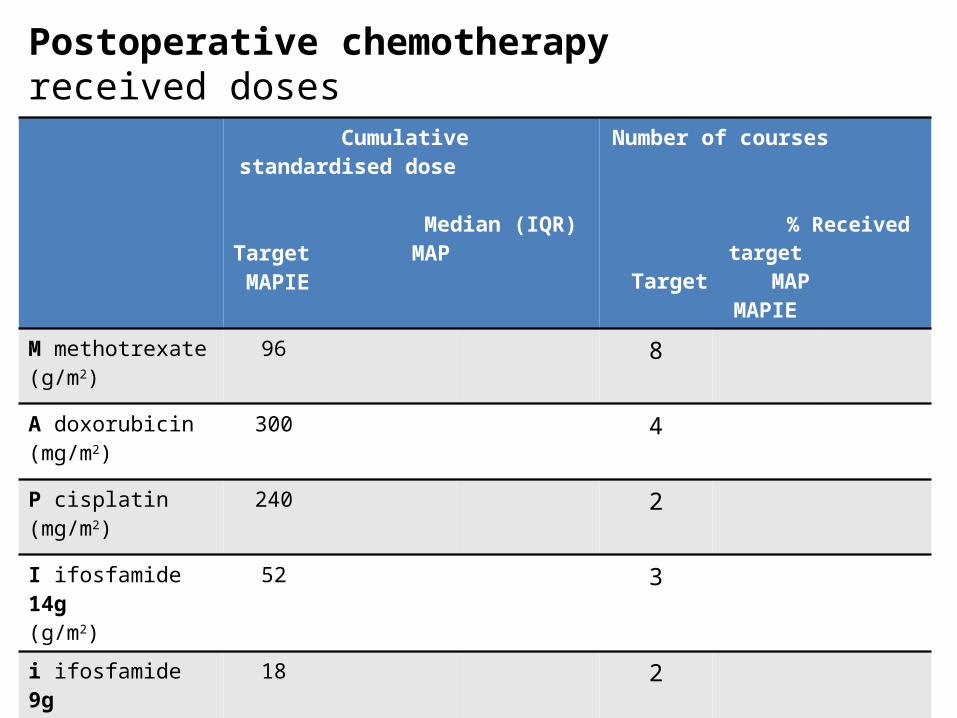
Postoperative chemotherapyreceived doses

Cumulative standardised dose
Median (IQR)Target MAP MAPIE
Number of courses
% Received targetTarget MAP MAPIE
M methotrexate (g/m2)
96 94 (80-97)
88(68-97)
8
A doxorubicin (mg/m2)
300 296 (284-303)
299(233-305)
4
P cisplatin (mg/m2)
240 239(235-241)
240(230-244)
2
I ifosfamide 14g(g/m2)
52 n/a 41 (27-42)
3
i ifosfamide 9g(g/m2)
18 n/a 17 (9-18)
2
E etoposide(g/m2)
1.5 n/a 1.5 (1.0-1.5)
3
Postoperative chemotherapyreceived doses

Cumulative standardised dose
Median (IQR)Target MAP MAPIE
Number of courses
% Received targetTarget MAP MAPIE
M methotrexate (g/m2)
96 94 (80-97)
88(68-97)
8 73% 58%
A doxorubicin (mg/m2)
300 296 (284-303)
299(233-305)
4 83% 78%
P cisplatin (mg/m2)
240 239(235-241)
240(230-244)
2 92% 84%
I ifosfamide 14g(g/m2)
52 n/a 41 (27-42)
3 n/a 74%
i ifosfamide 9g(g/m2)
18 n/a 17 (9-18)
2 n/a 64%
E etoposide(g/m2)
1.5 n/a 1.5 (1-1.5)
3 n/a 75%
Postoperative chemotherapyreceived doses

Worst postoperative toxicity
*neutrophils and platelets excluded
Worst toxicityGrade 3
MAPGrade 4 Grade 5 Grade 3
MAPIEGrade 4 Grade 5
Worst non-haem* postoperative
177(59%)
59(20%)
1(<1%)
172(58%)
88(30%)
1(<1%)
Overall 237 / 300 (79%) 261 / 297 (88%)
Fisher’s test p=0.004
Worst toxicity(includes all toxicities)
Grade 3MAP
Grade 4 Grade 5 Grade 3MAPIE
Grade 4 Grade 5
Worst postoperativetoxicity
26 (9%) 259(86%)
1(<1%)
20(7%)
259(87%)
1(<1%)
Overall 286 / 300 (95%) 280 / 297 (94%)
Fisher’s test p=0.585
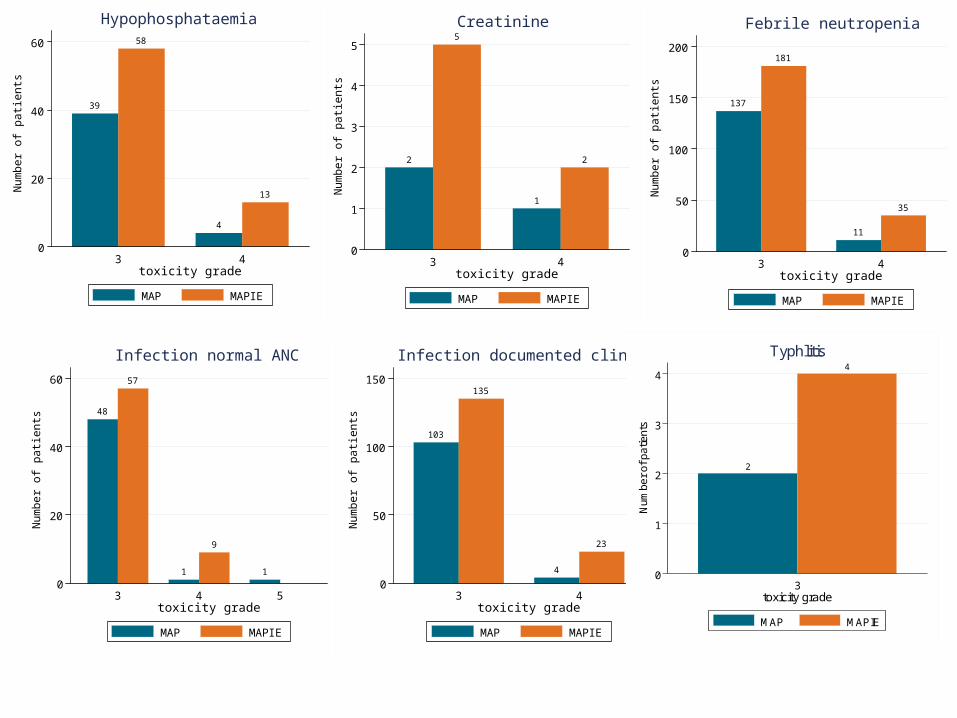
137
181
11
35
0
50
100
150
200
Num
ber
of
patients
3 4toxicity grade
Febrile neutropenia
MAP MAPIE
48
57
1
9
1
0
20
40
60
Num
ber
of
patients
3 4 5toxicity grade
Infection normal ANC
MAP MAPIE
103
135
4
23
0
50
100
150
Num
ber
of
patients
3 4toxicity grade
Infection documented clinically
MAP MAPIE
39
58
4
13
0
20
40
60
Num
ber
of
patients
3 4toxicity grade
Hypophosphataemia
MAP MAPIE
2
5
1
2
0
1
2
3
4
5
Num
ber
of
patients
3 4toxicity grade
Creatinine
MAP MAPIE
2
4
0
1
2
3
4
Nu
mb
er
of
pa
tient
s
3toxicity grade
Typhlitis
MAP MAPIE

Secondary malignancies (SMN)
MAP (310 pts)
MAPIE (308 pts)
Number of SMNs 2 (0.6%) Between 7 (2.3%) and 9 (2.9%)
TypesAcute Myeloid LeukaemiaAcute Monocytic LeukaemiaMDS
1-1
412
Additional reports under review* 2
• Higher rate of SMNs expected with MAPIE (vs. MAP)• Expected rate with MAPIE: <5%• Observed SMNs with MAPIE arm: 2.3% (95%CI 0.9%-4.6%) potentially 2.9% (95%CI 1.3%-5.5%)
• These are preliminary data; cleaning is ongoing. Additional 2 events reported as SMN, without any other information.
0.00
0.25
0.50
0.75
1.00
307 245(53) 181(57) 124(30) 88(7) 52(2) 22(3) 8(0) 0(0)MAPIE308 225(81) 175(45) 133(12) 95(5) 64(3) 28(2) 8(0) 0(0)MAP
0 12 24 36 48 60 72 84 96months
MAP MAPIE
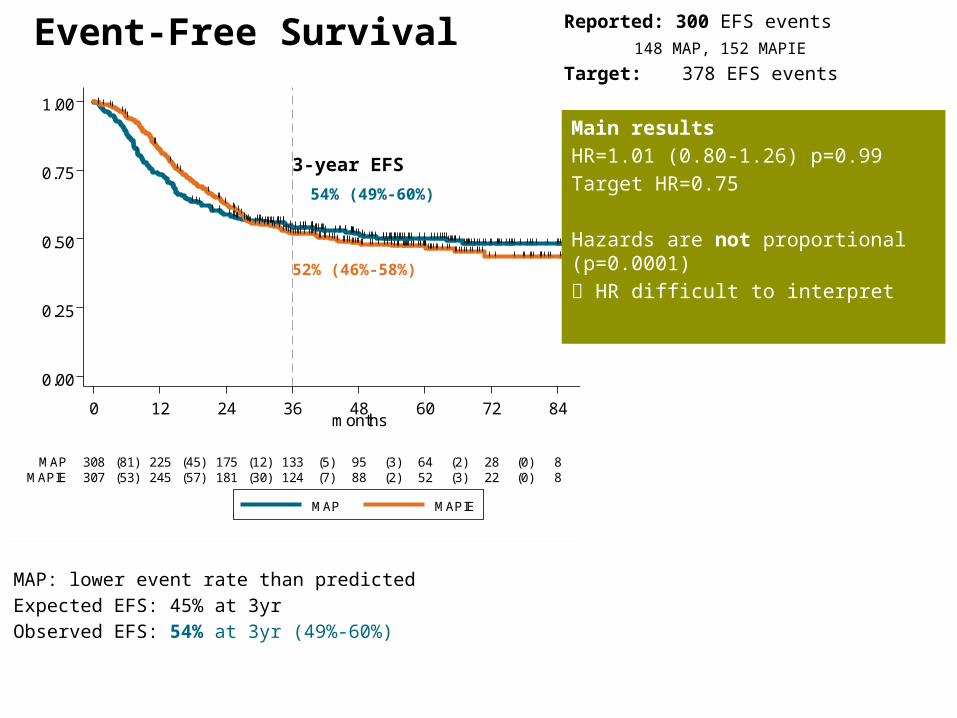
Event-Free Survival
54% (49%-60%)
52% (46%-58%)
Main resultsHR=1.01 (0.80-1.26) p=0.99Target HR=0.75
Hazards are not proportional (p=0.0001) HR difficult to interpret
MAP: lower event rate than predicted Expected EFS: 45% at 3yrObserved EFS: 54% at 3yr (49%-60%)
3-year EFS
Reported: 300 EFS events 148 MAP, 152 MAPIE
Target: 378 EFS events

0.00
0.25
0.50
0.75
1.00
307 245(53) 181(57) 124(30) 88(7) 52(2) 22(3) 8(0) 0(0)MAPIE308 225(81) 175(45) 133(12) 95(5) 64(3) 28(2) 8(0) 0(0)MAP
0 12 24 36 48 60 72 84 96months
MAP MAPIE
Event-Free Survival
54% (49%-60%)
52% (46%-58%)
RMST To 5yr 95%CI
MAP 37.5m 34.9 to 40.1MAPIE 38.1m 35.6 to 40.5
Diff. 0.6m -3.1 to 4.4 P = 0.738
MAP: lower event rate than predicted Expected EFS: 45% at 3yrObserved EFS: 54% at 3yr (49%-60%)
3-year EFS
Reported: 300 EFS events 148 MAP, 152 MAPIE
Target: 378 EFS events
No difference
MAPIE increases average EFS time by 0.6 months (p=0.738)
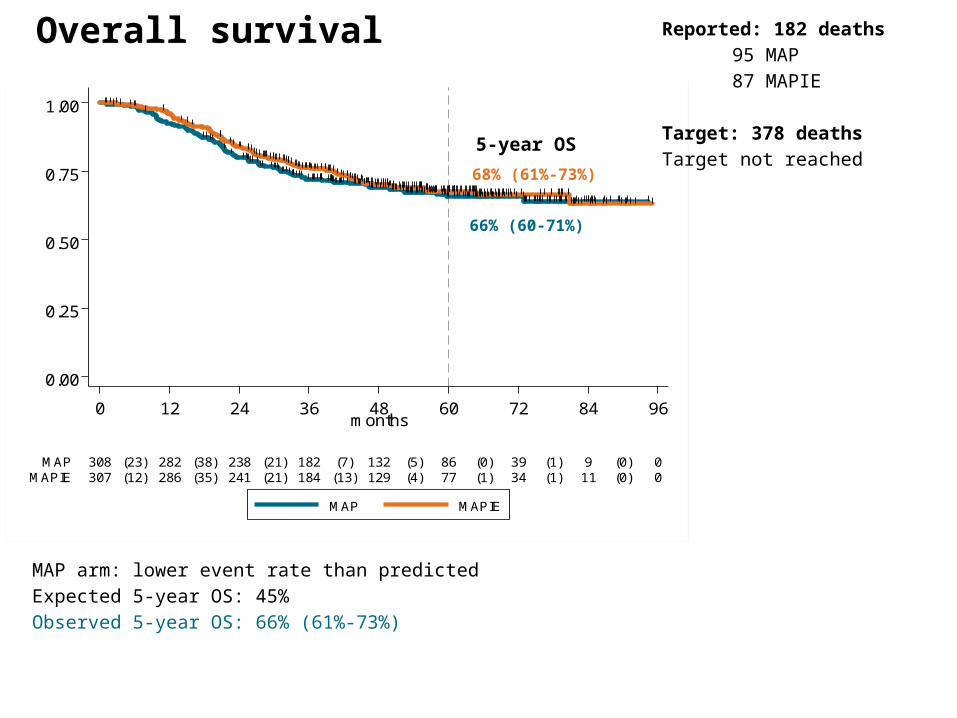
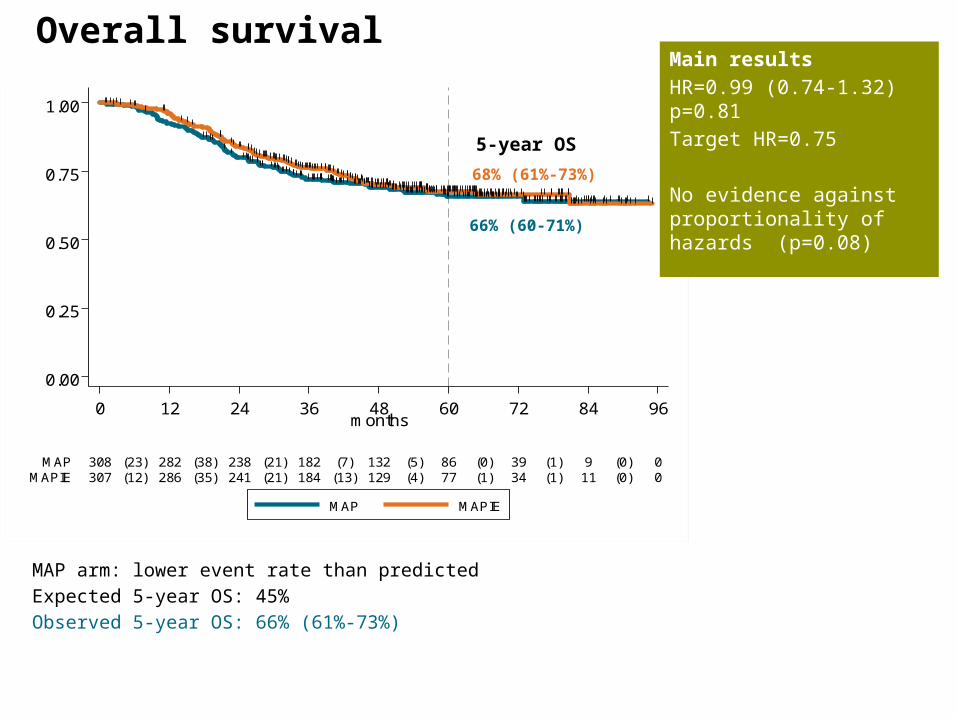
Overall survival
MAP arm: lower event rate than predictedExpected 5-year OS: 45%Observed 5-year OS: 66% (61%-73%)
0.00
0.25
0.50
0.75
1.00
307 286(12) 241(35) 184(21) 129(13) 77(4) 34(1) 11(1) 0(0)MAPIE308 282(23) 238(38) 182(21) 132(7) 86(5) 39(0) 9(1) 0(0)MAP
0 12 24 36 48 60 72 84 96months
MAP MAPIE
66% (60-71%)
68% (61%-73%)
5-year OS
Reported: 182 deaths 95 MAP 87 MAPIE
Target: 378 deathsTarget not reached
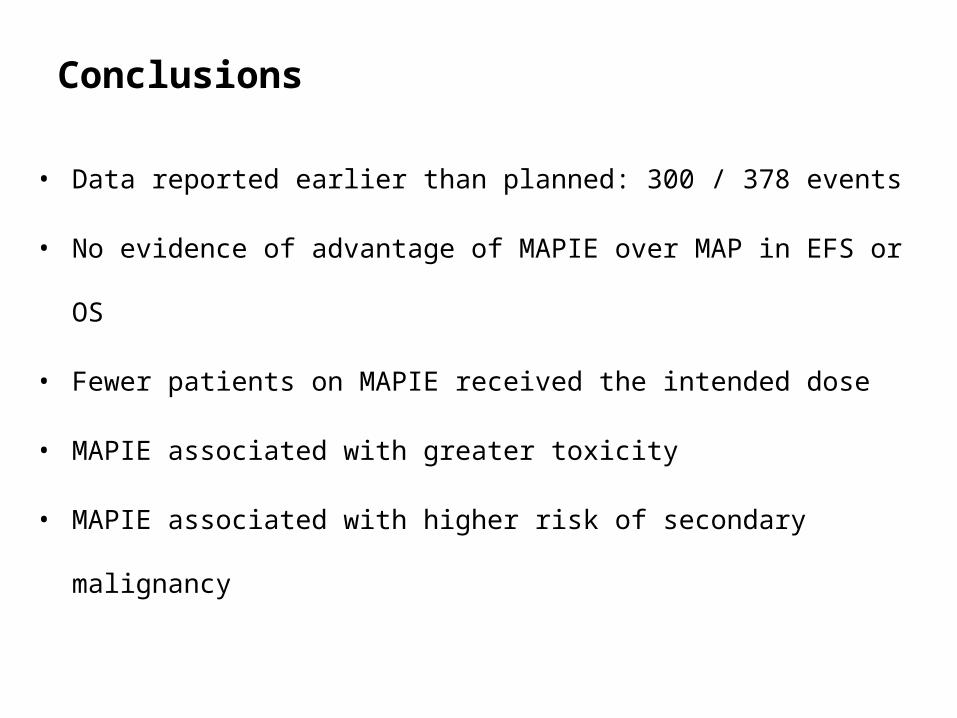
Conclusions
• Data reported earlier than planned: 300 / 378 events
• No evidence of advantage of MAPIE over MAP in EFS or OS
• Fewer patients on MAPIE received the intended dose
• MAPIE associated with greater toxicity
• MAPIE associated with higher risk of secondary malignancy

• Investigators & research staff at all 326 trial sites & data centers
• National co-ordinating investigators– N Marina, M Bernstein, S Bielack, L Kager, Z Papai, T Kühne, J Starý, J Whelan, C Dhooge,
M Capra, H Gelderblom, S Smeland, M Ericcson, O Johansson, M Tarkkanen, O Nielsen
• Members of the IDMC, TSC, TMG and trial advisory panels
• Funding bodies– National Cancer Institute, USA ; European Science Foundation (ESF) under the EUROCORES Program
European Clinical Trials (ECT), through contract No. ERASCT-2003-980409 of the European
Commission, DG Research, FP6 (Ref No MM/NG/EMRC/0202); Fonds National de la Recherche
Scientifique & Fonds voor Wetenschappelijk Onderzoek-Vlaanderen; Danish Medical Research Council;
Academy of Finland; Deutsche Forschungsgemeinschaft; Deutsche Krebshilfe; Federal Ministry of
Education and Research, Germany, BMBF 01KN1105; Semmelweis Foundation; Netherlands Council for
Medical Research; Research Council of Norway; Scandinavian Sarcoma Group; Swiss Paediatric
Oncology Group; Cancer Research UK, CRUK/05/013; UK Medical Research Council
• All patients who participated in EURAMOS-1
Acknowledgments
www.euramos.org
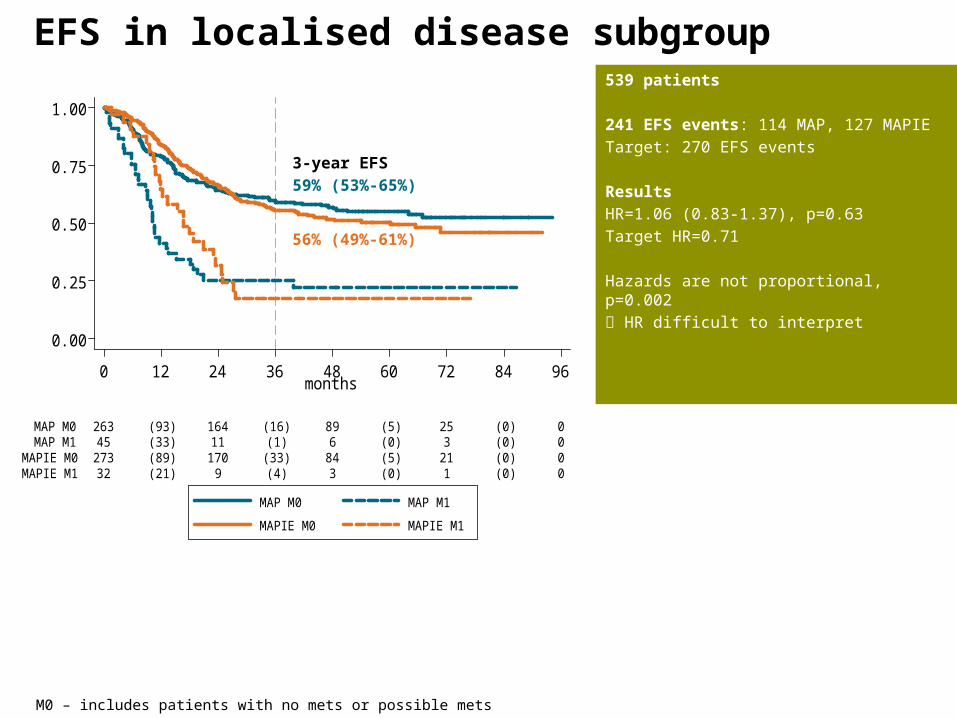
EFS in localised disease subgroup
M0 – includes patients with no mets or possible mets
0.00
0.25
0.50
0.75
1.00
32 9(21) 3(4) 1(0) 0(0)MAPIE M1273 170(89) 84(33) 21(5) 0(0)MAPIE M045 11(33) 6(1) 3(0) 0(0)MAP M1263 164(93) 89(16) 25(5) 0(0)MAP M0
0 12 24 36 48 60 72 84 96months
MAP M0 MAP M1
MAPIE M0 MAPIE M1
539 patients
241 EFS events: 114 MAP, 127 MAPIETarget: 270 EFS events
ResultsHR=1.06 (0.83-1.37), p=0.63Target HR=0.71
Hazards are not proportional, p=0.002 HR difficult to interpret
3-year EFS59% (53%-65%)
56% (49%-61%)

Cumulative standardised dose
Median (IQR)Target MAP MAPIE
Number of courses
% Received targetTarget MAP MAPIE
M methotrexate (g/m2)
96 94 (80-97)
88(68-97)
8
A doxorubicin (mg/m2)
300 296 (284-303)
299(233-305)
4
P cisplatin (mg/m2)
240 239(235-241)
240(230-244)
2
I ifosfomide 14g(g/m2)
52 n/a 41 (27-42)
3
i ifosfomide 9g(g/m2)
18 n/a 17 (9-18)
2
E etoposide(g/m2)
1.5 n/a 1.5 (1.0-1.5)
3
Postoperative chemotherapyreceived doses

39
58
4
13
0
20
40
60
Num
ber
of
patients
3 4toxicity grade
Hypophosphataemia
MAP MAPIE
2
5
1
2
0
1
2
3
4
5
Num
ber
of
patients
3 4toxicity grade
Creatinine
MAP MAPIE
2
4
0
1
2
3
4
Num
ber
of
patients
3toxicity grade
Thyhlitis
MAP MAPIE
2
9
3 3
0
2
4
6
8
10
Num
ber
of
patients
3 4toxicity grade
Mood alteration
MAP MAPIE
1
6
0
2
4
6N
um
ber
of
patients
3toxicity grade
Somnolance
MAP MAPIE
2
3
1
0
1
2
3
Num
ber
of
patients
3 5toxicity grade
LVSD
MAP MAPIE

50
100
150
g /
m2
Methotrexate
MAP MAPIE
0
200
400
600
mg
/ m2
Doxorubicin
MAP MAPIE
0
50
100
150
200
250
mg /
m2
Cisplatin
MAP MAPIE
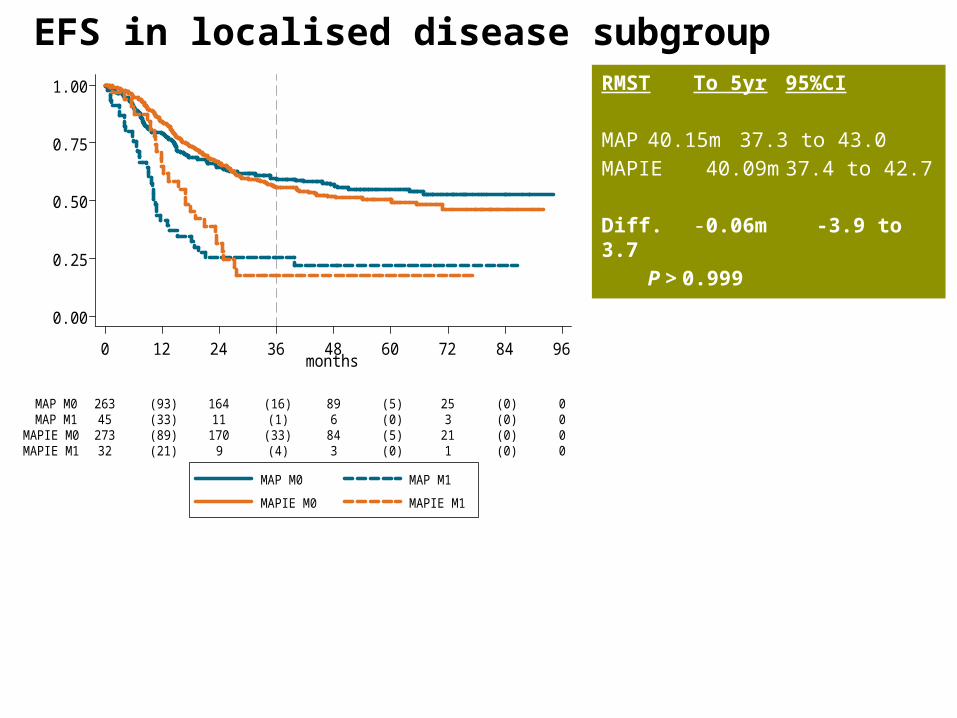
EFS in localised disease subgroupRMST To 5yr 95%CI
MAP 40.15m 37.3 to 43.0MAPIE 40.09m 37.4 to 42.7
Diff. -0.06m -3.9 to 3.7 P > 0.999
0.00
0.25
0.50
0.75
1.00
32 9(21) 3(4) 1(0) 0(0)MAPIE M1273 170(89) 84(33) 21(5) 0(0)MAPIE M045 11(33) 6(1) 3(0) 0(0)MAP M1263 164(93) 89(16) 25(5) 0(0)MAP M0
0 12 24 36 48 60 72 84 96months
MAP M0 MAP M1
MAPIE M0 MAPIE M1
Overall survival
MAP arm: lower event rate than predictedExpected 5-year OS: 45%Observed 5-year OS: 66% (61%-73%)
0.00
0.25
0.50
0.75
1.00
307 286(12) 241(35) 184(21) 129(13) 77(4) 34(1) 11(1) 0(0)MAPIE308 282(23) 238(38) 182(21) 132(7) 86(5) 39(0) 9(1) 0(0)MAP
0 12 24 36 48 60 72 84 96months
MAP MAPIE
66% (60-71%)
68% (61%-73%)
5-year OS
Main resultsHR=0.99 (0.74-1.32) p=0.81Target HR=0.75
No evidence against proportionality of hazards (p=0.08)


