
Mangroves
Lily Lisa Yevugah and Madeline Foster-Martinez

Outline
I. Introduction to Mangroves
II. Ecosystem Services
III. Case Study 1: Spatial Mapping
IV. Case Study 2: Wave Attenuation
V. Exploitation and Conservation

Mangroves
• Insert: pictures of mangroves• Halophytes
• Shrubs or small tress
• Tropical and Subtropical Coastal Vegetation

Physical Surroundings
• Salty
•Marshy Area
• Low-Oxygen
• Inundation of water

Survival of Mangroves
Salt
How do they survive in such harsh conditions?
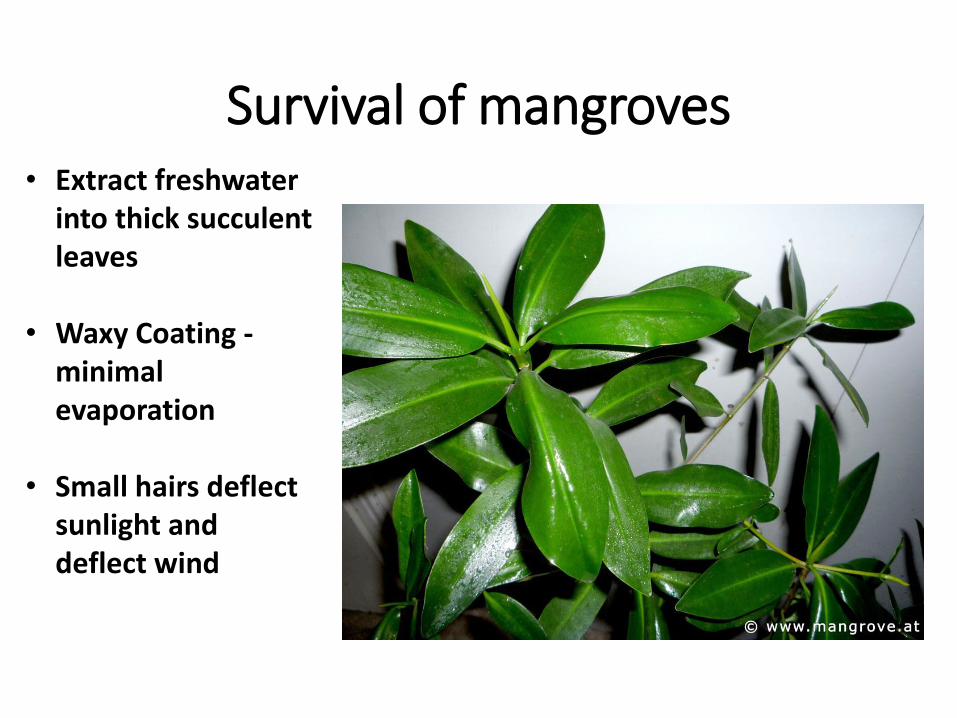
Survival of mangroves• Extract freshwater
into thick succulent leaves
• Waxy Coating -minimal evaporation
• Small hairs deflect sunlight and deflect wind
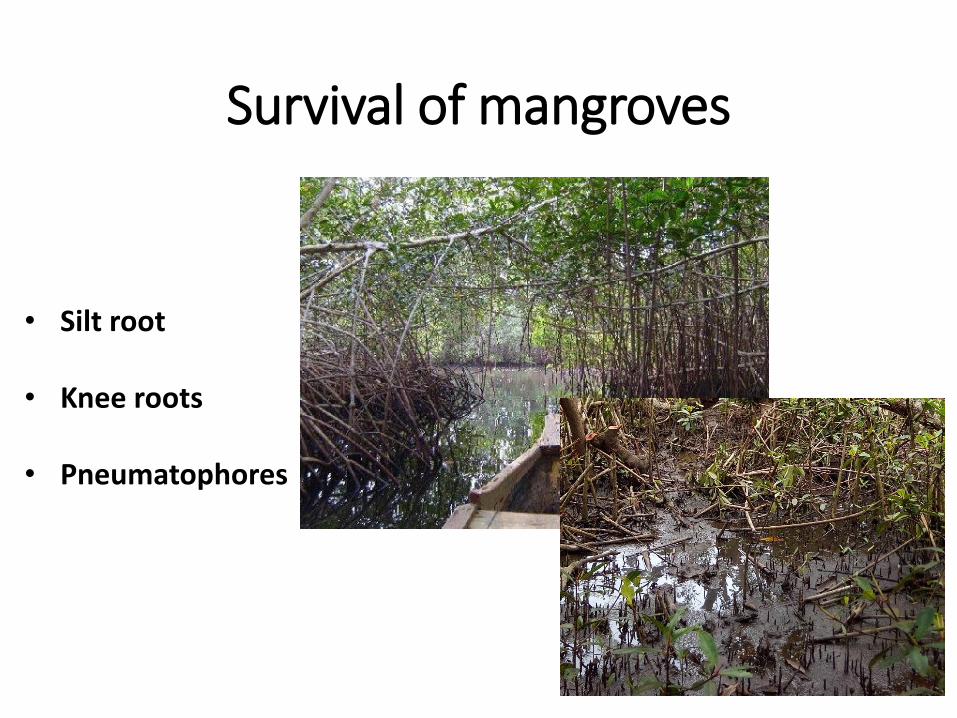
Survival of mangroves
• Silt root
• Knee roots
• Pneumatophores
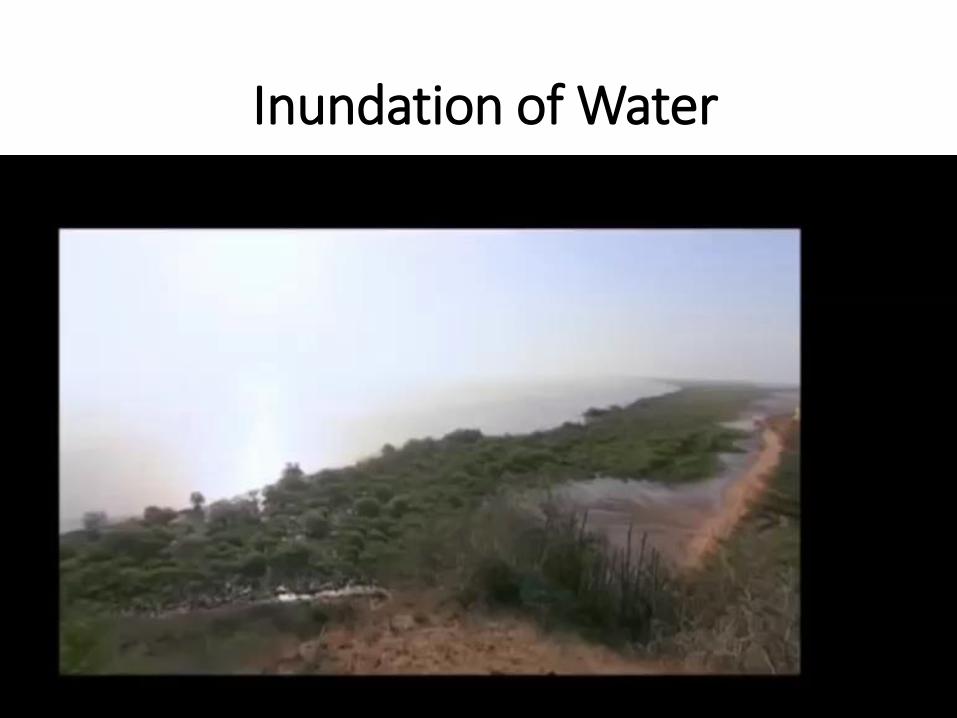
Inundation of Water

Mangroves in the World?
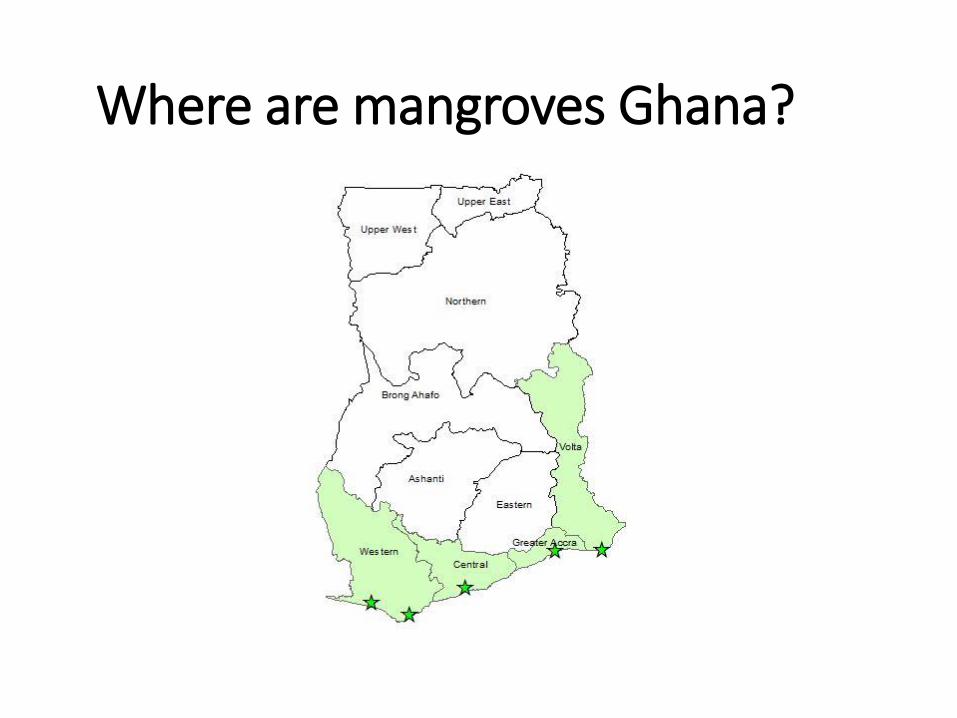
Where are mangroves Ghana?

Species of Mangroves
• Red Mangroves• Rhizophora racemosa
• Rhizophora mangle
• Rhizophora harrisonii
• White Mangrove
Avicennia germinans
Laguncularia racemosa

Ecosystem Services
“Ecosystem services, or ‘nature’s benefits,’ are the contributions that a biological community and its habitat provide to the physical and mental well-being of the human population.”
http://www.habitat.noaa.gov/abouthabitat/ecosystemservices101.html

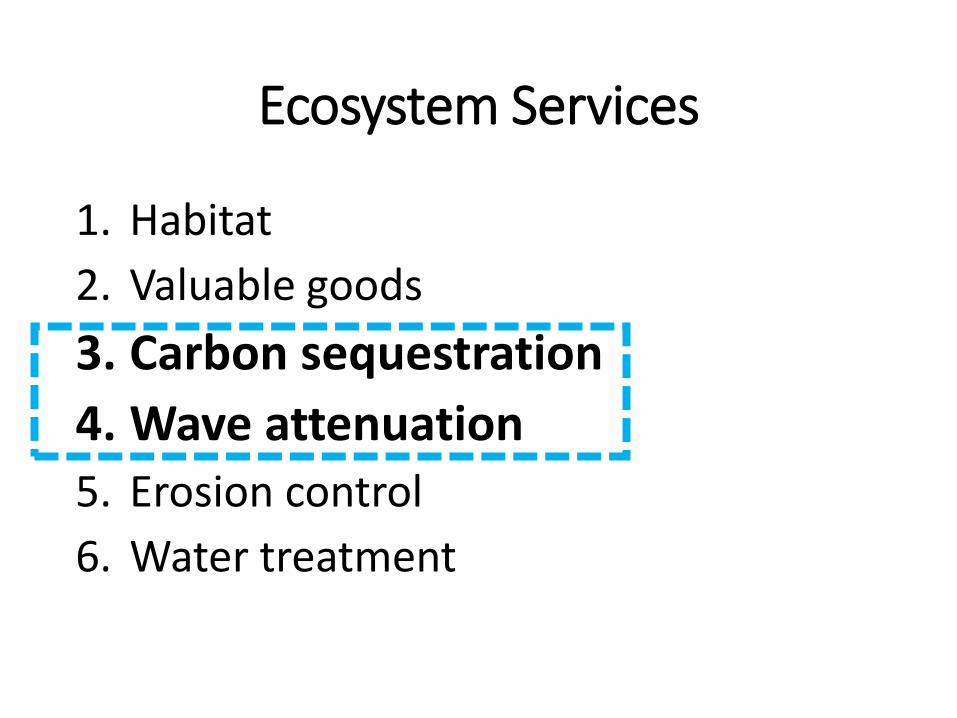
Ecosystem Services
1. Habitat
2. Valuable goods
3. Carbon sequestration
4. Wave attenuation
5. Erosion control
6. Water treatment
Ecosystem Services
1. Habitat
2. Valuable goods
3. Carbon sequestration
4. Wave attenuation 5. Erosion control
6. Water treatment

Carbon Sequestration
“Blue Carbon” Carbon stored in wet environments
http://www.habitat.noaa.gov/coastalbluecarbon.html

Mangroves among the most carbon-rich forests in the tropics
Donato et al 2011

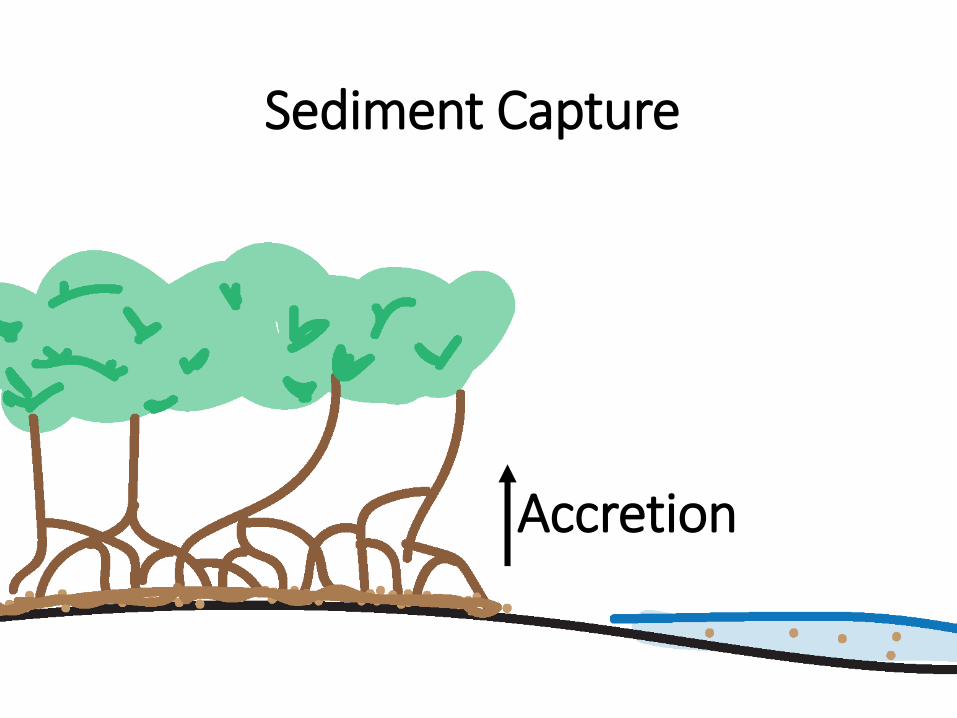
Carbon Sequestration: Two Main Pathways

Carbon Sequestration: Two Main Pathways
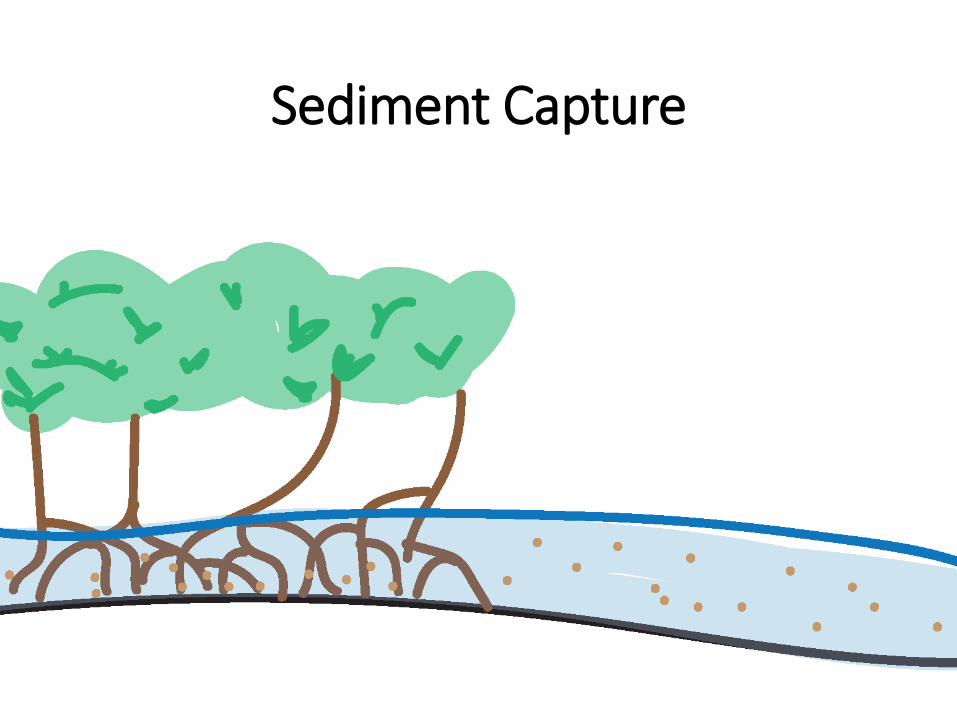
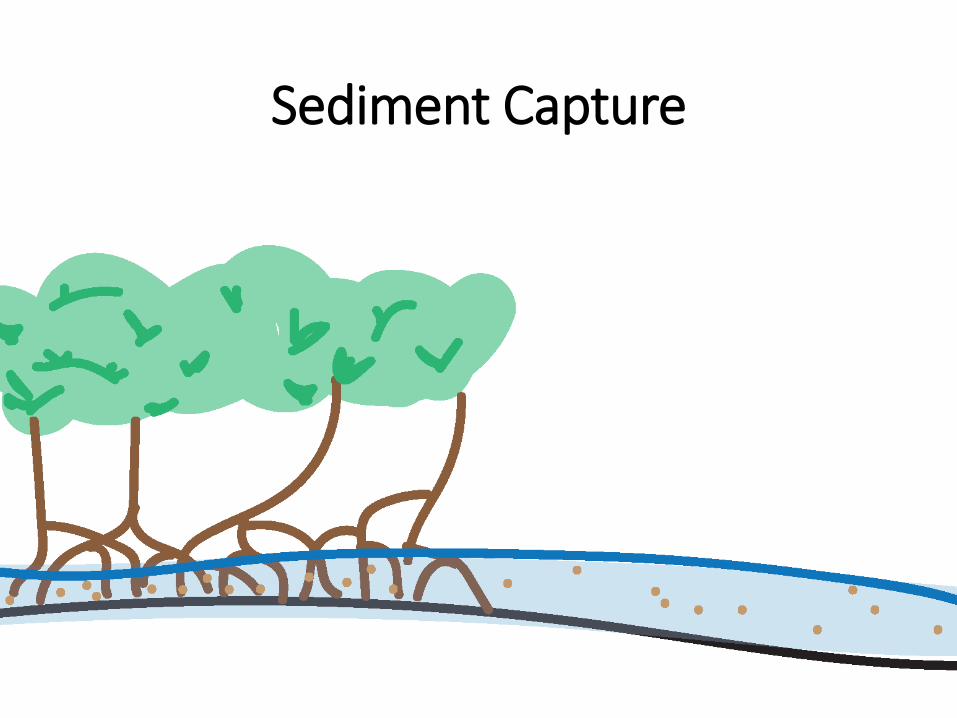
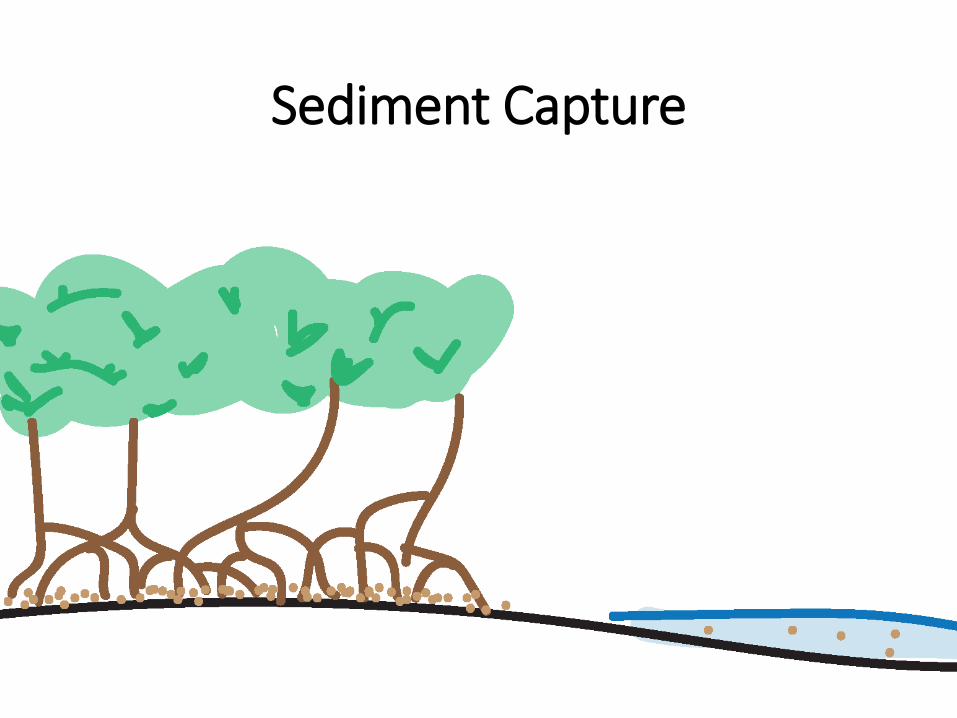
1. Sediment capture (sedimentation)
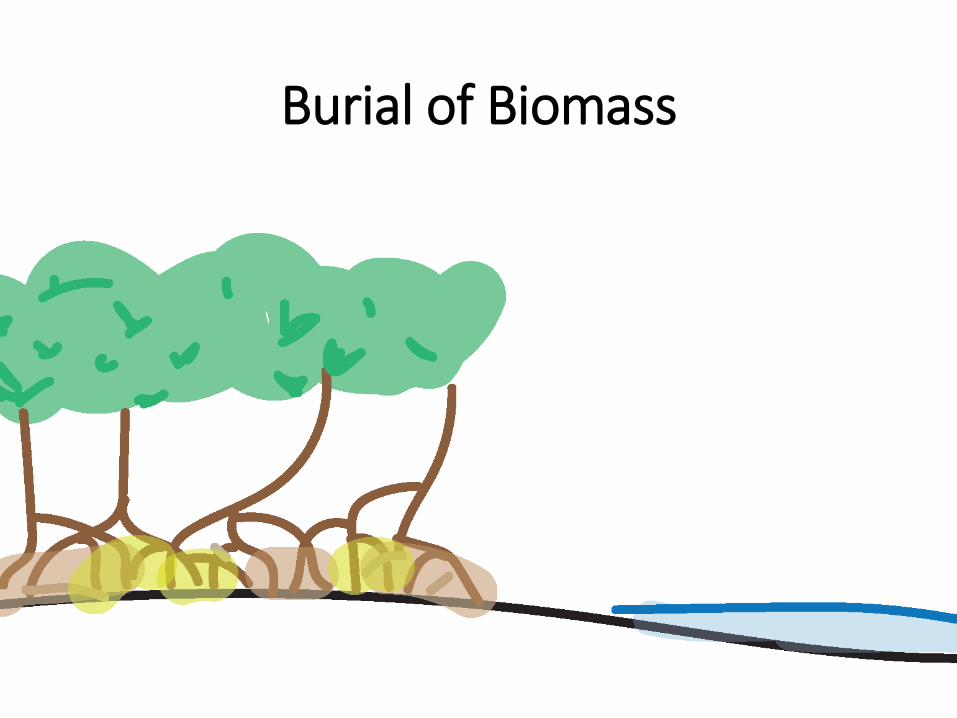
2. Burial of biomass

Sediment Capture

Sediment Capture
Suspended Sediment

Sediment Capture
SSC =Suspended SedimentConcentration

Sediment Capture
Sediment Capture
Sediment Capture

Sediment Capture
Sediment Capture
Sediment Capture
Accretion
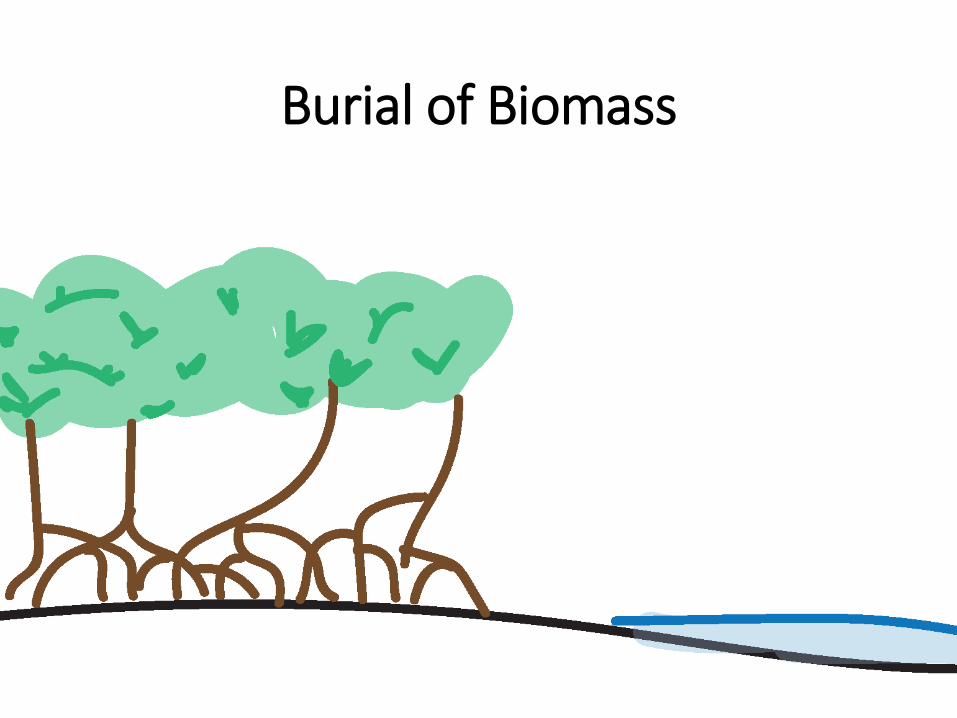
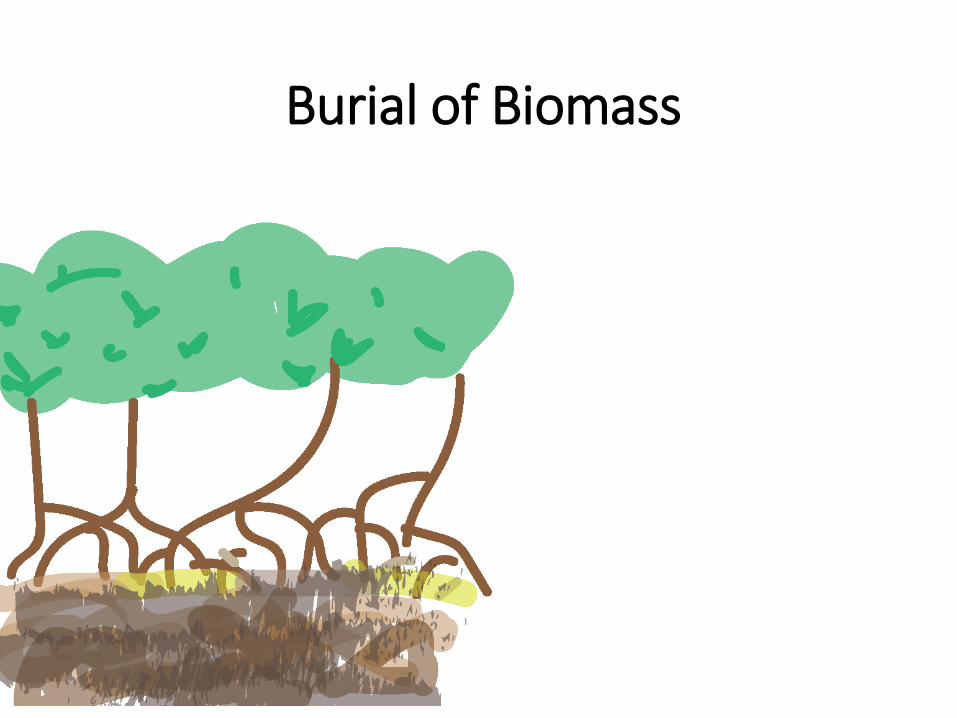
Burial of Biomass
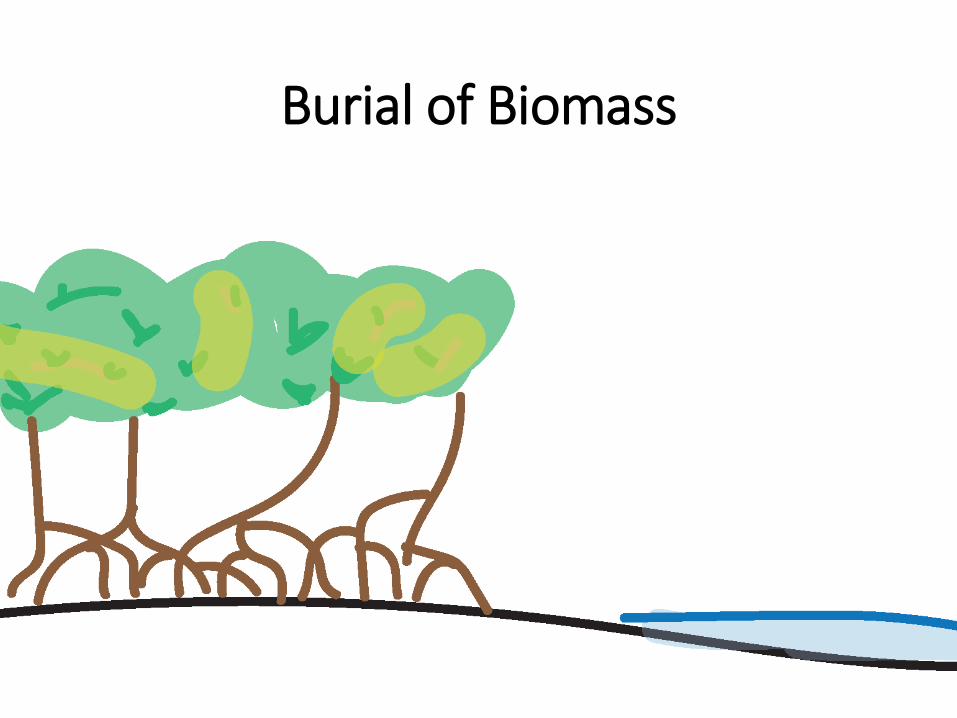
Burial of Biomass
Burial of Biomass

Burial of Biomass
Anaerobic Decomposition
verrryyyyyyy sloooowwAnd can be smelly

Burial of Biomass
Burial of Biomass
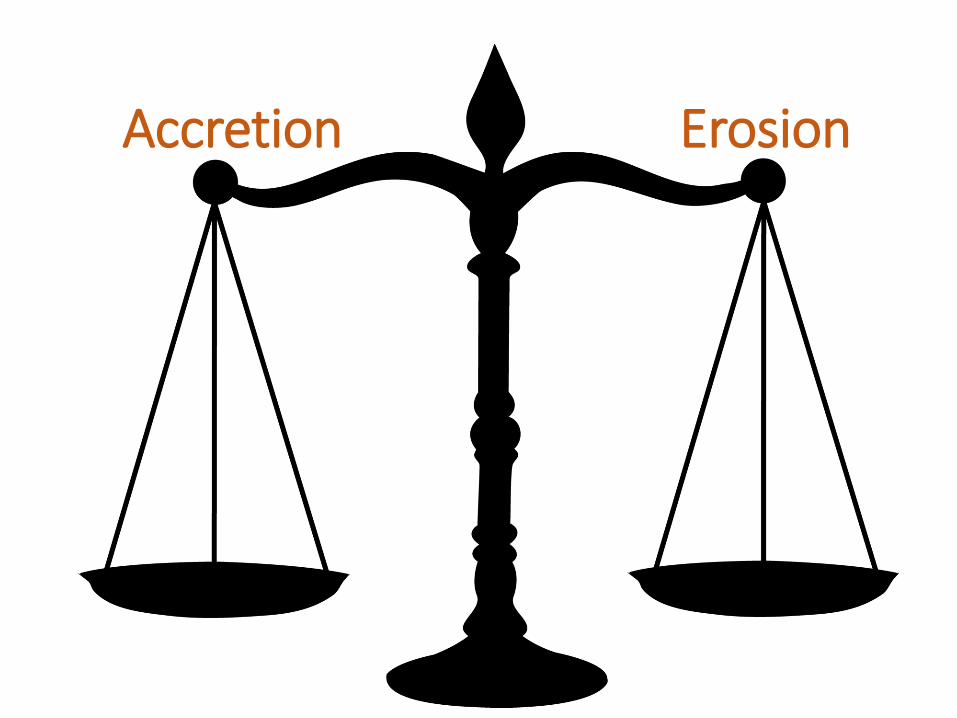
ErosionAccretion

ErosionAccretion
• Greater biomass• High SSC• Inundation time• Desiccation time
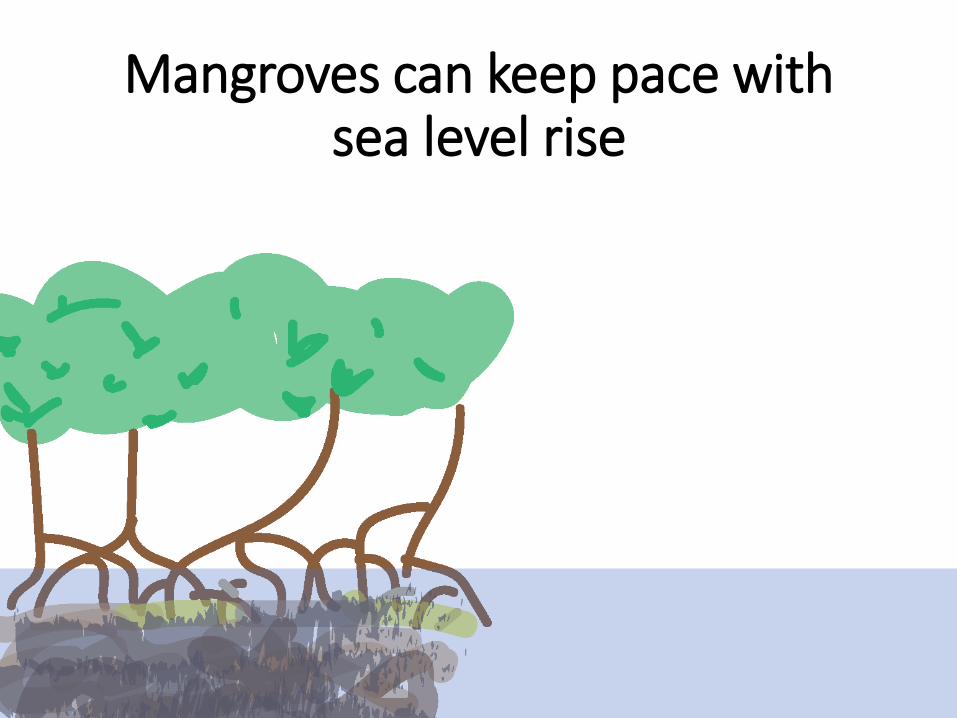
Mangroves can keep pace with sea level rise

Mangroves can keep pace withsea level rise

Mangroves can keep pace with sea level rise

Mangroves can keep pace with sea level rise
Important! Rate of sea level rise is increasing

Case Study: Spatial Mapping of Carbon Stock
• Field Measurement
Diameter Tape

Results on Carbon Map

Classified Landsat Image
• Insert: images
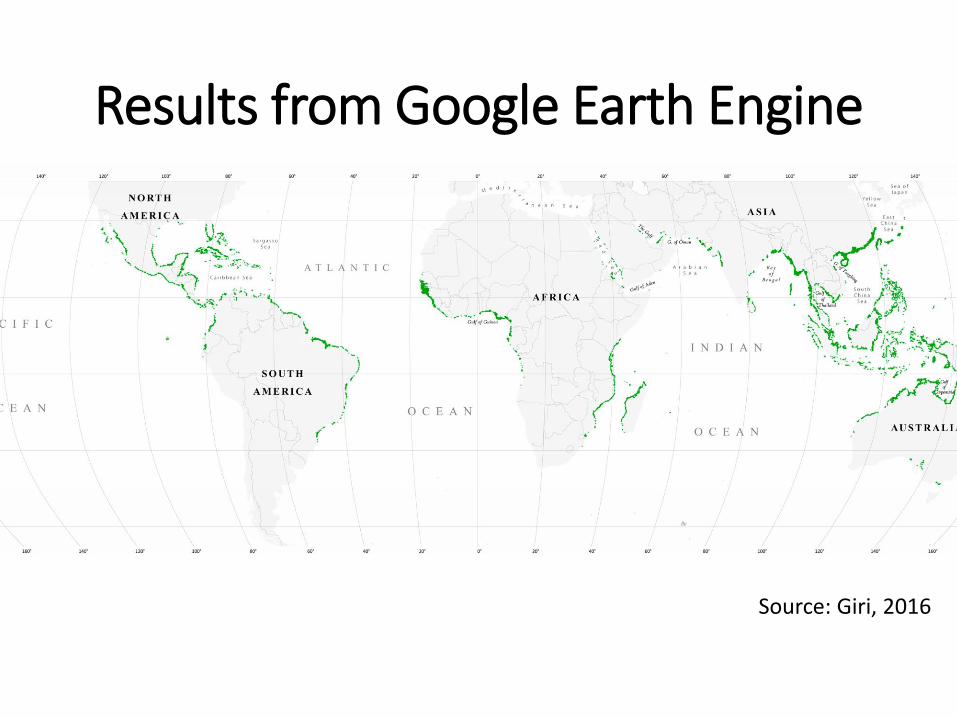
Results from Google Earth Engine
Source: Giri, 2016

Results from Google Earth Engine
Source: Giri et al, 2016
Sourcehttps://www.youtube.com/watch?v=1YXhrzYL1Rk

Case Study: Wave Attenuation
Loss of wave energy (calculate from wave height)

Case Study: Wave Attenuation
Loss of wave energy (calculate from wave height)

Case Study: Wave Attenuation
Loss of wave energy (calculate from wave height)
Smaller Larger
H H
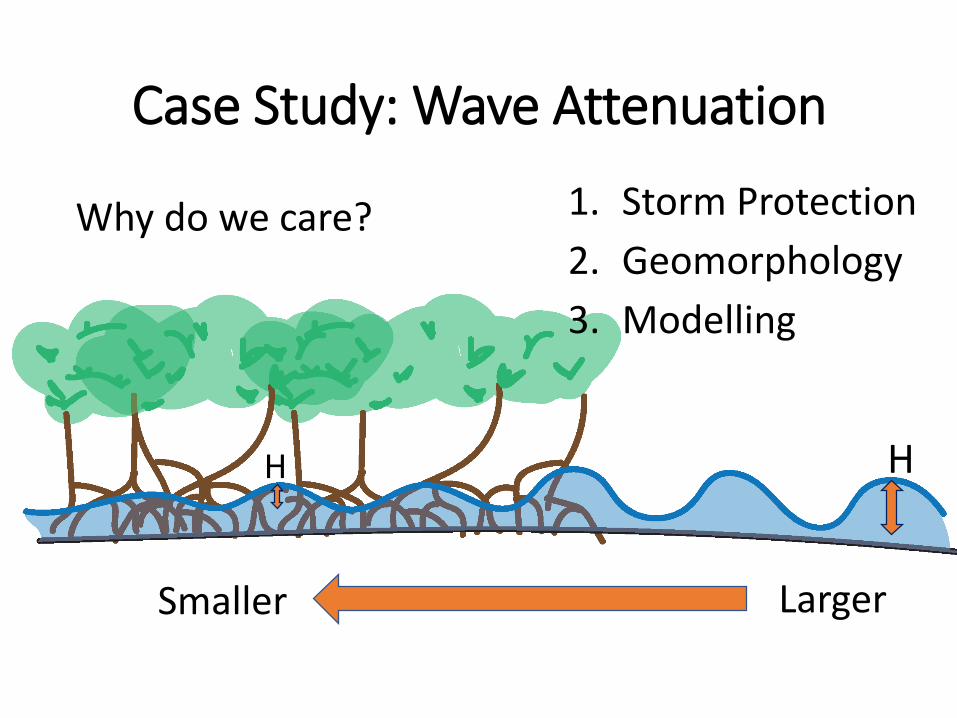
Case Study: Wave Attenuation
Why do we care?
Smaller Larger
H H
1. Storm Protection
2. Geomorphology
3. Modelling
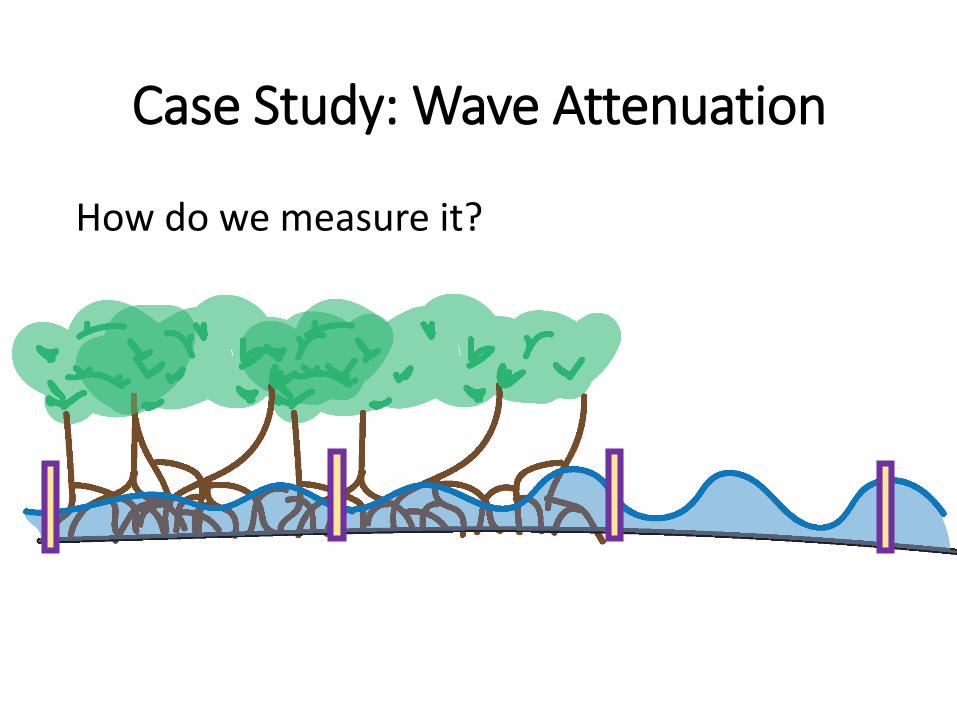
Case Study: Wave Attenuation
How do we measure it?

Case Study: Wave Attenuation
How do we measure it?
High-Frequency Pressure Sensors
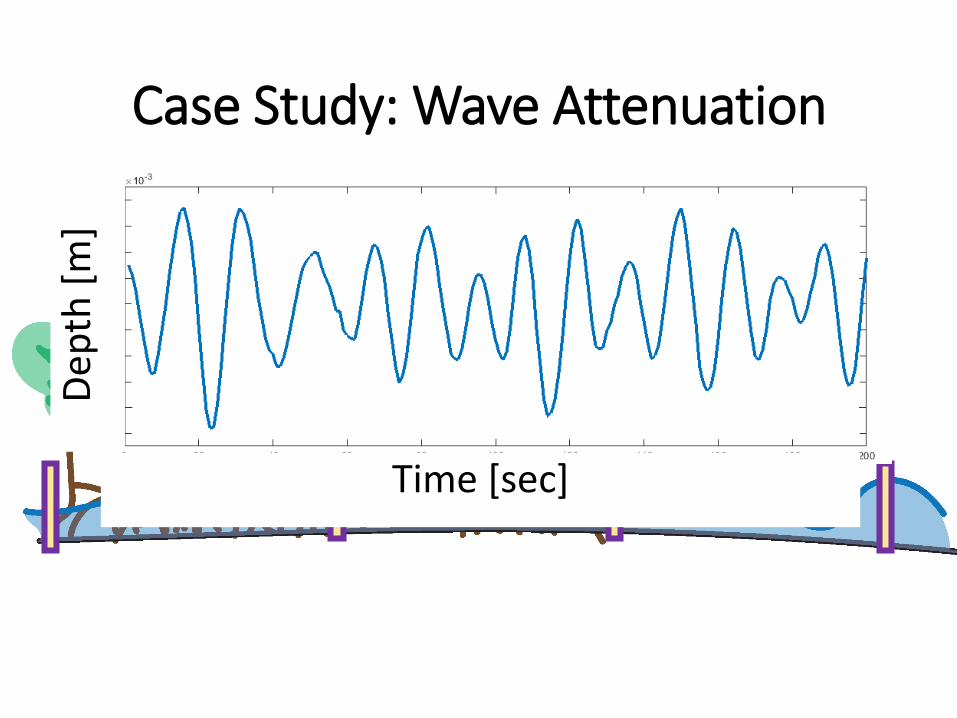
Case Study: Wave Attenuation
How do we measure it?
Time [sec]
Dep
th [
m]

Case Study: Wave Attenuation
How do we measure it?
Time [sec]
Dep
th [
m]
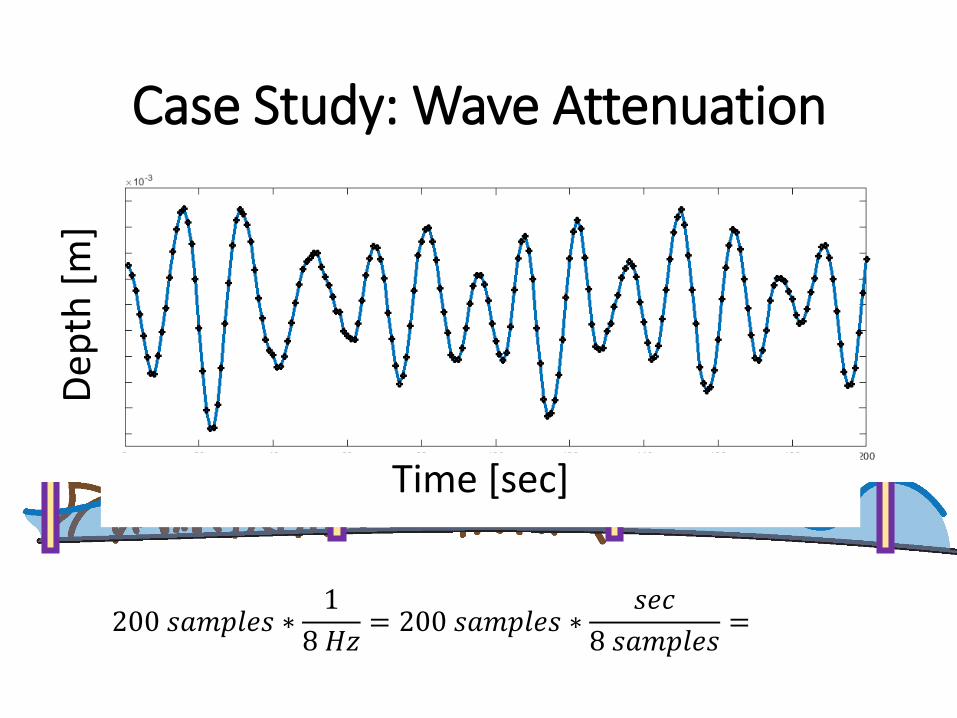
Case Study: Wave Attenuation
How do we measure it?
Time [sec]
Dep
th [
m]
200 𝑠𝑎𝑚𝑝𝑙𝑒𝑠 ∗1
8 𝐻𝑧= 200 𝑠𝑎𝑚𝑝𝑙𝑒𝑠 ∗
𝑠𝑒𝑐
8 𝑠𝑎𝑚𝑝𝑙𝑒𝑠= 25 𝑠𝑒𝑐

Case Study: Wave Attenuation
How do we measure it?
Time [sec]
Dep
th [
m]
200 𝑠𝑎𝑚𝑝𝑙𝑒𝑠 ∗1
8 𝐻𝑧= 200 𝑠𝑎𝑚𝑝𝑙𝑒𝑠 ∗
𝑠𝑒𝑐
8 𝑠𝑎𝑚𝑝𝑙𝑒𝑠= 25 𝑠𝑒𝑐

Case Study: Wave Attenuation
Compare the waves at each station

Model Complexity
Simple Complex
𝜆Exponential
decay
𝐶𝑑
shallow, sloped
flat
Dragcoefficient
%Height
reduction
sloped
Bed Roughness
𝐶𝑑
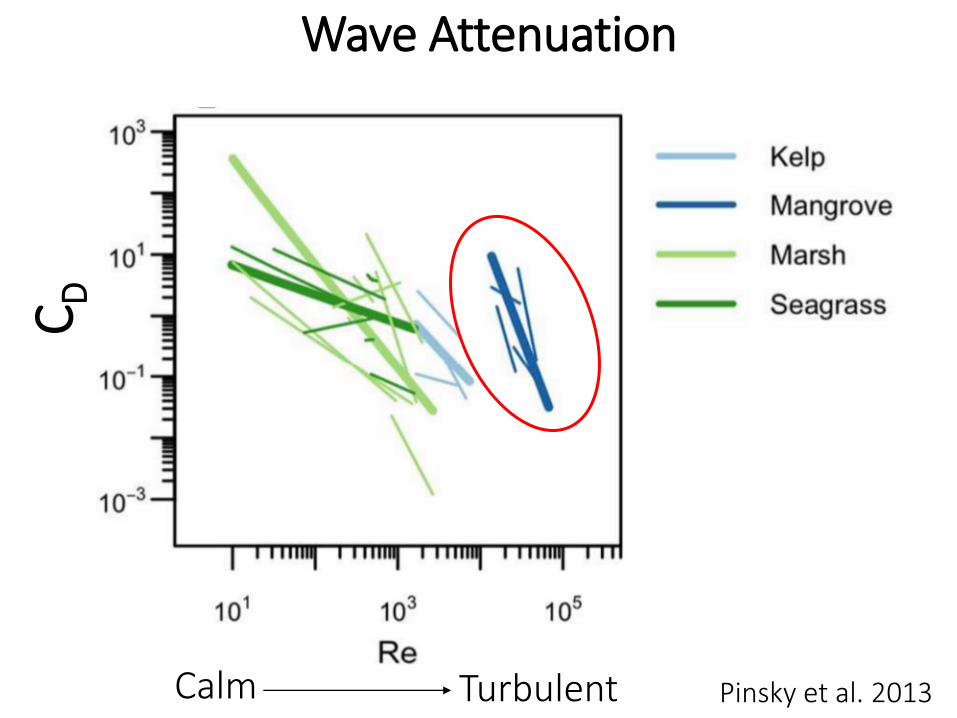
Wave Attenuation C
D
Calm Turbulent Pinsky et al. 2013

Wave Attenuation C
D
Function of the local conditions
Pinsky et al. 2013

Exploitation of Mangroves
• Firewood • Building material • Fences and buildings• Shrimp/ crab farming• Salt production

Conservation of Mangroves

Conservation of Mangroves

Thank you for listening! Questions?

Work Cited
• Donato, D. C., J. B. Kauffman, D. Murdiyarso, S. Kurnianto, M. Stidham, and M. Kanninen (2011), Mangroves among the most carbon-rich forests in the tropics, Nat. Geosci., 4(5), 293–297, doi:10.1038/ngeo1123.
• Pinsky, M. L., G. Guannel, and K. K. Arkema (2013), Quantifying wave attenuation to inform coastal habitat conservation, Ecosphere, 4(8), art95, doi:10.1890/ES13-00080.1.


