Major Economic Indicators: Monthly Update
Volume 10/2017 October 2017
Monetary Policy Department
BANGLADESH BANK
0
Comments and suggestions may be sent to:
[email protected] [email protected] [email protected]
Contents Page
No.
Executive summary 1-2
1. Monetary and credit developments 3
2. Reserve money developments 4
3. CPI and inflation 5
4. Liquidity position of the scheduled banks 6
5. Financial sector prices
a) Weighted average yields on bills and bonds 7
b) Interest rate spread 8
6. Capital market developments 9
7. Agricultural credit and non-farm rural credit 10
8. Industrial and SME loans
a) Industrial term loans 11
b) Outstanding position of SME loans 11
9. Industrial production
a)Quantum index of medium and large-scale manufacturing industry 12
b)Quantum index of small scale manufacturing industry 12
10. Exports
a) Annual exports 13
b) Monthly exports 13
c) Category-wise breakdown of exports 14
11. Imports
a) Custom based import, import LCs settlement and LCs opening 15
b) Sector-wise fresh opening, settlement and outstanding LCs 16
c) Projected data on opening of import LCs & probable liabilities against BTB LCs 16
12. Workers’ remittances 17
13. Foreign exchange holdings by Bangladesh Bank and Commercial Banks 17
14. Foreign aid 18
15. Exchange rate movements 19
16. Balance of payments 20
17. Public finance
a) Government tax revenue collections 21
b) Sale and repayment of National Savings Certificates (NSC) 22
c) Budget financing 23
18. Food situations 23
Appendix 24 -25

1
Executive Summary
Broad money(M2) growth continued to slow down and private sector credit growth increased in August 2017.
1. Movement of monetary indicators
Broad money (M2) increased by 11.73 percent (y-o-y) in August 2017 which was lower
than 14.59 percent of the same month of the previous year. Net foreign assets and net
domestic assets registered 10.10 percent and 12.31 percent growth respectively in August
2017. Private sector credit recorded 17.84 percent growth in August 2017 which was
higher than 16.21 percent of the same month of the previous year.
Both Point to point and 12-month average inflation increased in September 2017.
Weighted average Interest rate spread of all banks narrowed in August, 2017 and call money rate fell up to October 25, 2017
Export records a modest growth during July-September, 2017
Import growth increased during July-August 2017
2. Inflation scenario
The point-to-point inflation increased to 6.12 percent in September 2017 from 5.89
percent in August 2017. The twelve-month average inflation also increased to 5.55
percent in September 2017 from 5.50 percent in August 2017.
3. State of the financial sector
The spread between the weighted average interest rates on advances and deposits of all
banks narrowed in August 2017 from that of July 2017 and stood at 4.53 percent. The
weighted average call money rate in the inter-bank money market decreased to 3.87 percent
up to October 25, 2017 as compared to 3.91 percent in September 2017.
4. External sector performance
Merchandise Commodity export increased to USD 8.66 billion during July-September,
2017 which was 7.61 percent higher than USD 8.05 billion during July-September, 2016,
according to EPB data.
Custom based import during July-August, 2017 increased by 33.97 percent and stood at
USD 9.03 billion compared to USD 6.74 billion during July-August, 2016.
Fresh opening of import LCs during July-August, 2017 increased by 38.78 percent as
compared to that of July-August, 2017 and stood at USD 10.13 billion. From the sectoral
distribution of LCs opening during the mentioned period, it is revealed that LCs opening for
the industrial raw materials is the highest at 31.83 percent of total LCs opening followed by
consumer goods at 16.67 percent.
2
In spite of a sharp decline in September 2017, workers’ remittances inflow maintained a positive growth up to the third month of FY 18
Current account balance continued to a deficit during July-August, 2017.
Both total and net reciepts of foreign aid increased significantly during July-August, 2017.
Forex reserves stood at 33.40 billion as on October 26, 2017
NBR tax revenue collection continued to a strong growth during July-August, 2017.
Agricultural
credit, SME loan,
and the general
index of
industrial
production have
increased while
industrial term
loans decreased
during the
period under
review.
External sector performance (contd.)
Receipts of workers’ remittances in September 2017 decreased by 39.82 percent and stood at
USD 0.85 billion as compared to August 2017. It was also lower by 19.20 percent against USD
1.06 billion of September 2016. However, total receipts of workers’ remittances increased by
USD 0.14 billion or 4.38 percent during July-September, 2017-18 as compared to that of July-
September, 2016-17.
Current account balance recorded a deficit of USD 0.45 billion during July-August, 2017 due
mainly to a significant trade deficit and lower income from services and primary income
accounts compared to that of July-August, 2016.
The total foreign aid disbursements during July-August, 2017 increased by USD 0.19 billion
or 63.56 percent and stood at USD 0.49 billion as compared to that of July-August, 2016. Net
receipt of foreign aid also increased by USD 0.17 billion and stood at USD 0.34 billion during
July-August, 2017 as compared to that of July-August, 2016.
The gross foreign exchange reserves of BB stood at USD 32.82 billion (with ACU liability
of USD 0.56 billion) as of end September 2017, as compared to USD 33.60 billion (with ACU
liability of USD 1.19 billion) as of end August, 2017. As per the latest available data, gross
foreign exchange reserves stood at USD 33.40 billion (with ACU liability of USD 1.06 billion)
as on October 26, 2017.
5. Developments in the fiscal sector NBR Tax Revenue collection stood at Taka 27161.69 crore during July-August, 2017 which
was 23.34 percent higher than Taka 22021.61 crore during July-August, 2016.
6. Credit disbursement and industrial production
The disbursement of agricultural credit increased by 28.26 percent while the disbursement
of non-farm rural credit decreased by 27.24 percent during July-September, 2017 as
compared to July-September, 2016.
Outstanding SME loans provided by banks and non-bank financial institutions at the end of
June 2017 increased by 13.84 percent compared to the same month of the previous year.
Disbursement of industrial term loans during the fourth quarter of FY17 decreased by 17.93
percent and stood at Taka 13751.85 crore and recovery decreased by 10.38 percent as
compared to the corresponding period of the previous fiscal year.
The general index of industrial production (medium & large scale manufacturing) stood at
287.08 during July-April, 2016-17 recording an increase of 9.91 percent from the index of
261.20 during July-April, 2015-16.
Note: The information furnished in this executive summary and the subsequent pages are provisional and subject to revision.

3
1. Monetary and credit developments
Broad money
The broad money (M2) recorded an increase of Taka
108268.60 crore or 11.73 percent at the end of August
2017 against the increase of Taka 117505.10 crore or
14.59 percent at the end of August 2016. Of the sources
of broad money, net domestic assets (NDA) rose by
Taka 83868.20 crore or 12.31 percent and net foreign
assets (NFA) rose by Taka 24400.40 crore or 10.10
percent at the end of August 2017 as compared to the
same month of the previous year.
Domestic credit The domestic credit recorded an increase of Taka
109427.60 crore or 13.66 percent at the end of August
2017 against the increase of Taka 91806.80 crore or
12.94 percent at the end of August 2016. Credit to the
private sector recorded a growth of 17.84 percent while
credit to the public sector decreased by 8.08 percent in
August 2017 as compared to the same month of the
previous year.
11.58
13.66
12.94
10.5
11.0
11.5
12.0
12.5
13.0
13.5
14.0
Jul.
Au
g.
Sep
.
Oct
.
No
v.
Dec
.
Jan
.
Feb
.
Mar
.
Ap
r.
May
Jun
.
Per
cen
tage
Trends of domestic credit growth
(year-on-year)
2016-17 2017-18
14.59
10.54
11.73
10.0
11.0
12.0
13.0
14.0
15.0
16.0
Jul.
Au
g.
Sep
.
Oct
.
No
v.
Dec
.
Jan
.
Feb
.
Mar
.
Ap
r.
May
Jun
.
Per
cen
tage
Trends of broad money growth
(year-on-year)
2016-17 2017-18
Outstanding stock
Particulars June 2017 R August 2017 P
June 2017
over
June 2016
August 2017
over
June 2017
August 2017
over
August 2016
August 2016
over
June 2016
August 2016
over
August 2015
1 5 6 7 8 9
33561.40 -761.60 24400.40 8399.40 43060.00
(+14.40) (-0.29) (+10.10) (+3.60) (+21.70)
66136.70 15837.30 83868.20 -1894.20 74445.10
(+9.68) (+2.11) (+12.31) (-0.28) (+12.27)
a) Domestic credit 89390.30 20115.80 109427.60 78.50 91806.80
(+11.16) (+2.26) (+13.66) (+0.01) (+12.94)
Public sector -15656.90 4365.20 -10454.90 -836.80 -1940.90
(-12.02) (+3.81) (-8.08) (-0.64) (-1.48)
Government (net) -16886.00 3953.70 -12036.90 -895.40 -2362.90
(-14.78) (+4.06) (-10.62) (-0.78) (-2.04)
Other Public 1229.10 411.50 1582.00 58.60 422.00
(+7.66) (+2.38) (+9.82) (+0.37) (+2.69)
Private sector 105047.20 15750.60 119882.50 915.30 93747.70
(+15.66) (+2.03) (+17.84) (+0.14) (+16.21)
b) Other items (net) -23253.60 -4278.50 -25559.40 -1972.70 -17361.70
C. Broad money (A+B) 1031151.70 99698.10 15075.70 108268.60 6505.20 117505.10
(+10.88) (+1.48) (+11.73) (+0.71) (+14.59)
i) Currency outside banks 15457.30 10291.70 35709.70 -9960.70 22863.50
(+12.66) (+7.48) (+31.85) (-8.16) (+25.62)
ii) Deposits 883328.20 84240.80 4784.00 72558.90 16465.90 94641.60
(+10.61) (+0.54) (+8.95) (+2.07) (+13.22)
a) Demand deposits 12190.40 -6966.80 9330.10 -4106.50 16577.60
(+13.49) (-6.79) (+10.82) (-4.54) (+23.79)
b) Time deposits 72050.40 11750.80 63228.80 20572.40 78064.00
(+10.24) (+1.51) (+8.73) (+2.92) (+12.08)
Source: Statistics Department, BB.
Note:- Figures in brackets indicate percentage changes. P=provisional, R= Revised.
90356.20 102546.60 95579.80
703947.20 775997.60 787748.40
122074.50 137531.80 147823.50
794303.40 878544.20
-118037.70 -141291.30 -145569.80
916377.90 1016076.00
16051.10 17280.20 17691.70
671009.30 776056.50 791807.10
130270.70 114613.80 118979.00
114219.60 97333.60 101287.30
B. Net Domestic Assets of the
banking system
683242.30 749379.00 765216.30
801280.00 890670.30 910786.10
(Taka in Crore)
Changes in outstanding stock
A. Net Foreign Assets of the
banking system
233135.60 266697.00 265935.40
32 4
June 2016
4
2. Reserve money developments
* Note :- The change in Net Domestic Assets (NDA) is calculated with the formula :
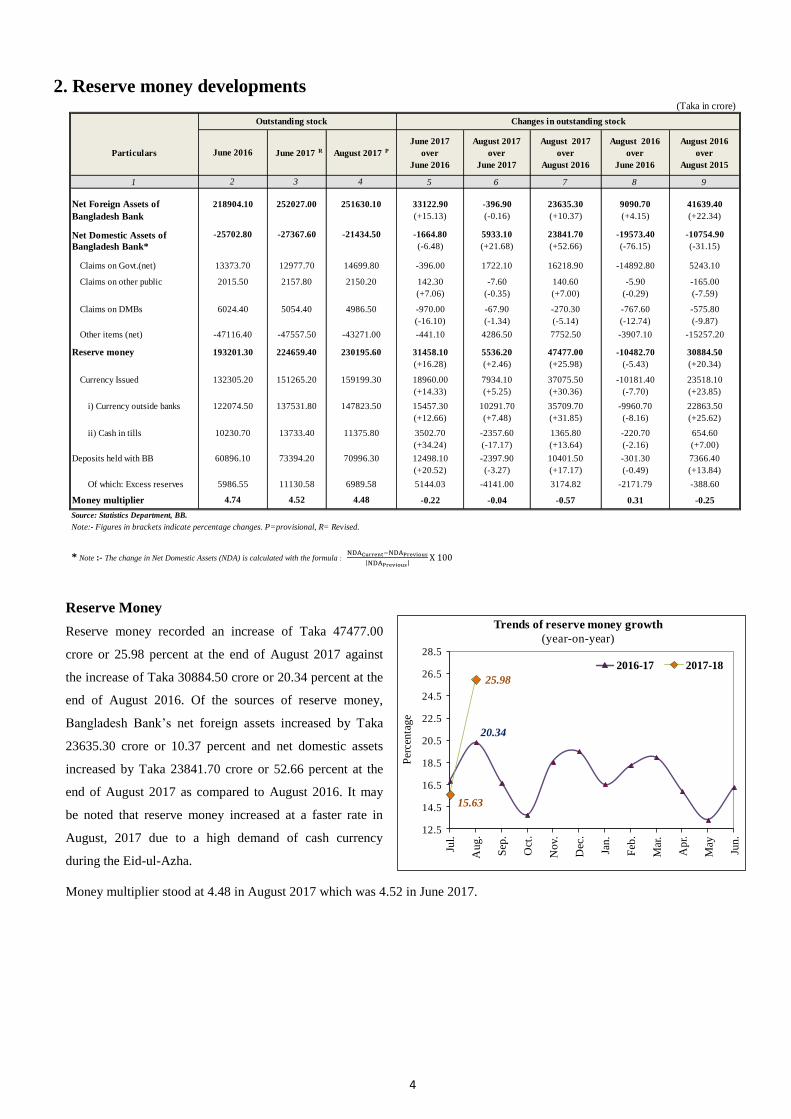
Reserve Money
Reserve money recorded an increase of Taka 47477.00
crore or 25.98 percent at the end of August 2017 against
the increase of Taka 30884.50 crore or 20.34 percent at the
end of August 2016. Of the sources of reserve money,
Bangladesh Bank’s net foreign assets increased by Taka
23635.30 crore or 10.37 percent and net domestic assets
increased by Taka 23841.70 crore or 52.66 percent at the
end of August 2017 as compared to August 2016. It may
be noted that reserve money increased at a faster rate in
August, 2017 due to a high demand of cash currency
during the Eid-ul-Azha.
Money multiplier stood at 4.48 in August 2017 which was 4.52 in June 2017.
15.63
25.98
20.34
12.5
14.5
16.5
18.5
20.5
22.5
24.5
26.5
28.5
Jul.
Au
g.
Sep
.
Oct
.
No
v.
Dec
.
Jan
.
Feb
.
Mar
.
Ap
r.
May
Jun
.
Per
cen
tag
e
Trends of reserve money growth
(year-on-year)
2016-17 2017-18
Particulars June 2017 R August 2017 P
June 2017
over
June 2016
August 2017
over
June 2017
August 2017
over
August 2016
August 2016
over
June 2016
August 2016
over
August 2015
1 5 6 7 8 9
Net Foreign Assets of 33122.90 -396.90 23635.30 9090.70 41639.40
Bangladesh Bank (+15.13) (-0.16) (+10.37) (+4.15) (+22.34)
Net Domestic Assets of -1664.80 5933.10 23841.70 -19573.40 -10754.90
Bangladesh Bank* (-6.48) (+21.68) (+52.66) (-76.15) (-31.15)
Claims on Govt.(net) -396.00 1722.10 16218.90 -14892.80 5243.10
Claims on other public 142.30 -7.60 140.60 -5.90 -165.00
(+7.06) (-0.35) (+7.00) (-0.29) (-7.59)
Claims on DMBs -970.00 -67.90 -270.30 -767.60 -575.80
(-16.10) (-1.34) (-5.14) (-12.74) (-9.87)
Other items (net) -441.10 4286.50 7752.50 -3907.10 -15257.20
Reserve money 31458.10 5536.20 47477.00 -10482.70 30884.50
(+16.28) (+2.46) (+25.98) (-5.43) (+20.34)
Currency Issued 18960.00 7934.10 37075.50 -10181.40 23518.10
(+14.33) (+5.25) (+30.36) (-7.70) (+23.85)
i) Currency outside banks 15457.30 10291.70 35709.70 -9960.70 22863.50
(+12.66) (+7.48) (+31.85) (-8.16) (+25.62)
ii) Cash in tills 3502.70 -2357.60 1365.80 -220.70 654.60
(+34.24) (-17.17) (+13.64) (-2.16) (+7.00)
Deposits held with BB 12498.10 -2397.90 10401.50 -301.30 7366.40
(+20.52) (-3.27) (+17.17) (-0.49) (+13.84)
Of which: Excess reserves 5144.03 -4141.00 3174.82 -2171.79 -388.60
Money multiplier -0.22 -0.04 -0.57 0.31 -0.25
Source: Statistics Department, BB.
Note:- Figures in brackets indicate percentage changes. P=provisional, R= Revised.
5986.55 11130.58 6989.58
4.74 4.52 4.48
10230.70 13733.40 11375.80
60896.10 73394.20 70996.30
132305.20 151265.20 159199.30
122074.50 137531.80 147823.50
-47116.40 -47557.50 -43271.00
193201.30 224659.40 230195.60
2015.50 2157.80 2150.20
6024.40 5054.40 4986.50
-25702.80 -27367.60 -21434.50
13373.70 12977.70 14699.80
(Taka in crore)
Outstanding stock Changes in outstanding stock
June 2016
218904.10 252027.00 251630.10
432

5
3. CPI and Inflation
The twelve month average general inflation edged up
marginally to 5.55 percent in September 2017 from 5.50
percent of August, 2017. The average food inflation
increased to 6.72 percent while the average non-food
inflation decreased to 3.81 percent in September 2017
from August 2017.
The point to point general inflation increased to 6.12
percent in September 2017 from 5.89 percent in August
2017, as food inflation increased and stood at 7.87
percent. However, non-food inflation stood at 3.44
percent in September 2017 as compared to 3.75 percent
of August 2017.
Index Inflation Index Inflation Index Inflation Index Inflation Index Inflation Index Inflation
2010-11 156.59 10.91 170.48 14.11 138.77 6.21 161.38 11.14 175.24 13.84 143.60 7.16
2011-12 170.19 8.69 183.65 7.72 152.94 10.21 170.32 5.54 179.74 2.57 158.25 10.20
2012-13 181.73 6.78 193.24 5.22 166.97 9.17 184.04 8.06 194.58 8.26 170.53 7.76
2013-14 195.08 7.35 209.79 8.57 176.22 5.54 196.86 6.97 210.15 8.00 179.82 5.45
2014-15 207.58 6.41 223.80 6.68 186.79 5.99 209.17 6.25 223.43 6.32 190.88 6.15
2015-16 219.86 5.92 234.77 4.90 200.74 7.47 220.74 5.53 232.87 4.23 205.19 7.50
July220.82 5.84 235.60 4.76 201.86 7.48 224.13 5.40 237.69 4.35 206.75 6.98
August221.78 5.77 236.43 4.62 202.99 7.53 226.57 5.37 241.89 4.30 206.93 7.00
September222.78 5.71 237.43 4.56 204.00 7.48 230.27 5.53 247.88 5.10 207.69 6.19
October223.80 5.66 238.53 4.53 204.91 7.38 231.85 5.57 250.64 5.56 207.75 5.58
November224.78 5.60 239.60 4.51 205.79 7.27 231.18 5.38 249.41 5.41 207.81 5.33
December225.71 5.51 240.66 4.51 206.54 7.05 231.53 5.03 249.29 5.38 208.76 4.49
January226.66 5.44 241.94 4.70 207.07 6.57 234.34 5.15 251.86 6.53 211.88 3.10
February227.65 5.41 243.29 4.95 207.60 6.11 234.40 5.31 251.93 6.84 211.92 3.07
March228.65 5.39 244.65 5.20 208.14 5.67 235.29 5.39 253.32 6.89 212.18 3.18
April229.67 5.38 246.02 5.46 208.71 5.25 235.58 5.47 253.60 6.94 212.48 3.30
May230.73 5.41 247.44 5.75 209.29 4.89 232.83 5.76 248.94 7.37 212.18 3.44
June231.82 5.44 248.90 6.02 209.92 4.57 233.86 5.94 250.35 7.51 212.72 3.67
July 232.86 5.45 250.28 6.23 210.53 4.29 236.61 5.57 254.20 6.95 214.05 3.53
August 233.97 5.50 251.75 6.48 211.17 4.03 239.92 5.89 259.60 7.32 214.68 3.75
September 235.15 5.55 253.38 6.72 211.77 3.81 244.36 6.12 267.38 7.87 214.84 3.44
Source: Bangladesh Bureau of Statistics, Ministry of Planning.
2017-18
Consumer Price Index (CPI) and Rate of Inflation at National Level (Base : FY2005-06=100)
Twelve-Month Average Basis Point to Point Basis
General Food Non-food General Food Non-food
2016-17
4.9
5.0
5.2
5.3
5.5
5.6
5.8
5.9
6.1
6.2
Sep
.16
Oct.
16
No
v.1
6
Dec.1
6
Jan
.17
Feb
.17
Mar.
17
Ap
r.1
7
May
17
Jun
.17
Jul.
17
Au
g.1
7
Sep
.17
Per
cen
tage
CPI(Base:FY2005-06=100) Inflation
12 month average Point to point

6
Cash in
tills+balances with
SBL,
4.88%
CRR,
24.38%
Excess Reserve,
3.43%
Balances with BB
(Foreign
Currency),
2.85%
Unencumbered
approved
securities,
64.46%
Sectoral distribution of total liquid assets
(as of end August 2017)
4. Liquidity position of the scheduled banks
Total liquid assets of the scheduled banks stood at Taka 253424.13 crore as of end August 2017 which was Taka
267194.31 crore at the end of June 2017. The minimum required liquid assets of the scheduled banks was Taka
166961.01 crore as of end August 2017.
Sectoral distribution of total liquid assets as of end August 2017 in the form of cash in tills & balances with Sonali
Bank Ltd., CRR, excess reserves, balances with Bangladesh Bank (foreign currency) and un-encumbered approved
securities were 4.88 percent, 24.38 percent, 3.43 percent, 2.85 percent, and 64.46 percent respectively of total liquid
assets.
250
550
850
1150
1450
1750
2050
2350
2650
2950
3250
Au
g.1
6
Sep
.16
Oct
.16
No
v.1
6
Dec
.16
Jan
.17
Feb
.17
Mar
.17
Ap
r.1
7
May
.17
Jun
.17
Jul.
17
Au
g.1
7
Bil
lio
n tak
a
Liquid assets & minimum required liquidity
Liquid assets
Minimum required liquid assets
As of end
June, 2017As of end August 2017
P
Foreign
Currency
1 2 3 4b 5 6=(3+4a+4b+5) 7
CRR* Excess Reserve
(un-invested cash)
State-owned Banks 109029.15 1494.58 16867.15 1085.22 247.27 78935.88 98630.11 50274.40
Specialised Banks 1692.35 0.00 1688.66 0.00 33.35 0.00 1722.01 1688.66
Private Banks (Other
than Islamic)107163.15 8006.62 28502.05 1097.48 3006.86 63399.05 104012.06 84927.60
Islamic Banks 29187.52 2219.07 12096.68 5813.89 502.78 7935.64 28568.05 22332.33
Foreign Banks 20122.14 641.79 2618.78 706.20 3431.47 13093.65 20491.90 7738.03
Total 267194.31 12362.06 61773.32 8702.79 7221.73 163364.23 253424.13 166961.01
(+4.88) (+24.38) (+3.43) (+2.85) (+64.46)
Note :- Figures in brackets indicate sectoral share in the total liquid assets. P=provisional, R= Revised.
1/ Balances with Bangladesh Bank in local currency = CRR + Excess Reserve.
2/ Minimum required liquid assets is the sum of CRR and SLR.
Comment: The data shown on the above table are based on the regulatiry purpose of Bangladesh Bank.
4a
*CRR is calculated @ 6.5% of total demand and time liabilities.
(In crore Taka)
Bank GroupTotal
Liquid Assets
Cash in tills +
balances with
Sonali Bank Ltd.
Balances with
Unencumbered
approved securities
Total
Liquid
Assets
Minimum
Required Liquid
Assets2/
Bangladesh Bank1/
Local Currency
Source : Department of Offsite Supervision, BB.
7
5. Financial sector prices: a) Weighted average yields on bills and bonds
1/:
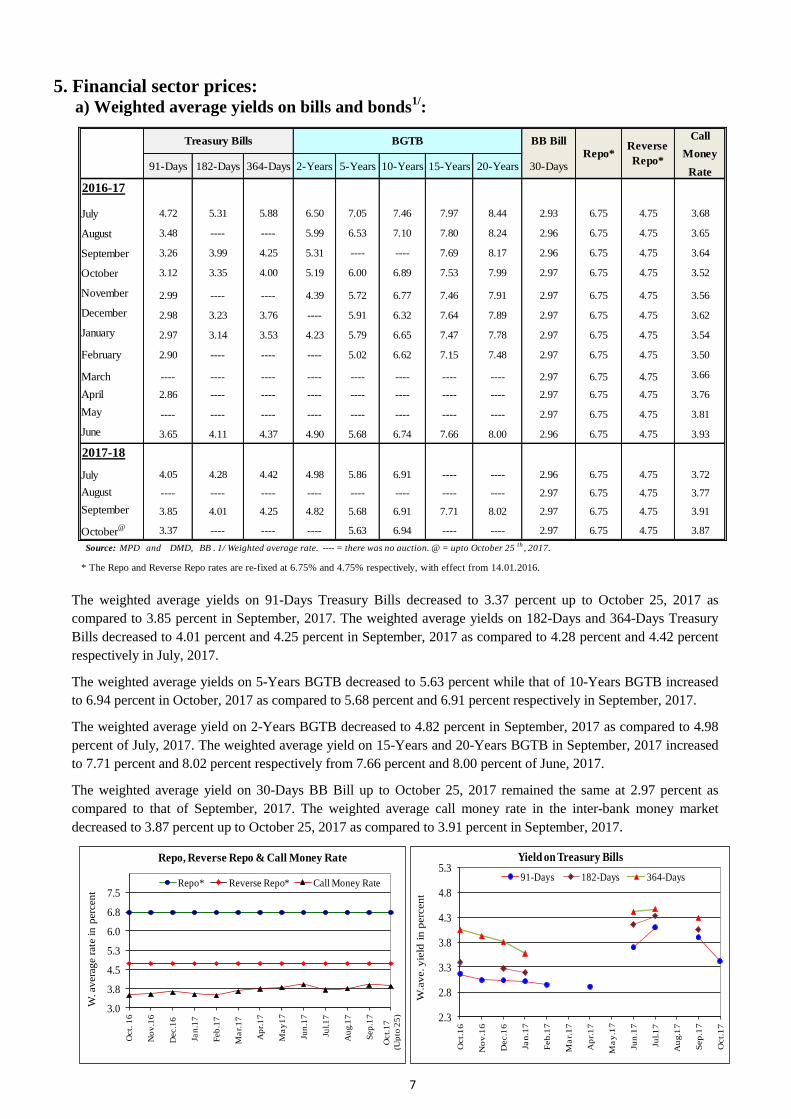
The weighted average yields on 91-Days Treasury Bills decreased to 3.37 percent up to October 25, 2017 as
compared to 3.85 percent in September, 2017. The weighted average yields on 182-Days and 364-Days Treasury
Bills decreased to 4.01 percent and 4.25 percent in September, 2017 as compared to 4.28 percent and 4.42 percent
respectively in July, 2017.
The weighted average yields on 5-Years BGTB decreased to 5.63 percent while that of 10-Years BGTB increased
to 6.94 percent in October, 2017 as compared to 5.68 percent and 6.91 percent respectively in September, 2017.
The weighted average yield on 2-Years BGTB decreased to 4.82 percent in September, 2017 as compared to 4.98
percent of July, 2017. The weighted average yield on 15-Years and 20-Years BGTB in September, 2017 increased
to 7.71 percent and 8.02 percent respectively from 7.66 percent and 8.00 percent of June, 2017.
The weighted average yield on 30-Days BB Bill up to October 25, 2017 remained the same at 2.97 percent as
compared to that of September, 2017. The weighted average call money rate in the inter-bank money market
decreased to 3.87 percent up to October 25, 2017 as compared to 3.91 percent in September, 2017.
BB Bill
91-Days 182-Days 364-Days 2-Years 5-Years 10-Years 15-Years 20-Years 30-Days
2016-17
July 4.72 5.31 5.88 6.50 7.05 7.46 7.97 8.44 2.93 6.75 4.75 3.68
August 3.48 ---- ---- 5.99 6.53 7.10 7.80 8.24 2.96 6.75 4.75 3.65
September 3.26 3.99 4.25 5.31 ---- ---- 7.69 8.17 2.96 6.75 4.75 3.64
October 3.12 3.35 4.00 5.19 6.00 6.89 7.53 7.99 2.97 6.75 4.75 3.52
November 2.99 ---- ---- 4.39 5.72 6.77 7.46 7.91 2.97 6.75 4.75 3.56
December 2.98 3.23 3.76 ---- 5.91 6.32 7.64 7.89 2.97 6.75 4.75 3.62
January 2.97 3.14 3.53 4.23 5.79 6.65 7.47 7.78 2.97 6.75 4.75 3.54
February 2.90 ---- ---- ---- 5.02 6.62 7.15 7.48 2.97 6.75 4.75 3.50
March ---- ---- ---- ---- ---- ---- ---- ---- 2.97 6.75 4.75 3.66
April 2.86 ---- ---- ---- ---- ---- ---- ---- 2.97 6.75 4.75 3.76
May ---- ---- ---- ---- ---- ---- ---- ---- 2.97 6.75 4.75 3.81
June 3.65 4.11 4.37 4.90 5.68 6.74 7.66 8.00 2.96 6.75 4.75 3.93
2017-18
July 4.05 4.28 4.42 4.98 5.86 6.91 ---- ---- 2.96 6.75 4.75 3.72
August ---- ---- ---- ---- ---- ---- ---- ---- 2.97 6.75 4.75 3.77
September 3.85 4.01 4.25 4.82 5.68 6.91 7.71 8.02 2.97 6.75 4.75 3.91
October@ 3.37 ---- ---- ---- 5.63 6.94 ---- ---- 2.97 6.75 4.75 3.87
Source: MPD and DMD, BB . 1/ Weighted average rate. ---- = there was no auction. @ = upto October 25th
, 2017.
Call
Money
Rate
Treasury Bills BGTB
Repo*Reverse
Repo*
* The Repo and Reverse Repo rates are re-fixed at 6.75% and 4.75% respectively, with effect from 14.01.2016.
3.0
3.8
4.5
5.3
6.0
6.8
7.5
Oct.
16
No
v.1
6
Dec.1
6
Jan
.17
Feb
.17
Ma
r.1
7
Ap
r.1
7
Ma
y1
7
Jun
.17
Jul.1
7
Au
g.1
7
Sep
.17
Oct.
17
(Up
to 2
5)
W. avera
ge r
ate
in p
erc
ent
Repo, Reverse Repo & Call Money Rate
Repo* Reverse Repo* Call Money Rate
u
2.3
2.8
3.3
3.8
4.3
4.8
5.3
Oct.
16
No
v.1
6
Dec.1
6
Jan
.17
Feb
.17
Ma
r.1
7
Ap
r.1
7
Ma
y.1
7
Jun
.17
Jul.1
7
Au
g.1
7
Sep
.17
Oct.
17
W.a
ve. yie
ld in p
erc
ent
Yield on Treasury Bills
91-Days 182-Days 364-Days
8
b) Interest rate spread:
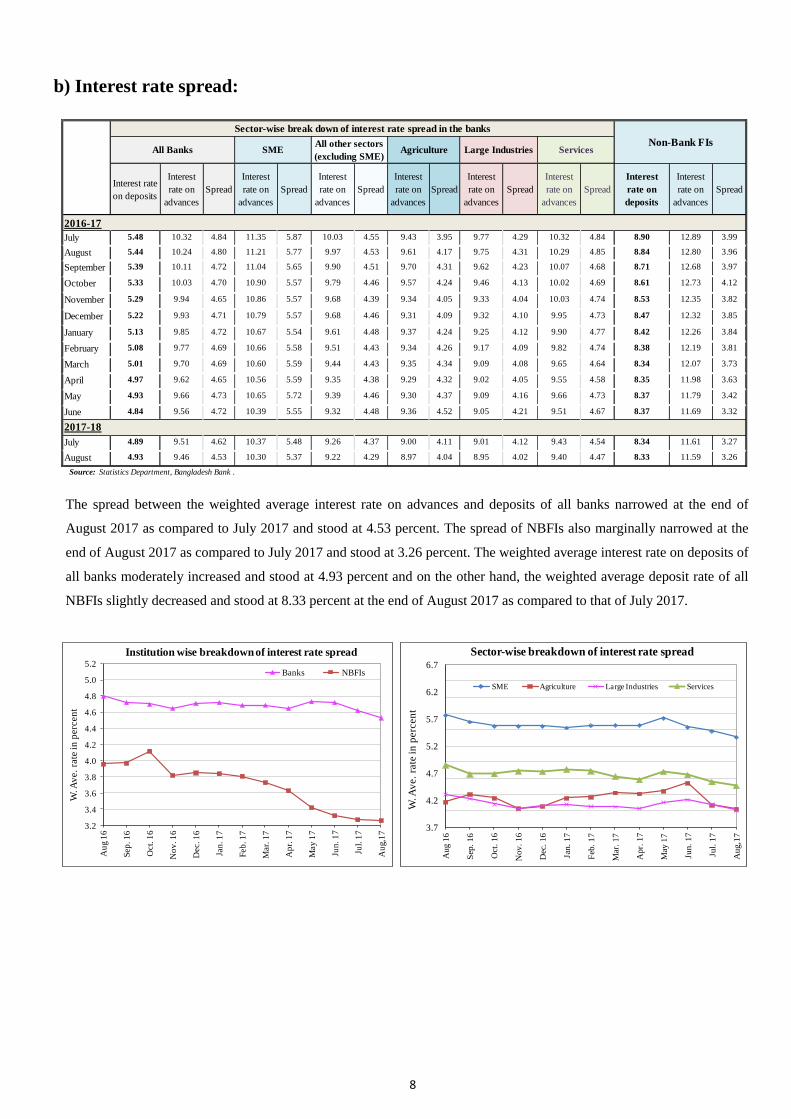
The spread between the weighted average interest rate on advances and deposits of all banks narrowed at the end of
August 2017 as compared to July 2017 and stood at 4.53 percent. The spread of NBFIs also marginally narrowed at the
end of August 2017 as compared to July 2017 and stood at 3.26 percent. The weighted average interest rate on deposits of
all banks moderately increased and stood at 4.93 percent and on the other hand, the weighted average deposit rate of all
NBFIs slightly decreased and stood at 8.33 percent at the end of August 2017 as compared to that of July 2017.
3.2
3.4
3.6
3.8
4.0
4.2
4.4
4.6
4.8
5.0
5.2
Au
g 1
6
Sep
. 1
6
Oct.
16
No
v. 1
6
Dec. 1
6
Jan
. 1
7
Feb
. 1
7
Mar.
17
Ap
r. 1
7
May
17
Jun
. 1
7
Jul.
17
Au
g,1
7
W. A
ve.
rate
in
perc
en
t
Institution wise breakdown of interest rate spread
Banks NBFIs
3.7
4.2
4.7
5.2
5.7
6.2
6.7
Aug 1
6
Sep
. 16
Oct
. 16
Nov.
16
Dec
. 16
Jan.
17
Feb
. 17
Mar
. 17
Apr.
17
May
17
Jun.
17
Jul.
17
Aug,1
7
W. A
ve.
rate
in
perc
en
t
Sector-wise breakdown of interest rate spread
SME Agriculture Large Industries Services
Interest rate
on deposits
Interest
rate on
advances
Spread
Interest
rate on
advances
Spread
Interest
rate on
advances
Spread
Interest
rate on
advances
Spread
Interest
rate on
advances
Spread
Interest
rate on
advances
Spread
Interest
rate on
deposits
Interest
rate on
advances
Spread
2016-17
July 5.48 10.32 4.84 11.35 5.87 10.03 4.55 9.43 3.95 9.77 4.29 10.32 4.84 8.90 12.89 3.99
August 5.44 10.24 4.80 11.21 5.77 9.97 4.53 9.61 4.17 9.75 4.31 10.29 4.85 8.84 12.80 3.96
September 5.39 10.11 4.72 11.04 5.65 9.90 4.51 9.70 4.31 9.62 4.23 10.07 4.68 8.71 12.68 3.97
October 5.33 10.03 4.70 10.90 5.57 9.79 4.46 9.57 4.24 9.46 4.13 10.02 4.69 8.61 12.73 4.12
November 5.29 9.94 4.65 10.86 5.57 9.68 4.39 9.34 4.05 9.33 4.04 10.03 4.74 8.53 12.35 3.82
December 5.22 9.93 4.71 10.79 5.57 9.68 4.46 9.31 4.09 9.32 4.10 9.95 4.73 8.47 12.32 3.85
January 5.13 9.85 4.72 10.67 5.54 9.61 4.48 9.37 4.24 9.25 4.12 9.90 4.77 8.42 12.26 3.84
February 5.08 9.77 4.69 10.66 5.58 9.51 4.43 9.34 4.26 9.17 4.09 9.82 4.74 8.38 12.19 3.81
March 5.01 9.70 4.69 10.60 5.59 9.44 4.43 9.35 4.34 9.09 4.08 9.65 4.64 8.34 12.07 3.73
April 4.97 9.62 4.65 10.56 5.59 9.35 4.38 9.29 4.32 9.02 4.05 9.55 4.58 8.35 11.98 3.63
May 4.93 9.66 4.73 10.65 5.72 9.39 4.46 9.30 4.37 9.09 4.16 9.66 4.73 8.37 11.79 3.42
June 4.84 9.56 4.72 10.39 5.55 9.32 4.48 9.36 4.52 9.05 4.21 9.51 4.67 8.37 11.69 3.32
2017-18
July 4.89 9.51 4.62 10.37 5.48 9.26 4.37 9.00 4.11 9.01 4.12 9.43 4.54 8.34 11.61 3.27
August 4.93 9.46 4.53 10.30 5.37 9.22 4.29 8.97 4.04 8.95 4.02 9.40 4.47 8.33 11.59 3.26
Source: Statistics Department, Bangladesh Bank .
Non-Bank FIsAll other sectors
(excluding SME)Agriculture Large Industries ServicesSME
Sector-wise break down of interest rate spread in the banks
All Banks

9
6. Capital market developments:
The DSE Broad Index (DSEX) at the end of
September 2017 stood higher at 6092.84 compared to
that of end August 2017. The total market
capitalization of all shares and debentures of the listed
securities at the end of September 2017 also stood
higher at Taka 407208.30 crore from Taka 402090.80
crore at the end of August 2017.
3300
3650
4000
4350
4700
5050
5400
5750
6100
6450
2000
2300
2600
2900
3200
3500
3800
4100
4400
Sep
.16
Oct.
16
No
v.1
6
Dec.1
6
Jan
.17
Feb
.17
Ma
r.1
7
Ap
r.1
7
Ma
y.1
7
Jun
e.1
7
July
.17
Au
g.1
6
Sep
.17
Trends in market capitalisation and indices of DSE
Capitalisation in billion taka (LHS)
DSEX (RHS)
General Index /
Calender Issued Capital Market Turnover during DSE
Year and Debentures Capitalisation the Year Broad Index
2010 445 66436.00 347250.20 400991.28 8290.41
2011 501 87890.50 261673.00 156055.63 5257.61
2012 515 94987.60 240356.00 100108.49 4219.31
2013 529 99978.50 264779.00 95269.21 4266.55
2014 546 105492.60 325925.00 118852.15 4864.96
2015 559 110608.10 315976.00 103139.86 4629.64
2016 560 114530.00 341244.10 119157.12 5036.05
Issued Capital
and Debentures
Market
Capitalisation
Turnover during
the month
Janaury'17 560 114693.00 366811.50 34232.02 5468.34
February'17 562 114910.10 373930.40 19404.84 5612.70
March'17 562 115255.20 379830.60 21770.14 5719.61
April'17 562 115607.00 371092.80 15317.78 5475.55
May'17 562 115791.00 368301.90 12258.22 5403.12
June'17 563 116551.10 380100.10 10156.38 5656.05
July'17 564 117018.70 396133.80 20929.46 5860.65
August'17 564 117554.50 402090.80 19589.24 6006.43
September'17 564 117805.40 407208.30 19944.12 6092.84
Source : Dhaka Stock Exchange
Annual capital market developments in DSE
Enlisted issues
(Incl. Mutual
Funds/Deb.)
(Taka in crore )
Monthly capital market developments in DSE
(Taka in crore)
End MonthDSE Broad Index
(DSEX)
Enlisted issues
(Incl. Mutual
Funds/Deb.)
10
7. Agricultural credit and non-farm rural credit
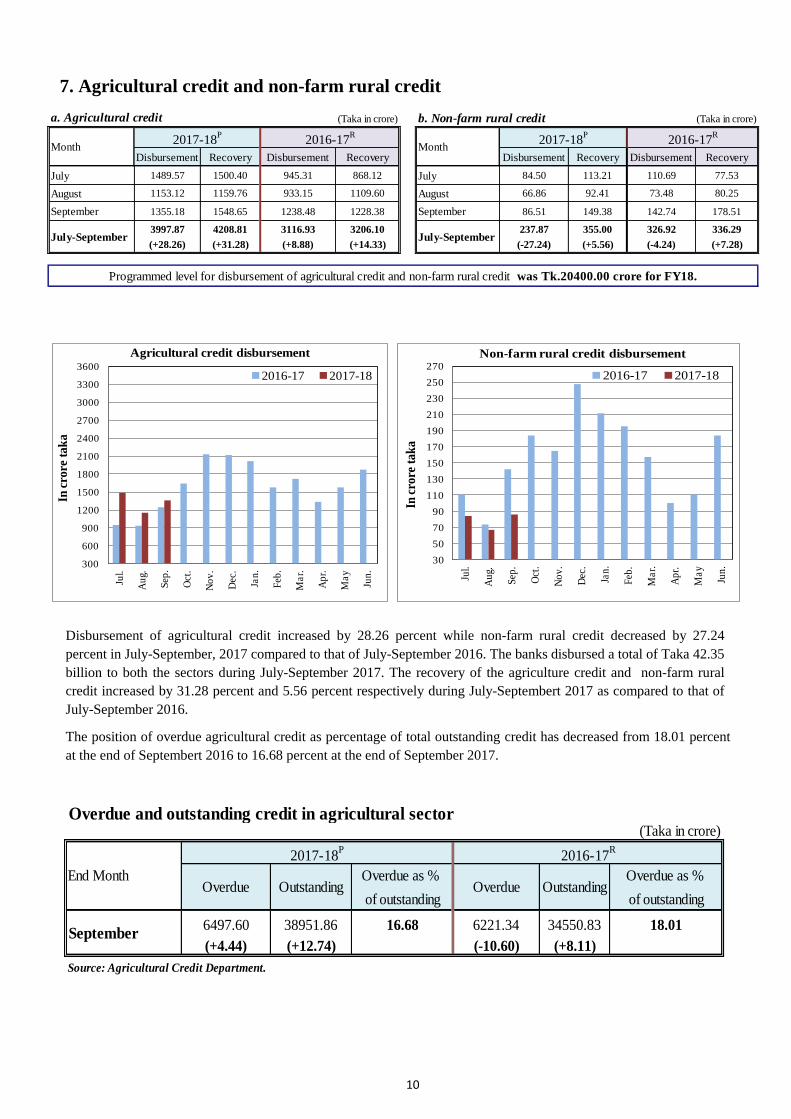
Disbursement of agricultural credit increased by 28.26 percent while non-farm rural credit decreased by 27.24
percent in July-September, 2017 compared to that of July-September 2016. The banks disbursed a total of Taka 42.35
billion to both the sectors during July-September 2017. The recovery of the agriculture credit and non-farm rural
credit increased by 31.28 percent and 5.56 percent respectively during July-Septembert 2017 as compared to that of
July-September 2016.
The position of overdue agricultural credit as percentage of total outstanding credit has decreased from 18.01 percent
at the end of Septembert 2016 to 16.68 percent at the end of September 2017.
a. Agricultural credit (Taka in crore) b. Non-farm rural credit (Taka in crore)
Disbursement Recovery Disbursement Recovery Disbursement Recovery Disbursement Recovery
July 1489.57 1500.40 945.31 868.12 July 84.50 113.21 110.69 77.53
August 1153.12 1159.76 933.15 1109.60 August 66.86 92.41 73.48 80.25
September 1355.18 1548.65 1238.48 1228.38 September 86.51 149.38 142.74 178.51
3997.87 4208.81 3116.93 3206.10 237.87 355.00 326.92 336.29
(+28.26) (+31.28) (+8.88) (+14.33) (-27.24) (+5.56) (-4.24) (+7.28)
Programmed level for disbursement of agricultural credit and non-farm rural credit was Tk.20400.00 crore for FY18.
July-September July-September
Month2017-18
P2016-17
R
Month2017-18
P2016-17
R
300
600
900
1200
1500
1800
2100
2400
2700
3000
3300
3600
Jul.
Au
g.
Sep
.
Oct
.
No
v.
Dec
.
Jan
.
Feb
.
Ma
r.
Ap
r.
Ma
y
Jun
.
In c
rore
ta
ka
Agricultural credit disbursement
2016-17 2017-18
30
50
70
90
110
130
150
170
190
210
230
250
270
Jul.
Au
g.
Sep
.
Oct
.
No
v.
Dec
.
Jan
.
Feb
.
Ma
r.
Ap
r.
Ma
y
Jun
.
In c
rore
ta
ka
Non-farm rural credit disbursement
2016-17 2017-18
(Taka in crore)
Overdue as % Overdue as %
of outstanding of outstanding
6497.60 38951.86 16.68 6221.34 34550.83 18.01
(+4.44) (+12.74) (-10.60) (+8.11)
Source: Agricultural Credit Department.
Overdue and outstanding credit in agricultural sector
End Month
2017-18P
2016-17R
Overdue Outstanding Overdue Outstanding
September
11
8. Industrial and SME loans
a) Industrial term loans
The disbursement of total industrial term
loans during April-June, 2017 decreased
by 17.93 percent and stood at Taka
13751.85 crore as compared to Taka
16755.64 crore during April-June, 2016.
The recovery of industrial term loans also
decreased by 10.38 percent and stood at
Taka 11445.21 crore during April-June,
2017 against Taka 12770.65 crore during
the same period of the previous fiscal year.
Outstanding amount of industrial term
loans at the end of June, 2017 stood at
Taka 170988.19. At the same time the
overdue of industrial term loans is
25257.68 crore.
b) Outstanding position of SME loans
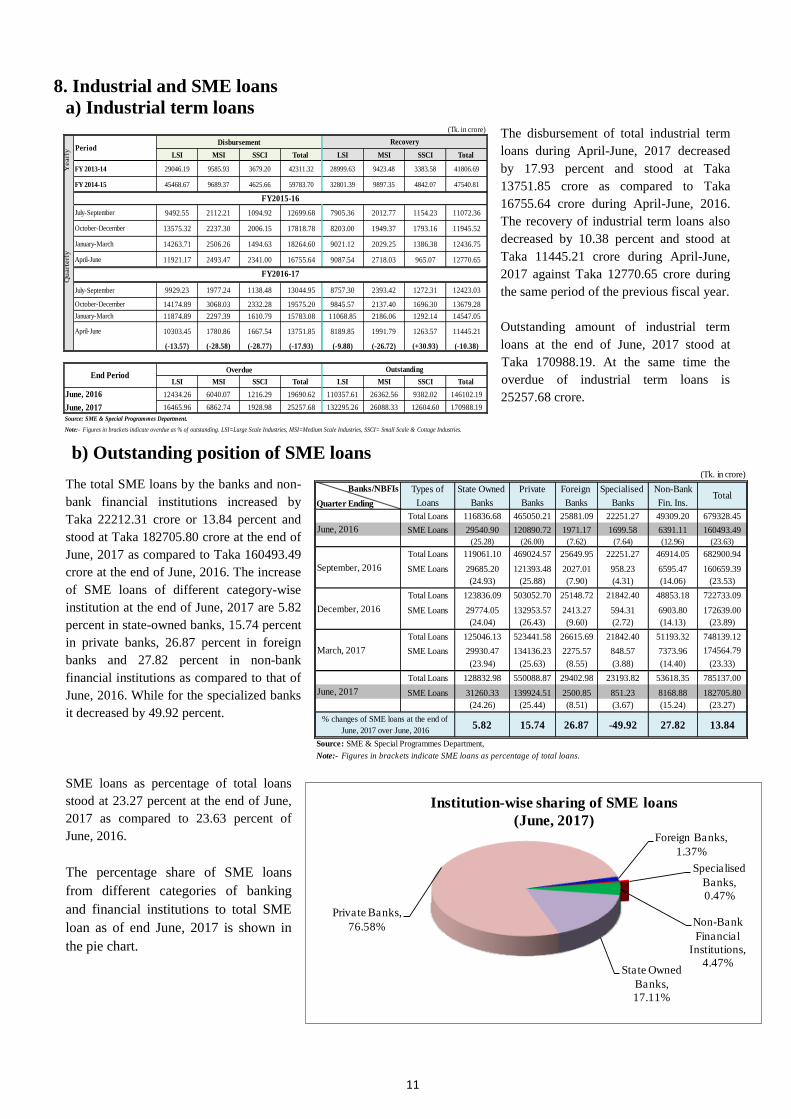
The total SME loans by the banks and non-
bank financial institutions increased by
Taka 22212.31 crore or 13.84 percent and
stood at Taka 182705.80 crore at the end of
June, 2017 as compared to Taka 160493.49
crore at the end of June, 2016. The increase
of SME loans of different category-wise
institution at the end of June, 2017 are 5.82
percent in state-owned banks, 15.74 percent
in private banks, 26.87 percent in foreign
banks and 27.82 percent in non-bank
financial institutions as compared to that of
June, 2016. While for the specialized banks
it decreased by 49.92 percent.
SME loans as percentage of total loans
stood at 23.27 percent at the end of June,
2017 as compared to 23.63 percent of
June, 2016.
The percentage share of SME loans
from different categories of banking
and financial institutions to total SME
loan as of end June, 2017 is shown in
the pie chart.
State Owned
Banks,
17.11%
Private Banks,
76.58%
Foreign Banks,
1.37%
Specialised
Banks,
0.47%
Non-Bank
Financial
Institutions,
4.47%
Institution-wise sharing of SME loans
(June, 2017)
(Tk. in crore)
Types of State Owned Private Foreign Specialised Non-Bank
Loans Banks Banks Banks Banks Fin. Ins.
Total Loans 116836.68 465050.21 25881.09 22251.27 49309.20 679328.45
SME Loans 29540.90 120890.72 1971.17 1699.58 6391.11 160493.49
(25.28) (26.00) (7.62) (7.64) (12.96) (23.63)
Total Loans 119061.10 469024.57 25649.95 22251.27 46914.05 682900.94
SME Loans 29685.20 121393.48 2027.01 958.23 6595.47 160659.39
(24.93) (25.88) (7.90) (4.31) (14.06) (23.53)
Total Loans 123836.09 503052.70 25148.72 21842.40 48853.18 722733.09
SME Loans 29774.05 132953.57 2413.27 594.31 6903.80 172639.00
(24.04) (26.43) (9.60) (2.72) (14.13) (23.89)
Total Loans 125046.13 523441.58 26615.69 21842.40 51193.32 748139.12
SME Loans 29930.47 134136.23 2275.57 848.57 7373.96 174564.79
(23.94) (25.63) (8.55) (3.88) (14.40) (23.33)
Total Loans 128832.98 550088.87 29402.98 23193.82 53618.35 785137.00
SME Loans 31260.33 139924.51 2500.85 851.23 8168.88 182705.80
(24.26) (25.44) (8.51) (3.67) (15.24) (23.27)
5.82 15.74 26.87 -49.92 27.82 13.84
Note:- Figures in brackets indicate SME loans as percentage of total loans.
March, 2017
June, 2017
% changes of SME loans at the end of
June, 2017 over June, 2016
Source: SME & Special Programmes Department,
Banks/NBFIsTotal
Quarter Ending
June, 2016
September, 2016
December, 2016
(Tk. in crore)
Disbursement
LSI MSI SSCI Total LSI MSI SSCI Total
FY 2013-14 29046.19 9585.93 3679.20 42311.32 28999.63 9423.48 3383.58 41806.69
FY 2014-15 45468.67 9689.37 4625.66 59783.70 32801.39 9897.35 4842.07 47540.81
9492.55 2112.21 1094.92 12699.68 7905.36 2012.77 1154.23 11072.36
13575.32 2237.30 2006.15 17818.78 8203.00 1949.37 1793.16 11945.52
14263.71 2506.26 1494.63 18264.60 9021.12 2029.25 1386.38 12436.75
11921.17 2493.47 2341.00 16755.64 9087.54 2718.03 965.07 12770.65
July-September 9929.23 1977.24 1138.48 13044.95 8757.30 2393.42 1272.31 12423.03
14174.89 3068.03 2332.28 19575.20 9845.57 2137.40 1696.30 13679.28
11874.89 2297.39 1610.79 15783.08 11068.85 2186.06 1292.14 14547.05
10303.45 1780.86 1667.54 13751.85 8189.85 1991.79 1263.57 11445.21
(-13.57) (-28.58) (-28.77) (-17.93) (-9.88) (-26.72) (+30.93) (-10.38)
Overdue
LSI MSI SSCI Total LSI MSI SSCI Total
June, 2016 12434.26 6040.07 1216.29 19690.62 110357.61 26362.56 9382.02 146102.19
16465.96 6862.74 1928.98 25257.68 132295.26 26088.33 12604.60 170988.19
Note:- Figures in brackets indicate overdue as % of outstanding. LSI=Large Scale Industries, MSI=Medium Scale Industries, SSCI= Small Scale & Cottage Industries.
Yearl
y
July-September
FY2015-16
PeriodRecovery
April-June
FY2016-17
October-December
January-March
Source: SME & Special Programmes Department.
October-December
January-March
OutstandingEnd Period
April-June
June, 2017
Qu
art
erl
y
12
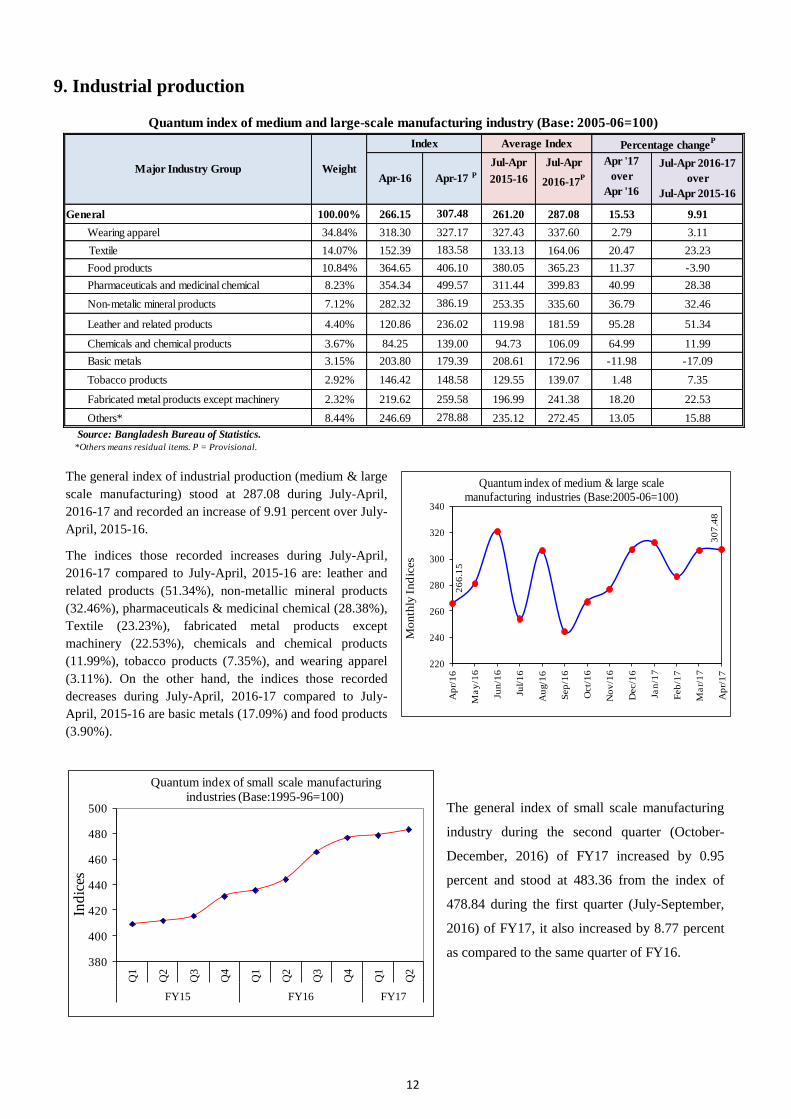
9. Industrial production
The general index of industrial production (medium & large
scale manufacturing) stood at 287.08 during July-April,
2016-17 and recorded an increase of 9.91 percent over July-
April, 2015-16.
The indices those recorded increases during July-April,
2016-17 compared to July-April, 2015-16 are: leather and
related products (51.34%), non-metallic mineral products
(32.46%), pharmaceuticals & medicinal chemical (28.38%),
Textile (23.23%), fabricated metal products except
machinery (22.53%), chemicals and chemical products
(11.99%), tobacco products (7.35%), and wearing apparel
(3.11%). On the other hand, the indices those recorded
decreases during July-April, 2016-17 compared to July-
April, 2015-16 are basic metals (17.09%) and food products
(3.90%).
The general index of small scale manufacturing
industry during the second quarter (October-
December, 2016) of FY17 increased by 0.95
percent and stood at 483.36 from the index of
478.84 during the first quarter (July-September,
2016) of FY17, it also increased by 8.77 percent
as compared to the same quarter of FY16.
26
6.1
5
30
7.4
8
220
240
260
280
300
320
340
Ap
r/1
6
Ma
y/1
6
Jun
/16
Jul/
16
Au
g/1
6
Sep
/16
Oct/
16
No
v/1
6
Dec/1
6
Jan
/17
Feb
/17
Ma
r/1
7
Ap
r/1
7
Month
ly I
nd
ices
Quantum index of medium & large scale manufacturing industries (Base:2005-06=100)
Jul-Apr Jul-Apr
2015-16 2016-17P
General 100.00% 266.15 261.20 287.08 15.53 9.91
Wearing apparel 34.84% 318.30 327.43 337.60 2.79 3.11
Textile 14.07% 152.39 133.13 164.06 20.47 23.23
Food products 10.84% 364.65 380.05 365.23 11.37 -3.90
Pharmaceuticals and medicinal chemical 8.23% 354.34 311.44 399.83 40.99 28.38
Non-metalic mineral products 7.12% 282.32 253.35 335.60 36.79 32.46
Leather and related products 4.40% 120.86 119.98 181.59 95.28 51.34
Chemicals and chemical products 3.67% 84.25 94.73 106.09 64.99 11.99
Basic metals 3.15% 203.80 208.61 172.96 -11.98 -17.09
Tobacco products 2.92% 146.42 129.55 139.07 1.48 7.35
Fabricated metal products except machinery 2.32% 219.62 196.99 241.38 18.20 22.53
Others* 8.44% 246.69 235.12 272.45 13.05 15.88
Source: Bangladesh Bureau of Statistics.
*Others means residual items. P = Provisional.
148.58
259.58
278.88
406.10
499.57
386.19
236.02
139.00
Quantum index of medium and large-scale manufacturing industry (Base: 2005-06=100)
Major Industry Group Weight
Average Index Percentage changeP
Apr-16 Apr-17
Apr '17
over
Apr '16
Jul-Apr 2016-17
over
Jul-Apr 2015-16
Index
P
307.48
327.17
183.58
179.39
380
400
420
440
460
480
500
Q1
Q2
Q3
Q4
Q1
Q2
Q3
Q4
Q1
Q2
FY15 FY16 FY17
Ind
ices
Quantum index of small scale manufacturing industries (Base:1995-96=100)

13
10. Exports
Merchandise Commodity export in September 2017 decreased by USD 0.19 billion or 8.67 percent to USD
2.03 billion from USD 3.64 billion in August 2017 according to EPB data. It was 26.72 percent lower than the
target of 2.78 billion for the said month.
Total merchandise commodity export during July-September 2017-18 increased by USD 0.61 billion or 7.61
percent to USD 8.66 billion compared to USD 8.05 billion during July-September 2016-17.
Latest available data on category-wise breakdown of exports are shown in the next page.
1800
2050
2300
2550
2800
3050
3300
3550
3800
4050
Jul.
Au
g.
Sep
.
Oct.
No
v.
Dec.
Jan
.
Feb
.
Mar.
Ap
r.
May
.
Jun
.
(Mil
lio
n U
SD
)
Export performance: Value Trends
2016-17 2016-17R* 2017-18
A. Annual exports (US$ in million)
2011-12 2012-13 2013-14 2014-15 2015-16 2016-17
24301.90 27027.36 30186.62 31208.94 34257.18 34846.84
(+5.99) (+11.22) (+11.69) (+3.39) (+9.77) (+1.72)
B. Monthly exports
January
February
March
July-June
July-September
3056.09 3592.97
2726.12
(+1.72) (+9.77)
December
3185.633312.04
June
2016-17R 2015-16
July
August
Month
2534.31 2625.93
September
3303.50 2758.41
34846.84 34257.18
3204.073107.13
April 2775.69 2682.05
2854.22
3109.76 2831.42
May 3069.04 3026.99
2374.652241.01
October
November 2749.342899.32
2712.83 2371.50
Export target was set USD 37500.00 million for FY 2017-18 of which export target for Juy-September, 2017
was USD 8916.00 million.
8662.73
Month 2017-18P*
2016-17*
July
August
Source : Export Promotion Bureau (EPB). R=Revised; P=Provisional.
8050.11
*Revised according to the revised definition (Primary Commodities+Manufactured Commodoties) of commodity exports by EPB.
Note:- Figures in brackets indicate percentage changes over the corresponding period of the preceding year.
September
(+7.61) (+3.75)
2987.66
3640.94
2034.13
2534.31
3288.65
2227.15
-15
-10
-5
0
5
10
15
20
25
30
Jul.
Au
g.
Sep
.
Oct
.
No
v.
Dec.
Jan
.
Feb
.
Mar
.
Ap
r.
May
Jun
.
Per
cen
tage
Export growth-cumulative
2016-17 2016-17R* 2017-18
14
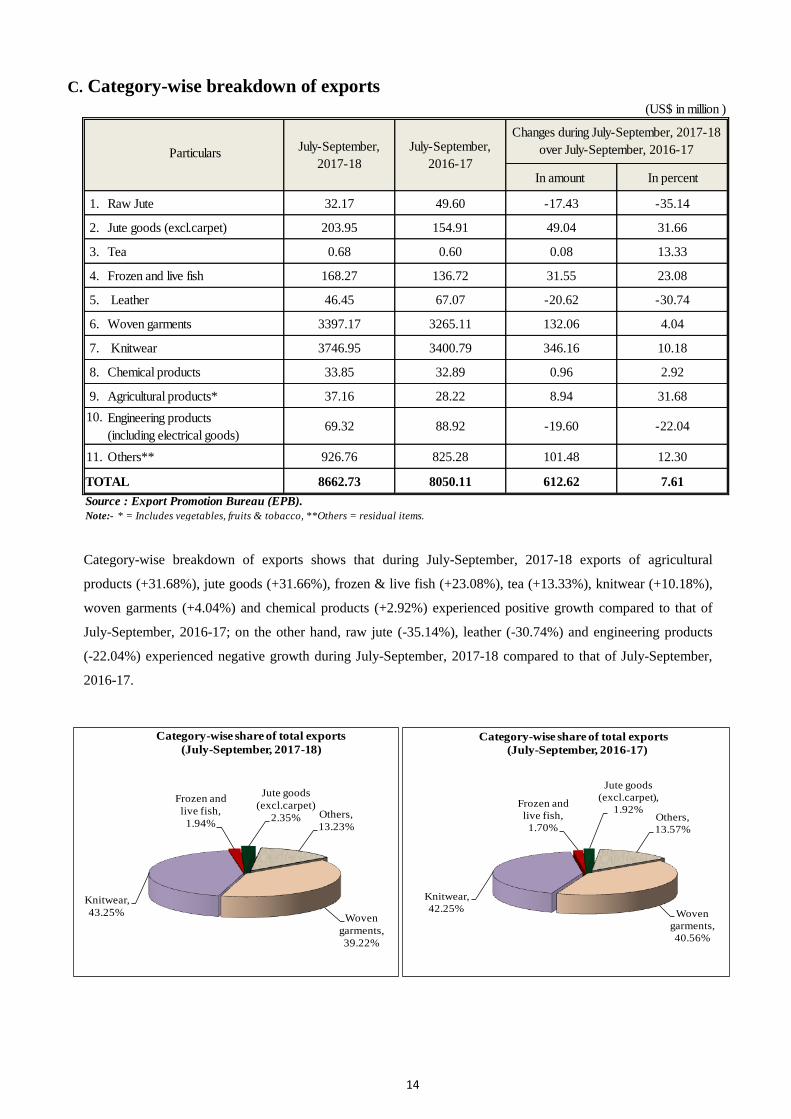
C. Category-wise breakdown of exports
Category-wise breakdown of exports shows that during July-September, 2017-18 exports of agricultural
products (+31.68%), jute goods (+31.66%), frozen & live fish (+23.08%), tea (+13.33%), knitwear (+10.18%),
woven garments (+4.04%) and chemical products (+2.92%) experienced positive growth compared to that of
July-September, 2016-17; on the other hand, raw jute (-35.14%), leather (-30.74%) and engineering products
(-22.04%) experienced negative growth during July-September, 2017-18 compared to that of July-September,
2016-17.
Woven
garments,
39.22%
Knitwear,
43.25%
Frozen and
live fish,
1.94%
Jute goods
(excl.carpet)
2.35% Others,
13.23%
Category-wise share of total exports
(July-September, 2017-18)
Woven
garments,
40.56%
Knitwear,
42.25%
Frozen and
live fish,
1.70%
Jute goods
(excl.carpet),
1.92%Others,
13.57%
Category-wise share of total exports
(July-September, 2016-17)
(US$ in million )
Particulars
In amount In percent
1. Raw Jute 32.17 49.60 -17.43 -35.14
2. Jute goods (excl.carpet) 203.95 154.91 49.04 31.66
3. Tea 0.68 0.60 0.08 13.33
4. Frozen and live fish 168.27 136.72 31.55 23.08
5. Leather 46.45 67.07 -20.62 -30.74
6. Woven garments 3397.17 3265.11 132.06 4.04
7. Knitwear 3746.95 3400.79 346.16 10.18
8. Chemical products 33.85 32.89 0.96 2.92
9. Agricultural products* 37.16 28.22 8.94 31.68
10. Engineering products
(including electrical goods)69.32 88.92 -19.60 -22.04
11. Others** 926.76 825.28 101.48 12.30
TOTAL 8662.73 8050.11 612.62 7.61
Source : Export Promotion Bureau (EPB).
Note:- * = Includes vegetables, fruits & tobacco, **Others = residual items.
July-September,
2017-18
July-September,
2016-17
Changes during July-September, 2017-18
over July-September, 2016-17

15
11. Imports
a) Custom based import, import LCs settlement and LCs opening
Custom based import during July-August, 2017-18 stood
higher by USD 2.29 billion or 33.97 percent and stood at
USD 9.03 billion against USD 6.74 billion during July-
August, 2016-17.
Settlement of import LCs during July-August, 2017-18
increased by 12.33 percent and stood at USD 8.04 billion
against USD 7.16 billion during July-August, 2016-17.
Fresh opening of import LCs during July-August, 2017-
18 increased by 38.78 percent and stood at USD 10.13
billion compared to USD 7.30 billion during July-August,
2016-17. 0
10
20
30
40
50
Jul.
Au
g.
Sep
.
Oct
.
No
v.
Dec
.
Jan
.
Feb
.
Mar
.
Ap
r.
May
Jun
.
Per
cen
tage
Custom based import growth-cumulative
2016-17 2017-18
2013-14 2012-13 2013-14 2012-13 2013-14 2012-13
40616.40 37289.80 37188.84 32358.52 41818.56 35961.05
Month 2015-16R 2014-15 2015-16
R 2014-15 2015-16R 2014-15
July 2856.80 2556.10 3437.71 2964.69 3011.64 3655.65
August 3415.70 3458.80 3502.55 3461.55 3631.73 3475.02
September 3197.20 3733.00 2985.45 3369.85 3135.37 3704.30
October 3866.90 3304.00 3268.85 3145.15 3232.57 3142.60
November 3664.60 3059.20 3407.74 3259.60 4468.22 3760.76
December 3898.30 3444.80 3701.52 3390.64 3585.21 3547.28
January 3591.50 3268.80 3351.55 3037.47 3387.16 3501.47
February 3353.00 3202.00 3200.16 2807.87 3125.36 3257.30
March 3654.00 3404.10 3365.75 3351.97 3988.72 4262.45
April 3541.80 3835.50 3154.28 3179.16 3546.88 3518.94
May 4266.00 3899.20 3285.88 3205.56 3599.03 3682.60
June 3816.70 3538.20 3414.76 3281.73 4623.44 3560.39
July-June 43122.50 40703.70 40076.20 38455.24 43335.33 43068.76
(+5.94) (+0.21) (+4.22) (+3.41) (+0.62) (+2.99)
Month 2016-17P
2015-16R
2016-17P
2015-16R
2016-17P
2015-16R
July 2941.50 2856.80 2804.36 3437.71 3097.80 3011.64
August 3796.60 3415.70 4353.94 3502.55 4203.03 3631.73
September 3531.30 3197.20 4451.61 2985.45 3471.54 3135.37
October 4124.70 3866.90 3530.65 3268.84 4119.23 3232.57
November 4221.60 3664.60 3882.78 3407.74 3801.95 4468.22
December 3994.10 3898.30 3565.46 3701.53 4329.31 3585.21
January 4301.70 3591.50 3962.34 3351.55 4441.16 3387.16
February 3760.90 3353.00 3294.45 3200.16 3775.34 3125.36
March 4311.20 3654.00 3790.07 3365.75 4430.74 3988.72
April 4170.50 3541.80 3738.15 3154.28 4297.71 3546.88
May 4352.00 4266.00 3624.66 3285.88 4150.92 3599.03
June 3499.10 3816.70 3274.28 3414.75 4007.21 4623.44
July-June 47005.20 43122.50 44272.76 40076.19 48125.92 43335.33
(+9.00) (+5.94) (+10.47) (+4.22) (+11.05) (+0.62)
Month 2017-18P 2016-17 2017-18
P 2016-17 2017-18P 2016-17
July 4325.60 2941.50 4046.06 2804.36 4709.68 3097.80
August 4701.20 3796.60 3994.94 4353.95 5422.31 4203.02
July-August 9026.80 6738.10 8041.00 7158.31 10131.99 7300.82
(+33.97) (+7.42) (+12.33) (+3.14) (+38.78) (+9.90)
P = Provisional. R=
Revised.
Month
…………………
………....FY
R = Data has been revised upto June 2017 as per rivision by NBR.
Note:- Figures in brackets indicate percentage changes over the corresponding period of the preceding year.
2. Customs based c&f data incorporated in MEI since February, 2015 onwards with the approval of competent authority.
Source: National Board of Revenue (NBR), Foreign Exchange Operations Department of Bangladesh Bank , NA=Not Available.
(US$ in million)
Custom based import (c&f) Import LCs settlement Import LCs opening

16
b) Sector-wise fresh opening, settlement and outstanding of import LCs
Sector-wise comparative statistics of fresh opening, settlement and outstanding of import LCs during July-August,
2017-18 and July-August, 2016-17 are shown below:
The developments of sectoral share in total LCs opening during July-August, 2017-18 and July-August, 2016-17 are
showing in the following pie charts.
Sector-wise detailed statistics of fresh opening, settlement and outstanding of import LCs during July-August, 2017-18
and July-August, 2016-17 are given in Appendix.
C) Projected data on opening of import LCs and probable liabilities against back to back LCs of
authorised dealer banks
Data on projection of opening of import LCs and probable liabilities against back to back LCs sent by the
authorised dealer banks are USD 12.53 billion and USD 3.95 billion respectively during October-December, 2017.
The said liability is 11.82 percent of foreign exchange reserves as on October 26, 2017.
Consumer goods,
16.67%
Intermediate
goods,
7.60%
Industrial raw
materials,
31.83%
Capital
machinery,
9.29%
Machinery for
misc. industry,
13.43%
Petroleum &
petro.products ,
5.87%
Others ,
15.30%
Sectoral sharing in LC Opening
(July-August, 2017)
Consumer goods,
13.28%
Intermediate
goods,
7.44%
Industrial raw
materials,
35.73%
Capital
machinery,
8.71%
Machinery for
misc. industry,
11.67%
Petroleum &
petro.products ,
4.86%
Others ,
18.31%
Sectoral sharing in LC Opening
(July-August, 2016)
(US$ in million)
A. Consumer goods 1689.03 1093.60 969.23 617.37 1980.79 74.27 77.14 41.32
B. Intermediate goods 769.53 626.75 543.51 539.49 1774.92 41.59 16.17 0.07
C. Industrial raw materials 3225.44 2940.95 2608.34 2560.52 6885.34 23.66 14.86 -2.38
D. Capital machinery 941.14 825.02 636.27 1370.11 5246.82 47.92 -39.78 15.47
E. Machinery for misc. inds. 1361.19 841.92 851.94 868.14 1818.55 59.78 -3.02 37.27
F. Petroleum & petro.prodts. 595.01 386.06 354.56 303.10 532.16 67.81 27.37 7.14
G. Others 1550.66 1326.70 1336.98 899.58 4100.09 15.98 47.48 -9.69
Total 10131.99 8041.00 7300.82 7158.31 22338.66 38.78 12.33 8.00
of which back to back 1475.87 1322.53 1395.31 1244.35 3126.14 5.77 6.28 -10.59
Source: Foreign Exchange Operations Department, Bangladesh Bank. P=Provisional.
Fresh
opening of
LCs
Fresh
opening of
LCs
Settlement
of LCs
Settlement of
LCs
570.15
3702.79
24125.03
2794.93
July-August, 2016
Sectors /
CommoditiesOutstanding
LCs at the
end period
Outstanding
LCs at the end
period
Percentage changes during July-August,
2017-18 over July-August, 2016-17
Outstanding
LCs at the
end period
Settlement of
LCs
Fresh
opening of
LCs
July-August, 2017 P
2496.36
2799.24
1776.11
6721.64
6058.74
(In million USD)
4208.60 1330.54
Source: All authorized dealer banks, compiled by Monetary Policy Department (MPD), Bangladesh Bank.
November'17
4230.54 1285.53
October-December, 2017
Probable liabilities of banks against back to back LCsMonth Opening of import LCs
4095.04 1332.64October'17
12534.19 3948.70
December'17
17
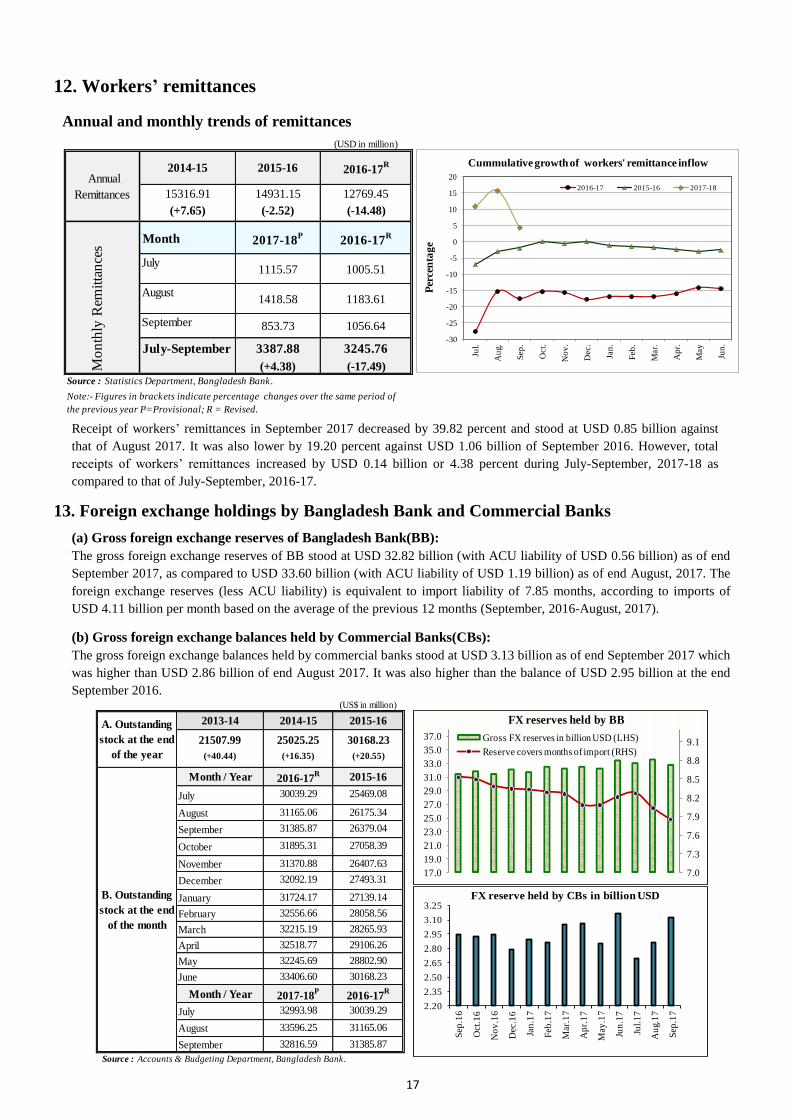
12. Workers’ remittances
Annual and monthly trends of remittances
Receipt of workers’ remittances in September 2017 decreased by 39.82 percent and stood at USD 0.85 billion against
that of August 2017. It was also lower by 19.20 percent against USD 1.06 billion of September 2016. However, total
receipts of workers’ remittances increased by USD 0.14 billion or 4.38 percent during July-September, 2017-18 as
compared to that of July-September, 2016-17.
13. Foreign exchange holdings by Bangladesh Bank and Commercial Banks
(a) Gross foreign exchange reserves of Bangladesh Bank(BB):
The gross foreign exchange reserves of BB stood at USD 32.82 billion (with ACU liability of USD 0.56 billion) as of end
September 2017, as compared to USD 33.60 billion (with ACU liability of USD 1.19 billion) as of end August, 2017. The
foreign exchange reserves (less ACU liability) is equivalent to import liability of 7.85 months, according to imports of
USD 4.11 billion per month based on the average of the previous 12 months (September, 2016-August, 2017).
(b) Gross foreign exchange balances held by Commercial Banks(CBs):
The gross foreign exchange balances held by commercial banks stood at USD 3.13 billion as of end September 2017 which
was higher than USD 2.86 billion of end August 2017. It was also higher than the balance of USD 2.95 billion at the end
September 2016.
-30
-25
-20
-15
-10
-5
0
5
10
15
20
Jul.
Au
g.
Sep
.
Oct.
No
v.
Dec.
Jan
.
Feb
.
Mar.
Ap
r.
May
Jun
.
Per
cen
tag
e
Cummulative growth of workers' remittance inflow
2016-17 2015-16 2017-18
(USD in million)
2014-15 2015-16 2016-17R
15316.91 14931.15 12769.45
(+7.65) (-2.52) (-14.48)
Month 2017-18P
2016-17R
July1115.57 1005.51
August1418.58 1183.61
September 853.73 1056.64
July-September 3387.88 3245.76
(+4.38) (-17.49)
Source : Statistics Department, Bangladesh Bank.
Annual
Remittances
Mo
nth
ly R
emit
tan
ces
Note:- Figures in brackets indicate percentage changes over the same period of
the previous year P=Provisional; R = Revised.
17.0
19.0
21.0
23.0
25.0
27.0
29.0
31.0
33.0
35.0
37.0
7.0
7.3
7.6
7.9
8.2
8.5
8.8
9.1
FX reserves held by BB
Gross FX reserves in billion USD (LHS)
Reserve covers months of import (RHS)
2.20
2.35
2.50
2.65
2.80
2.95
3.10
3.25
Sep
.16
Oct
.16
No
v.1
6
Dec
.16
Jan
.17
Feb
.17
Mar
.17
Ap
r.1
7
May
.17
Jun
.17
Jul.
17
Au
g.1
7
Sep
.17
FX reserve held by CBs in billion USD
(US$ in million)
2013-14 2014-15 2015-16
21507.99 25025.25 30168.23
(+40.44) (+16.35) (+20.55)
Month / Year 2016-17R 2015-16
July 30039.29 25469.08
August 31165.06 26175.34
September 31385.87 26379.04
October 31895.31 27058.39
November 31370.88 26407.63
December 32092.19 27493.31
January 31724.17 27139.14
February 32556.66 28058.56
March 32215.19 28265.93
April 32518.77 29106.26
May 32245.69 28802.90
June 33406.60 30168.23
Month / Year 2017-18P
2016-17R
July 32993.98 30039.29
August 33596.25 31165.06
September 32816.59 31385.87
Source : Accounts & Budgeting Department, Bangladesh Bank.
A. Outstanding
stock at the end
of the year
B. Outstanding
stock at the end
of the month
18
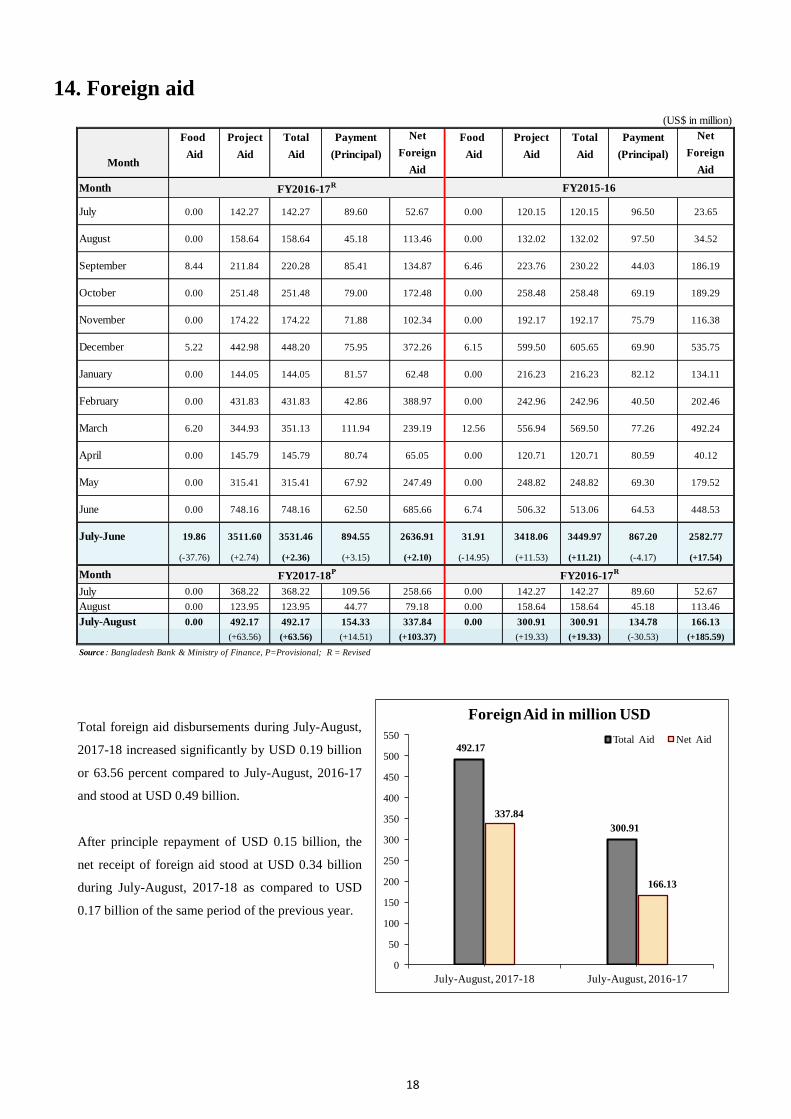
14. Foreign aid
Total foreign aid disbursements during July-August,
2017-18 increased significantly by USD 0.19 billion
or 63.56 percent compared to July-August, 2016-17
and stood at USD 0.49 billion.
After principle repayment of USD 0.15 billion, the
net receipt of foreign aid stood at USD 0.34 billion
during July-August, 2017-18 as compared to USD
0.17 billion of the same period of the previous year.
492.17
300.91
337.84
166.13
0
50
100
150
200
250
300
350
400
450
500
550
July-August, 2017-18 July-August, 2016-17
Foreign Aid in million USD
Total Aid Net Aid
Food Project Total Payment Food Project Total Payment
MonthAid Aid Aid (Principal) Aid Aid Aid (Principal)
Month
July 0.00 142.27 142.27 89.60 52.67 0.00 120.15 120.15 96.50 23.65
August 0.00 158.64 158.64 45.18 113.46 0.00 132.02 132.02 97.50 34.52
September 8.44 211.84 220.28 85.41 134.87 6.46 223.76 230.22 44.03 186.19
October 0.00 251.48 251.48 79.00 172.48 0.00 258.48 258.48 69.19 189.29
November 0.00 174.22 174.22 71.88 102.34 0.00 192.17 192.17 75.79 116.38
December 5.22 442.98 448.20 75.95 372.26 6.15 599.50 605.65 69.90 535.75
January 0.00 144.05 144.05 81.57 62.48 0.00 216.23 216.23 82.12 134.11
February 0.00 431.83 431.83 42.86 388.97 0.00 242.96 242.96 40.50 202.46
March 6.20 344.93 351.13 111.94 239.19 12.56 556.94 569.50 77.26 492.24
April 0.00 145.79 145.79 80.74 65.05 0.00 120.71 120.71 80.59 40.12
May 0.00 315.41 315.41 67.92 247.49 0.00 248.82 248.82 69.30 179.52
June 0.00 748.16 748.16 62.50 685.66 6.74 506.32 513.06 64.53 448.53
July-June 19.86 3511.60 3531.46 894.55 2636.91 31.91 3418.06 3449.97 867.20 2582.77
(-37.76) (+2.74) (+2.36) (+3.15) (+2.10) (-14.95) (+11.53) (+11.21) (-4.17) (+17.54)
Month
July 0.00 368.22 368.22 109.56 258.66 0.00 142.27 142.27 89.60 52.67
August 0.00 123.95 123.95 44.77 79.18 0.00 158.64 158.64 45.18 113.46
July-August 0.00 492.17 492.17 154.33 337.84 0.00 300.91 300.91 134.78 166.13
(+63.56) (+63.56) (+14.51) (+103.37) (+19.33) (+19.33) (-30.53) (+185.59)
Source : Bangladesh Bank & Ministry of Finance, P=Provisional; R = Revised
FY2016-17R FY2015-16
(US$ in million)
Net
Foreign
Aid
Net
Foreign
Aid
FY2017-18P
FY2016-17R

19
15. Exchange rate movements:
Bangladesh Taka has depreciated by 0.25 percent against the US dollar at the end of September 2017
from its level of end June 2017. Indian Rupee (INR) also depreciated by 1.55 percent against US dollar
as of end September 2017 compared to its level of end June 2017. Graphical presenatation of exchange
rate of Bangladesh Taka (BDT) and Indian Rupee (INR) against the US Dollar (USD) and BDT against
the INR are shown below:
FY 2015-16 FY 2016-17
(Rupee/USD) (Rupee/USD)
Month Avg.1/
Month End2/
Month Avg.1/
Month End2/
Month End3/
Month End3/
July 77.8007 77.8000 78.4000 78.4000 64.0061 67.0340
August 77.8000 77.8000 78.4000 78.4000 66.3062 66.9813
September 77.8008 77.8000 78.4000 78.4000 65.7418 66.7875
October 77.8215 77.9978 78.4010 78.4161 65.1515 66.8566
November 78.5274 78.9364 78.5417 78.7233 66.8148 68.5260
December 78.7794 78.5000 78.8030 78.7004 66.3260 68.1241
January 78.5008 78.5000 78.8573 79.0741 67.8763 67.8125
February 78.5517 78.4500 79.2353 79.3700 68.6160 66.7375
March 78.4130 78.4000 79.5398 79.6797 66.3329 64.9325
April 78.4000 78.4000 79.8376 80.2300 66.5176 64.2170
May 78.4000 78.4000 80.4896 80.5609 67.2030 64.5459
June 78.4000 78.4000 80.5850 80.5995 67.6166 64.7379
FY 2016-17 FY 2017-18
(Rupee/USD) (Rupee/USD)
Month Avg.1/
Month End2/
Month Avg.1/
Month End2/
Month End3/
Month End3/
July 78.4000 78.4000 80.6262 80.6598 67.0340 64.0773
August 78.4000 78.4000 80.6937 80.7000 66.9813 64.0154
September 78.4000 78.4000 80.7354 80.8000 66.7875 65.7604
Note:- Exchange rate represents the mid-value of buying and selling rates.
Month
FY 2015-16 FY 2016-17
(Taka/USD) (Taka/USD)
Month
FY 2016-17 FY 2017-18
(Taka/USD) (Taka/USD)
Source : 1/
Statistics Department and 3/
Forex Reserve and Treasury Management Department, Bangladesh Bank & 2/
Bangladesh Foreign
Exchange Dealer's Association (BAFEDA).
80.50
80.60
80.70
80.80
80.90
BD
T/ U
SD
BDT against USD
63.50
64.00
64.50
65.00
65.50
66.00
INR
/USD
INR against USD
1.22
1.23
1.24
1.25
1.26
1.27
1.28
29-0
6-17
03-0
7-17
05-0
7-17
09-0
7-17
11-0
7-17
13-0
7-17
17-0
7-17
19-0
7-17
23-0
7-17
25-0
7-17
27-0
7-17
31-0
7-17
02-0
8-17
06-0
8-17
08-0
8-17
10-0
8-17
16-0
8-17
20-0
8-17
22-0
8-17
24-0
8-17
28-0
8-17
30-0
8-17
04-0
9-17
06-0
9-17
10-0
9-17
12-0
9-17
14-0
9-17
18-0
9-17
20-0
9-17
24-0
9-17
26-0
9-17
28-0
9-17
03-1
0-17
05-1
0-17
09-1
0-17
11-1
0-17
15-1
0-17
17-1
0-17
19-1
0-17
23-1
0-17
TK
. /IN
R
BDT against INR

20
16. Balance of payments (BOP)
Trade balance recorded a deficit of USD 1.81 billion during July-August, 2017-18 as compared to the deficit of
USD 0.53 billion during July-August, 2016-17. Despite financial account surpluses of USD 0.42 billion, current
account balance deficit contributed to a deficit of USD 0.21 billion in overall balances during July-August, 2017-
18. The deficit in current account was mainly due to high import payables along with the shortfall in the primary
income and income from services.
(US$ in million)
Particulars July-August, 2017-18P
July-August, 2016-17R
Trade balance -1810 -525
Exports f.o.b(including EPZ) 6542 5710
Imports f.o.b(including EPZ) 8352 6235
Services -778 -551
Credit 662 534
Debit 1440 1085
Primary income -430 -360
Credit 12 11
Debit 442 371
Of which:Official interest payment 74 66
Secondary income 2567 2248
Official transfers 0 2
Private transfers 2567 2246
of which : Workers' remittances ( current a/c. portion) 2479 2147
Current account balance -451 812
Capital account 2 24
Capital transfers 2 24
Financial account 416 252
i) Foreign direct investment(net)* 320 292
ii) Portfolio investment (net) 66 5
of which : Workers' remittances ( financial a/c. portion) 55 42
iii) Other investment(net) 30 -45
Medium and long-term (MLT) loans 490 257
MLT amortization payments 154 135
Other long-term loans (net) 20 -38
Other short-term loans (net) 122 352
Trade credit (net) -520 -502
DMBs & NBDCs(net) 72 21
Assets 93 -186
Liabilities 165 -165
Errors and omissions -173 88
Overall balance -206 1176
Reserve assets 206 -1176
Bangladesh Bank(net) 206 -1176
Assets -37 1017
Liabilities 169 -159
Note:- Both of exports and imports are compiled on the basis of customs data. P=Provisional; R = Revised.
* FDI is calculated as net, deducting disinvestment, repayments of loans & loss.
Source : Statistics Department, Bangladesh Bank.
21
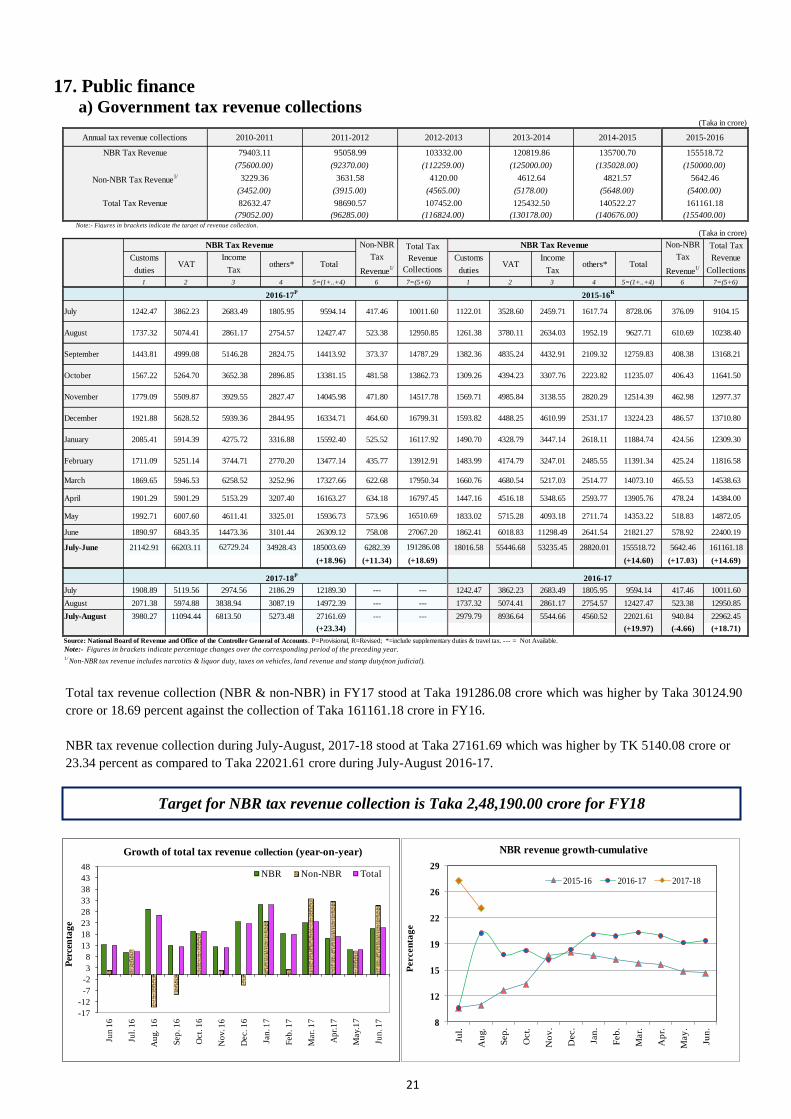
17. Public finance a) Government tax revenue collections
Total tax revenue collection (NBR & non-NBR) in FY17 stood at Taka 191286.08 crore which was higher by Taka 30124.90
crore or 18.69 percent against the collection of Taka 161161.18 crore in FY16.
NBR tax revenue collection during July-August, 2017-18 stood at Taka 27161.69 which was higher by TK 5140.08 crore or
23.34 percent as compared to Taka 22021.61 crore during July-August 2016-17.
Target for NBR tax revenue collection is Taka 2,48,190.00 crore for FY18
8
12
15
19
22
26
29
Jul.
Au
g.
Sep
.
Oct.
No
v.
Dec.
Jan
.
Feb
.
Mar.
Ap
r.
May
.
Jun
.
Percen
tag
e
NBR revenue growth-cumulative
2015-16 2016-17 2017-18
-17
-12
-7
-2
3
8
13
18
23
28
33
38
43
48
Jun
16
Jul.
16
Au
g.
16
Sep
. 1
6
Oct.
16
No
v. 1
6
Dec. 1
6
Jan
. 17
Feb
. 1
7
Mar.
17
Ap
r.1
7
May.1
7
Jun
. 17
Per
cen
tag
e
Growth of total tax revenue collection (year-on-year)
NBR Non-NBR Total
Note:- Figures in brackets indicate the target of revenue collection.
Total Tax
Customs Customs Income Revenue
duties duties Tax Collections
1 2 4 6 7=(5+6) 1 2 3 4 5=(1+..+4) 6 7=(5+6)
July 1242.47 3862.23 2683.49 1805.95 9594.14 417.46 10011.60 1122.01 3528.60 2459.71 1617.74 8728.06 376.09 9104.15
August 1737.32 5074.41 2861.17 2754.57 12427.47 523.38 12950.85 1261.38 3780.11 2634.03 1952.19 9627.71 610.69 10238.40
September 1443.81 4999.08 5146.28 2824.75 14413.92 373.37 14787.29 1382.36 4835.24 4432.91 2109.32 12759.83 408.38 13168.21
October 1567.22 5264.70 3652.38 2896.85 13381.15 481.58 13862.73 1309.26 4394.23 3307.76 2223.82 11235.07 406.43 11641.50
November 1779.09 5509.87 3929.55 2827.47 14045.98 471.80 14517.78 1569.71 4985.84 3138.55 2820.29 12514.39 462.98 12977.37
December 1921.88 5628.52 5939.36 2844.95 16334.71 464.60 16799.31 1593.82 4488.25 4610.99 2531.17 13224.23 486.57 13710.80
January 2085.41 5914.39 4275.72 3316.88 15592.40 525.52 16117.92 1490.70 4328.79 3447.14 2618.11 11884.74 424.56 12309.30
February 1711.09 5251.14 3744.71 2770.20 13477.14 435.77 13912.91 1483.99 4174.79 3247.01 2485.55 11391.34 425.24 11816.58
March 1869.65 5946.53 6258.52 3252.96 17327.66 622.68 17950.34 1660.76 4680.54 5217.03 2514.77 14073.10 465.53 14538.63
April 1901.29 5901.29 5153.29 3207.40 16163.27 634.18 16797.45 1447.16 4516.18 5348.65 2593.77 13905.76 478.24 14384.00
May 1992.71 6007.60 4611.41 3325.01 15936.73 573.96 1833.02 5715.28 4093.18 2711.74 14353.22 518.83 14872.05
June 1890.97 6843.35 14473.36 3101.44 26309.12 758.08 1862.41 6018.83 11298.49 2641.54 21821.27 578.92 22400.19
July-June 21142.91 66203.11 34928.43 185003.69 6282.39 18016.58 55446.68 53235.45 28820.01 155518.72 5642.46 161161.18
(+18.96) (+11.34) (+14.60) (+17.03) (+14.69)
July 1908.89 5119.56 2186.29 12189.30 --- 1242.47 3862.23 2683.49 1805.95 9594.14 417.46 10011.60
August 2071.38 5974.88 3838.94 3087.19 14972.39 --- 1737.32 5074.41 2861.17 2754.57 12427.47 523.38 12950.85
July-August 3980.27 11094.44 6813.50 5273.48 27161.69 --- 2979.79 8936.64 5544.66 4560.52 22021.61 940.84 22962.45
(+23.34) #VALUE! (+19.97) (-4.66) (+18.71)
Source: National Board of Revenue and Office of the Controller General of Accounts . P=Provisional, R=Revised; *=include supplementary duties & travel tax. --- = Not Available.
(92370.00) (112259.00) (125000.00) (135028.00)
(Taka in crore)
Annual tax revenue collections 2010-2011 2011-2012 2012-2013 2013-2014 2014-2015 2015-2016
155518.72135700.70
(75600.00) (150000.00)
NBR Tax Revenue 79403.11 95058.99 103332.00 120819.86
(5400.00)
4821.57
Total Tax Revenue 82632.47 98690.57 107452.00 125432.50 161161.18
(3452.00) (3915.00) (4565.00) (5178.00) (5648.00)
Non-NBR Tax Revenue1/ 3229.36 3631.58 4120.00 4612.64 5642.46
(79052.00) (96285.00) (116824.00) (130178.00) (140676.00) (155400.00)
140522.27
Tax
(Taka in crore)
NBR Tax Revenue Non-NBR
Tax
Revenue1/
Total Tax
Revenue
Collections
NBR Tax Revenue Non-NBR
Tax
Revenue1/
VATIncome
others* Total VAT others* Total
3 5=(1+..+4)
2016-17P
2015-16R
16510.69
27067.20
62729.24
Note:- Figures in brackets indicate percentage changes over the corresponding period of the preceding year.
191286.08
(+18.69)
2017-18P
2016-17
1/Non-NBR tax revenue includes narcotics & liquor duty, taxes on vehicles, land revenue and stamp duty(non judicial).
#VALUE!
---2974.56
---
---

22
b) Sale and repayment of National Savings Certificates (NSC)
The sale of National Savings Certificates (NSC) during
July-August, 2017-18 stood at Taka 13817.04 crore which
was 22.71 percent higher than the amount of sale during
July-August, 2016-17. The net borrowing of the
government through NSC during July-August, 2017-18 was
Taka 9028.57 crore against Taka 7795.58 crore of July-
August, 2016-17. The outstanding borrowing of the
government through NSC as of end August, 2017 stood at
Taka 200264.79 crore.
2400
3000
3600
4200
4800
5400
6000
Jul
Au
g
Sep
Oct
No
v
Dec
Jan
Feb
Mar
Ap
r
May Ju
n
(Ta
ka
in
cro
re)
Monthly net sale of NSC
2016-17 2017-18
(Taka in crore)
Repayment Outstanding at
(Principal) the end of the year
(1) (2) (3) 4=(2-3) (5)
18955.35 18476.33 479.02 63917.34
22553.93
12602.29
13927.13
20023.85
(Taka in crore)
Repayment Repayment
(Principal) (Principal)
July 4932.05 1433.68 3498.37 142317.11 3236.40 1260.12 1976.28 107106.42
August 6327.61 2030.40 4297.21 146614.32 4524.42 1873.51 2650.91 109757.33
September 5390.50 1535.99 3854.50 150468.82 3436.03 1382.23 2053.80 111811.13
October 6104.91 1838.31 4266.61 154735.43 4061.46 1708.75 2352.71 114163.84
November 6106.62 1703.76 4402.85 159138.28 4031.68 1739.52 2292.16 116456.00
December 4881.59 1727.57 3154.02 162292.30 3734.30 1754.57 1979.73 118435.73
January 7357.29 1936.70 5420.59 167712.89 5069.06 1771.68 3297.38 121733.11
February 6030.93 1642.51 4388.42 172101.31 4973.90 1686.33 3287.57 125020.69
March 6556.47 2190.62 4365.85 176467.16 5121.42 1823.71 3297.71 128318.40
April 6831.48 2380.22 4451.26 180918.42 4919.52 1620.06 3299.46 131617.86
May 7118.05 2248.70 4869.35 185787.78 5294.97 1689.91 3605.06 135222.91
June 7497.24 2048.80 5448.44 191236.22 5309.29 1713.47 3595.83 138818.74
July-June 75134.74 22717.26 52417.48 191236.22 53712.45 20023.85 33688.60 138818.74
(+39.88) (+13.45) (+55.59) (+37.76) (+25.91) (+43.78) (+17.25) (+32.04)
July 7352.11 2298.57 5053.54 196289.76 4932.05 1433.68 3498.37 142317.11
August 6464.94 2489.90 3975.04 200264.79 6327.61 2030.40 4297.21 146614.32
July-August 13817.04 4788.47 9028.57 200264.79 11259.66 3464.08 7795.58 146614.32
(+22.71) (+38.23) (+15.82) (+36.59) (+45.08) (+10.55) (+68.47) (+33.58)
Note:- Figures in brackets indicate percentage changes over the corresponding period of the preceding year.
Target for net sale of NSC is Taka 30,150.00 crore for FY 2017-18.
Source:- Department of National Savings
2011-12
FY Sale Net sale
2012-13 23326.77 772.84 64690.18
2013-14 24309.59 11707.30 76397.48
2014-15 42659.79 28732.66 105130.14
2015-16 53712.45 33688.60 138818.74
Months Sale Net saleOutstanding at
the end periodSale Net sale
Outstanding at
the end period
2016-17 2015-16
2017-18 2016-17
23
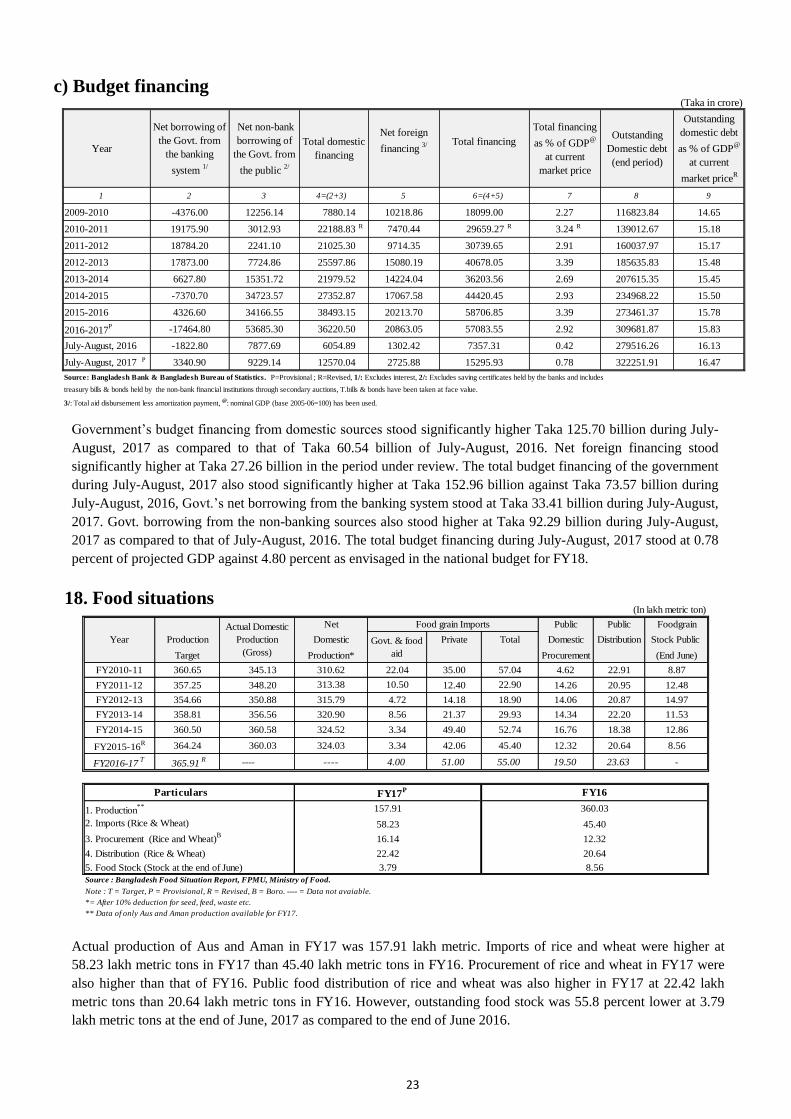
c) Budget financing
Government’s budget financing from domestic sources stood significantly higher Taka 125.70 billion during July-
August, 2017 as compared to that of Taka 60.54 billion of July-August, 2016. Net foreign financing stood
significantly higher at Taka 27.26 billion in the period under review. The total budget financing of the government
during July-August, 2017 also stood significantly higher at Taka 152.96 billion against Taka 73.57 billion during
July-August, 2016, Govt.’s net borrowing from the banking system stood at Taka 33.41 billion during July-August,
2017. Govt. borrowing from the non-banking sources also stood higher at Taka 92.29 billion during July-August,
2017 as compared to that of July-August, 2016. The total budget financing during July-August, 2017 stood at 0.78
percent of projected GDP against 4.80 percent as envisaged in the national budget for FY18.
18. Food situations
Actual production of Aus and Aman in FY17 was 157.91 lakh metric. Imports of rice and wheat were higher at
58.23 lakh metric tons in FY17 than 45.40 lakh metric tons in FY16. Procurement of rice and wheat in FY17 were
also higher than that of FY16. Public food distribution of rice and wheat was also higher in FY17 at 22.42 lakh
metric tons than 20.64 lakh metric tons in FY16. However, outstanding food stock was 55.8 percent lower at 3.79
lakh metric tons at the end of June, 2017 as compared to the end of June 2016.
Net Food grain Imports Public Public Foodgrain
Year Production Domestic Private Domestic Distribution Stock Public
Target Production* Procurement (End June)
FY2010-11 360.65 345.13 35.00 4.62 22.91 8.87
FY2011-12 357.25 348.20 12.40 14.26 20.95 12.48
FY2012-13 354.66 350.88 14.18 14.06 20.87 14.97
FY2013-14 358.81 356.56 21.37 14.34 22.20 11.53
FY2014-15 360.50 360.58 49.40 16.76 18.38 12.86
FY2015-16R 364.24 360.03 42.06 12.32 20.64 8.56
FY2016-17T
365.91R ---- 51.00 19.50 23.63 -
Source : Bangladesh Food Situation Report, FPMU, Ministry of Food.
Note : T = Target, P = Provisional, R = Revised, B = Boro. ---- = Data not avaiable.
*= After 10% deduction for seed, feed, waste etc.
** Data of only Aus and Aman production available for FY17.
3. Procurement (Rice and Wheat)B
4. Distribution (Rice & Wheat)
5. Food Stock (Stock at the end of June)
320.90
Particulars FY17P
324.52
16.14
(In lakh metric ton)
Total
Actual Domestic
Production
(Gross)
315.79 18.90
Govt. & food
aid
29.93
310.62 57.04
313.38 22.90
22.04
10.50
4.72
8.56
FY16
157.91 360.031. Production**
58.23 45.402. Imports (Rice & Wheat)
52.74
324.03 45.40
---- 55.00
3.34
3.34
4.00
12.32
22.42 20.64
3.79 8.56
** Only for Aus and Aman
(Taka in crore)
Year
Net borrowing of
the Govt. from
the banking
system 1/
Net non-bank
borrowing of
the Govt. from
the public 2/
Net foreign
financing 3/
Outstanding
Domestic debt
(end period)
Outstanding
domestic debt
as % of GDP@
at current
market priceR
1 2 3 4=(2+3) 5 6=(4+5) 7 8 9
-4376.00 12256.14 7880.14 10218.86 2.27 116823.84 14.65
19175.90 3012.93 22188.83 R 7470.44 29659.27 R 3.24 R 139012.67 15.18
18784.20 2241.10 21025.30 9714.35 2.91 160037.97 15.17
17873.00 7724.86 25597.86 15080.19 3.39 185635.83 15.48
6627.80 15351.72 21979.52 14224.04 2.69 207615.35 15.45
-7370.70 34723.57 27352.87 17067.58 2.93 234968.22 15.50
4326.60 34166.55 38493.15 20213.70 3.39 273461.37 15.78
-17464.80 53685.30 36220.50 20863.05 2.92 309681.87 15.83
July-August, 2016 -1822.80 7877.69 6054.89 1302.42 0.42 279516.26 16.13
July-August, 2017 P 3340.90 9229.14 12570.04 2725.88 0.78 322251.91 16.47
Source: Bangladesh Bank & Bangladesh Bureau of Statistics. P=Provisional ; R=Revised, 1/: Excludes interest, 2/: Excludes saving certificates held by the banks and includes
treasury bills & bonds held by the non-bank financial institutions through secondary auctions, T.bills & bonds have been taken at face value.
3/: Total aid disbursement less amortization payment, @
: nominal GDP (base 2005-06=100) has been used.
15295.93
2016-2017P
30739.65
40678.05
36203.56
44420.45
58706.85
57083.55
7357.31
2012-2013
2013-2014
2014-2015
2015-2016
Total domestic
financing
Total financing
Total financing
as % of GDP@
at current
market price
2009-2010
2010-2011
2011-2012
18099.00
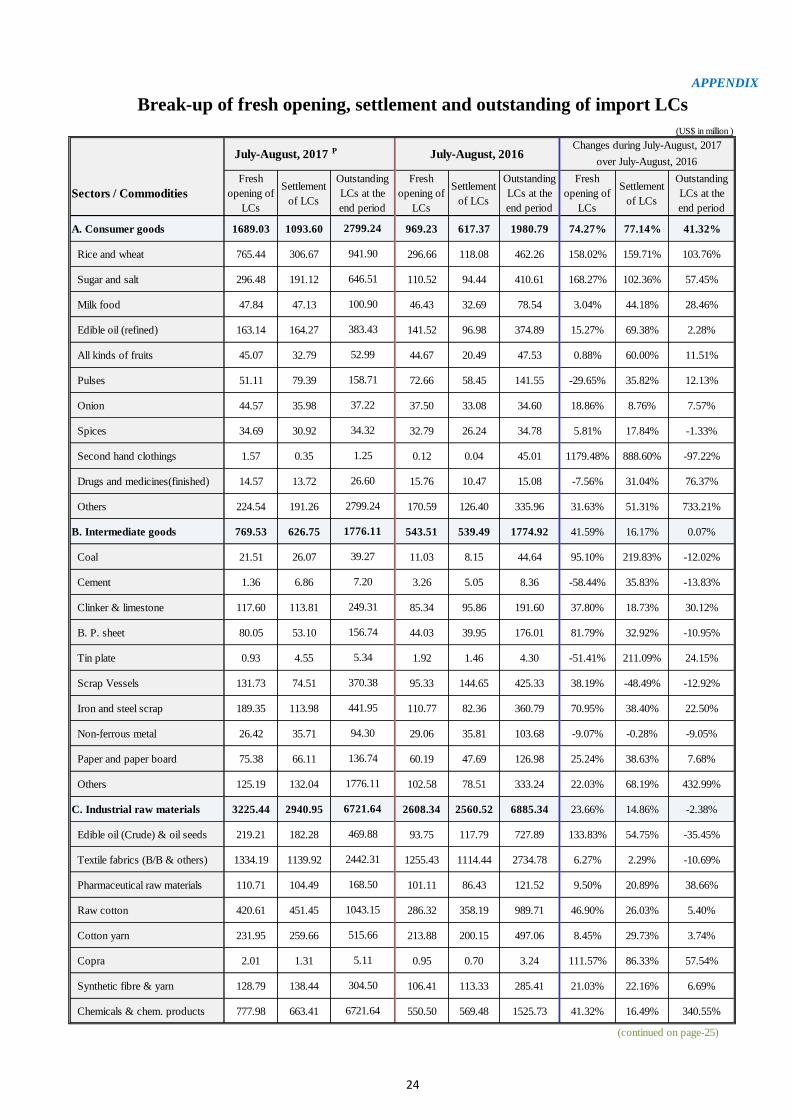
24
APPENDIX
Break-up of fresh opening, settlement and outstanding of import LCs
Sectors / Commodities
Fresh
opening of
LCs
Settlement
of LCs
Fresh
opening of
LCs
Settlement
of LCs
Outstanding
LCs at the
end period
Fresh
opening of
LCs
Settlement
of LCs
Outstanding
LCs at the
end period
A. Consumer goods 1689.03 1093.60 969.23 617.37 1980.79 74.27% 77.14% 41.32%
Rice and wheat 765.44 306.67 296.66 118.08 462.26 158.02% 159.71% 103.76%
Sugar and salt 296.48 191.12 110.52 94.44 410.61 168.27% 102.36% 57.45%
Milk food 47.84 47.13 46.43 32.69 78.54 3.04% 44.18% 28.46%
Edible oil (refined) 163.14 164.27 141.52 96.98 374.89 15.27% 69.38% 2.28%
All kinds of fruits 45.07 32.79 44.67 20.49 47.53 0.88% 60.00% 11.51%
Pulses 51.11 79.39 72.66 58.45 141.55 -29.65% 35.82% 12.13%
Onion 44.57 35.98 37.50 33.08 34.60 18.86% 8.76% 7.57%
Spices 34.69 30.92 32.79 26.24 34.78 5.81% 17.84% -1.33%
Second hand clothings 1.57 0.35 0.12 0.04 45.01 1179.48% 888.60% -97.22%
Drugs and medicines(finished) 14.57 13.72 15.76 10.47 15.08 -7.56% 31.04% 76.37%
Others 224.54 191.26 170.59 126.40 335.96 31.63% 51.31% 733.21%
B. Intermediate goods 769.53 626.75 543.51 539.49 1774.92 41.59% 16.17% 0.07%
Coal 21.51 26.07 11.03 8.15 44.64 95.10% 219.83% -12.02%
Cement 1.36 6.86 3.26 5.05 8.36 -58.44% 35.83% -13.83%
Clinker & limestone 117.60 113.81 85.34 95.86 191.60 37.80% 18.73% 30.12%
B. P. sheet 80.05 53.10 44.03 39.95 176.01 81.79% 32.92% -10.95%
Tin plate 0.93 4.55 1.92 1.46 4.30 -51.41% 211.09% 24.15%
Scrap Vessels 131.73 74.51 95.33 144.65 425.33 38.19% -48.49% -12.92%
Iron and steel scrap 189.35 113.98 110.77 82.36 360.79 70.95% 38.40% 22.50%
Non-ferrous metal 26.42 35.71 29.06 35.81 103.68 -9.07% -0.28% -9.05%
Paper and paper board 75.38 66.11 60.19 47.69 126.98 25.24% 38.63% 7.68%
Others 125.19 132.04 102.58 78.51 333.24 22.03% 68.19% 432.99%
C. Industrial raw materials 3225.44 2940.95 2608.34 2560.52 6885.34 23.66% 14.86% -2.38%
Edible oil (Crude) & oil seeds 219.21 182.28 93.75 117.79 727.89 133.83% 54.75% -35.45%
Textile fabrics (B/B & others) 1334.19 1139.92 1255.43 1114.44 2734.78 6.27% 2.29% -10.69%
Pharmaceutical raw materials 110.71 104.49 101.11 86.43 121.52 9.50% 20.89% 38.66%
Raw cotton 420.61 451.45 286.32 358.19 989.71 46.90% 26.03% 5.40%
Cotton yarn 231.95 259.66 213.88 200.15 497.06 8.45% 29.73% 3.74%
Copra 2.01 1.31 0.95 0.70 3.24 111.57% 86.33% 57.54%
Synthetic fibre & yarn 128.79 138.44 106.41 113.33 285.41 21.03% 22.16% 6.69%
Chemicals & chem. products 777.98 663.41 550.50 569.48 1525.73 41.32% 16.49% 340.55%
(continued on page-25)
5.11
304.50
6721.64
6721.64
469.88
2442.31
168.50
1043.15
515.66
1776.11
2799.24
1776.11
39.27
7.20
249.31
156.74
5.34
370.38
441.95
94.30
136.74
26.60
Outstanding
LCs at the
end period
2799.24
941.90
646.51
100.90
383.43
52.99
158.71
37.22
34.32
1.25
(US$ in million )
July-August, 2016Changes during July-August, 2017
over July-August, 2016July-August, 2017 P
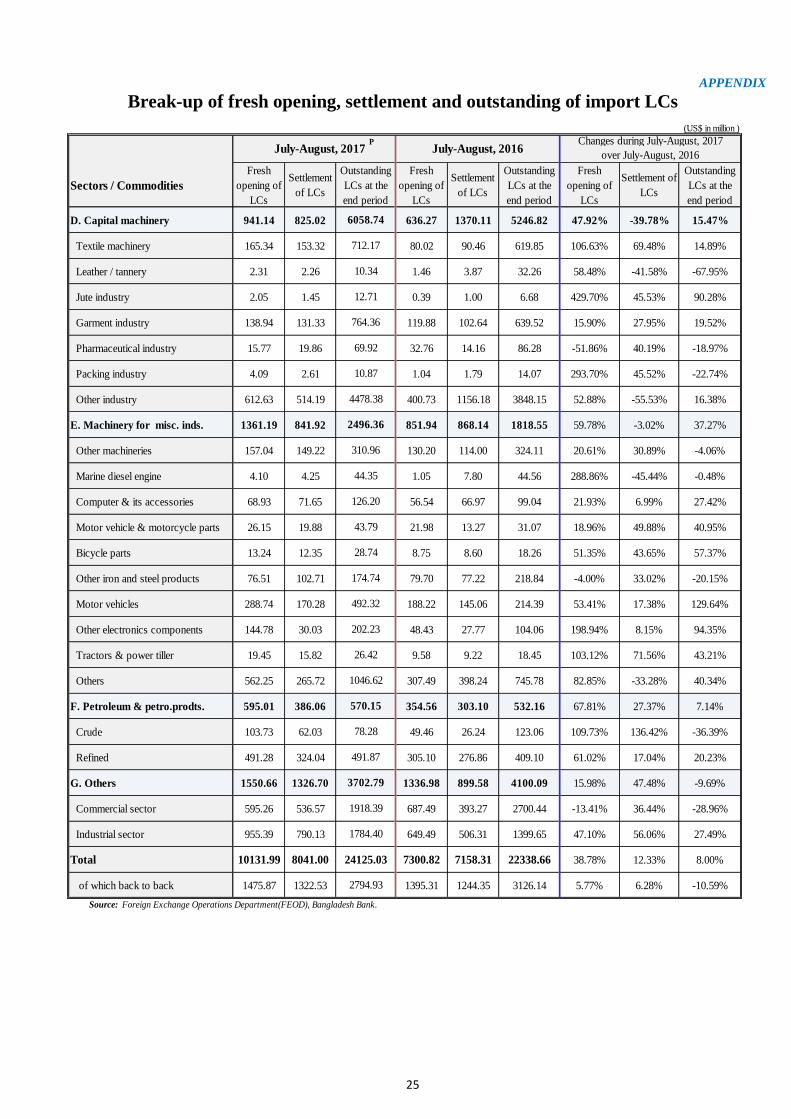
25
APPENDIX
Break-up of fresh opening, settlement and outstanding of import LCs
Sectors / Commodities
Fresh
opening of
LCs
Settlement
of LCs
Fresh
opening of
LCs
Settlement
of LCs
Outstanding
LCs at the
end period
Fresh
opening of
LCs
Settlement of
LCs
Outstanding
LCs at the
end period
D. Capital machinery 941.14 825.02 636.27 1370.11 5246.82 47.92% -39.78% 15.47%
Textile machinery 165.34 153.32 80.02 90.46 619.85 106.63% 69.48% 14.89%
Leather / tannery 2.31 2.26 1.46 3.87 32.26 58.48% -41.58% -67.95%
Jute industry 2.05 1.45 0.39 1.00 6.68 429.70% 45.53% 90.28%
Garment industry 138.94 131.33 119.88 102.64 639.52 15.90% 27.95% 19.52%
Pharmaceutical industry 15.77 19.86 32.76 14.16 86.28 -51.86% 40.19% -18.97%
Packing industry 4.09 2.61 1.04 1.79 14.07 293.70% 45.52% -22.74%
Other industry 612.63 514.19 400.73 1156.18 3848.15 52.88% -55.53% 16.38%
E. Machinery for misc. inds. 1361.19 841.92 851.94 868.14 1818.55 59.78% -3.02% 37.27%
Other machineries 157.04 149.22 130.20 114.00 324.11 20.61% 30.89% -4.06%
Marine diesel engine 4.10 4.25 1.05 7.80 44.56 288.86% -45.44% -0.48%
Computer & its accessories 68.93 71.65 56.54 66.97 99.04 21.93% 6.99% 27.42%
Motor vehicle & motorcycle parts 26.15 19.88 21.98 13.27 31.07 18.96% 49.88% 40.95%
Bicycle parts 13.24 12.35 8.75 8.60 18.26 51.35% 43.65% 57.37%
Other iron and steel products 76.51 102.71 79.70 77.22 218.84 -4.00% 33.02% -20.15%
Motor vehicles 288.74 170.28 188.22 145.06 214.39 53.41% 17.38% 129.64%
Other electronics components 144.78 30.03 48.43 27.77 104.06 198.94% 8.15% 94.35%
Tractors & power tiller 19.45 15.82 9.58 9.22 18.45 103.12% 71.56% 43.21%
Others 562.25 265.72 307.49 398.24 745.78 82.85% -33.28% 40.34%
F. Petroleum & petro.prodts. 595.01 386.06 354.56 303.10 532.16 67.81% 27.37% 7.14%
Crude 103.73 62.03 49.46 26.24 123.06 109.73% 136.42% -36.39%
Refined 491.28 324.04 305.10 276.86 409.10 61.02% 17.04% 20.23%
G. Others 1550.66 1326.70 1336.98 899.58 4100.09 15.98% 47.48% -9.69%
Commercial sector 595.26 536.57 687.49 393.27 2700.44 -13.41% 36.44% -28.96%
Industrial sector 955.39 790.13 649.49 506.31 1399.65 47.10% 56.06% 27.49%
Total 10131.99 8041.00 7300.82 7158.31 22338.66 38.78% 12.33% 8.00%
of which back to back 1475.87 1322.53 1395.31 1244.35 3126.14 5.77% 6.28% -10.59%
Source: Foreign Exchange Operations Department(FEOD), Bangladesh Bank.
1784.40
24125.03
2794.93
1046.62
570.15
78.28
491.87
3702.79
1918.39
26.42
10.87
4478.38
2496.36
310.96
44.35
126.20
43.79
28.74
174.74
492.32
202.23
69.92
(US$ in million )
July-August, 2016Changes during July-August, 2017
over July-August, 2016
6058.74
712.17
10.34
12.71
764.36
July-August, 2017P
Outstanding
LCs at the
end period


