
© Fraunhofer IIS
ULTRA-LOW POWER DEVICE POSITIONING CONCEPTS
FINAL PRESENTATION
Matthias Overbeck
08.06.2021

© Fraunhofer IIS 2
Agenda
Welcome and introduction
ULP-Pos project team
Overview of conducted ULP-Pos tasks
Scenario selection for ULP-Pos
Satellite-based localization
Terrestrial localization
Communication
Energy Supply
Performance Analysis and Summary
Conclusion
Business Analysis
Way forward
© Fraunhofer IIS 3
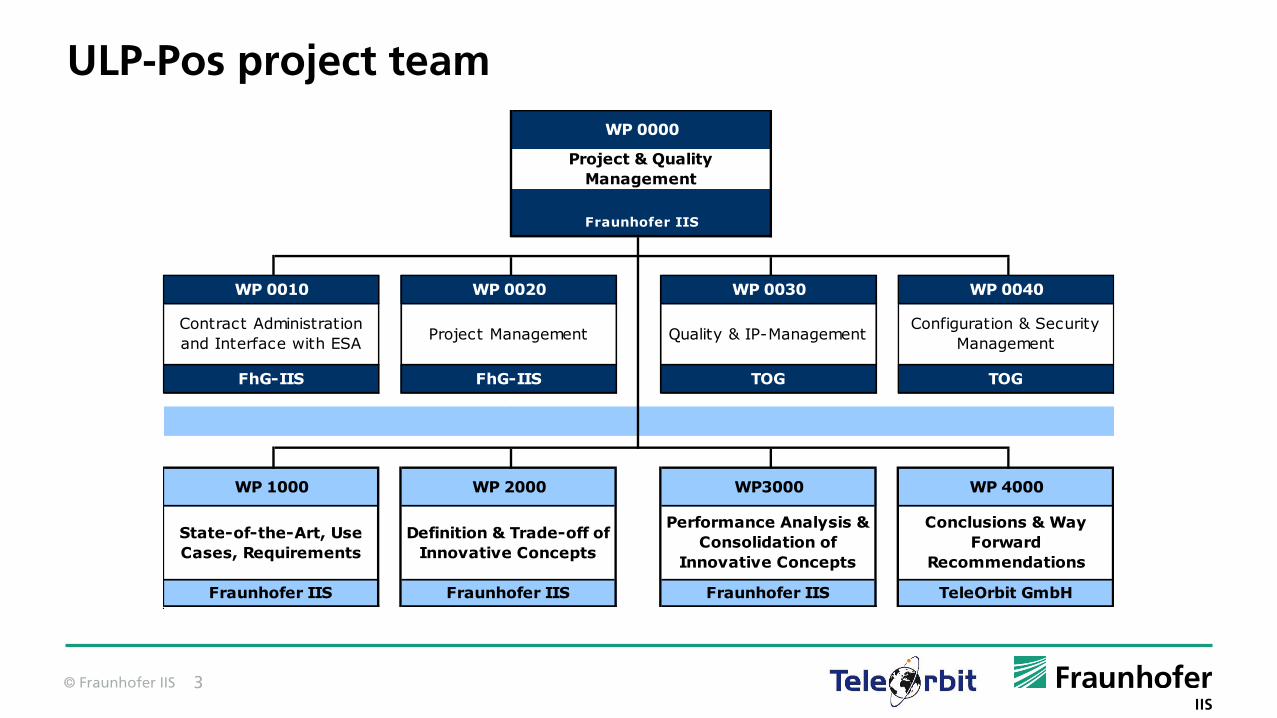
ULP-Pos project team
State-of-the-Art, Use
Cases, Requirements
Fraunhofer IIS Fraunhofer IIS TeleOrbit GmbH
Contract Administration
and Interface with ESA
WP 0040WP 0010 WP 0020
Project Management
Fraunhofer IIS
WP 1000 WP 2000 WP3000 WP 4000
FhG-IIS TOG
Conclusions & Way
Forward
Recommendations
FhG-IIS TOG
WP 0000
Project & Quality
Management
Fraunhofer IIS
Performance Analysis &
Consolidation of
Innovative Concepts
Definition & Trade-off of
Innovative Concepts
WP 0030
Quality & IP-ManagementConfiguration & Security
Management

© Fraunhofer IIS 4
Overview of conducted ULP-Pos tasks
Identification and description of scenarios
State of the Art and high level innovative concepts
Requirement consolidation for scenarios
Analysis of current communication and localization technologies
Identification and definition of the scenarios for the innovative concepts
Trade-off analysis of innovative concepts
Detailed performance analysis of the innovative concepts
Outcome: power consumption based on accuracy, availability and lifetime
Refinement of innovative concepts based on detailed analysis
Conclusion and Benchmarks including new types of batteries
Identification of costs and benefits
Way forward recommendations
WP 1000
State-of-the-Art, Use Cases, Requirements
WP 2000
Definition & Trade-off of Innovative Concepts
WP 3000
Performance Analysis & Consolidation of
Innovative Concepts
WP 4000
Conclusions & Way Forward
Recommendations
© Fraunhofer IIS 5
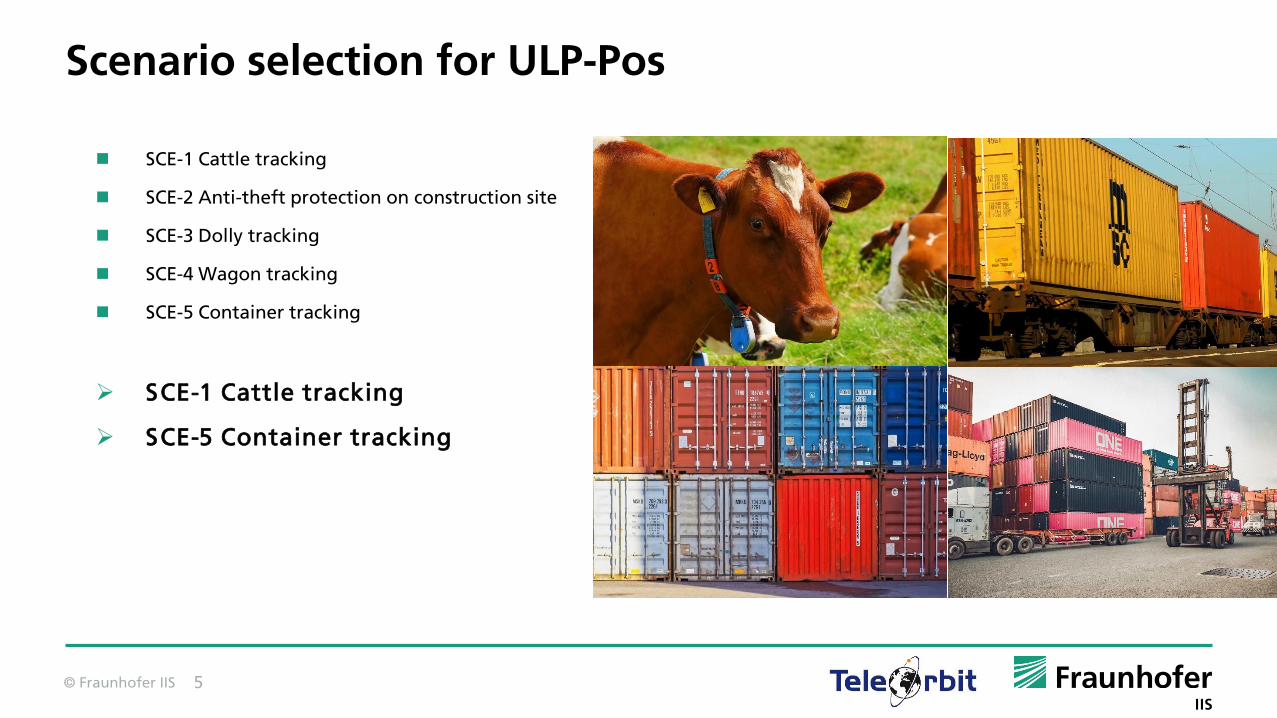
Scenario selection for ULP-Pos
SCE-1 Cattle tracking
SCE-2 Anti-theft protection on construction site
SCE-3 Dolly tracking
SCE-4 Wagon tracking
SCE-5 Container tracking
SCE-1 Cattle tracking
SCE-5 Container tracking

© Fraunhofer IIS 6
Scenario selection for ULP-Pos
SCE-1 Cattle tracking
Large herd of cattle needs to be tracked
To find lost animals, locate specific animals or ensure no animal moved out of its area
Cattle usually have a very slow movement as well as long periods with no motion
Positions do not need to have a very high accuracy, but must be available on demand
FOM-ID Figure of Merit Estimated requirement
FOM-P1 Accuracy < 10 m
FOM-P2 Duty Cycle > 1 h
FOM-P6 Mobility Max. 27 km/h (should), Avg. 4 km/h
(must)
FOM-C9 Communication Latency < 5 min
FOM-D1 Mass < 500 g
FOM-D2 Volume/Dimensions ~ 5 x 10 x 10 cm
FOM-D3 Costs 10-50€/animal/ 5 years
FOM-D4 Operation Time 5 years (should), 9 months (must)

© Fraunhofer IIS 7
Scenario selection for ULP-Pos
SCE-5 Container tracking
On ships, trains, or trucks
Position information in real-time is important for the whole supply chain
Since the container can travel on road, rail or water, the environment is unlimited
Position requirements should sometimes be accurate to identify if the container is on the right street or rail track, and should be available on demand
FOM-ID Figure of Merit Estimated requirement
FOM-P1 Accuracy 3 m
FOM-P2 Duty Cycle 1 / day – 24 / day
FOM-P6 Mobility 28 – 80 km/h
FOM-C9 Communication Latency 5 min
FOM-D2 Volume/Dimensions 10 x 10 x 20 cm
FOM-D3 Costs 200 €
FOM-D4 Operation Time 6 years

© Fraunhofer IIS 8
Satellite-based localizationCritical Review of State-of-the-Art - GNSS
Refinement of State of the Art analysis of GNSS receivers from GPS World Receiver Survey 2018
Latest generation of GNSS ASIC receivers for handheld telecommunication devices
Mixed-s ignal ASIC System-on-chip (SoC) chips (RF frontend, baseband signal processing and processor are implemented on the same die)
System-in-package (S iP) solutions (RF frontend, baseband, memory and processor implemented in separated dies but inside the same package)
Comparison and trade-off regarding parameterslike power consumption, sensitivity or TTFF in D1
Power MT3333 MT3337/9 NV08C STA8090WG
G8020-KT ZED-F9P
Minimum
[mW]
/ / 10 / / /
Maximum[mW]
/ / 180 / / /
Typical
[mW]
/ / / 35 / /
Acquis ition[mW]
37 27 / / / /
Tracking[mW]
27 18 N/A 130 48 204
TrackingLow Power[mW]
24
@ Low PowerTTTF Mode
11.1
@PowerSaving Mode,1 Hz update(3.7mA/3.0V)

© Fraunhofer IIS 9
Satellite-based localizationInnovative Concept LEO-PNT

© Fraunhofer IIS 10
Satellite-based localizationInnovative Concept LEO-PNT
Doppler Analysis
Link Budget
Ranging Errors
Channel Identification
Conclusion
GPS (1.57542 GHz) OneWeb (14.0 GHz)Iridium NEXT (1.62 GHz)
Carrier Frequency[GHz]
1.57542 14 1.62
Bandwidth [MHz] 2.046 250 0.288
Worst Best Worst Best Worst BestReceived Power [dBW]
-161.023 -150.503 -160.237 -143.926 -134.467 -116.98
Noise [dB] -139.942 -139.942 -119.071 -119.071 -148.457 -148.457SNR [dB] -21.081 -10.561 -41.166 -24.855 13.99 31.477
C/N0 [dBHz] 42.03 52.55 42.81 59.12 68.58 86.07
GPS LEO-1 LEO-2b LEO-2c
SISRE 0.60 2.73 2.78 3.33
© Fraunhofer IIS 11
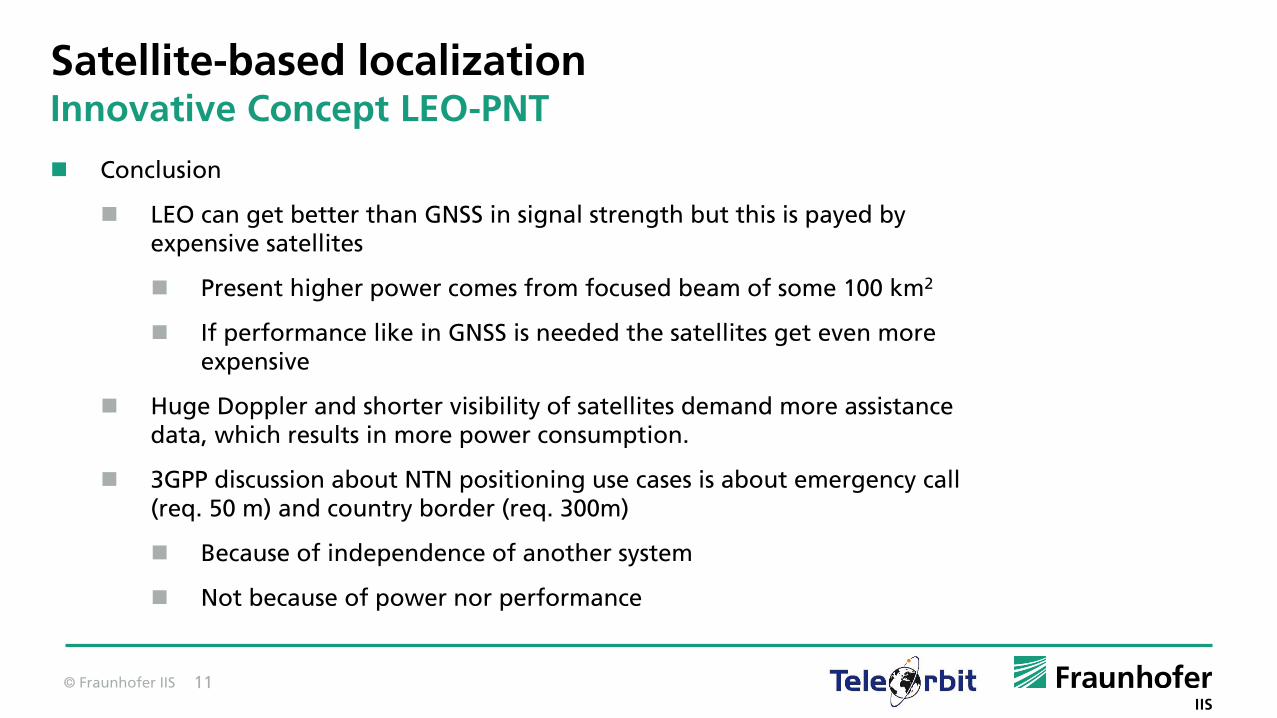
Satellite-based localizationInnovative Concept LEO-PNT
Conclusion
LEO can get better than GNSS in signal strength but this is payed by expensive satellites
Present higher power comes from focused beam of some 100 km2
If performance like in GNSS is needed the satellites get even more expensive
Huge Doppler and shorter visibility of satellites demand more assistance data, which results in more power consumption.
3GPP discussion about NTN positioning use cases is about emergency call (req. 50 m) and country border (req. 300m)
Because of independence of another system
Not because of power nor performance

© Fraunhofer IIS 12
Satellite-based localizationInnovative Concept Snapshot
Acquisition of GNSS data for 8 ms
Transfer of the data to a server
Data: 16 kB
Energies per Snapshot:
Acquisition: 1.15 mJ
Transfer via NB-IoT: 109.7 J
Most energy for the transfer
Mioty and LORA do not fit for the amount of data

© Fraunhofer IIS 13
Satellite-based localizationEnergy Estimation
Container Tracking Value
Energy per Fix [J] 1.48
Duty Cycle Positioning [h] 1.00
Operation Time [years] 6.00
Fixes per Day 24.00
Energy per Day [J] 35.49
Energy per Year [kJ] 12.96Total Positioning Energy for Operation
Time [kJ] 77.73
Cattle Tracking Value
Energy per Fix [J] 1.48
Duty Cycle Positioning [h] 1.00
Operation Time [years] 5.00
Fixes per Day 24.00
Energy per Day [J] 35.49
Energy per Year [kJ] 12.96
Total Positioning Energy for Operation Time [kJ] 64.78

© Fraunhofer IIS 14
Terrestrial LocalizationCritical Review of State-of-the-Art – Terrestrial Positioning
LPWAN standalone solutions
mostly based on TDOA (ex. LoRa, NB-IoT), RSSI or combination of both
Pros: Large coverage, moderate power consumption
Cons: Poor performance(>100m), low mobility, additional network overhead, chipsets supporting OTDOA are needed for NB-IoT
LPWAN as combination with wireless technologies
LPWAN used as a communication link for assistance data or to report measurements
Pros: acceptable performance in supported areas
Cons: Low coverage, additional hardware, power consumption depends on the scanning and reporting requirements
Coverage
Acc
ura
cy
BT
UWB
LTE
LPWAN
TDOA- LPWAN
WIFI
GNSS
10m
100m
10cm
Indoor
Outdoor
LPWAN positioning solutions rely on additional wireless technologies to achieve higher performance
© Fraunhofer IIS 15
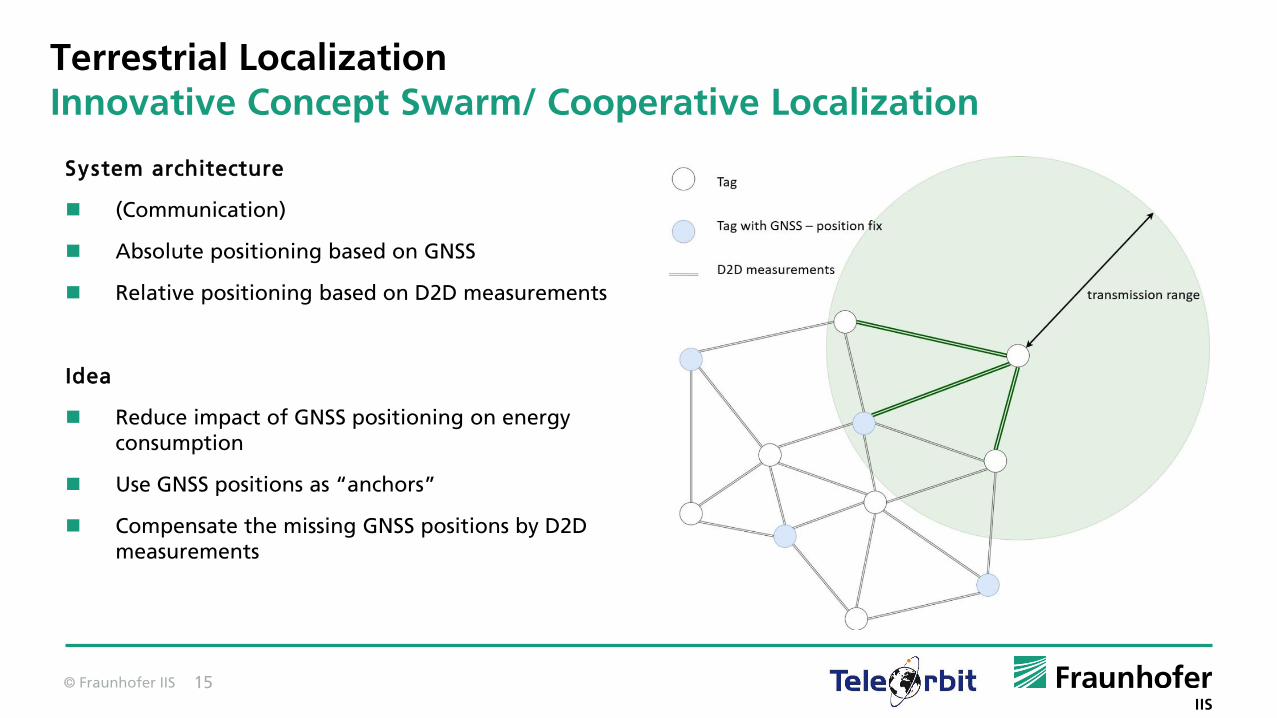
Terrestrial LocalizationInnovative Concept Swarm/ Cooperative Localization
System architecture
(Communication)
Absolute positioning based on GNSS
Relative positioning based on D2D measurements
Idea
Reduce impact of GNSS positioning on energy consumption
Use GNSS positions as “anchors”
Compensate the missing GNSS positions by D2D measurements

© Fraunhofer IIS 16
Terrestrial LocalizationInnovative Concept Swarm/ Cooperative Localization
Trade off Analys is
Evaluation of the correlation of positioning accuracy and energy consumption
Parameters
Percentage of GNSS positions of all tags
Transmission range
#measurements per position fix
Kalman Filter for position estimation in simulations
D2D measurements based on free space path loss model
Energy consumption based on BLE Advertismentpackets
© Fraunhofer IIS 17
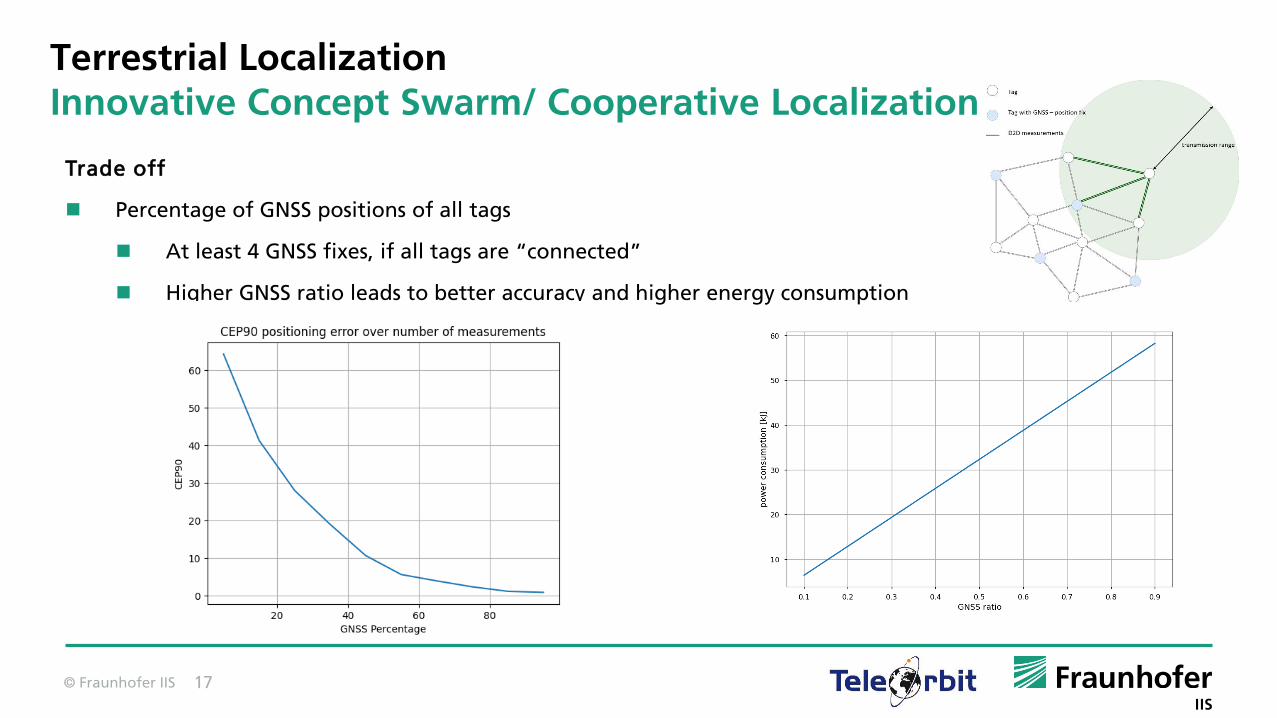
Terrestrial LocalizationInnovative Concept Swarm/ Cooperative Localization
Trade off
Percentage of GNSS positions of all tags
At least 4 GNSS fixes, if all tags are “connected”
Higher GNSS ratio leads to better accuracy and higher energy consumption

© Fraunhofer IIS 18
Terrestrial LocalizationInnovative Concept Swarm/ Cooperative Localization
Trade off
Transmission range
Transmission range is related to transmission power
Source: U. M. Qureshi, Z. Umair, Y. Duan and G. P. Hancke, "Analysis of Bluetooth Low Energy (BLE) Based Indoor Localization System with Multiple Transmission Power Levels
Transmiss ion Power Levels
Transmiss ion Power (dBm)
Range (m)
1 4 dBm 70
2 0 dBm 50
4 -8 dBm 30

© Fraunhofer IIS 19
Terrestrial LocalizationInnovative Concept Swarm/ Cooperative Localization
Trade off
Transmission range
Higher range increases number of “visible” tags
More D2D measurements, hence more information for localization

© Fraunhofer IIS 20
Terrestrial LocalizationInnovative Concept Swarm/ Cooperative Localization
Trade off
#measurements per position fix
Measurements between each combination of two tags
Averaging over 15 RSSI-values for one measurement

© Fraunhofer IIS 21
Terrestrial LocalizationInnovative Concept Swarm/ Cooperative Localization
Trade off
#measurements per position fix
More measurements lead to lower variance and also lower mean of the positioning error
Linear correlation between energy consumption and measurements per fix
© Fraunhofer IIS 22
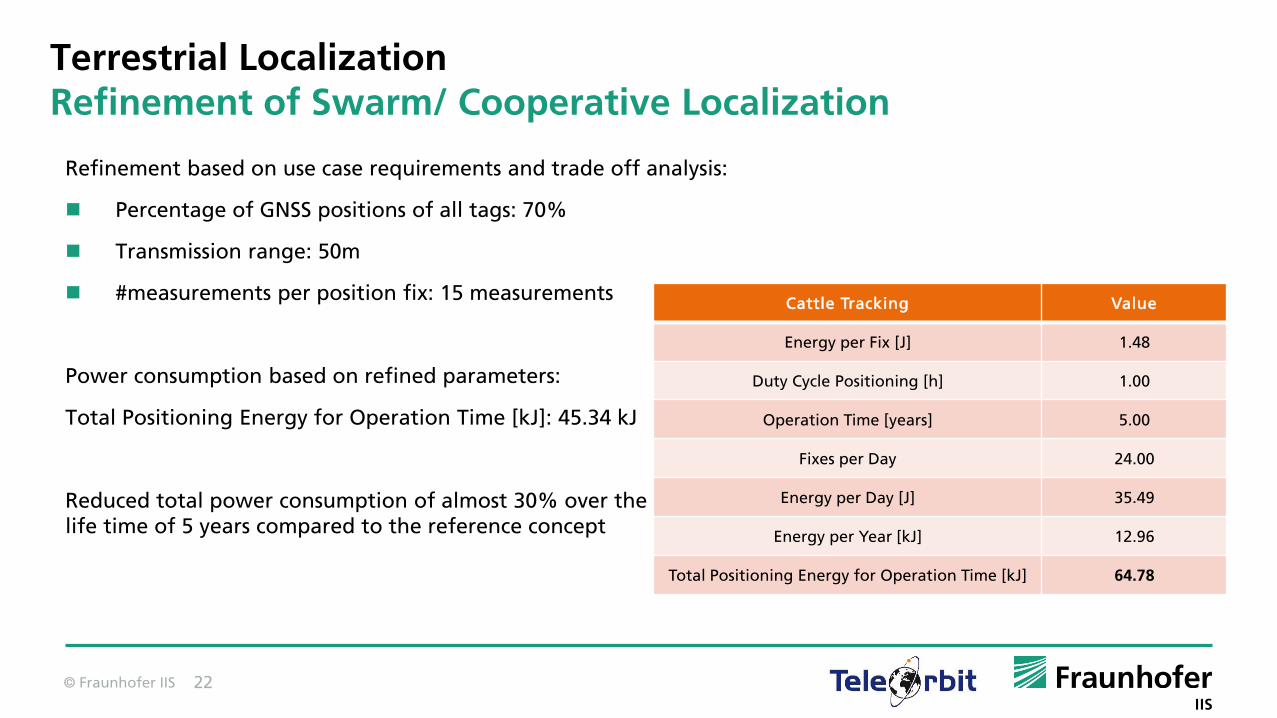
Terrestrial LocalizationRefinement of Swarm/ Cooperative Localization
Refinement based on use case requirements and trade off analysis:
Percentage of GNSS positions of all tags: 70%
Transmission range: 50m
#measurements per position fix: 15 measurements
Power consumption based on refined parameters:
Total Positioning Energy for Operation Time [kJ]: 45.34 kJ
Reduced total power consumption of almost 30% over thelife time of 5 years compared to the reference concept
Cattle Tracking Value
Energy per Fix [J] 1.48
Duty Cycle Positioning [h] 1.00
Operation Time [years] 5.00
Fixes per Day 24.00
Energy per Day [J] 35.49
Energy per Year [kJ] 12.96
Total Positioning Energy for Operation Time [kJ] 64.78

© Fraunhofer IIS 23
Terrestrial LocalizationInnovative Concept Carrier Phase Measurements
System architecture
Tags
Beacons
PDoA Nodes
Idea
Dedicated positioning system
Complexity in infrastructure
Keep tags as simple as possible
Source: Sackenreuter, Hadaschik, Faßbinder and Mutschler, "Low-complexity PDoA-based localization," 2016 International Conference on Indoor Positioning and Indoor Navigation (IPIN).

© Fraunhofer IIS 24
Terrestrial LocalizationInnovative Concept Carrier Phase Measurements
Signal structure
Frequency Hopping pattern
Use Phase differences between stairs and between reference beacon and tag to resolve ambiguities
Similar to GNSS PDoA approach
Positioning Procedure
Source: Sackenreuter, Hadaschik, Faßbinder and Mutschler, "Low-complexity PDoA-based localization," 2016 International Conference on Indoor Positioning and Indoor Navigation (IPIN).
Signal structure
© Fraunhofer IIS 25
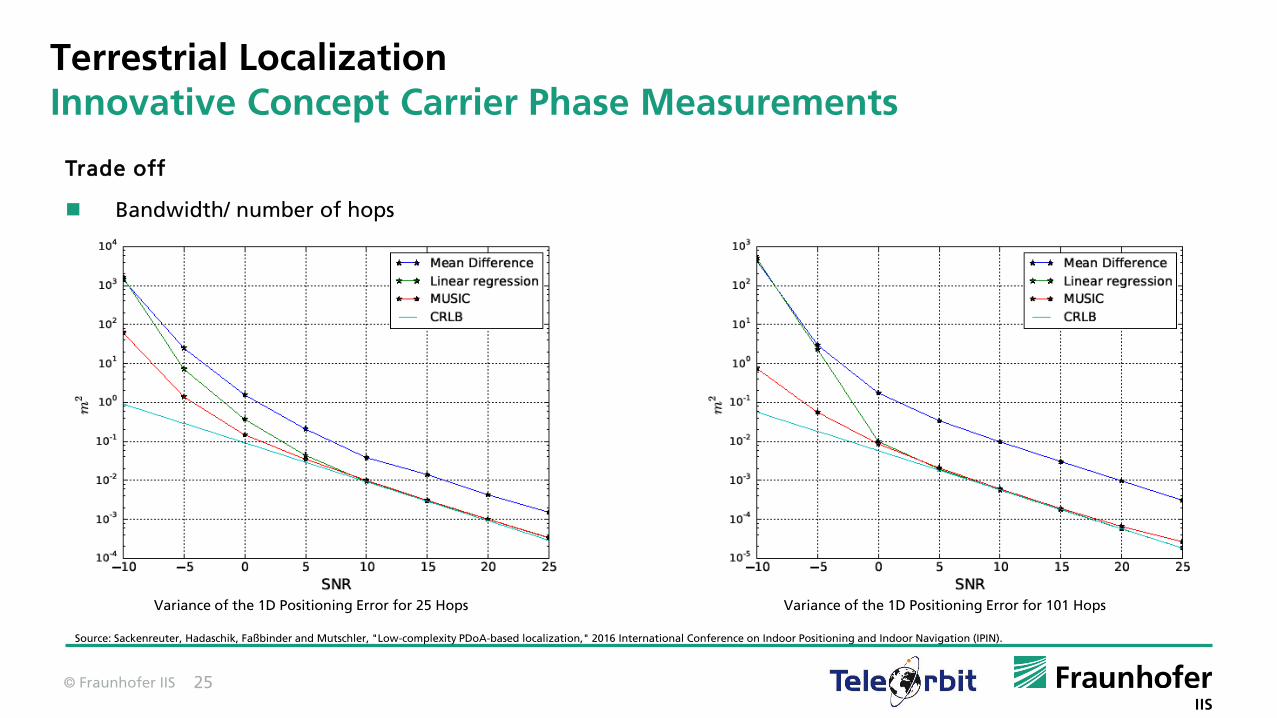
Terrestrial LocalizationInnovative Concept Carrier Phase Measurements
Trade off
Bandwidth/ number of hops
Variance of the 1D Positioning Error for 101 Hops
Source: Sackenreuter, Hadaschik, Faßbinder and Mutschler, "Low-complexity PDoA-based localization," 2016 International Conference on Indoor Positioning and Indoor Navigation (IPIN).
Variance of the 1D Positioning Error for 25 Hops

© Fraunhofer IIS 26
Terrestrial LocalizationInnovative Concept Carrier Phase Measurements
Drawback to power consumption
Bandwidth/ number of hops
Energy consumption based on Miotychipsetdue to similar signal structure
Energy consumption of 25 hops nearly half of 101 hops
Linear correlation between energy consumption and used bandwidth

© Fraunhofer IIS 27
Terrestrial LocalizationInnovative Concept Carrier Phase Measurements
Trade off
Sufficient positioning error for 25 hops
General applicable depending on use case
2D Positioning Error for 25 Hops

© Fraunhofer IIS 28
Terrestrial LocalizationRefinement of Carrier Phase Measurements
Refinement based on use case requirements and trade off analysis:
Bandwidth: 25 hops
Power consumption based on refined parameters:
Total Positioning Energy for Operation Time [kJ]: 7.43 kJ
Reduced total power consumption of 88% over thelife time of 5 years compared to the reference concept
Cattle Tracking Value
Energy per Fix [J] 1.48
Duty Cycle Positioning [h] 1.00
Operation Time [years] 5.00
Fixes per Day 24.00
Energy per Day [J] 35.49
Energy per Year [kJ] 12.96
Total Positioning Energy for Operation Time [kJ] 64.78

© Fraunhofer IIS 29
CommunicationLow Power Wide Area Network (LPWAN)
Parameter Value
Wide Area Coverage Some kilometers (MCL1 > 150 … 160 dB)
Low Power Consumption Very long battery life time (~ 10 years)
Capacity Massive number of end devices (100.000 … 1 Mio.)
Quality of service High interference resilience
Mobility Stationary devices (speed < 30 km/h)
End device complexity Very low < $10
Latency Medium (< 10 s)
[1] MCL: Maximum coupling loss
© Fraunhofer IIS 30
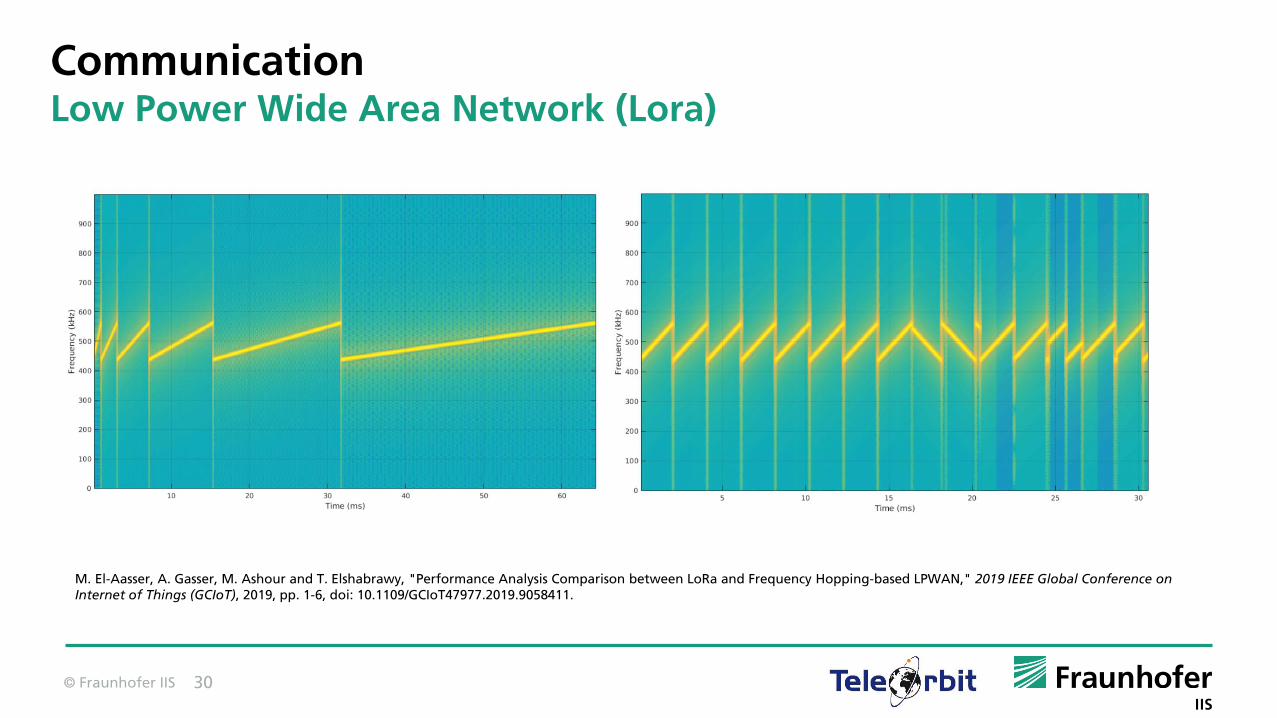
CommunicationLow Power Wide Area Network (Lora)
M. El-Aasser, A. Gasser, M. Ashour and T. Elshabrawy, "Performance Analysis Comparison between LoRa and Frequency Hopping-based LPWAN," 2019 IEEE Global Conference on Internet of Things (GCIoT), 2019, pp. 1-6, doi: 10.1109/GCIoT47977.2019.9058411.
© Fraunhofer IIS 31
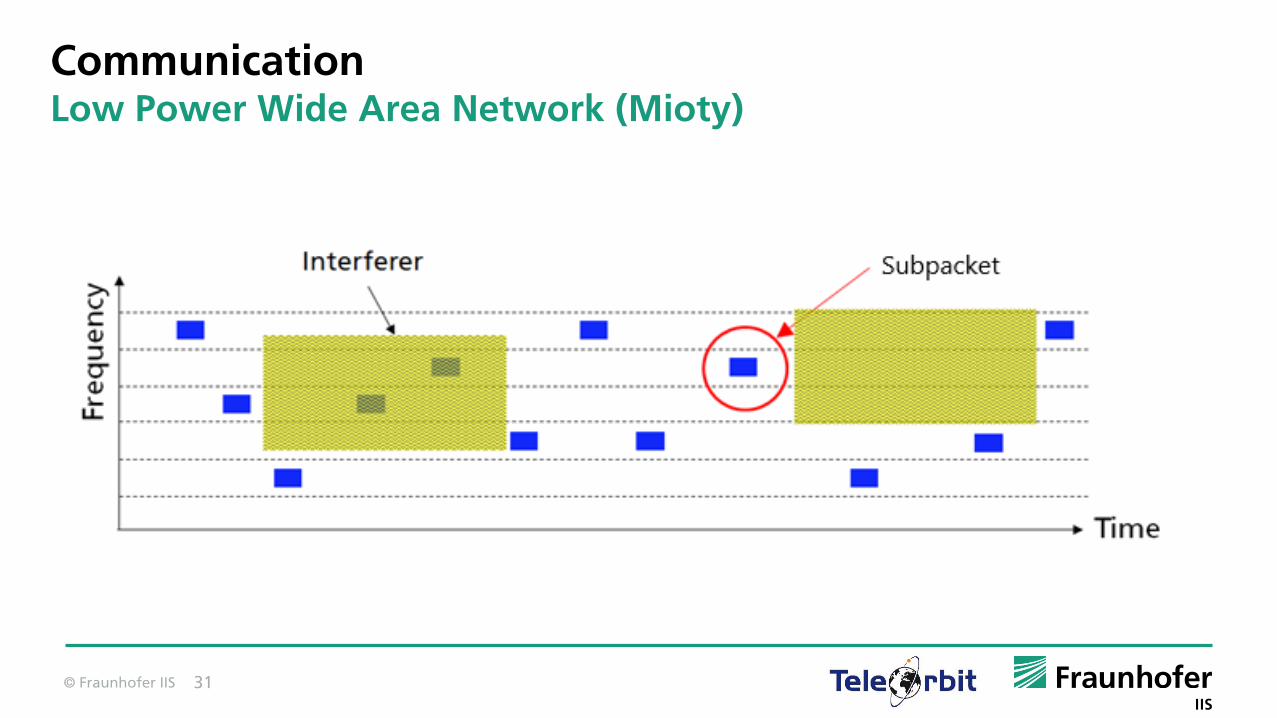
CommunicationLow Power Wide Area Network (Mioty)
© Fraunhofer IIS 32
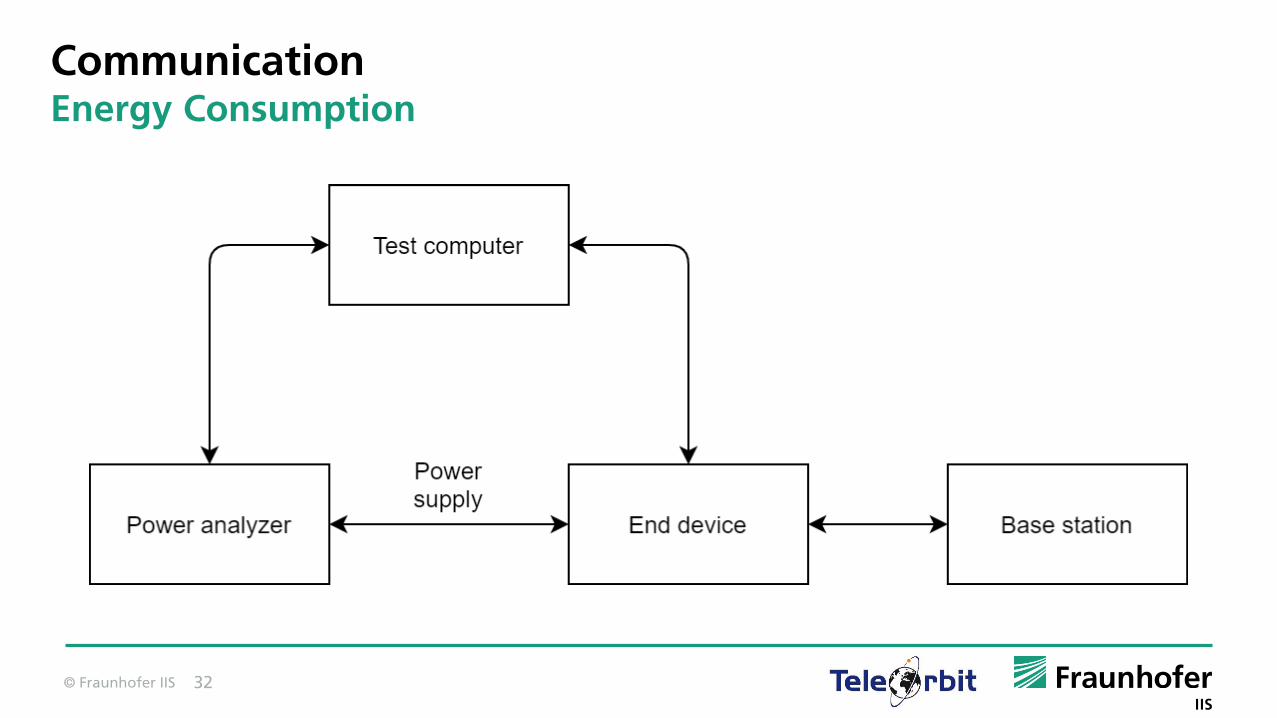
CommunicationEnergy Consumption
© Fraunhofer IIS 33
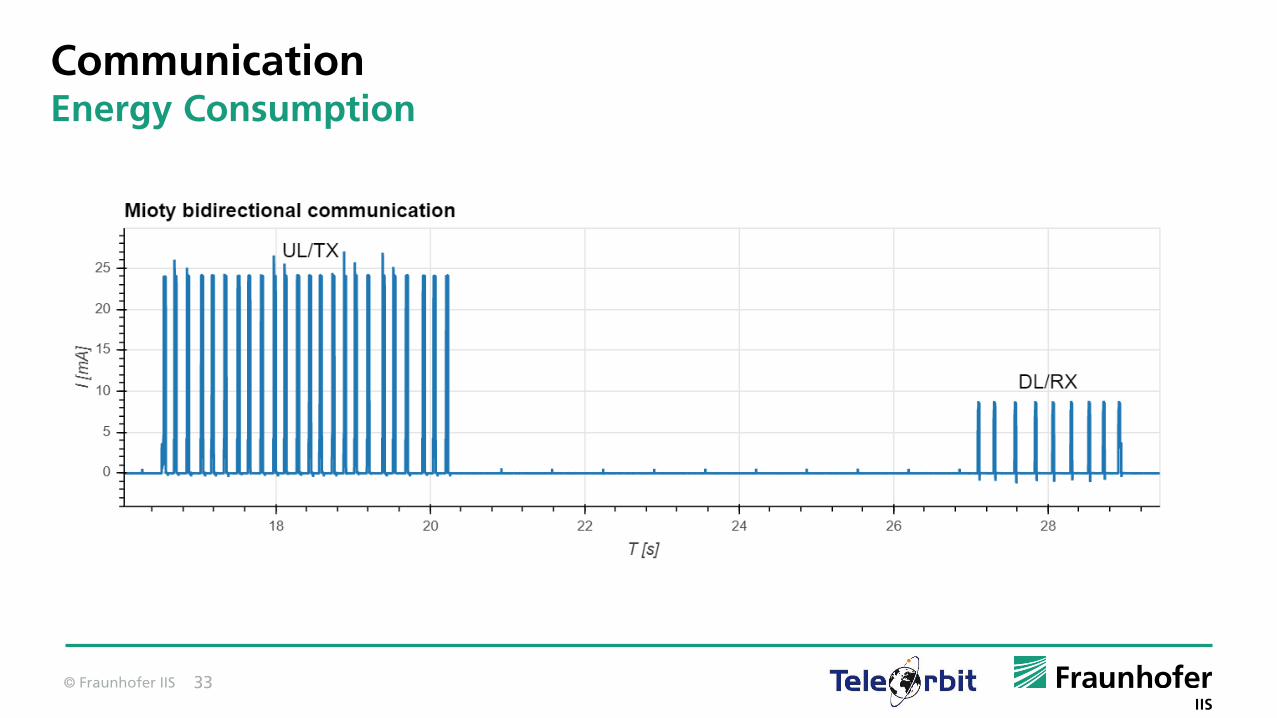
CommunicationEnergy Consumption

© Fraunhofer IIS 34
CommunicationEnergy Consumption
Casals Ibáñez, Lluis & Mir Masnou, Bernat & Vidal Ferré, Rafael & Gomez, Carles. (2017). Modeling the energy performance of LoRaWAN. Sensors. 17. 2364. 10.3390/s17102364.

© Fraunhofer IIS 35
CommunicationEnergy Consumption (Cattle Tracking)

© Fraunhofer IIS 36
CommunicationEnergy Consumption (Cattle Tracking)
Energy [J] Lora Mioty
Period 1 hour 5 years 1 hour 5 years
Location fix 1.1125.085 222.7 kJ
0.1950.752 32.9 kJNW
connection3.973 0.557
Sleep 0.534 0.534 23.4 kJ 0.118 0.118 5.2 kJ
Total 5.620 246.1 kJ 0.870 38.1 kJ

© Fraunhofer IIS 37
CommunicationAvailability (Cattle Tracking)
Property Value Comment
Band type ISM
Region Europe
Frequency band 868.0 – 868.6 MHz
Duty cycle 1 %
Transmit power 25 mWERP PERP = 1.64 * PEIRP
TX/RX antenna gain 0 / 0 dBi
Path loss exponent (PLE) 3.0
Range 8.92 km Maximum range
Packet length 20 bytes Application
Packet frequency 6x / hour
Packet error rate 1 %
[1] Source: Mikhaylov, Konstantin & Petäjäjärv, Juha & Hänninen, Tuomo. (2016). Analysis of the Capacity and Scalability of the LoRa Wide Area Network Technology.

© Fraunhofer IIS 38
CommunicationAvailability (Cattle Tracking)
𝑪𝑳 =σ𝒊=0𝑵 𝑻𝒊
𝑻𝒐𝒃𝒔𝒆𝒓𝒗𝒆𝒅
Channel load (CL) is the ratio between the sum of all packet durations (On air time) and the observed time span (in per cent) in one channel
Source: IIS system simulation
© Fraunhofer IIS 39
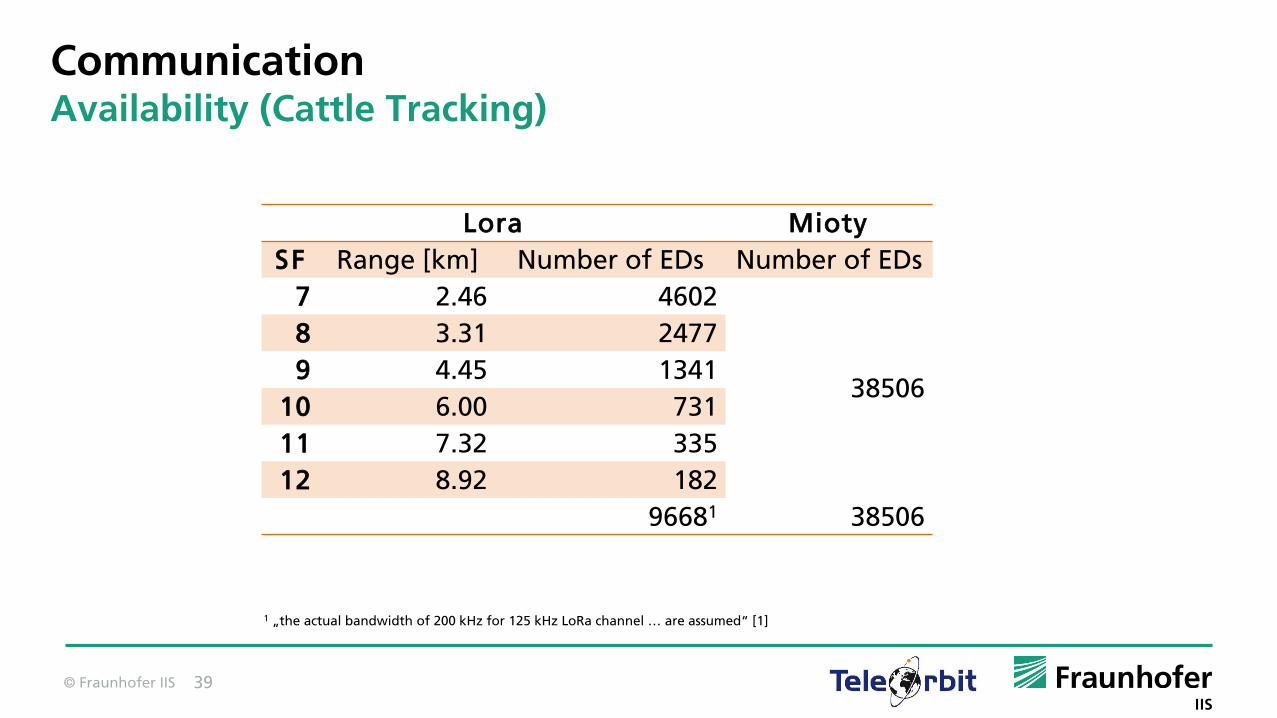
CommunicationAvailability (Cattle Tracking)
Lora Mioty
SF Range [km] Number of EDs Number of EDs
7 2.46 4602
38506
8 3.31 2477
9 4.45 1341
10 6.00 731
11 7.32 335
12 8.92 182
96681 38506
1 „the actual bandwidth of 200 kHz for 125 kHz LoRa channel … are assumed“ [1]

© Fraunhofer IIS 40
Energy SupplyCritical Review of State-of-the-Art – Energy Supply
SOA investigation of batteries
Primary vs. secondary batteries
Available chemistries
Energy density, pricing, shelf life
LiMnO2, LR20 (D-Cell), 15 Ah used for SOA simulations
Primary Cell AlkalineLithium iron
disulfide(LiFeS 2)
Lithium-thionylchloride
(LiSOCI2 or LTC)
Lithium manganese
dioxide(LiMnO2 or Li-M)
Lithium sulfurdioxide(LiSO2)
Specific energy
200Wh/kg 300Wh/kg 500Wh/kg 280Wh/kg 330Wh/kg
Voltage 1.5V 1.5V 3.6–3.9V 3–3.3V 2.8V
Power Low Moderate Excellent Moderate Moderate
Passivation N/A Moderate Moderate Moderate Moderate
Safety Good Good Precaution Good Precaution
Pricing Low Economical Industrial Economical Industrial
Shelf life 10 years 15 years 10–20 years 10–20 years 5–10 years
Operating temp
0°C to 60°C 0°C to 60°C -55°C to 85°C, higher for short time
-30°C to 60°Csome enable from-55°C to 90°C
-54°C to 71°C
Usage
Consumer devices
Swaps alkaline for higher power and long runtime
Horizontal drilling, (fracking). Not for consumer use.
Meter sensing,medical devices, road toll sensors, cameras
Defense; being replaced byLiMnO2
© Fraunhofer IIS 41
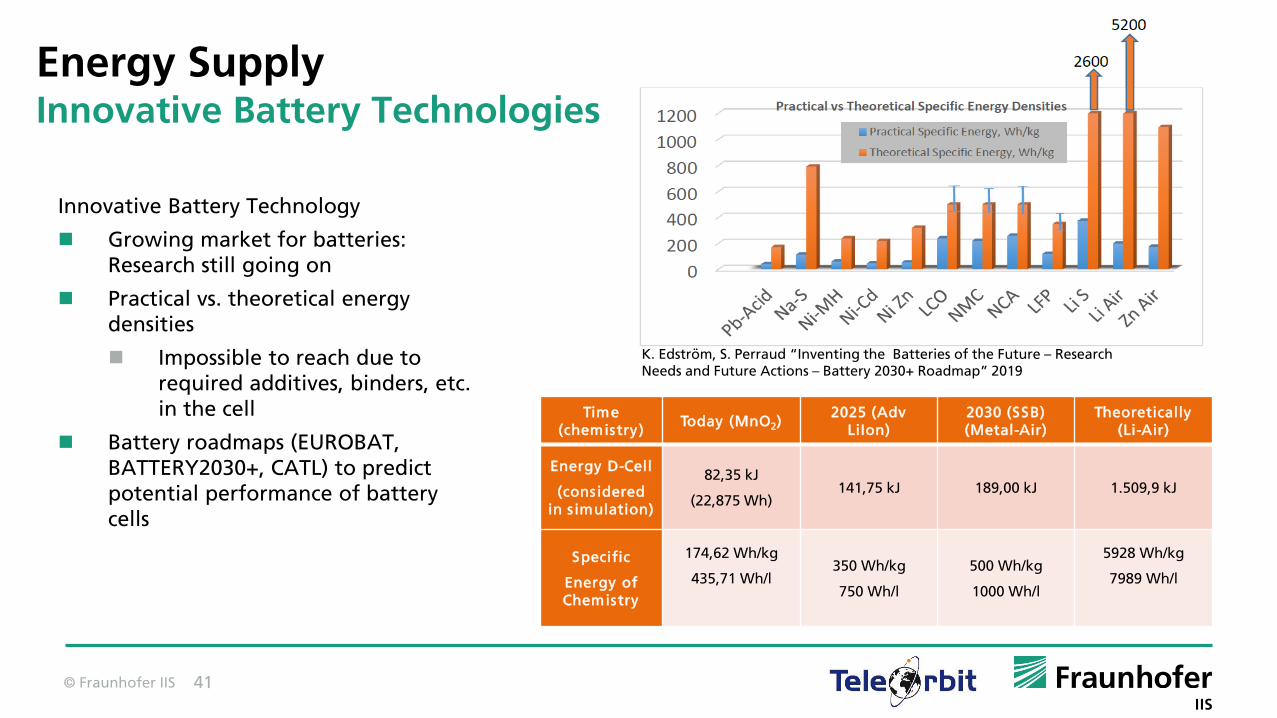
Energy SupplyInnovative Battery Technologies
Innovative Battery Technology
Growing market for batteries: Research still going on
Practical vs. theoretical energydensities
Impossible to reach due torequired additives, binders, etc. in the cell
Battery roadmaps (EUROBAT, BATTERY2030+, CATL) to predictpotential performance of batterycells
Time (chemistry)
Today (MnO2)2025 (Adv
LiIon)2030 (SSB) (Metal-Air)
Theoretically (Li-Air)
Energy D-Cell
(considered in s imulation)
82,35 kJ
(22,875 Wh)141,75 kJ 189,00 kJ 1.509,9 kJ
Specific
Energy of Chemistry
174,62 Wh/kg
435,71 Wh/l350 Wh/kg
750 Wh/l
500 Wh/kg
1000 Wh/l
5928 Wh/kg
7989 Wh/l
K. Edström, S. Perraud “Inventing the Batteries of the Future – Research Needs and Future Actions – Battery 2030+ Roadmap” 2019
© Fraunhofer IIS 42
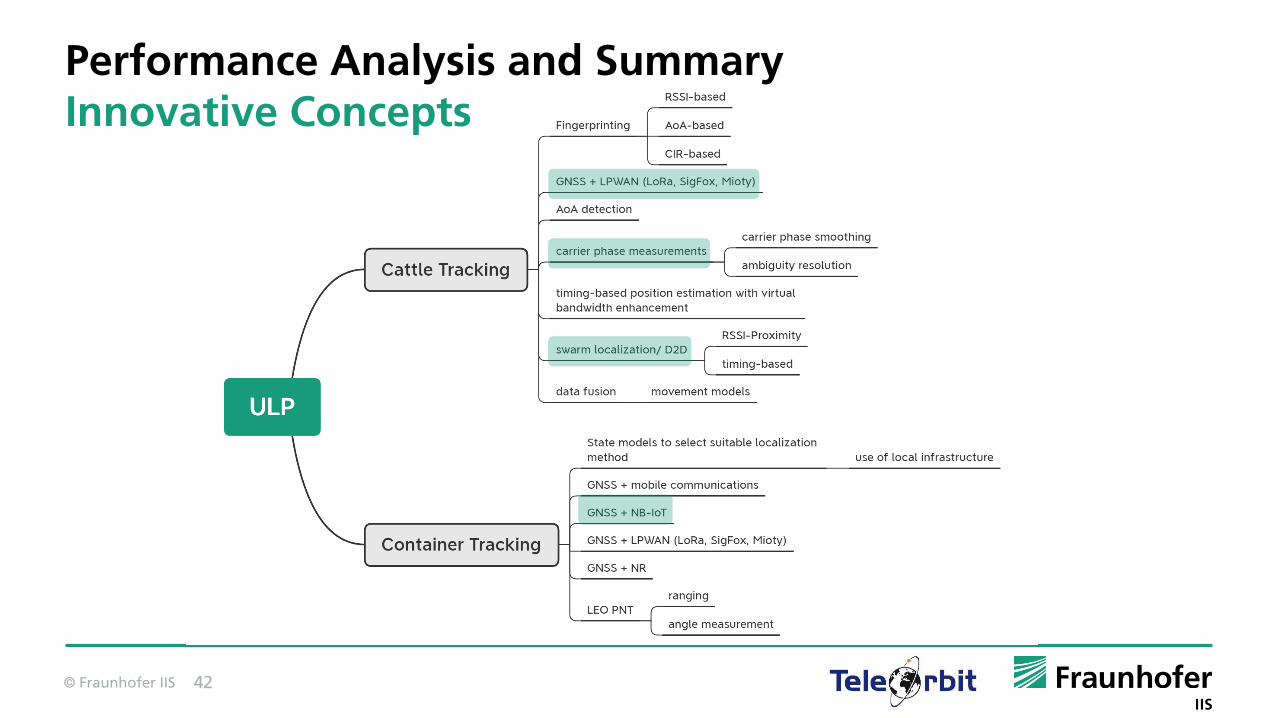
Performance Analysis and SummaryInnovative Concepts
© Fraunhofer IIS 43
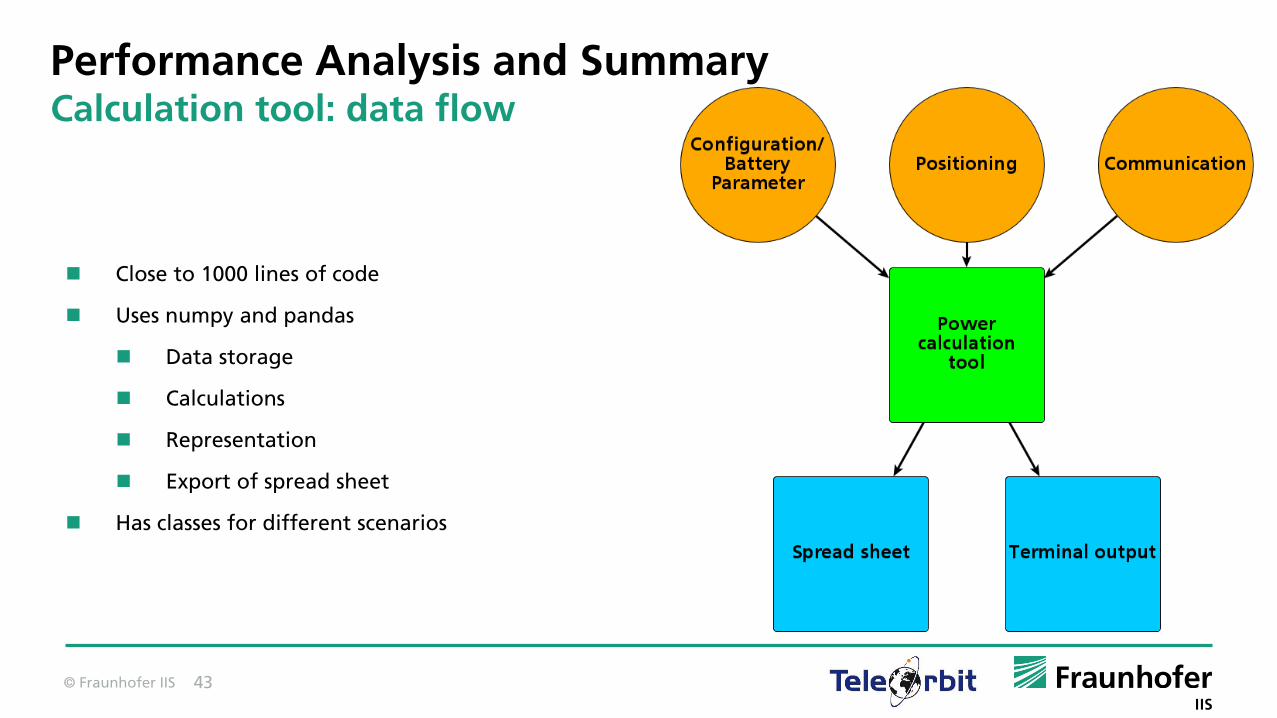
Performance Analysis and SummaryCalculation tool: data flow
Close to 1000 lines of code
Uses numpy and pandas
Data storage
Calculations
Representation
Export of spread sheet
Has classes for different scenarios

© Fraunhofer IIS 44
Performance Analysis and SummaryCalculation tool: internals

© Fraunhofer IIS 45
Performance Analysis and SummaryDetailed Trade-Off Analysis
Energies [kJ] GNSS BLE Snapshot PDoA Mioty LORA
Positioning (total) 64.78 45.34 4804.84 7.43
Communication (total) 32.58 222.49
Positioning (sleep) 5.20
Communication (sleep) 5.17 23.37
Energies [kJ] GNSS Snapshot NB-IoT
Positioning (total) 77.73 5765.81
Communication (total) 23.17
Communication (sleep) 8.39
Cattle Tracking
Container Tracking

© Fraunhofer IIS 46
Performance Analysis and SummaryInnovative battery technology
Container tracking with innovative batterytechnology
Energy per mission (6 years), required number of battery D-cells (53 cm3) and the required volume without considering a fixed battery cell format
Reduction of required number of cells
Reduction of required battery volumen
Snapshot: High energy for transmission of datapayload (snapshot data / NB-IoT not well suitedto transmit high amounts of data [16 Byte <> 16 kByte])
NB-IoT + GNSS NB-IoT + Snapshot
Total energy [kJ] 121.08 6946.78
MNO2 Number of Cells 2 108
MNO2 Volume [cm³] 99.40 5702.69
Advanced Li-Ion Number of Cells 2 63
Advanced Li-Ion Volume [cm³] 57.74 3312.99
SSB Number of Cells 1 47
SSB Volume [cm³] 43.31 2484.74
Li-Air Number of Cells 1 6
Li-Air Volume [cm³] 5.42 311.02
© Fraunhofer IIS 47
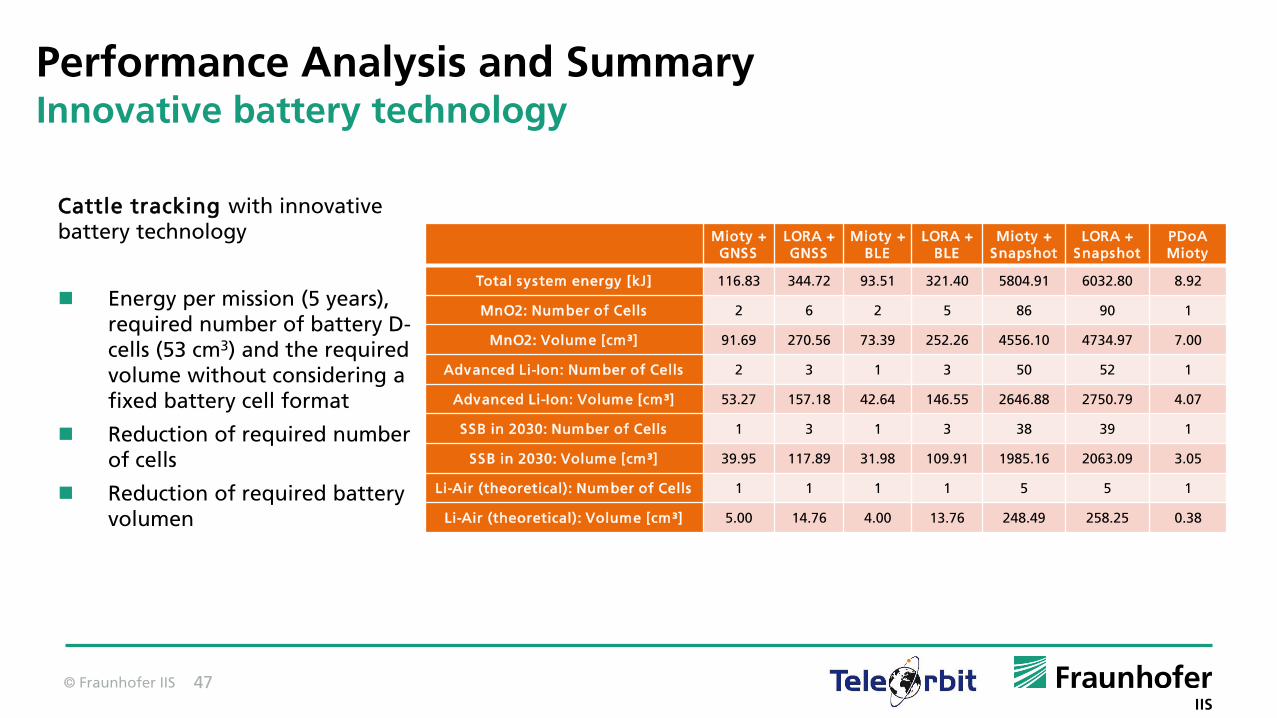
Performance Analysis and SummaryInnovative battery technology
Cattle tracking with innovative battery technology
Energy per mission (5 years), required number of battery D-cells (53 cm3) and the required volume without considering a fixed battery cell format
Reduction of required numberof cells
Reduction of required batteryvolumen
Mioty + GNSS
LORA + GNSS
Mioty + BLE
LORA + BLE
Mioty + Snapshot
LORA + Snapshot
PDoAMioty
Total system energy [kJ] 116.83 344.72 93.51 321.40 5804.91 6032.80 8.92
MnO2: Number of Cells 2 6 2 5 86 90 1
MnO2: Volume [cm³] 91.69 270.56 73.39 252.26 4556.10 4734.97 7.00
Advanced Li-Ion: Number of Cells 2 3 1 3 50 52 1
Advanced Li-Ion: Volume [cm³] 53.27 157.18 42.64 146.55 2646.88 2750.79 4.07
SSB in 2030: Number of Cells 1 3 1 3 38 39 1
SSB in 2030: Volume [cm³] 39.95 117.89 31.98 109.91 1985.16 2063.09 3.05
Li-Air (theoretical): Number of Cells 1 1 1 1 5 5 1
Li-Air (theoretical): Volume [cm³] 5.00 14.76 4.00 13.76 248.49 258.25 0.38

© Fraunhofer IIS 48
Conclusion
Reference Scenarios & Concept Benchmark
Cattle Tracking
Positioning
Communication
Benchmarking
Container Tracking
Positioning
Communication
Benchmarking
Battery Technologies

© Fraunhofer IIS 49
ConclusionCattle Tracking
Positioning:
Swarm Localization:
Reduced impact of GNSS on power consumption
Improvement in power consumption is traded for decreased positioning accuracy
Positioning accuracy and availability still satisfy use case requirements
Hardware components (GNSS, BLE, communication module like NB-IoT) available
Can be enhanced by adding infrastructure for more challenging scenarios

© Fraunhofer IIS 50
ConclusionCattle Tracking
Positioning:
Carrier Phase Measurements:
Concept with lowest tag power consumption, simple transceiver is sufficient
Achieves use case requirements regarding positioning accuracy and availability
No need of GNSS, but can GNSS can be used as fall-back solution outside the infrastructure area
Additional costs due to infrastructure (acquisition, maintenance)
Research and development of tag and dedicated infrastructure, like PDoA nodes, beacons, location server, is needed

© Fraunhofer IIS 51
ConclusionCattle Tracking
Communication
Main energy contributor is due to the network connection requirement for both LPWANs (Lora: 70 %, Mioty: 64 %)
Lora requires about 6.5 times more energy than a Mioty solution
Major difference between both systems is the widely available Lora infrastructure, which Mioty cannot provide at the moment.
In rural areas , which are assumed for cattle tracking, the expenses of setting up a local infrastructure is similar for both systems.
Availability : In a rural scenario, Mioty is able to cover 4 times as many end devices as Lora.

© Fraunhofer IIS 52
Benchmarking
Comparison of reference concept andinnovative concepts
LORA + GNSS: Reference Concept
LORA + Swarm Localization: Reduced total energy over 5 years of ~ 7%
Mioty + GNSS: Reduced total energy over 5 years of ~ 66%
Mioty + Swarm Localization: Reduced total energy over 5 years of ~ 72%
PDOA: Reduced total energy over 5 years of ~ 97%
LORA +
GNSS
Mioty
+ GNSS
Mioty +
Swarm
LORA +
Swarm
PDoA
Mitoy
Total system energy [kJ] 344.72 116.83 93.51 321.40 8.92
ConclusionCattle Tracking

© Fraunhofer IIS 53
ConclusionContainer Tracking
Positioning:
Snapshot:
Needs a communication system with higher bandwidth than LORA and Mioty
More energy than other technologies
Most energy for the data transfer
Communication:
NB-IoT:
Only “global” LPWAN
Used as reference concept, despite no NB-IoT solution available yet
Lower power consumption than other mobile communication standards

© Fraunhofer IIS 54
Benchmarking
NB-IoT + GNSS: Reference Concept
NB-IoT + Snapshot: Total energy over 6 years ~ 56x higher
NB-IoT + GNSS NB-IoT + Snapshot
Total system energy [kJ] 121.08 6946.78
ConclusionContainer Tracking
© Fraunhofer IIS 55
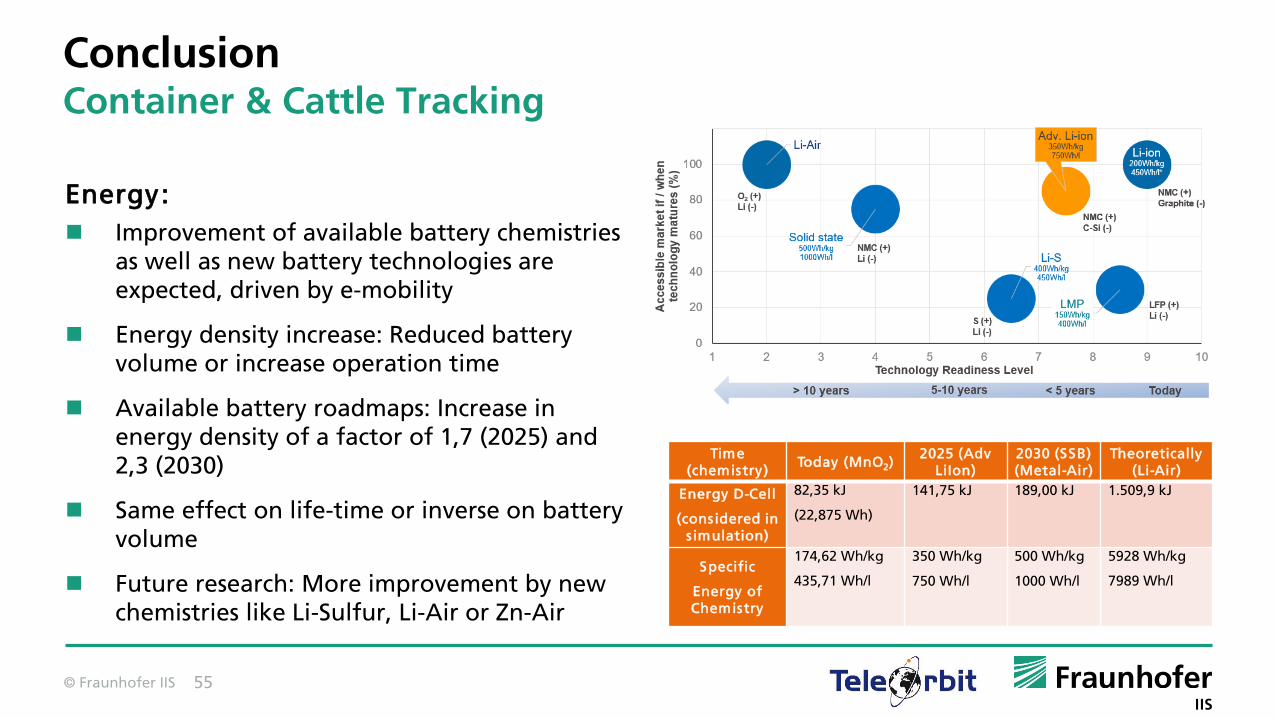
Energy:
Improvement of available battery chemistries as well as new battery technologies are expected, driven by e-mobility
Energy density increase: Reduced battery volume or increase operation time
Available battery roadmaps: Increase in energy density of a factor of 1,7 (2025) and 2,3 (2030)
Same effect on life-time or inverse on battery volume
Future research: More improvement by new chemistries like Li-Sulfur, Li-Air or Zn-Air
Time (chemistry)
Today (MnO2)2025 (Adv
LiIon)2030 (SSB) (Metal-Air)
Theoretically (Li-Air)
Energy D-Cell
(considered in s imulation)
82,35 kJ
(22,875 Wh)
141,75 kJ 189,00 kJ 1.509,9 kJ
Specific
Energy of Chemistry
174,62 Wh/kg
435,71 Wh/l
350 Wh/kg
750 Wh/l
500 Wh/kg
1000 Wh/l
5928 Wh/kg
7989 Wh/l
ConclusionContainer & Cattle Tracking

© Fraunhofer IIS 56
Business AnalysisPreliminary High Level Cost Benefit Analysis (1/5)
Split into two parts: follow-on activity (demo project) and market introduction
Timeframe:
demonstration project: circa within the next 24 months starting in early 2022;
final product development and market introduction: to start after the 24 months in roughly 3 to 5 years from now.
Limitations:
Difficult to predict all variables
Only as good as the data used
Better suited to short- and mid-length “projects”
Removes the “human element”

© Fraunhofer IIS 57
Business AnalysisPreliminary High Level Cost Benefit Analysis (2/5)
CBA for the follow-on activity
“Why do we want to pursue a demonstration project?”
interesting business case with attractive profit margins for all partners in a fast growing market with scalability opportunities
Reduced risk for partners due to co-funding from Agency
Prototype with high TRL to allow for a quick time-to-market after the demonstration project
Objective: develop solution that outperforms available technologies, and/or significantly improves user satisfaction, and/or reduces costs
Alternatives:
No funding: higher risk, other factors remain
No project: no further cost; potentially missed business opportunity

© Fraunhofer IIS 58
Business AnalysisPreliminary High Level Cost Benefit Analysis (3/5)
The feasibility study has shown that there exist a few established as well as innovative
technologies that could be utilised for future ultra-low power devices. In particular the
following three concepts are of interest to the team and would be evaluated and
demonstrated in detail during the demonstration project:
Cattle tracking:
Swarm Localisation (GNSS, BLE plus Mioty or maybe NB-IoT), or
Carrier-phase measurements plus Mioty.
Container tracking:
Standard GNSS plus NB-IoT/LPWAN
Both scenarios and the three concepts share the battery technology component (MnO2
and if possible future developments like advanced Li-Ion, …)

© Fraunhofer IIS 59
Business AnalysisPreliminary High Level Cost Benefit Analysis (4/5)
CBA for the market introduction
“Does it (still) make commercial sense to finalise the development of the product/service and enter the market?”
More complex question to answer than before (esp. given timeframe)
Ideal scenario: there continues to be an interesting business case with attractive profit margins for all partners
Objective: come up with a commercially sensible and realistic business case / service & product offering which generates desired profit margins
Alternatives:
not entering the market after all
not entering the market directly but indirectly by “selling” the IPR
© Fraunhofer IIS 60
Business AnalysisPreliminary High Level Cost Benefit Analysis (5/5)
Conclusion for both CBAs:
Phase 2 / demonstration project:
Clear go! given the benefits and the reduced risk of the ESA co-funding
More difficult decision if no ESA funding obtainable
Phase 3 / Market introduction:
More unknowns at this stage, no clear go!
Interesting market development/growth that leads to recommendation to focus on market entry during demonstration project

© Fraunhofer IIS 61
Way Forward Recommendations (1/2)
Commercial evaluation, road map, follow-on work
Attractive market size and future projection: US-$ 300 bn and an expected growth to around 4 to 5 times that by the 2025-2027 timeframe
Big companies are active (e.g., Vodafone or Huawei) which shows relative maturity of market and leads to challenges for new entries (technological leap or marketing budget)
New technologies like 5G/6G and better battery technologies can allow new party to enter market successfully (needs to happen quickly)

© Fraunhofer IIS 62
Way Forward Recommendations (2/2)
Commercial evaluation, road map, follow-on work As outlined before: next step on roadmap is the demonstration project with the
following main tasks:
Detailed evaluation of proposed concepts in terms of their advantages and disadvantages technology-wise but also in terms of cost, availability, and longevity
Selection of the best fitting technology and setup of the prototypes to demonstrate their theoretical capabilities in a field test
Cattle tracking demonstrator:
Swarm Localisation (GNSS, BLE plus Mioty or maybe NB-IoT), or
Carrier-phase measurements (GNSS) plus Mioty.
Container tracking demonstrator:
Standard GNSS plus NB-IoT/LPWAN

© Fraunhofer IIS 63
Thank you for your attention!
Katrin Dietmayer
Matthias Overbeck
Bastian Perner
Jürgen Seybold
Daniel Seybold
Florian Kunzi
Florian Baumgärtner
Wolfram Strauß
Fabio GarziaNorbert Franke
Ferdinand Kemeth
Peter Spies
Jonas Bönsch

© Fraunhofer IIS 64
THANK YOU FOR YOUR SUPPORT
Florin-Catalin Grec,Francesca Zanier,
Rui Sarnadas,Lionel Ries,
and ESA


