1
John CahoonCertified Photogrammetrist
President
Kenney Aerial Mapping, Inc.
4008 North 15th Avenue
Phoenix, AZ 85015
602-258-6471
www.kam-az.com
LSIT RLS Review Seminar:
Photogrammetry
Definition of Photogrammetry
MANUAL OF PHOTOGRAMMETRY Fourth
Edition:
“ Photogrammetry is the art, science and technology
of obtaining reliable information about physical
objects and the environment through processes of
recording, measuring, and interpreting photographic
images and patterns of electromagnetic radiant
energy and other phenomena.”
Aircraft:
Cessna 206 Turbo Charged
Typical Aerial Mapping Aircraft
2
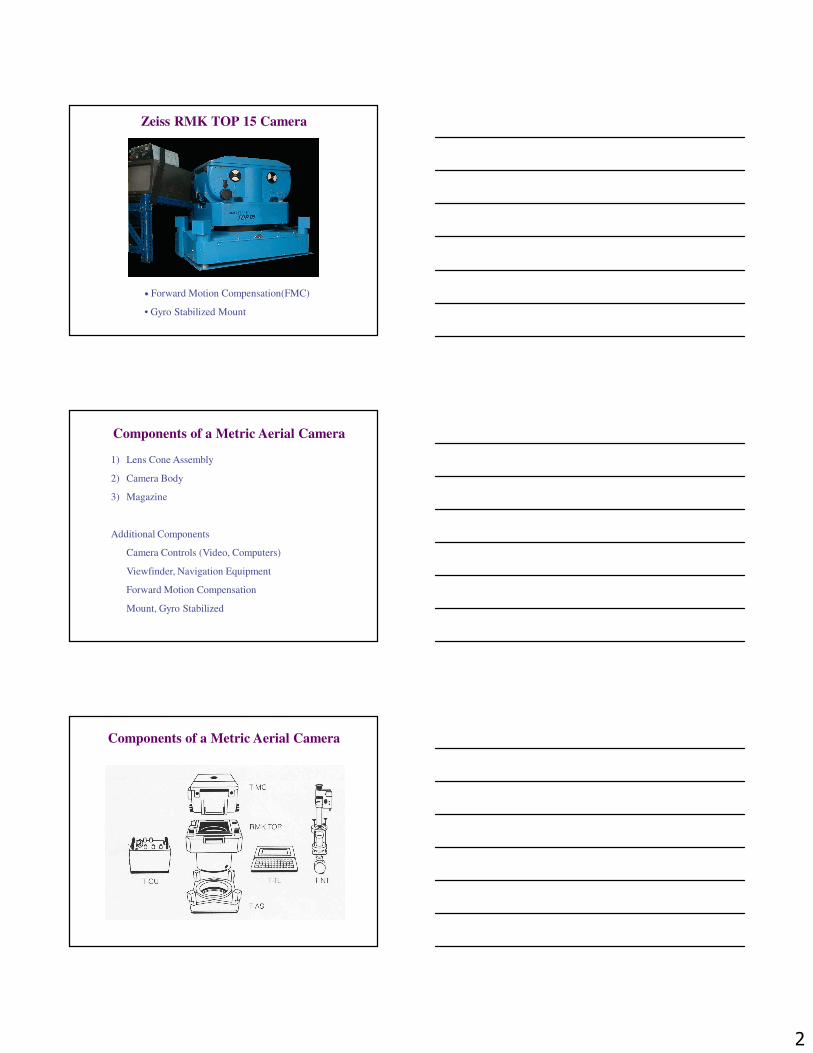
• Forward Motion Compensation(FMC)
• Gyro Stabilized Mount
Zeiss RMK TOP 15 Camera
Components of a Metric Aerial Camera
1) Lens Cone Assembly
2) Camera Body
3) Magazine
Additional Components
Camera Controls (Video, Computers)
Viewfinder, Navigation Equipment
Forward Motion Compensation
Mount, Gyro Stabilized
Components of a Metric Aerial Camera
3
Interior of a Metric Aerial Camera
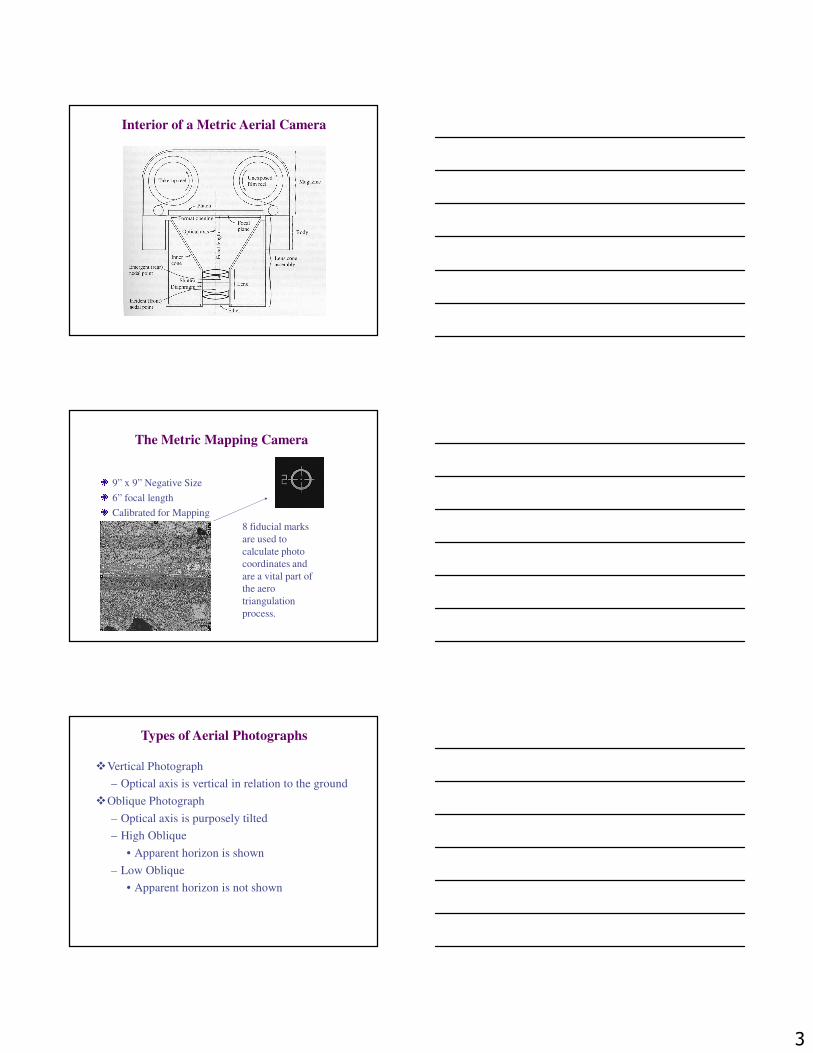
The Metric Mapping Camera
9” x 9” Negative Size
6” focal length
Calibrated for Mapping
8 fiducial marks
are used to
calculate photo
coordinates and
are a vital part of
the aero
triangulation
process.
Types of Aerial Photographs
�Vertical Photograph
– Optical axis is vertical in relation to the ground
�Oblique Photograph
– Optical axis is purposely tilted
– High Oblique
• Apparent horizon is shown
– Low Oblique
• Apparent horizon is not shown

4
Flying Height
� Generally from 1000’ to 20000’ above sea level
for small single and twin engine aircraft
�Land with very high elevations reduces our
ability to obtain small scale photography
� Average flying height above ground defines the
photo scale
� The relationship of flying height to photo scale
is linear
� Double the flying height will double the photo
scale, but it covers 4 times the area.
Photographic Scale
�A function of Flying Height above mean terrain
Expressed as AGL, AMT
�Flying Height above mean sea level
Expressed as MSL, ASL
�Photographic Scale as a ratio
1:7200 means 1 part in 7200: 1m = 7200m
�7200/12 (inches per foot) expresses the scale in
inches to feet.
7200/12=600 or 1”=600’
Photographic Scale
�Photo Scale is Uniform Across the Photo if:
– It is a truly vertical photograph
– Ground is flat across the entire photograph
�Photo Scale varies due to tilt and elevation changes
in the ground.
– A truly vertical photograph with flat terrain will
have a constant scale.
– If the ground elevation varies the scale will vary.
5
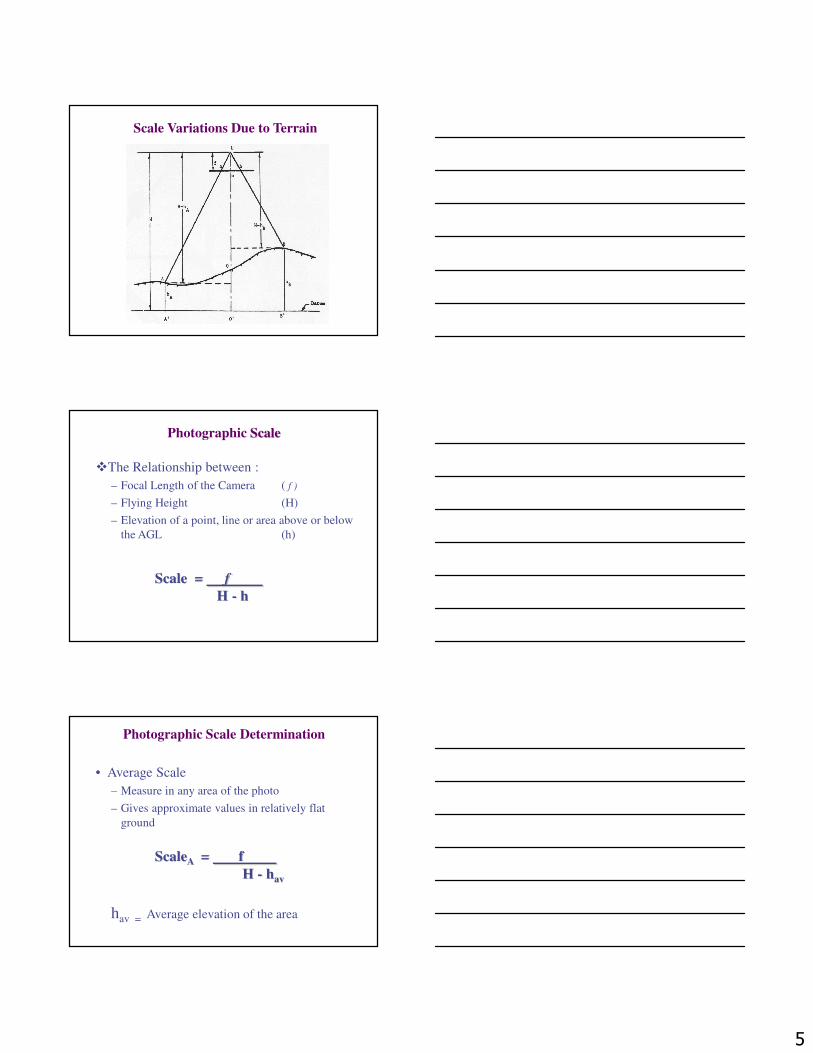
Scale Variations Due to Terrain
Photographic Scale
�The Relationship between :
– Focal Length of the Camera ( f )
– Flying Height (H)
– Elevation of a point, line or area above or below
the AGL (h)
Scale = f
H - h
Photographic Scale Determination
• Average Scale
– Measure in any area of the photo
– Gives approximate values in relatively flat
ground
hav = Average elevation of the area
ScaleA = f
H - hav
6
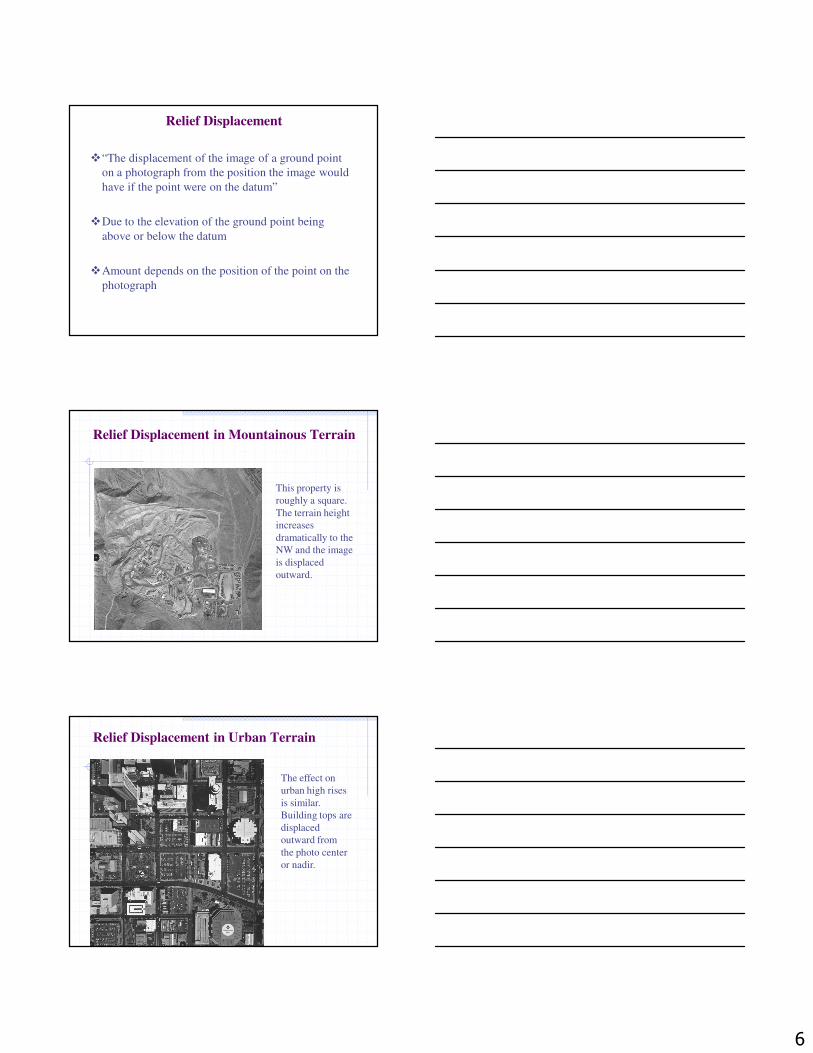
Relief Displacement
�“The displacement of the image of a ground point
on a photograph from the position the image would
have if the point were on the datum”
�Due to the elevation of the ground point being
above or below the datum
�Amount depends on the position of the point on the
photograph
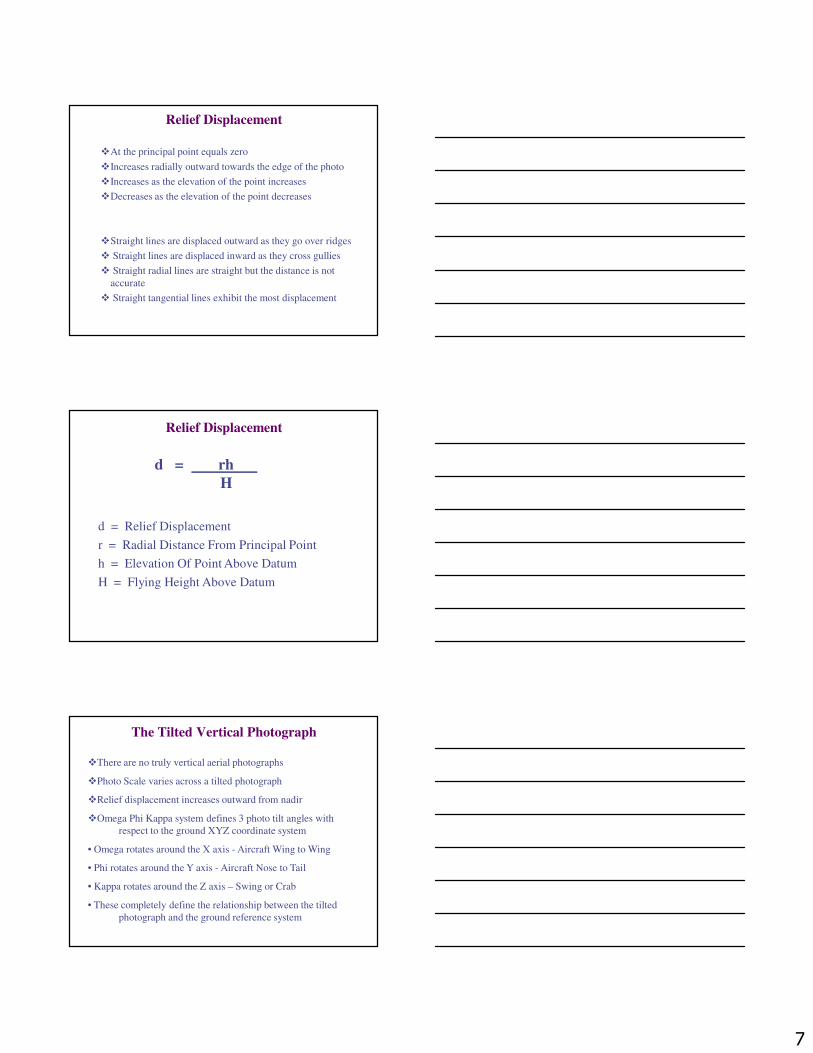
Relief Displacement in Mountainous Terrain
This property is
roughly a square.
The terrain height
increases
dramatically to the
NW and the image
is displaced
outward.
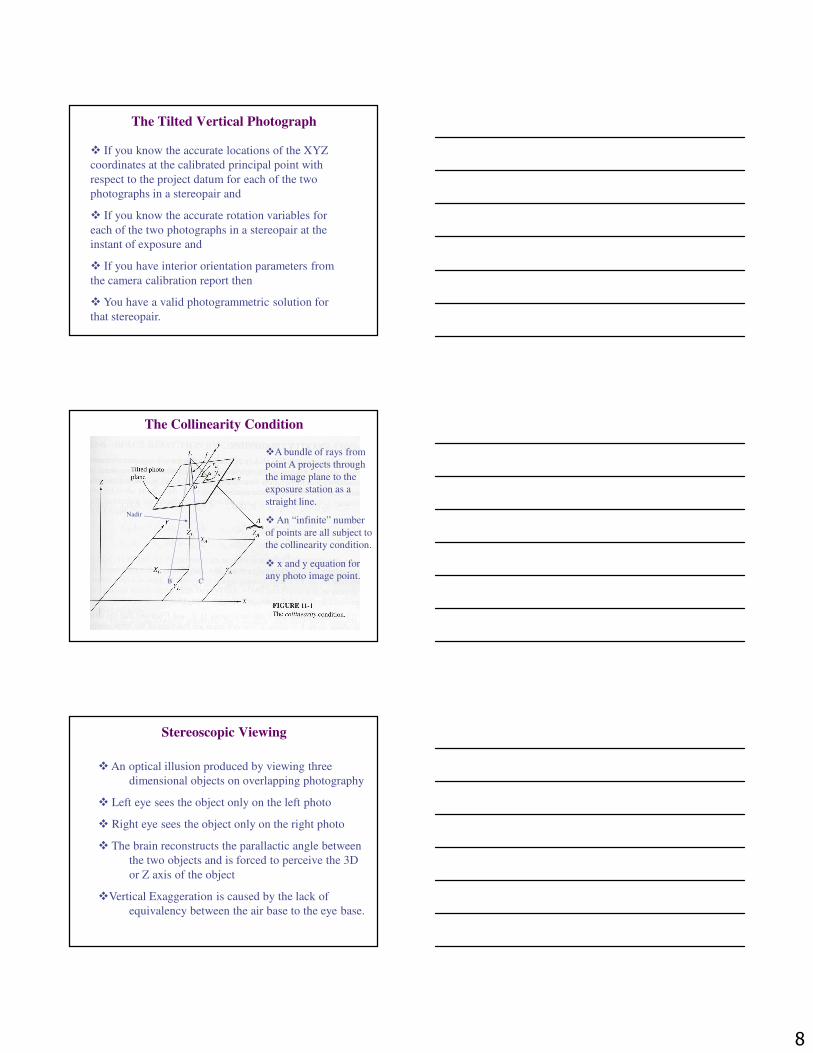
Relief Displacement in Urban Terrain
The effect on
urban high rises
is similar.
Building tops are
displaced
outward from
the photo center
or nadir.
7
Relief Displacement
�At the principal point equals zero
�Increases radially outward towards the edge of the photo
�Increases as the elevation of the point increases
�Decreases as the elevation of the point decreases
�Straight lines are displaced outward as they go over ridges
� Straight lines are displaced inward as they cross gullies
� Straight radial lines are straight but the distance is not
accurate
� Straight tangential lines exhibit the most displacement
Relief Displacement
d = Relief Displacement
r = Radial Distance From Principal Point
h = Elevation Of Point Above Datum
H = Flying Height Above Datum
d = rh
H
The Tilted Vertical Photograph
�There are no truly vertical aerial photographs
�Photo Scale varies across a tilted photograph
�Relief displacement increases outward from nadir
�Omega Phi Kappa system defines 3 photo tilt angles with
respect to the ground XYZ coordinate system
• Omega rotates around the X axis - Aircraft Wing to Wing
• Phi rotates around the Y axis - Aircraft Nose to Tail
• Kappa rotates around the Z axis – Swing or Crab
• These completely define the relationship between the tilted
photograph and the ground reference system
8
The Tilted Vertical Photograph
� If you know the accurate locations of the XYZ
coordinates at the calibrated principal point with
respect to the project datum for each of the two
photographs in a stereopair and
� If you know the accurate rotation variables for
each of the two photographs in a stereopair at the
instant of exposure and
� If you have interior orientation parameters from
the camera calibration report then
� You have a valid photogrammetric solution for
that stereopair.
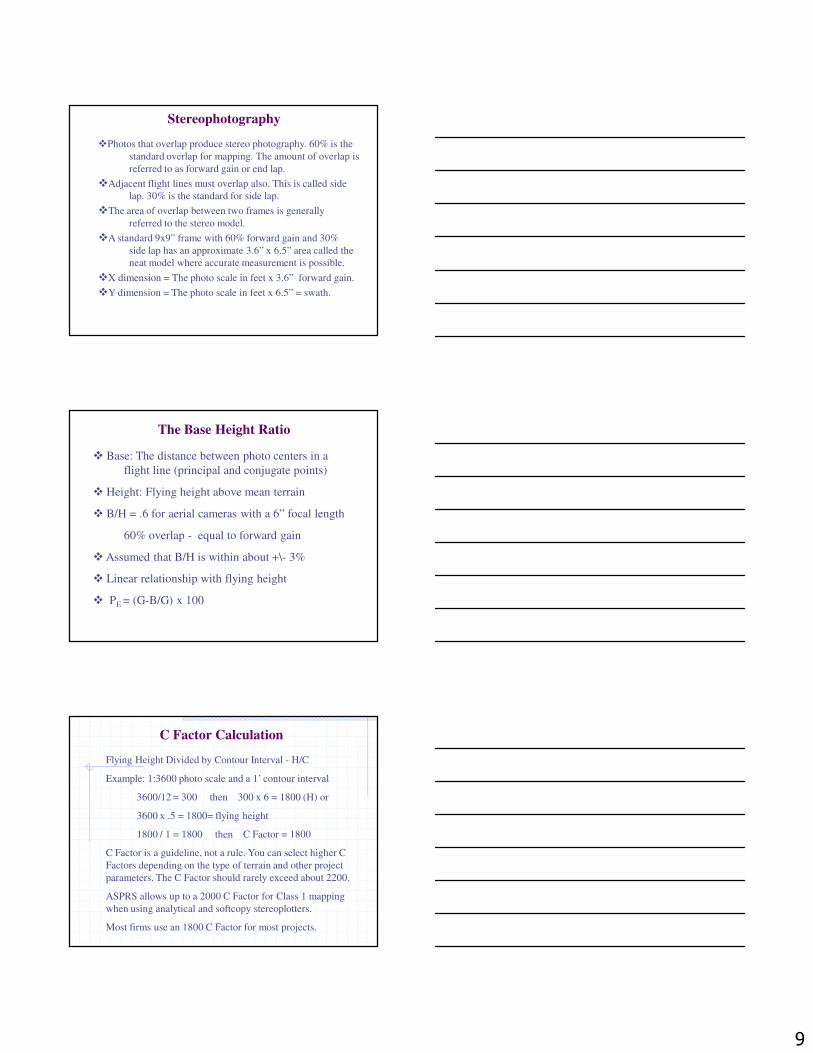
The Collinearity Condition
�A bundle of rays from
point A projects through
the image plane to the
exposure station as a
straight line.
�An “infinite” number
of points are all subject to
the collinearity condition.
� x and y equation for
any photo image point.B C
Nadir
Stereoscopic Viewing
� An optical illusion produced by viewing three
dimensional objects on overlapping photography
� Left eye sees the object only on the left photo
� Right eye sees the object only on the right photo
� The brain reconstructs the parallactic angle between
the two objects and is forced to perceive the 3D
or Z axis of the object
�Vertical Exaggeration is caused by the lack of
equivalency between the air base to the eye base.
9
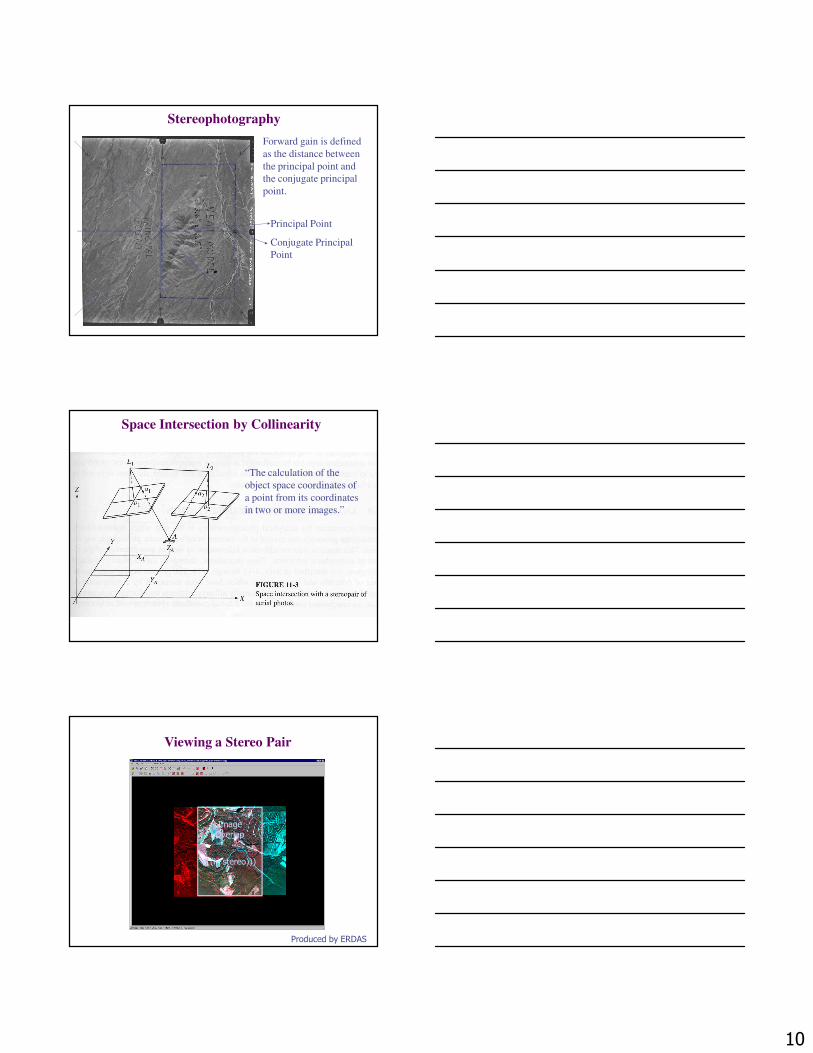
Stereophotography
�Photos that overlap produce stereo photography. 60% is the
standard overlap for mapping. The amount of overlap is
referred to as forward gain or end lap.
�Adjacent flight lines must overlap also. This is called side
lap. 30% is the standard for side lap.
�The area of overlap between two frames is generally
referred to the stereo model.
�A standard 9x9” frame with 60% forward gain and 30%
side lap has an approximate 3.6” x 6.5” area called the
neat model where accurate measurement is possible.
�X dimension = The photo scale in feet x 3.6” forward gain.
�Y dimension = The photo scale in feet x 6.5” = swath.
The Base Height Ratio
� Base: The distance between photo centers in a
flight line (principal and conjugate points)
� Height: Flying height above mean terrain
� B/H = .6 for aerial cameras with a 6” focal length
60% overlap - equal to forward gain
� Assumed that B/H is within about +\- 3%
� Linear relationship with flying height
� PE = (G-B/G) x 100
C Factor Calculation
Flying Height Divided by Contour Interval - H/C
Example: 1:3600 photo scale and a 1’ contour interval
3600/12 = 300 then 300 x 6 = 1800 (H) or
3600 x .5 = 1800= flying height
1800 / 1 = 1800 then C Factor = 1800
C Factor is a guideline, not a rule. You can select higher C
Factors depending on the type of terrain and other project
parameters. The C Factor should rarely exceed about 2200.
ASPRS allows up to a 2000 C Factor for Class 1 mapping
when using analytical and softcopy stereoplotters.
Most firms use an 1800 C Factor for most projects.
10
Stereophotography
Forward gain is defined
as the distance between
the principal point and
the conjugate principal
point.
Principal Point
Conjugate Principal
Point
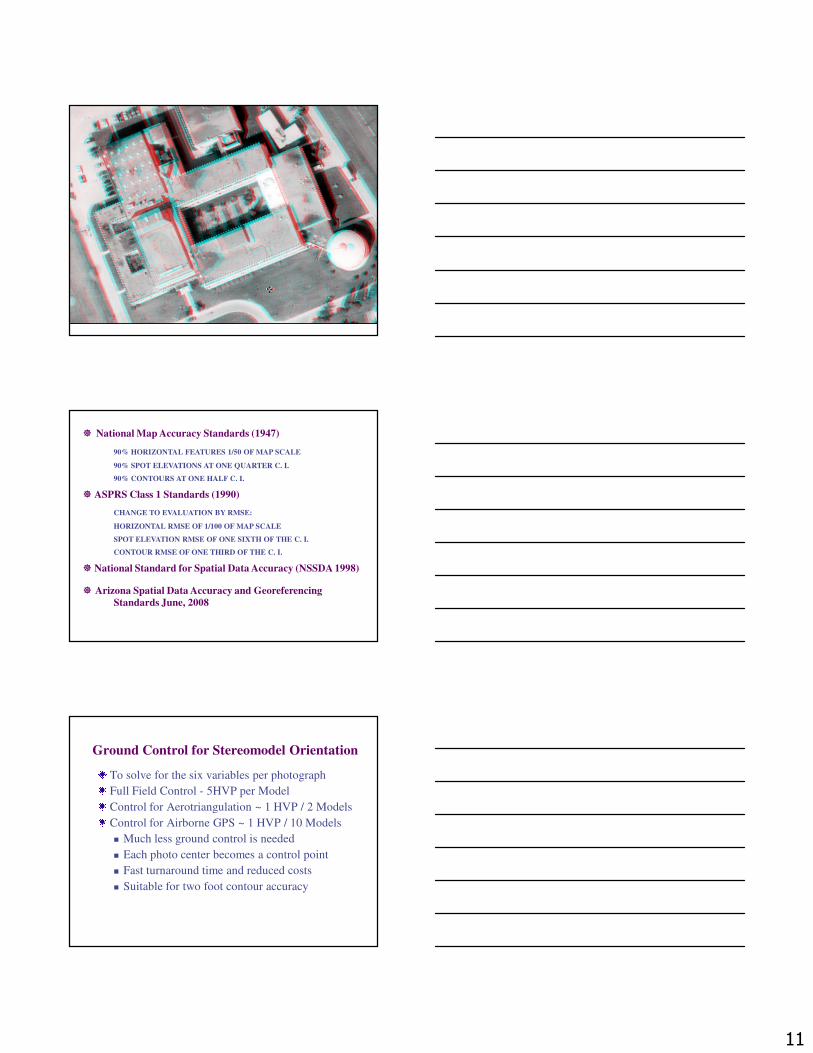
Space Intersection by Collinearity
“The calculation of the
object space coordinates of
a point from its coordinates
in two or more images.”
Viewing a Stereo Pair
Image Overlap
ImageOverlap
(((in stereo)))
Produced by ERDAS
11
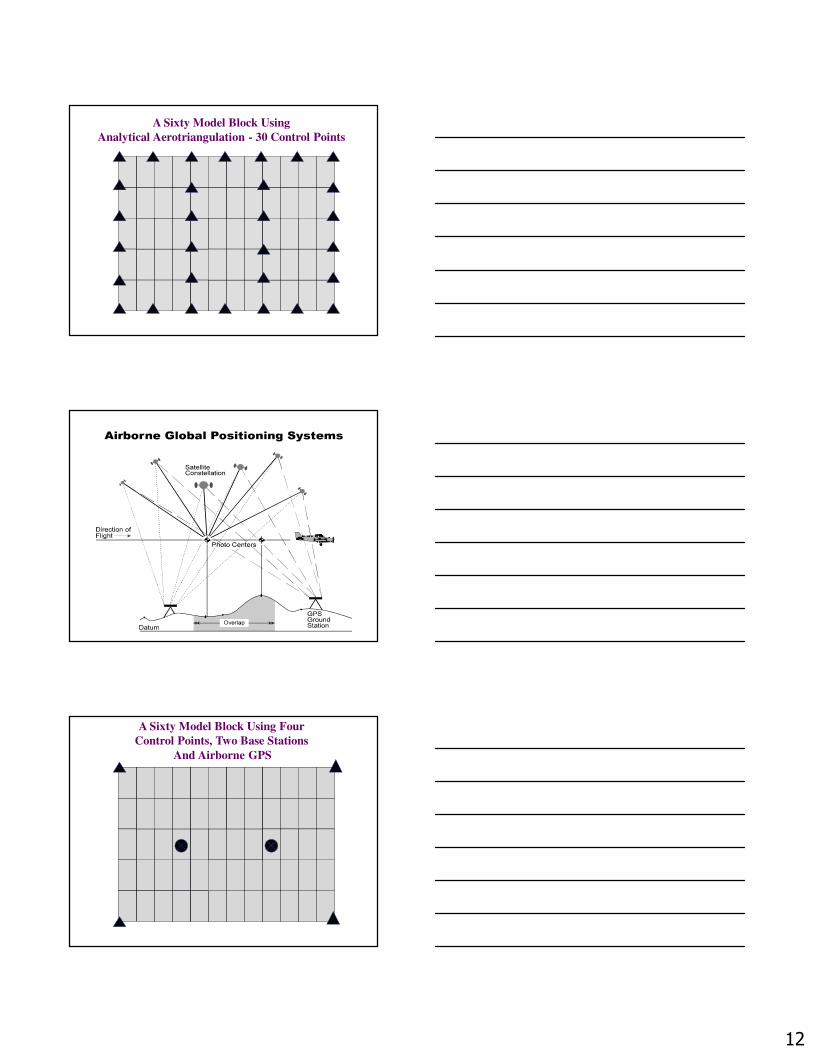
� National Map Accuracy Standards (1947)
90% HORIZONTAL FEATURES 1/50 OF MAP SCALE
90% SPOT ELEVATIONS AT ONE QUARTER C. I.
90% CONTOURS AT ONE HALF C. I.
� ASPRS Class 1 Standards (1990)
CHANGE TO EVALUATION BY RMSE:
HORIZONTAL RMSE OF 1/100 OF MAP SCALE
SPOT ELEVATION RMSE OF ONE SIXTH OF THE C. I.
CONTOUR RMSE OF ONE THIRD OF THE C. I.
� National Standard for Spatial Data Accuracy (NSSDA 1998)
� Arizona Spatial Data Accuracy and Georeferencing
Standards June, 2008
Ground Control for Stereomodel Orientation
To solve for the six variables per photograph
Full Field Control - 5HVP per Model
Control for Aerotriangulation ~ 1 HVP / 2 Models
Control for Airborne GPS ~ 1 HVP / 10 Models
� Much less ground control is needed
� Each photo center becomes a control point
� Fast turnaround time and reduced costs
� Suitable for two foot contour accuracy
12
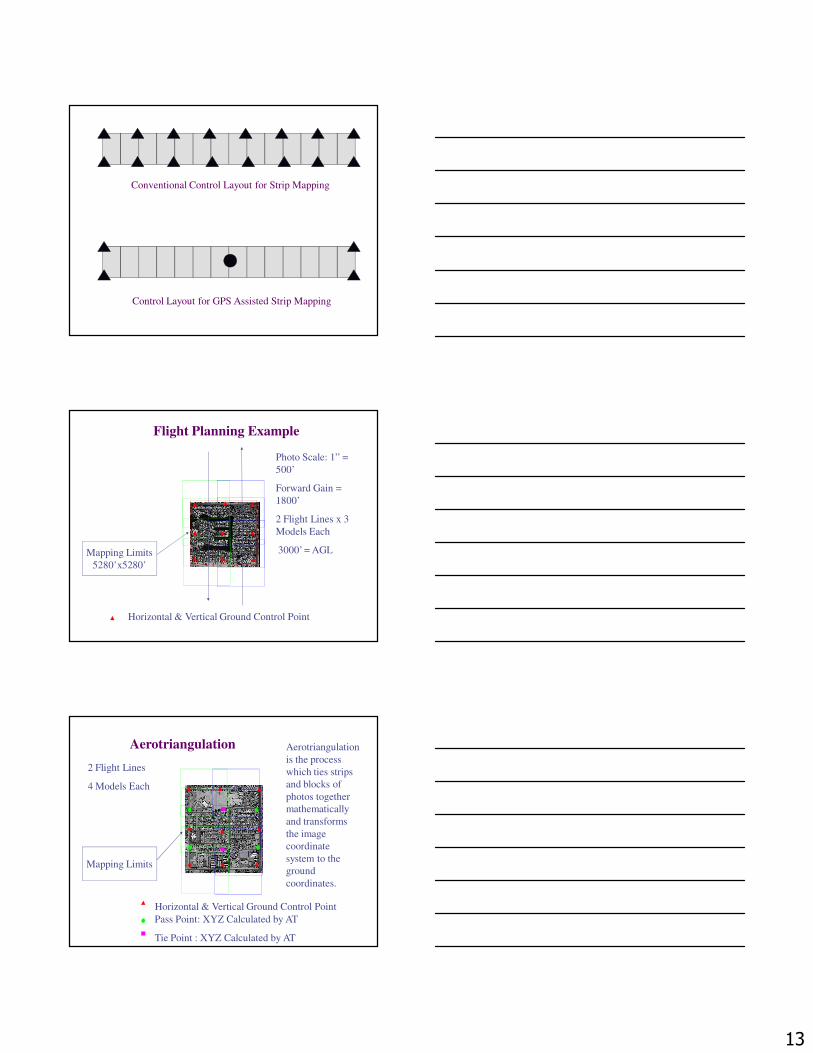
A Sixty Model Block Using
Analytical Aerotriangulation - 30 Control Points
A Sixty Model Block Using Four
Control Points, Two Base Stations
And Airborne GPS
13
Conventional Control Layout for Strip Mapping
Control Layout for GPS Assisted Strip Mapping
Mapping Limits
5280’x5280’
Horizontal & Vertical Ground Control Point
Flight Planning Example
Photo Scale: 1” =
500’
Forward Gain =
1800’
2 Flight Lines x 3
Models Each
3000’ = AGL
Mapping Limits
Horizontal & Vertical Ground Control Point
Pass Point: XYZ Calculated by AT
Tie Point : XYZ Calculated by AT
2 Flight Lines
4 Models Each
Aerotriangulation Aerotriangulation
is the process
which ties strips
and blocks of
photos together
mathematically
and transforms
the image
coordinate
system to the
ground
coordinates.
14
Zeiss P3 Analytical Stereoplotter
Digital Photogrammetric Workstation
2D Planimetric Features
15
A DTM in Very Irregular Terrain
Rendering of a TIN Surface
Contours and Spot Elevations
16
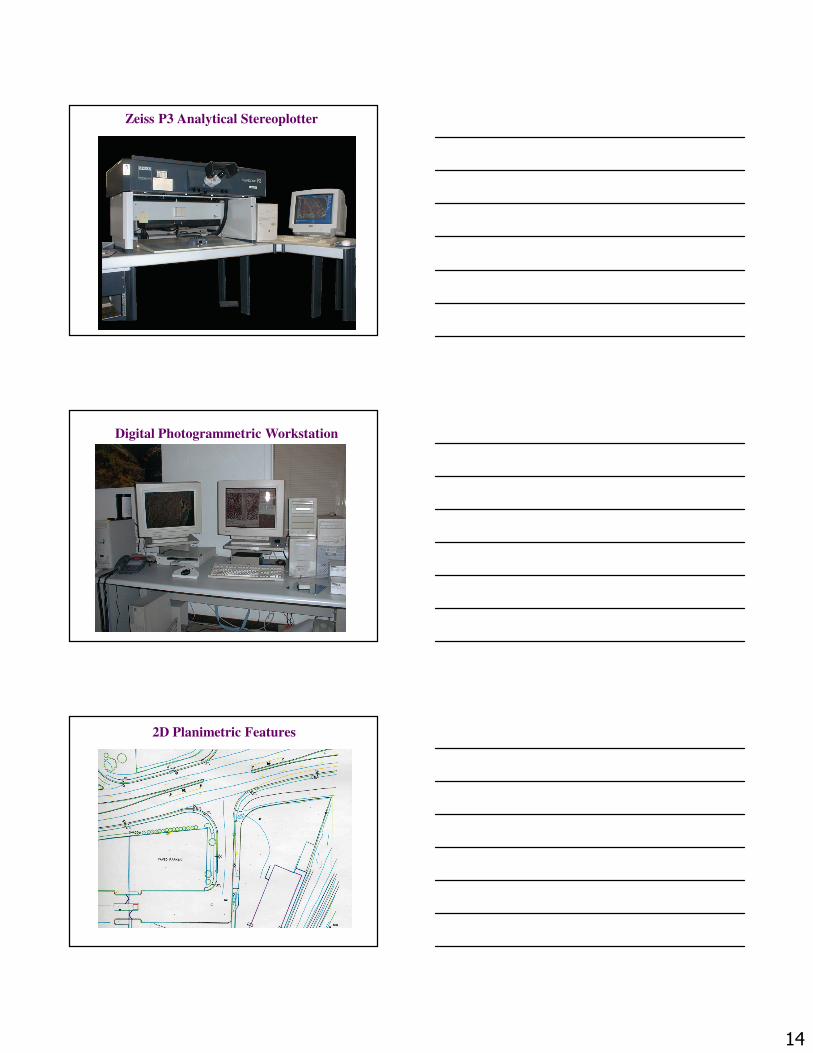
3D Planimetric Features
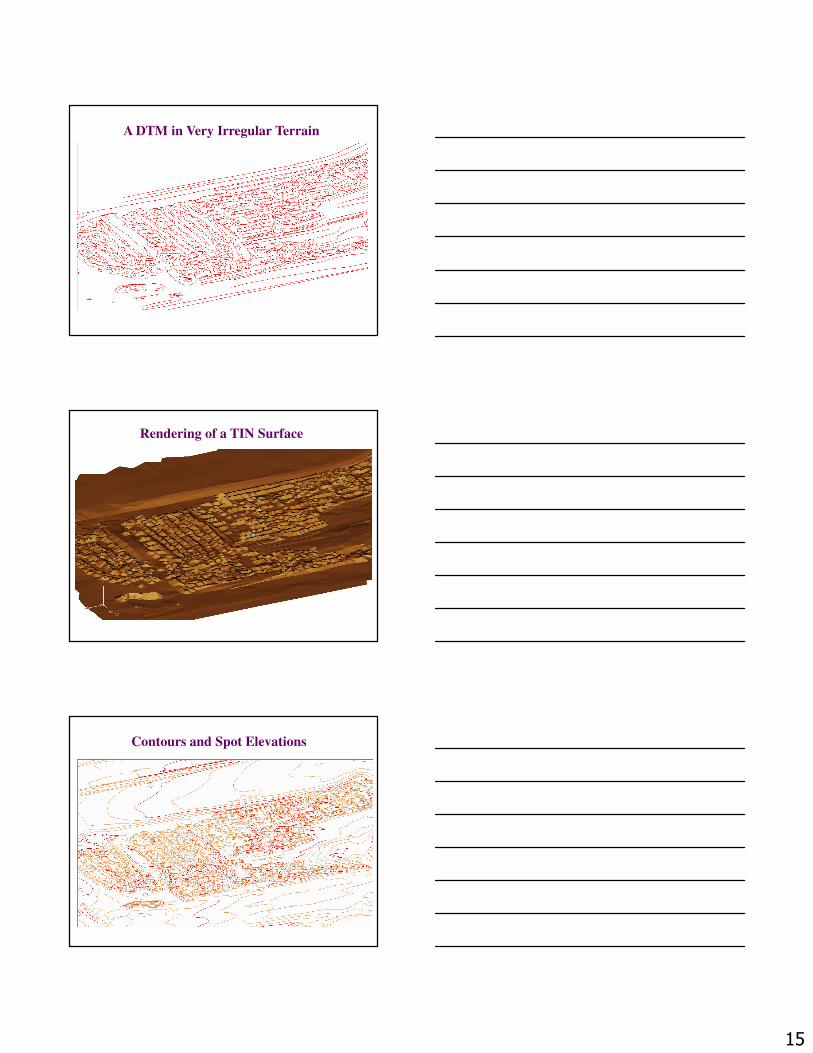
Digital Orthophotography
Removes the 3 distortions associated with imagery.
–Aircraft tip/tilt/crab
–Camera Lens
–Terrain Displacement
Yields imagery with the same level of accuracy
as the topographic mapping
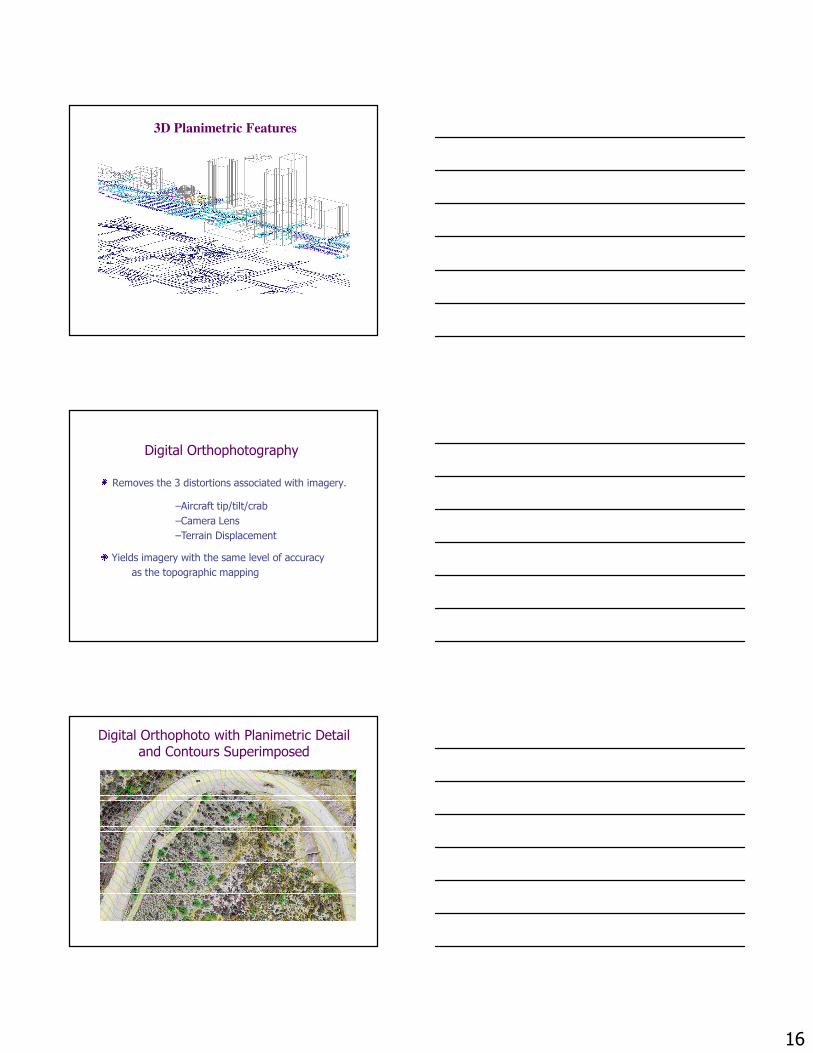
Digital Orthophoto with Planimetric Detail and Contours Superimposed
17
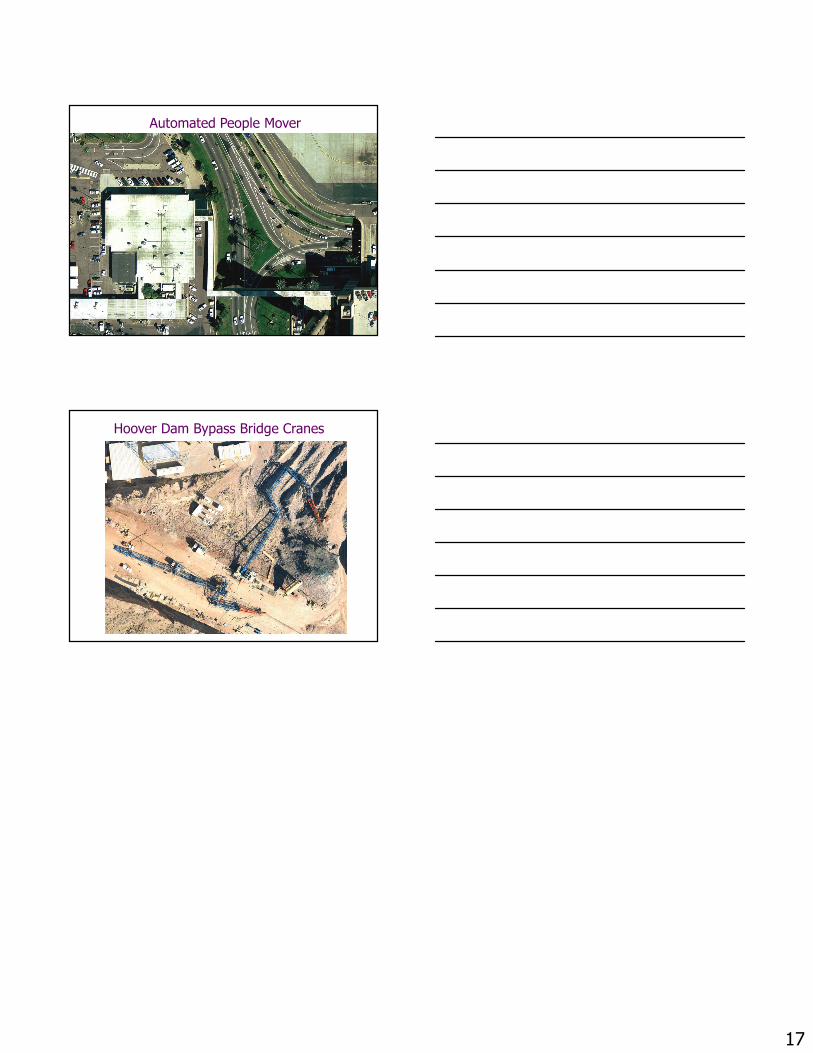
Automated People Mover
Hoover Dam Bypass Bridge Cranes


