
1Belleza · Dapito · Go · Naniong | M
Belleza, AlvinDapito, AaronGo, Earvin RaynerNaniong, Jason MartinM AMF 2011
CS 268 | Kardi Teknomo
MODELING AND SIMULATION – K. TEKNOMO
serv
LRT Line 2 Simulations
Photo taken by: JC Salamat, retrieved Feb. 25, 2011 from http://philippine-fleetlist.blogspot.com

iBelleza · Dapito · Go · Naniong | M
MODELING AND SIMULATION – K. TEKNOMO
TABLE OF CONTENTS
I. The System 1II. Objective 3III. Scope and Limitation 3IV. The Causal Loop Diagram 3
Building the Diagram 4V. Simulation 7VI. Results and Analysis 8
2 Queues 93 Queues 104 Queues 125 Queues 136 Queues 14Over-all Analysis 16
VIII. Recommendations 17
1Belleza · Dapito · Go · Naniong | M
MODELING AND SIMULATION – K. TEKNOMO
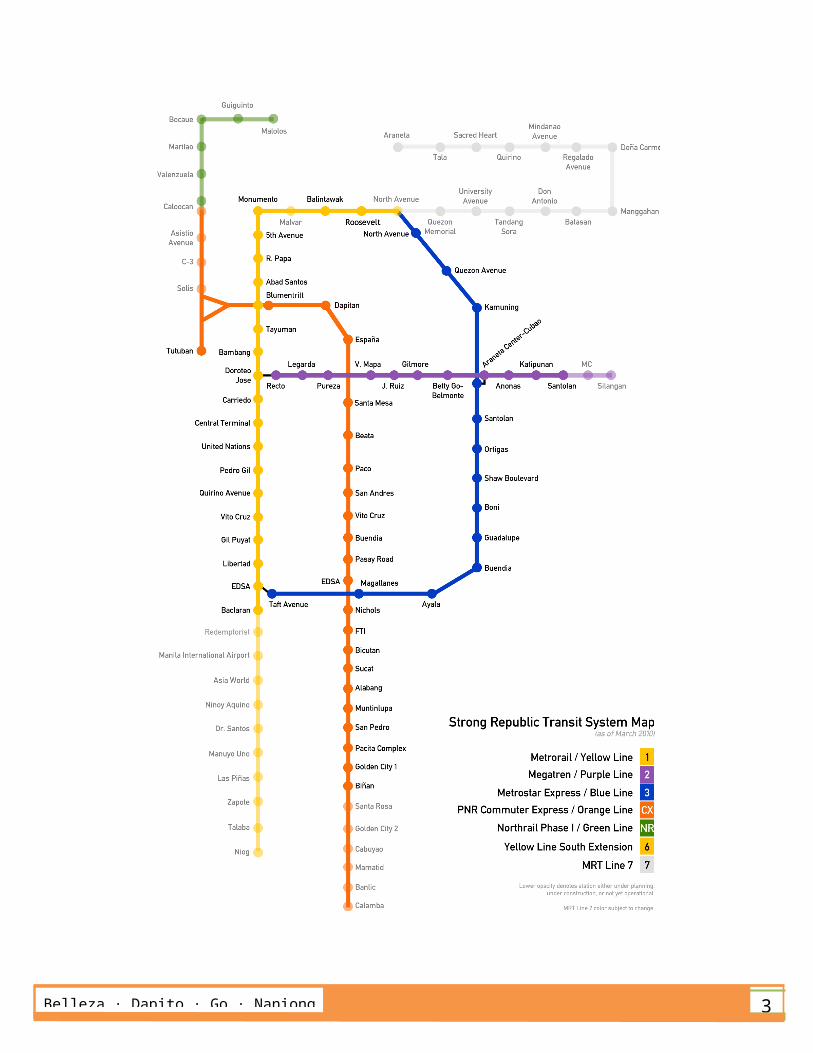
THE SYSTEMThe Manila Light Rail Transit System (LRT) is a metropolitan rail system serving millions of people every day in Metro Manila. The LRT consists of two lines: Line 1 or the Yellow line, which currently runs south-north from Baclaran in Pasay City to North Avenue station in Quezon City, and Line 2 or the Purple line, which is connected to the first line through Doroteo Jose and runs east-west from Recto in Manila to Santolan station in Marikina City. The transit system is operated and managed by the Light Rail Transit Authority (LRTA), a government-owned and controlled corporation under the authority of the Department of Transportation and Communications (DOTC). The LRT is part of a bigger system, the Strong Republic Transit System (SRTS) along with two other transit systems: Manila Metro Rail Transit System (known as MRT or the Blue Line), and the Philippine National Railways (PNR), as seen in Figure 1.
According to 2009 data, the LRT serves roughly 579,000 passengers each day through the two lines, 31 stations, along over 31 kilometers of mostly elevated track. The original LRT Line 1 was built as a no-frills means of public transport and lacks some features and comforts, but the new LRT Line 2 has been built with additional standards and criteria in mind like barrier-free access. New trains have been added especially in the Line 1 to support the growing number of people that uses the trains as their first choice of mode of transportation. Security guards are positioned at each station to conduct inspections and provide assistance for the new and the old riders of the transport system. Currently, the LRTA sells reusable plastic magnetic tickets as the pass for the people to be able to ride the trains.
The LRT has been one of the modes of transportation for many passengers, mostly students, aside from road-based public transport such as jeepneys and buses. Although the system aims to reduce traffic congestion in the city as well as the travel times of its passengers, the transportation system has only been partially successful due to the rising number of motor vehicles and rapid urbanization. As time progresses, the management works on improving the system from extending its reach in the north and the south and also the level of service to the public.
Figure 1. Route Map of the Strong Republic Transit System

2Belleza · Dapito · Go · Naniong | M
MODELING AND SIMULATION – K. TEKNOMO
3Belleza · Dapito · Go · Naniong | M
OBJECTIVEFor this project, the group intends to find through simulation an optimal train deployment schedule that maximizes the number of passengers per ship but at the same time minimizing costs and waiting time.
SCOPE AND LIMITATIONThe group incorporated the lessons discussed in class to create the simulation as realistic as possible. However, due to the length of time of the course and using Microsoft Excel as the interface, some factors were not considered in the simulation such as human decisions (e.g. walking/running fast upon hearing an incoming train) and interaction between agents (e.g. frustrations during baggage check or during buying tickets.
Furthermore, the group considered the option on creating the simulation on one station, Katipunan station, rather than taking a simulation on the whole LRT system.
THE CAUSAL LOOP DIAGRAMThe Causal Loop Diagram (CLD), also known as Influence Diagram, is a representation of the cause and effect relationship of variables in the system. It reflects the overall feedback structure of the system. The important part in the CLD is determining the policy variables that will define the system. Basically the diagram is about focusing on the relationship of the variables rather than the parts.
The components or variables for the LRT system are, but not limited to, the following:
(1) weather / power – causes the system some delay in its operation(2) frequency of train arrivals – affects the number of passengers waiting on
platforms of the stations (i.e. more passengers on station platforms when a train gets delayed)
(3) number of deployed trains – affects the waiting time of passengers especially during rush hours where trains are usually jam-packed.
4Belleza · Dapito · Go · Naniong | M
(4) average passengers per trip – the agents of the system(5) operating costs – costs incurred in the operation of the whole LRT system(6) price per trip – the amount passengers pay for riding the trains(7) tendency to try alternative transportation – when inconvenience comes on
any mode of transportation(8) government subsidies – affects the ticket price paid by the passengers
The variables are interconnected with arrows as well as a positive and negative sign which denotes the positive or negative effect of causal variable to the target variable. In addition to that, loop polarities, determined as product of polarities, defines the overall behaviour or growth between the variables within a loop.
Building the Diagram
Looking at the variables, the following relationships were concluded:
(1) An increase in the number of deployed trains increases the frequency of train arrivals. In turn, more train arriving means that there will be fewer passengers on station platforms. Lastly, when there are fewer passengers waiting in station platforms then the number of deployed trains should be decreased to minimize operating costs. The overall polarity (product of the gray poles) of the relationship of these three variables is negative as seen in figure 2.
Figure 2. Causal Loop for three variables

5Belleza · Dapito · Go · Naniong | M
(2) Increasing frequency of train arrivals means that more trains are being deployed. Moreover, more deployed trains means that there will be fewer passengers on each trip as seen in Figure 3.
Figure 3. Causal Loop between two pairs of variables
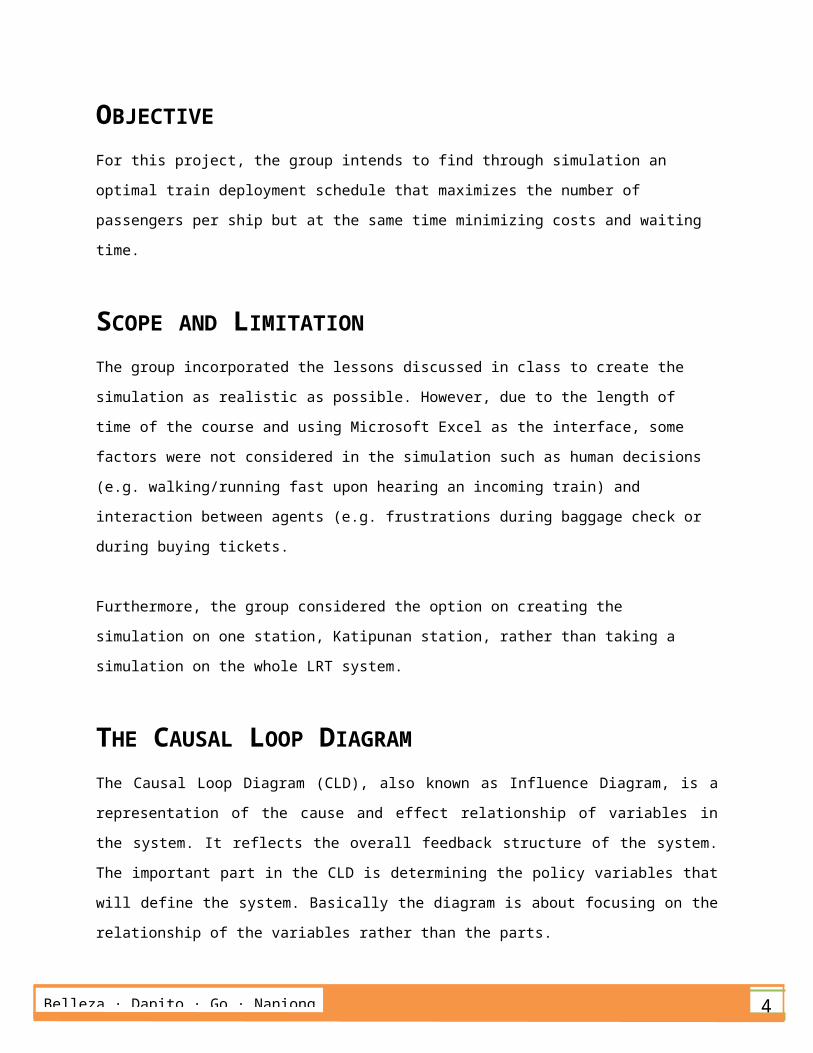
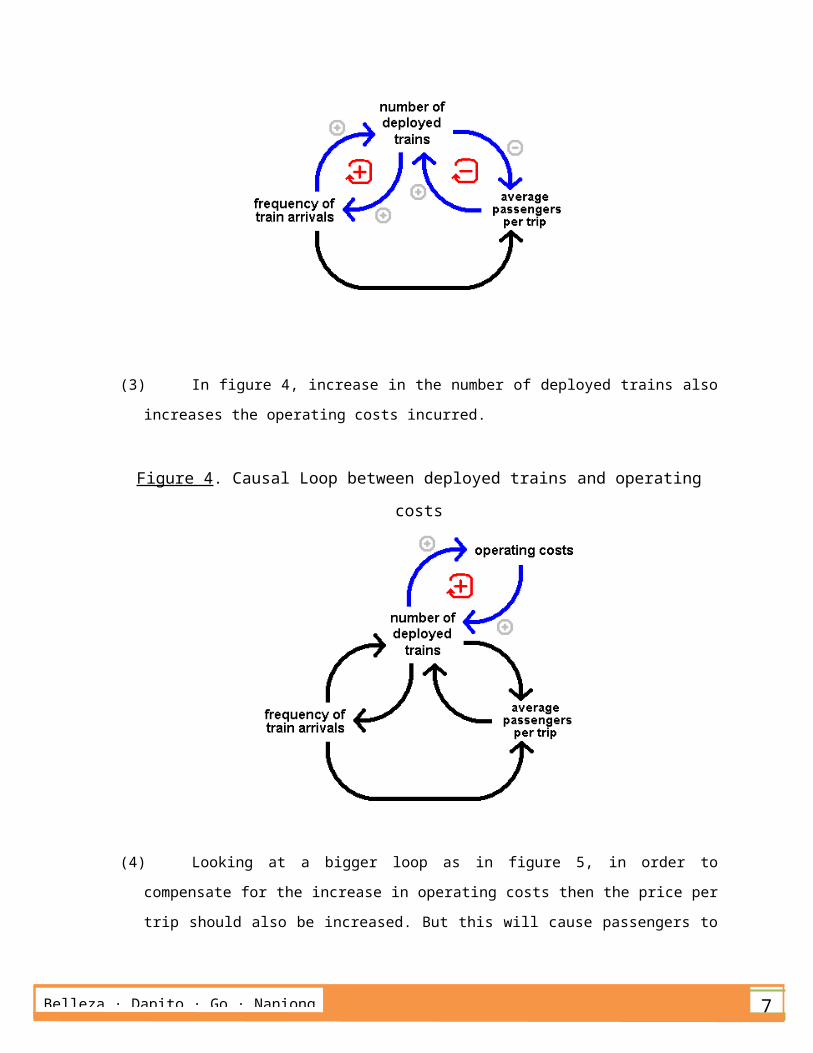
(3) In figure 4, increase in the number of deployed trains also increases the operating costs incurred.
Figure 4. Causal Loop between deployed trains and operating costs

6Belleza · Dapito · Go · Naniong | M
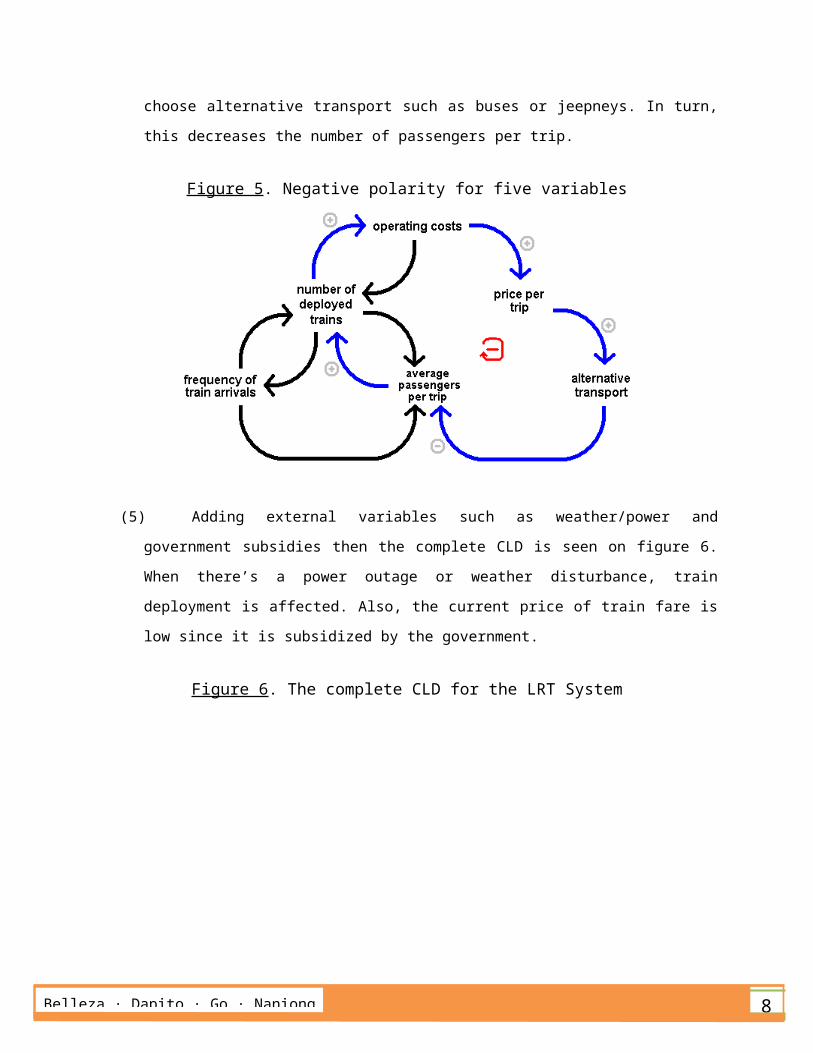
(4) Looking at a bigger loop as in figure 5, in order to compensate for the increase in operating costs then the price per trip should also be increased. But this will cause passengers to choose alternative transport such as buses or jeepneys. In turn, this decreases the number of passengers per trip.
Figure 5. Negative polarity for five variables
(5) Adding external variables such as weather/power and government subsidies then the complete CLD is seen on figure 6. When there’s a power outage or weather disturbance, train deployment is affected. Also, the current price of train fare is low since it is subsidized by the government.
Figure 6. The complete CLD for the LRT System
7Belleza · Dapito · Go · Naniong | M
SIMULATIONS
For the simulations, five Excel files are used, each with an increasing number of queues. Each of which is described in the next bullets:
2 Queues – 1 human seller and 1 automatic ticket-vending machine 3 Queues – 1 human seller and 2 automatic ticket-vending machine 4 Queues – 1 human seller and 3 automatic ticket-vending machine 5 Queues – 1 human seller and 4 automatic ticket-vending machine 6 Queues – 2 human seller and 4 automatic ticket-vending machine
In contrast to the pseudo-random density for the usual simulations, since we are testing for the optimal number of queues, it has been decided by the group to choose the worst-possible density, that of 1. Having a density of 1 means that there is always a person coming into the system. This implies that people will just keep on piling-up.
What this does is a form of stress testing, wherein the system is subjected to a certain force, which in this case is represented by the constant entrance of people to the system. This stress testing can result to possible analysis on the optimal number of queues which can accommodate more people into the system at any given time.
Hence, the assumptions made by this group is as follows:1. People walk at a constant pace.2. People do not overtake each other. Hence, they form queues whenever they
are walking through the system.3. The density is kept at 1 to subject the system to a stress test.4. The main variable is the number of queues. This is changed in the different
number of Excel files used. The reason for not having just 1 Excel file lies on the random assignment made for each queue. This is explained in the “Splitting Queues” section of the User Documentation.
5. People do not balk, jock or renege.6. There is no limit to the number of passengers per train.
8Belleza · Dapito · Go · Naniong | M
7. Time of Operations is from 05:00 to 22:00.
RESULTS AND ANALYSIS
The results and analysis section will present the results of the queuing simulations for the 5 Excel files, subject to the constraints set by the assumptions in the previous page. There will be six sections for this part, one for each of the Excel files and one Over-all Analysis.
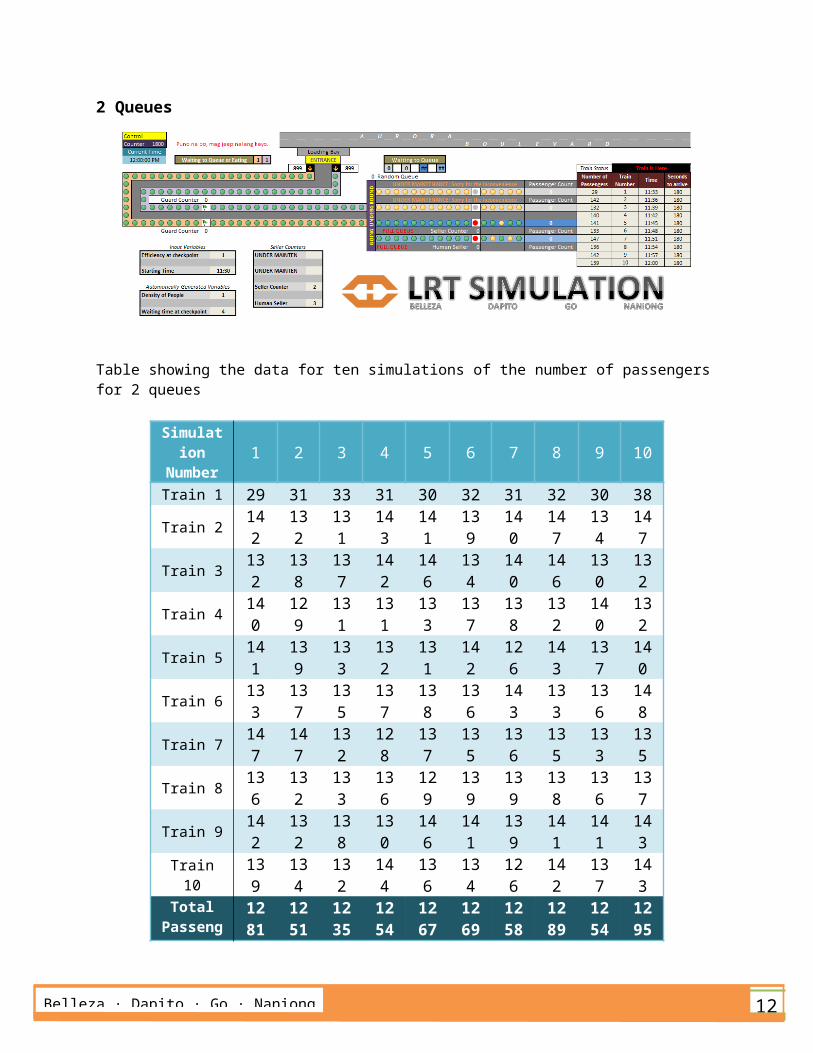
Ten simulations are to be done in order to minimize the bias of simulations which basically happens when only one or too few simulations are done. Hence, the group decided to do ten simulations, which due to time constraints and the amount of computer power needed, is a good enough number of simulations to generate a quite decent result.
Two tables are to be seen for each of the first five sections. The first table shows ten simulations and the number of passengers per train. The number of passengers are recorded up to the 10th train, although 12 trains are possible in the files. The last row shows the total number of passengers that were able to get on the ten trains altogether.
The second table shows the number of seconds it takes for the queues to get filled up for the very first time. The first row shows the simulation number. The second row shows the queue which gets filled up first. It is numbered 1 through n where n denotes the number of queues. A pre-paragraph explains the designation of each queue number, as to what seller they represent. The next rows show the number of counters it takes for the queues to fill-up for the very first time.
Note also that the speeds of the sellers are random integers. As explained in the User Documentation, the range for the human seller is [3, 8] while the range for the automatic ticket-selling machines is [5,7].
The main conclusion that we wish to arrive at is the optimal number of queues needed.

9Belleza · Dapito · Go · Naniong | M

10Belleza · Dapito · Go · Naniong | M
2 Queues
Table showing the data for ten simulations of the number of passengers for 2 queues
Simulation
Number1 2 3 4 5 6 7 8 9 10
Train 1 29 31 33 31 30 32 31 32 30 38Train 2 14
2132
131
143
141
139
140
147
134
147
Train 3 132
138
137
142
146
134
140
146
130
132
Train 4 140
129
131
131
133
137
138
132
140
132
Train 5 141
139
133
132
131
142
126
143
137
140
Train 6 133
137
135
137
138
136
143
133
136
148
Train 7 147
147
132
128
137
135
136
135
133
135
Train 8 136
132
133
136
129
139
139
138
136
137
Train 9 142
132
138
130
146
141
139
141
141
143
Train 10 139
134
132
144
136
134
126
142
137
143
Total Passeng
ers1281
1251
1235
1254
1267
1269
1258
1289
1254
1295
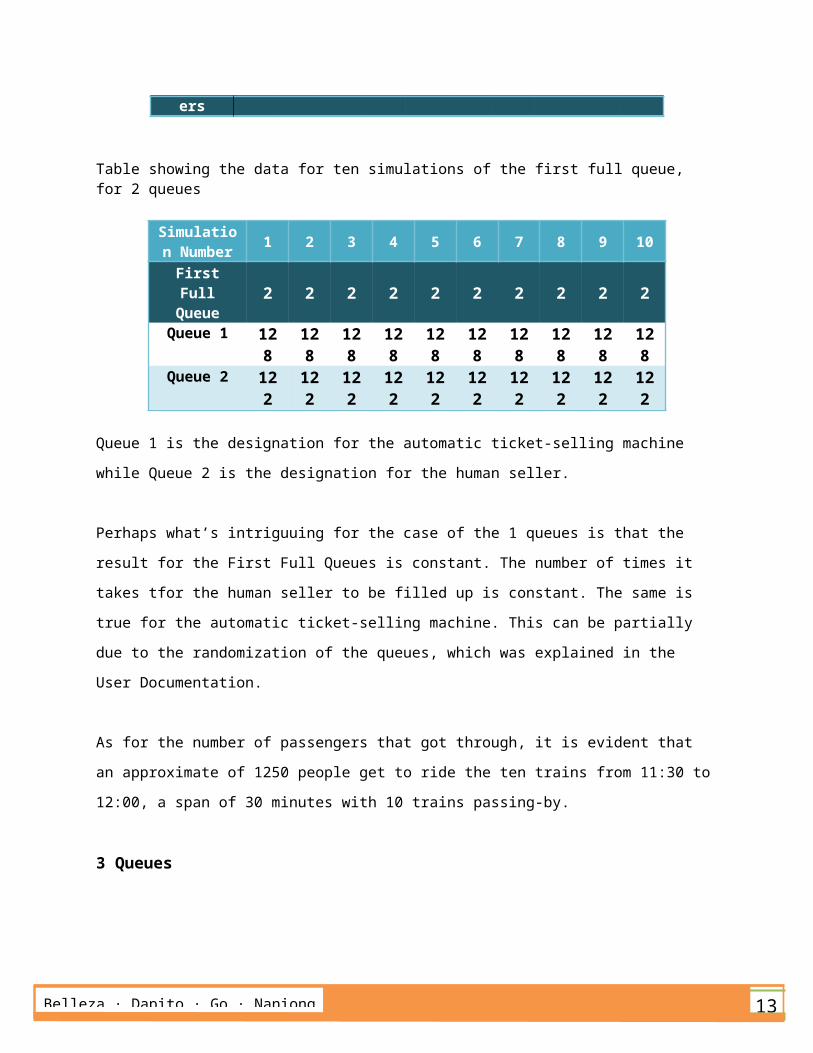
Table showing the data for ten simulations of the first full queue, for 2 queues
Simulatio 1 2 3 4 5 6 7 8 9 10
11Belleza · Dapito · Go · Naniong | M
n NumberFirst Full Queue 2 2 2 2 2 2 2 2 2 2
Queue 1 128
128
128
128
128
128
128
128
128
128
Queue 2 122
122
122
122
122
122
122
122
122
122
Queue 1 is the designation for the automatic ticket-selling machine while Queue 2 is the designation for the human seller.
Perhaps what’s intriguuing for the case of the 1 queues is that the result for the First Full Queues is constant. The number of times it takes tfor the human seller to be filled up is constant. The same is true for the automatic ticket-selling machine. This can be partially due to the randomization of the queues, which was explained in the User Documentation.
As for the number of passengers that got through, it is evident that an approximate of 1250 people get to ride the ten trains from 11:30 to 12:00, a span of 30 minutes with 10 trains passing-by.
3 Queues
Table showing the data for ten simulations of the number of passengers for 3 queues
Simulation
Number1 2 3 4 5 6 7 8 9 10
12Belleza · Dapito · Go · Naniong | M
Train 1 18 28 28 27 25 27 24 22 24 31Train 2 10
4124
117
110
111
120
122
118
115
111
Train 3 106
110
112
114
106
113
122
113
119
113
Train 4 129
112
116
114
119
110
120
110
119
117
Train 5 124
115
117
114
115
125
112
114
132
129
Train 6 119
112
108
120
113
120
124
117
112
118
Train 7 118
114
111
112
124
120
119
113
107
119
Train 8 117
109
128
119
116
121
109
110
116
117
Train 9 118
126
115
114
107
115
115
109
118
113
Train 10 117
113
120
119
117
115
117
141
118
123
Total Passeng
ers1070
1063
1072
1063
1053
1086
1084
1067
1080
1091
Table showing the data for ten simulations of the first full queue, for 3 queues
Simulation Number 1 2 3 4 5 6 7 8 9 10First Full Queue 1 1 3 1 3 2 3 1 3 3
Queue 1 134
124
170
122
160
170
148
124
138
140
Queue 2 162
126
138
132
140
122
138
156
166
160
Queue 3 142
146
128
152
124
136
132
154
128
126
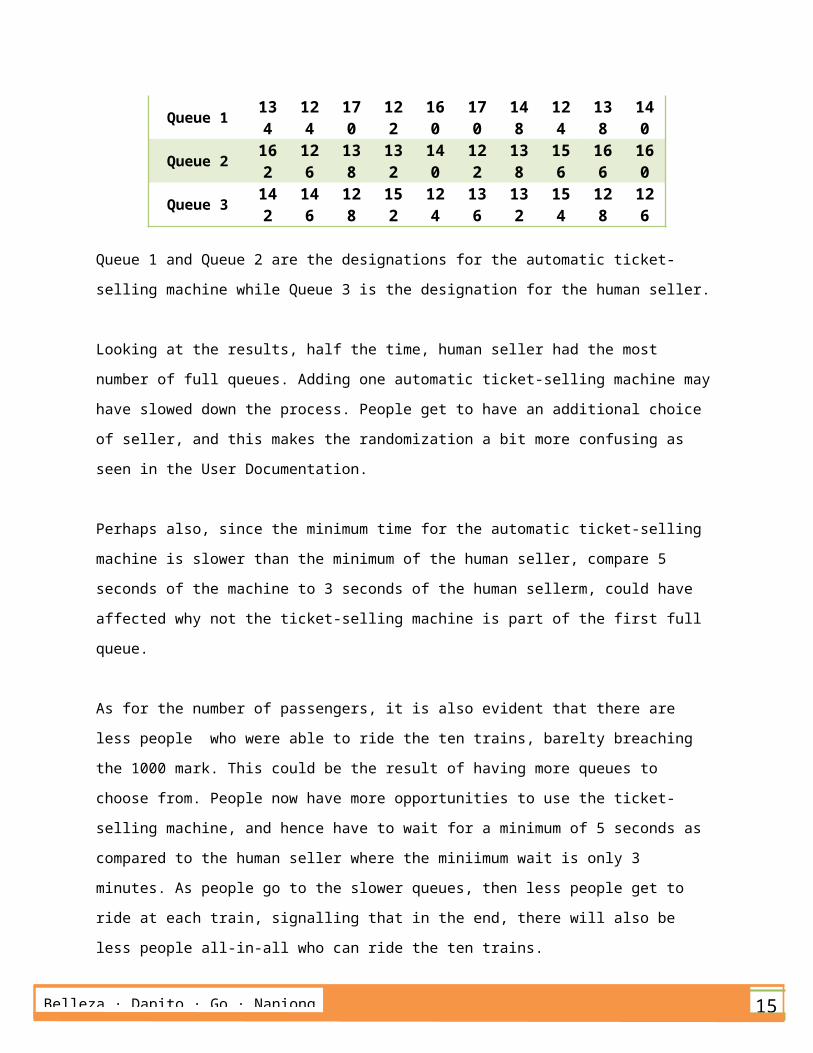
Queue 1 and Queue 2 are the designations for the automatic ticket-selling machine while Queue 3 is the designation for the human seller.
Looking at the results, half the time, human seller had the most number of full queues. Adding one automatic ticket-selling machine may have slowed down the process. People get to have an additional choice of seller, and this makes the randomization a bit more confusing as seen in the User Documentation.
13Belleza · Dapito · Go · Naniong | M
Perhaps also, since the minimum time for the automatic ticket-selling machine is slower than the minimum of the human seller, compare 5 seconds of the machine to 3 seconds of the human sellerm, could have affected why not the ticket-selling machine is part of the first full queue.
As for the number of passengers, it is also evident that there are less people who were able to ride the ten trains, barelty breaching the 1000 mark. This could be the result of having more queues to choose from. People now have more opportunities to use the ticket-selling machine, and hence have to wait for a minimum of 5 seconds as compared to the human seller where the miniimum wait is only 3 minutes. As people go to the slower queues, then less people get to ride at each train, signalling that in the end, there will also be less people all-in-all who can ride the ten trains.
Note however that in reality, it should be that more queues should give the passengers a chance to hasten up. This is the anomaly in this simulation.
4 Queues
Table showing the data for ten simulations of the number of passengers for 4 queues
Simulation
Number1 2 3 4 5 6 7 8 9 10

14Belleza · Dapito · Go · Naniong | M
Train 1 30 28 30 26 29 32 27 27 29 28Train 2 161 148 152 144 144 138 159 159 152 153Train 3 147 154 157 152 169 148 150 157 143 159Train 4 158 146 142 162 163 146 157 156 152 168Train 5 127 152 173 165 138 164 160 154 133 163Train 6 154 157 173 170 159 167 154 152 142 146Train 7 162 155 168 154 152 173 170 158 150 150Train 8 135 156 154 156 163 153 157 168 174 143Train 9 150 146 156 156 149 142 162 161 171 165
Train 10 157 160 158 156 147 152 151 156 156 167Total
Passengers
1381
1402
1463
1441
1413
1415
1447
1448
1402
1442
Table showing the data for ten simulations of the first full queue, for 4 queues
Simulation Number 1 2 3 4 5 6 7 8 9 10First Full Queue 1 2 2 4 2 4 2 2 1 4
Queue 1 130
158
142
204
142
200
176
244
134
156
Queue 2 182
126
122
292
122
128
134
130
156
162
Queue 3 240
138
292
150
128
144
136
140
194
188
Queue 4 140
166
160
132
226
124
140
160
146
130
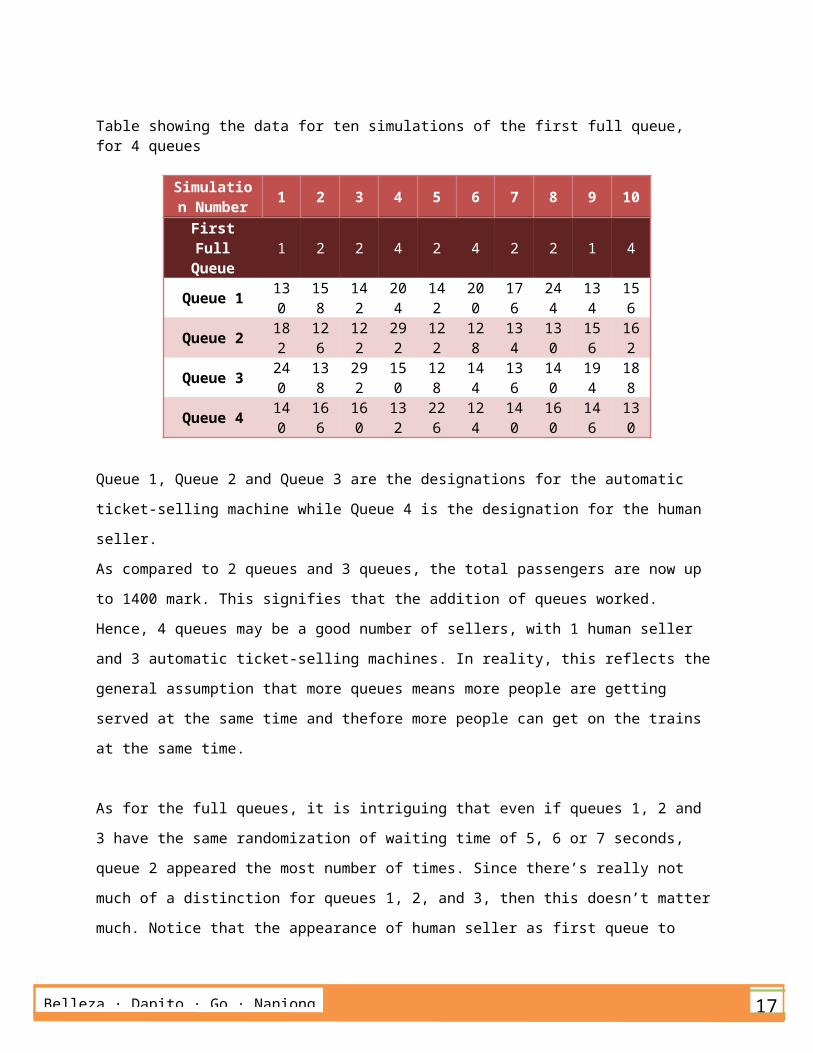
Queue 1, Queue 2 and Queue 3 are the designations for the automatic ticket-selling machine while Queue 4 is the designation for the human seller.As compared to 2 queues and 3 queues, the total passengers are now up to 1400 mark. This signifies that the addition of queues worked. Hence, 4 queues may be a good number of sellers, with 1 human seller and 3 automatic ticket-selling machines. In reality, this reflects the general assumption that more queues means more people are getting served at the same time and thefore more people can get on the trains at the same time.
As for the full queues, it is intriguing that even if queues 1, 2 and 3 have the same randomization of waiting time of 5, 6 or 7 seconds, queue 2 appeared the most number of times. Since there’s really not much of a distinction for queues 1, 2, and 3, then this doesn’t matter much. Notice that the appearance of human seller as
15Belleza · Dapito · Go · Naniong | M
first queue to fill up is reduced to a third. This signals that it the adding of an additional queue lessens the difference of the human seller with the other three automatic machines.
5 Queues
Table showing the data for ten simulations of the number of passengers for 4 queues
Simulation Number 1 2 3 4 5 6 7 8 9 10
Train 1 22 30 30 24 27 32 30 35 16 29Train 2 198 165 179 163 172 157 170 159 172 169Train 3 186 162 192 193 176 163 198 178 186 192Train 4 181 188 198 192 189 185 197 180 155 193Train 5 193 186 185 169 185 191 188 157 179 184Train 6 188 181 190 185 177 183 169 181 158 194Train 7 186 166 180 177 167 182 151 190 176 198Train 8 199 189 172 192 185 167 193 192 173 180Train 9 188 195 187 187 186 165 173 194 197 175
Train 10 186 158 193 189 155 179 181 198 186 190Total
Passengers
1727
1620
1706
1671
1619
1604
1650
1664
1598
1704
First FULL QUEUE count for each seller, for 5 queues. Note that Queues 1 to 4 are the Automatic ticket-selling machines while Queue 5, designated as 5 is the only human seller.
Simulation
Number1 2 3 4 5 6 7 8 9 10
First Full Queue 1 5 5 1 4 5 5 4 3 2
Queue 1 140
158
304
134
180
238
164
246
338
188
Queue 2 174
130
136
200
428
230
280
360
124
126

16Belleza · Dapito · Go · Naniong | M
Queue 3 218
180
176
154
174
138
152
150
122
160
Queue 4 170
150
166
324
122
192
268
128
162
144
Queue 5 150
138
134
202
170
132
122
168
152
200
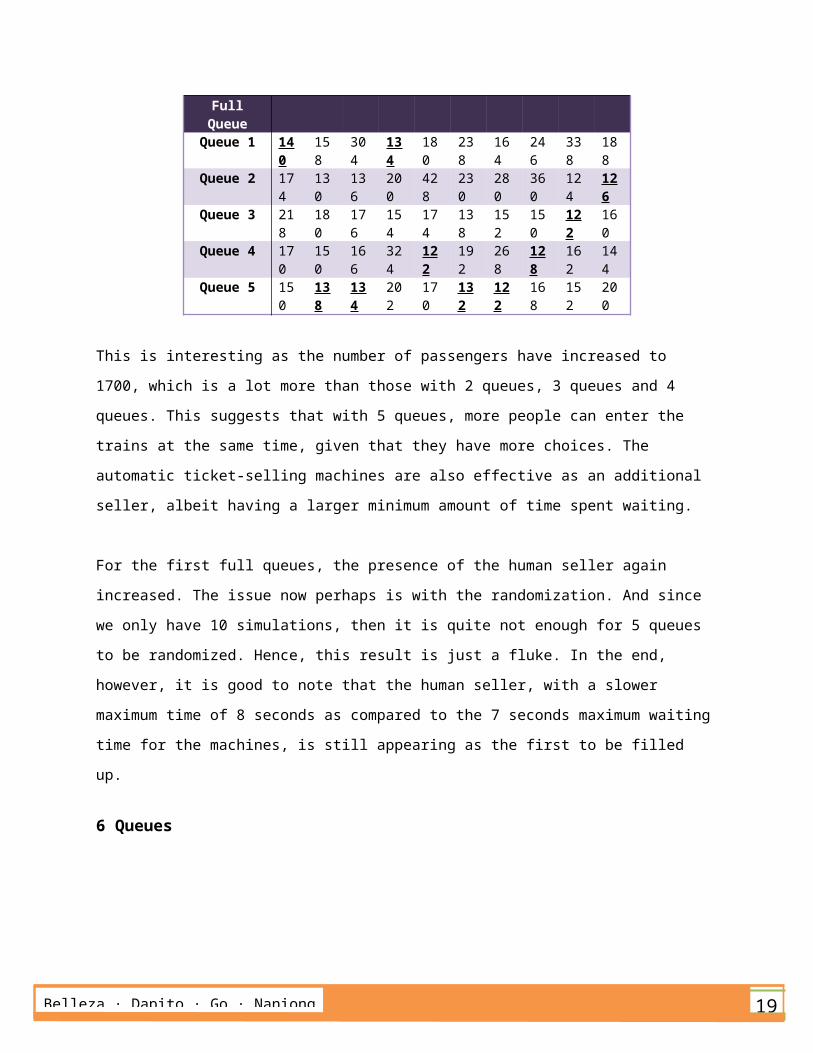
This is interesting as the number of passengers have increased to 1700, which is a lot more than those with 2 queues, 3 queues and 4 queues. This suggests that with 5 queues, more people can enter the trains at the same time, given that they have more choices. The automatic ticket-selling machines are also effective as an additional seller, albeit having a larger minimum amount of time spent waiting.
For the first full queues, the presence of the human seller again increased. The issue now perhaps is with the randomization. And since we only have 10 simulations, then it is quite not enough for 5 queues to be randomized. Hence, this result is just a fluke. In the end, however, it is good to note that the human seller, with a slower maximum time of 8 seconds as compared to the 7 seconds maximum waiting time for the machines, is still appearing as the first to be filled up.
6 Queues
Table showing the data for ten simulations of the number of passengers for 6 queues
Simulation
Number1 2 3 4 5 6 7 8 9 10
Train 1 25 32 35 24 30 33 33 28 33 29Train 2 181 199 149 209 162 190 170 178 175 170
17Belleza · Dapito · Go · Naniong | M
Train 3 187 184 218 196 191 187 193 220 172 203Train 4 200 199 199 181 211 190 220 209 201 190Train 5 194 184 210 192 187 172 197 189 198 178Train 6 185 185 217 226 216 173 206 176 178 183Train 7 180 169 196 167 164 208 195 192 176 171Train 8 189 208 207 197 180 175 160 193 174 195Train 9 181 181 199 170 193 187 199 203 176 197
Train 10 177 175 152 190 221 186 174 171 180 158Total
Passengers
1699
1716
1782
1752
1755
1701
1747
1759
1663
1674
First FULL QUEUE count for each seller, for 6 queues. Note that Queues 1 to 4 are the Automatic ticket-selling machines while Queues 5-6, designated as 5 and 6 are the human sellers.
Simulation Number
1 2 3 4 5 6 7 8 9 10
First Full Queue
5 3 2 6 5 1 5 6 6 5
Queue 1 414
270
140
208
202
142
212
266
240
202
Queue 2 214
212
138
192
310
206
276
364
192
276
Queue 3 304
140
336
154
290
318
272
222
304
260
Queue 4 232
164
338
396
272
266
258
240
232
188
Queue 5 132
248
194
144
132
178
126
180
188
134
Queue 6 180
250
280
126
200
202
192
138
134
144
Adding an additional human seller proved to do nothing much since now, people have to choose from 6 possible queues, which can prove to be too many. The maximum number of people is still at 1700 for the ten trains, which suggests that adding the second human seller did nothing.
The intriguing part is with the full queue. Notice that most of the first full queues are the human sellers. This suggests that them having a wide range of waiting time (3 seconds to a maximum of 8 seconds) as compared to the machines (5 seconds to a

18Belleza · Dapito · Go · Naniong | M
maximum of 7 seconds) may result to having the queues getting filled up faster. Hence, most of the first full queues are the human sellers.
Overall Analysis
Based on this simulation, it should be noted that 5 queues proved to be the optimal number of queues, that is, a combination of 4 automatic ticket-selling machines and 1 human seller. Adding an additional human seller did nothing to the number of total passengers. Worse, both human sellers dominated the category of being the first queues to fill up.
Nonetheless, the assumptions set for this experiment can be relaxed to come-up with a different result. Assumptions are very important to determine in order to have a concrete and complete assessment of the results of the simulations.
19Belleza · Dapito · Go · Naniong | M
RECOMMENDATIONSIn line with the analysis from the previous section, it is seen that five ticketing queues are optimal for the station. It is the important therefore that the maintenance crew be able to keep the ticket vending machines in working order so that the number of passengers riding the train are maximized.
It is also highly recommended that once crowding occurs before the point of ingress due to slow or strict guards, extra guards are put in place so that inflow remains smooth. An assumption in this model is that there are only two queues upon entry. This assumption was made because considering different number of guard queues along with the ticketing queues would yield different scenarios, and coding is cumbersome as well.
To further ease the inflow of passengers, there should be special lanes for the senior citizens, persons with disability, persons buying stored value tickets, and those with exact change. This is so that service rates remain uniform and people need not wait for a long time because someone being serviced is taking a long time.
Lastly, at a more qualitative level, management should be able to oversee that all these matters are attended to. It is very important, as seen in the analysis and above recommendations, that these are always put in place to ensure smooth operations and at the same time maximum passenger inflow. To cope with this, however, trains should be deployed accordingly so that overcrowding does not happen often. While train capacity is not a serious limitation given daily demand, overcrowding can cause discomfort with passengers and they may decide to use alternative transportation in the future if this were to continue.


