Ins�tute of Strategy and Policy on Natural Resources and Environment (ISPONRE), Vietnam
Kyoto University (KU), Japan
Na�onal Ins�tute for Environmental Studies (NIES), Japan
Ins�tute for Global Environmental Strategies (IGES), Japan
Asia-Pacific Integrated Modelling team (AIM)
MIZUHO Informa�on and Research Ins�tute (MHIR), Japan
E-KONZAL, Japan
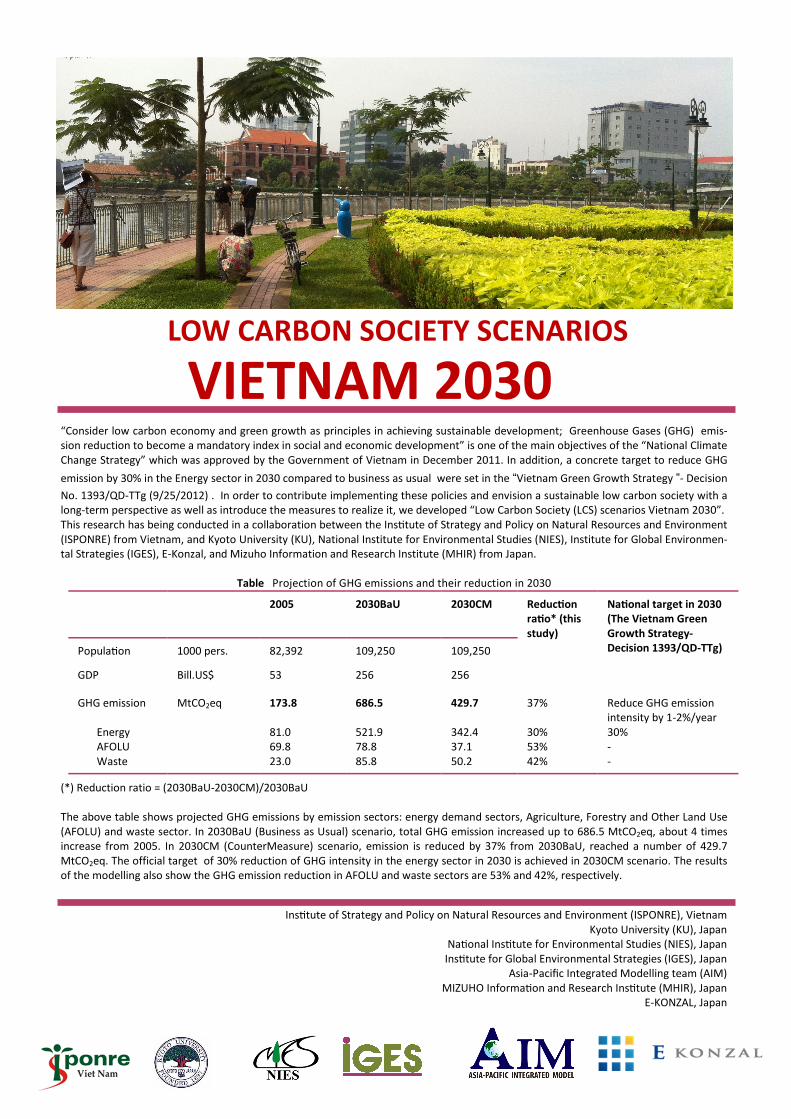
“Consider low carbon economy and green growth as principles in achieving sustainable development; Greenhouse Gases (GHG) emis-
sion reduction to become a mandatory index in social and economic development” is one of the main objectives of the “National Climate
Change Strategy” which was approved by the Government of Vietnam in December 2011. In addition, a concrete target to reduce GHG
emission by 30% in the Energy sector in 2030 compared to business as usual were set in the “Vietnam Green Growth Strategy ”- Decision
No. 1393/QD-TTg (9/25/2012) . In order to contribute implementing these policies and envision a sustainable low carbon society with a
long-term perspective as well as introduce the measures to realize it, we developed “Low Carbon Society (LCS) scenarios Vietnam 2030”.
This research has being conducted in a collaboration between the Ins�tute of Strategy and Policy on Natural Resources and Environment
(ISPONRE) from Vietnam, and Kyoto University (KU), National Institute for Environmental Studies (NIES), Institute for Global Environmen-
tal Strategies (IGES), E-Konzal, and Mizuho Information and Research Institute (MHIR) from Japan.
Table Projection of GHG emissions and their reduction in 2030
(*) Reduction ratio = (2030BaU-2030CM)/2030BaU
The above table shows projected GHG emissions by emission sectors: energy demand sectors, Agriculture, Forestry and Other Land Use
(AFOLU) and waste sector. In 2030BaU (Business as Usual) scenario, total GHG emission increased up to 686.5 MtCO2eq, about 4 times
increase from 2005. In 2030CM (CounterMeasure) scenario, emission is reduced by 37% from 2030BaU, reached a number of 429.7
MtCO2eq. The official target of 30% reduction of GHG intensity in the energy sector in 2030 is achieved in 2030CM scenario. The results
of the modelling also show the GHG emission reduction in AFOLU and waste sectors are 53% and 42%, respectively.
VIETNAM 2030
LOW CARBON SOCIETY SCENARIOS
2005 2030BaU 2030CM Reduc�on
ra�o* (this
study)
Na�onal target in 2030
(The Vietnam Green
Growth Strategy-
Decision 1393/QD-TTg) Popula�on 1000 pers. 82,392 109,250 109,250
GDP Bill.US$ 53 256 256
GHG emission
Energy
AFOLU
Waste
MtCO2eq 173.8
81.0
69.8
23.0
686.5
521.9
78.8
85.8
429.7
342.4
37.1
50.2
37%
30%
53%
42%
Reduce GHG emission
intensity by 1-2%/year
30%
-
-

TEAM INFORMATION
Kyoto University, Japan (KU)
Nguyen Thai Hoa
Yuzuru Matsuoka
Na�onal Ins�tute for Environmental Studies,
Japan (NIES)
Kei Gomi
Junichi Fujino
Toshihiko Masui
Ins�tute for Global Environmental Strategies,
Japan (IGES)
Shuzo Nishioka
Tomoko Ishikawa
MIZUHO Informa�on and Research Ins�tute,
Japan (MHIR)
Go Hibino
Kazuya Fujiwara
E-KONZAL
Tomoki Ehara
Yuki Ochi
Ins�tute of Strategy and Policy on Natural Re-
sources and Environment, Vietnam (ISPONRE)
Nguyen Hoang Minh
Nguyen Tung Lam
Nguyen Van Tai
Methodology In order to iden�fy the necessary ac�ons, an “integrated
modeling” based on “back-cas�ng” approach is used.
The back-cas�ng approach sets a vision of the future society
as a goal, and then seeks a pathway towards achieving that
goal. We used ExSS (Extended Snapshot tool) for socio-
economic indicators, energy and waste sectors, AFOLUA
(AFOLU Activity model), and AFOLUB (AFOLU bottom-up
model) for AFOLU sectors. Combining both of the results
from ExSS and AFOLU models, emissions and reduction
amounts are analyzed.
Informa�on collec�on is the first step in the modeling work.
Socio-economic informa�on as well as environmental infor-
ma�on for the base year (2005) was collected and analyzed
in order to es�mate current carbon emissions.
Besides this, feasible low carbon measures for Vietnam LCS
2030 were also collected. For the future projec�on, infor-
ma�on is based on planned developments, as the model
es�mates socio-economic ac�vity levels including popula-
�on, number of households, land area, transport demand
and other variables. Based on the collected informa�on,
GHG emissions are calculated with or without counter
measures. Finally, they are aggregated to Ac�ons.
Figure 8. Methodology of the study
ACRONYMS & ABBREVIATIONS
ACC Allowable Addi�onal Costs
AIM Asia-Pacific Integrated Model
AFOLU Agriculture, Forestry and other Land use
BaU Business as Usual
CM Countermeasure
GHG Greenhouse Gases
EE Energy Efficiency
ExSS Extended Snapshot Tool
FAO Food and Agriculture Organiza�on
GDP Gross Domes�c Product
IGES Ins�tute for Global Environmental Strategies, Japan
ISPONRE Ins�tute of Strategy and Policy on Natural Resources
and Environment, Vietnam
KU Kyoto University
LCS Low Carbon Society
MARD Ministry of Agriculture and Rural Development
MHIR MIZUHO Informa�on and Research Ins�tute, Japan
NIES Na�onal Ins�tute for Environmental Studies, Japan
SYB Sta�s�cal Yearbook
UNFCCC United Na�ons Framework Conven�on on Climate
Change
CONTACT INFORMATION:
Nguyen Thai Hoa, PhD: Program-specific Researcher in Kyoto University
Email: [email protected]
Nguyen Tung Lam, PhD: Director of Center for Informa�on, Consultancy
and Training, ISPONRE
Email: [email protected]
August, 2014

Projection of GHG emissions and reductions In 2030BaU scenario, GHG emissions increase more than 2.1
times in 2020, 4.1 times in 2030 and 8.8 times in 2050 com-
pared to 2005. GHG emission from the industrial sector con-
tinues to increase due to rapid industrial expansion and
contributes the largest emission which accounting for 67% in
2030, and 75% in 2050 of total emission. On the other hand,
the emission from the municipal sector increases gradually
due to slight increase in population in Vietnam in the future.
In 2030CM scenario, total GHG emission is reduced by 26%
(2020), 42% (2030) and 57% (2050) from BaU scenario
(Figure 6).
Recycling shows the largest contribution, followed by CH4
recovery. Vietnamese government expects almost all of the
waste generation in future will be recovered, and reused
before dumping to landfill or going to other processes
(Figure 7).
Assumptions of solid waste management Assumptions of solid waste management are based on the
targets in “National Strategy for Integrated Management of
Solid Waste up to 2025 and vision towards 2050” approved by
Decision 2149/QD-TTg (12/17/2009). For instance, by 2025,
100% of the total solid waste generated from households in
urban area will be collected and treated with environmentally
friendly manners, of which 90% will be recycled, used for en-
ergy recovery, or utilized for production of organic fertilizer.
90% of the construction solid waste will be collected, of which
60% will be reused or recycled. 100% of the total generated
non-hazardous and hazardous industrial waste will be collect-
ed and treated with environmentally friendly manners.
As for wastewater, 30% of municipal wastewater is discharged
and remaining 70% is treated. As for industrial wastewater,
5% is discharged and 95% is treated.
At present, there is no targets in collecting CH4 from landfill
and waste water. In 2030CM scenario, 25% is assumed in the
year of 2030 to be collected from landfill and from
wastewater.
Waste generation Solid waste generation in 2005 was 15.6Mt from rural, village
craft, hazardous and sludge. Solid waste generation is ex-
pected to increase more than 2.8 times in 2020, 5.5 times in
2030 and 9.9 times in 2050 compared to 2005. In 2030BAU
scenario, about 90% of total solid is dumped to disposal sites,
where no regulations or standards have been established to
control CH4 in the landfill gas released by the decay of solid
waste in these disposal sites. In 2030CM scenario, with intro-
duction of countermeasures through activities of composting,
recycling and incineration, the amount of solid waste which
goes to disposal site is expected to reduce significantly.
Wastewater from both domestic and industrial sector is ex-
pected to increase dramatically from about 1.9 trillion ton in
2005 to 3.1, 5.7 and 10.6 trillion ton in 2020, 2030 and 2050
respectively. The industry intensive cities and provinces in the
Southern of Vietnam and Red River Delta regions generate the
major part of the country’s industrial wastewater. (Figure 5)
Figure 5. Waste genera�on by sector in Vietnam
Figure 6. GHG emissions from waste genera�on in Vietnam Figure 7. Contribu�on of low carbon measures in
Waste sector
57%
26%
42%
Waste Scenario
4

Execu�ve Summary
Action E2. Convenient Transport. Using public transporta-
tion and bicycle will increase the level of convenience in
travel, and it leads to decline in usage of automobiles and
results in a safe and comfortable transportation environ-
ment. Instead of freight transportation by trucks, convenient
and comfortable systematic transportation by train and by
ship is increasingly used. Promoting the use of biofuel in
automobile also brings a benefit in cutting down CO2 emis-
sion.
Action E3. Energy Saving Behavior. Energy saving activities
focus on energy services such as cooling, heating, hot water,
cooking in commercial and residential sectors, direct heat-
ing, steam and motor in the industrial sector.
Action E4. Energy Efficiency Improvement. This action in-
cludes not only enhancing Energy Efficiency (EE) of devices
in all sectors, but also to strengthen state management of
EE by establishing a management systems for energy saving
and rizing public awareness to promote EE.
Action E5. Fuel Shift in Industry. The action aims to switch
from coal to natural gas and other renewable energies.
Some amount of financial commitments would be required
not only in technology but also in associated infrastructure.
Action E6. Smart Power Plants. A Smart Power Plant is not
only environmental friendly, but also important for sufficient
and continuous supply of energy required for the social and
economic development of the whole country. Leverages to
achieve it are the benefit of energy efficiency, utilizing nucle-
ar energy and renewable energy.
Action W. Smart 3R. Recycling shows the largest contribu-
tion, followed by CH4 recovery. Vietnamese government
expects almost all of the waste generation in future will be
recovered and will be reused before dumping to landfill or
going to other processes.
This study aims to investigate future socio-economic sce-
narios and GHG mitigation potentials by low carbon
measures based on integrated modeling and back-casting
approach. The target year is 2030. Two scenarios were set:
2030BaU (Business as Usual) and 2030CM
(CounterMeasures). The 2030BaU scenario, where addition-
al countermeasures for GHG emission reduction are not
introduced, reflects the situation, in which the levels of
commitments to climate-friendly-energy production and
technological breakthroughs are relatively low. Specifically,
countermeasures are assumed the same level as in 2005.
On the other hand, the 2030CM scenario, in which addition-
al low carbon countermeasures are introduced in order to
assess the reduction effects of GHG emission.
The socio-economic assumptions about population, indus-
trial structure and economic growth are common to both
scenarios.
Socio-economic assumptions in 2030 With an annual growth rate of 0.9%, population in 2030
increased 1.3 times compared to 2005, whereas increasing
of household number is slightly larger because of reduction
of household size. With an annual growth rate of 6.5%, GDP
increases almost 5 times in 2030 compared to 2005. In
which, secondary and tertiary sectors contribution to GDP
increase much higher than the one contributed by primary
sector. Passenger and freight transport increase 2.4 and 6.1
times in 2030 compared to 2005, respectively. Freight
transport will increase faster than passenger transport be-
cause of rapid development of industry sector.
A dozen Actions towards low carbon 2030 in
Vietnam Based on the quantitative results with the models, a dozen
actions has been identified. As for the contribution to emis-
sion reductions, energy efficient technology (Action E4) is
the most important in long term while forest and land use
management (Action A5) is another indispensable option.
Renewable energy in Smart power plant (Action E6) and
Smart 3R (Reuse, Reduce, Recycle) (Action W) also have a
significant contribution.
Action A1. Livestock Manure Management. Low carbon
countermeasures in this action are such as “dairy spread of
manure” and “dome digester, for cooking fuel and electrici-
ty generation”.
Action A2. Livestock Enteric Fermentation. Comprising of
two main countermeasures; namely, “high genetic merit”
and “replacement of roughage with concentrates”.
Action A3. Rice Cultivation Management. CH4 emitted
from rice fields is reduced through modified water manage-
ment technologies, such as “midseason drainage” and
“alternate wetting and drying”.
Action A4. Soil Management. This action comprises of two
main countermeasures; namely, “high efficiency fertilizer
application” and “slow-release fertilizer”.
Action A5. Forest and Land Use Management. This action
has the biggest contribution, accounting for 50% of GHG
emission reduction in AFOLU sector.
Action E1. Green Building. Buildings with intelligent struc-
tures for utilization of natural energy resources such as
“photovoltaic energy”. Number of households which utilize
solar and wind energy in daily life is enlarged.
Table 1. A dozen ac�ons towards low carbon 2030 in Vi-
Dozen Actions
towards LCS in Vietnam in 2030
GHG
mitigations
(MtCO2eq)
AFOLU sectors 41.7
Action A1 Livestock Manure Management 2.8
Action A2 Livestock Enteric Fermentation 3.3
Action A3 Rice Cultivation Management 11.9
Action A4 Soil Management 2.9
Action A5 Forest and Land Use Management 20.9
Energy sectors 179.5
Action E1 Green Building 14.4
Action E2 Convenient Transport 15.0
Action E3 Energy Saving Behavior 16.9
Action E4 Energy Efficiency Improvement 78.8
Action E5 Fuel Shift in Industry 15.7
Action E6 Smart Power Plants 38.7
Waste sector 35.6
Action W Smart 3R 35.6
Total 256.9
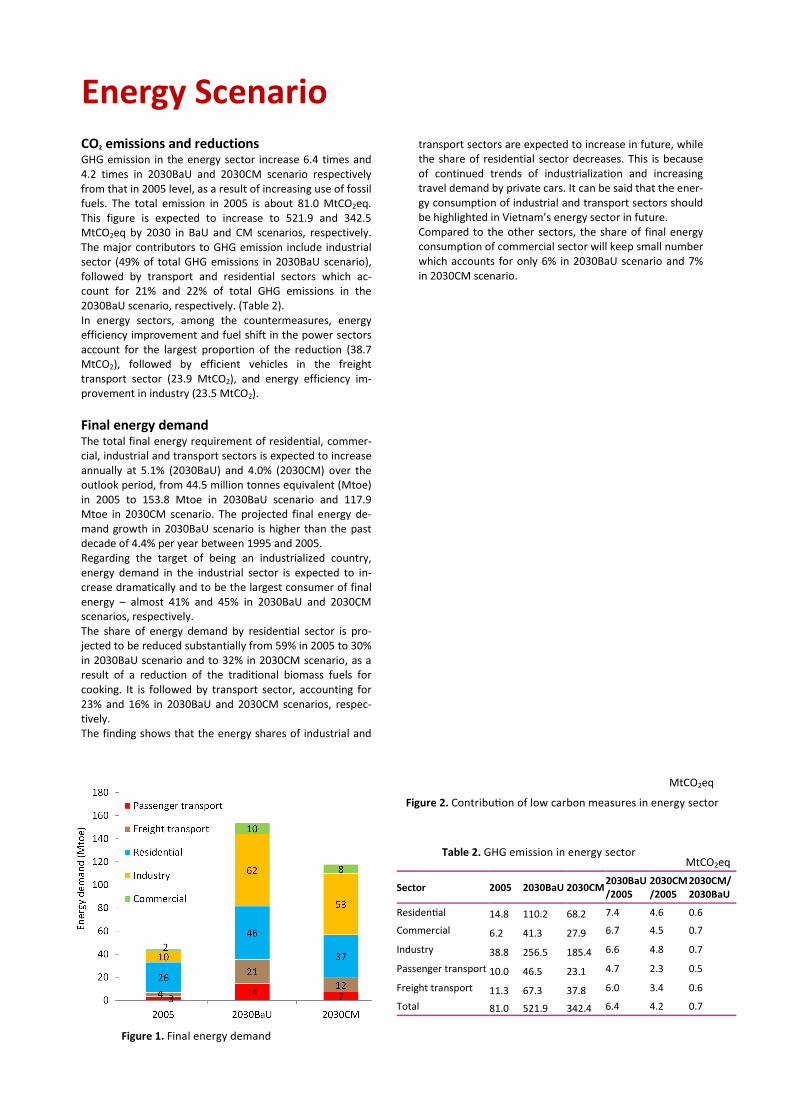
CO2 emissions and reductions GHG emission in the energy sector increase 6.4 times and
4.2 times in 2030BaU and 2030CM scenario respectively
from that in 2005 level, as a result of increasing use of fossil
fuels. The total emission in 2005 is about 81.0 MtCO2eq.
This figure is expected to increase to 521.9 and 342.5
MtCO2eq by 2030 in BaU and CM scenarios, respectively.
The major contributors to GHG emission include industrial
sector (49% of total GHG emissions in 2030BaU scenario),
followed by transport and residential sectors which ac-
count for 21% and 22% of total GHG emissions in the
2030BaU scenario, respectively. (Table 2).
In energy sectors, among the countermeasures, energy
efficiency improvement and fuel shift in the power sectors
account for the largest proportion of the reduction (38.7
MtCO2), followed by efficient vehicles in the freight
transport sector (23.9 MtCO2), and energy efficiency im-
provement in industry (23.5 MtCO2).
Final energy demand The total final energy requirement of residential, commer-
cial, industrial and transport sectors is expected to increase
annually at 5.1% (2030BaU) and 4.0% (2030CM) over the
outlook period, from 44.5 million tonnes equivalent (Mtoe)
in 2005 to 153.8 Mtoe in 2030BaU scenario and 117.9
Mtoe in 2030CM scenario. The projected final energy de-
mand growth in 2030BaU scenario is higher than the past
decade of 4.4% per year between 1995 and 2005.
Regarding the target of being an industrialized country,
energy demand in the industrial sector is expected to in-
crease dramatically and to be the largest consumer of final
energy – almost 41% and 45% in 2030BaU and 2030CM
scenarios, respectively.
The share of energy demand by residential sector is pro-
jected to be reduced substantially from 59% in 2005 to 30%
in 2030BaU scenario and to 32% in 2030CM scenario, as a
result of a reduction of the traditional biomass fuels for
cooking. It is followed by transport sector, accounting for
23% and 16% in 2030BaU and 2030CM scenarios, respec-
tively.
The finding shows that the energy shares of industrial and
transport sectors are expected to increase in future, while
the share of residential sector decreases. This is because
of continued trends of industrialization and increasing
travel demand by private cars. It can be said that the ener-
gy consumption of industrial and transport sectors should
be highlighted in Vietnam’s energy sector in future.
Compared to the other sectors, the share of final energy
consumption of commercial sector will keep small number
which accounts for only 6% in 2030BaU scenario and 7%
in 2030CM scenario.
Figure 2. Contribu�on of low carbon measures in energy sector
Table 2. GHG emission in energy sector
Figure 1. Final energy demand
MtCO2eq
MtCO2eq
Energy Scenario
Sector 2005 2030BaU 2030CM 2030BaU
/2005
2030CM
/2005
2030CM/
2030BaU
Residen�al 14.8 110.2 68.2 7.4 4.6 0.6
Commercial 6.2 41.3 27.9 6.7 4.5 0.7
Industry 38.8 256.5 185.4 6.6 4.8 0.7
Passenger transport 10.0 46.5 23.1 4.7 2.3 0.5
Freight transport 11.3 67.3 37.8 6.0 3.4 0.6
Total 81.0 521.9 342.4 6.4 4.2 0.7

sion and removal from/to soils. Total GHG emissions from
forestry and land use change were es�mated to have de-
clined gradually from 5.0 MtCO2eq in 2005 to 2.9 MtCO2eq
in 2010, respec�vely. ASer 2015, LULUCF is expected to be a
net sequestra�on of CO2, with amounts of –2.7 and –5.7
MtCO2eq, respec�vely in 2020 and 2030.
Mi�ga�on in AFOLU sectors In the AFOLU sectors, we projected GHG reduc�on amount
by countermeasures under a wide range of Allowable Addi-
�onal Costs (AAC) for GHG emission mi�ga�on.
The result shows the reduc�on in 2030 is 10.8 MtCO2eq
under AAC of 0 US$/tCO2eq. It will increase to 42.7
MtCO2eq under AAC of 10 US$/tCO2eq and 44.5 and 48.4
MtCO2eq under 100 and for any cost of AAC. Based on our
findings, a package of mi�ga�on countermeasures at 10
USD/tCO2eq is expected to have some economic efficien-
cies and high mi�ga�ons for GHG emission in the AFOLU
sector in Vietnam. In which, emission reduc�on related to
rice cul�va�on is the significant contribu�on (11.9
MtCO2eq/year) while those in forest and land use manage-
ment are the greatest contribution (Figure 4).
We used AFOLUA to describe the AFOLU ac�vity scenarios.
“Ac�vity” here means a level of produc�on of agriculture
commodi�es, area of land use and land use change. To con-
sider the country specific situa�on, some part of the neces-
sary informa�on was derived from the interna�onal infor-
ma�on sources, such as FAO (2012), and supplemented
with the reports from domes�c ins�tu�ons, such as General
Sta�s�c Office (SYB) Vietnam, the Second Vietnam Na�onal
Communica�on to UNFCCC, the draS report of Vietnam
Inventory in 2005, and other reports from Ministry of Agri-
culture and Rural Development (MARD). Future trends in
ac�vity levels were assumed based on governmental plans
prospec�ve. If they are not available, future scenarios are
es�mated based on the extrapola�on of the historical
trend. Assump�ons in 2030BaU Scenarios are shown in
Table 3.
2030BaU Emissions Total GHG emissions in AFOLU sectors in 2030 are expected
to reach 78.8 MtCO2eq (Figure 3).
In the agricultural sector, CH4 is the largest GHG emission,
followed by N2O. The major sources are rice cul�va�on
(CH4), livestock (CH4 and N2O) and managed soil (N2O). GHG
emissions in the agricultural sector in 2000 were 62.4
MtCO2eq, and gradually increased to 64.8 and 71.7
MtCO2eq in 2005 and 2010, respec�vely. ASer that, the
emission is keeping to increase gradually to 84.5 MtCO2eq
in 2030.
For LULUCF sector, the main source/sink of GHG is from
forest and grassland conversion, which is followed by emis-
Table 3. AFOLU sector assump�ons in 2030
Assump�on in 2030 Source of assump�on
Popula�on
density
Popula�on is increasing
gradually, density is
assumed to increase
about 1.1 �mes in 2030
compared to 2005
2005: 40859 person per
ha
2030: 45000 person per
ha
GSO (2011)
Per capita
food demand
Demand on rice con-
sump�on of Vietnamese
in 2030 is same as cur-
rent �me.
Rice and wheat: the
same as 2005
Other commodi�es:
increase by 0.5% per
year
Food security’s objec�ves
in Vietnam. HP: <hUp://
cholu-
athembong.uniad.com.vn
/�n-nong-nghiep/37-�n-
nong-nghiep/112-kich-
ban-nao-cho-an-ninh-
luong-thuc-quoc-
gia.html>
Food import
rate Same with 2005 This study
Yield Projected values by
MARD
MARD (2011) aUached
with Decision 124/QD-
TTg/2012
Land use
conversion
matrix
Same conversion
paUern as the matrix
from 2001 to 2005
Vietnam Inventory report
in 2005 (draS version)
Figure 4. GHG mi�ga�on poten�al in AFOLU sector in 2030
Figure 3. GHG emissions in AFOLU sector in 2030
Agriculture, Forestry and
Other Land Use (AFOLU) Scenario


