Approved by USDA’s World Agricultural Outlook Board
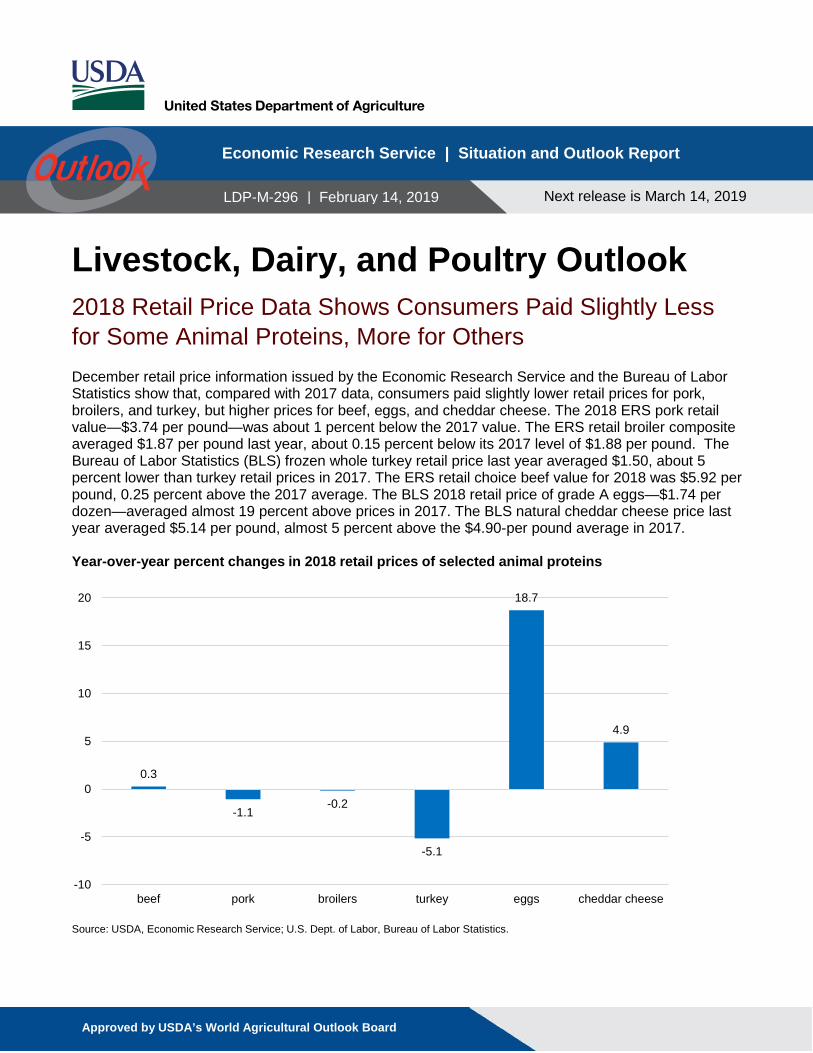
Livestock, Dairy, and Poultry Outlook 2018 Retail Price Data Shows Consumers Paid Slightly Less for Some Animal Proteins, More for Others December retail price information issued by the Economic Research Service and the Bureau of Labor Statistics show that, compared with 2017 data, consumers paid slightly lower retail prices for pork, broilers, and turkey, but higher prices for beef, eggs, and cheddar cheese. The 2018 ERS pork retail value—$3.74 per pound—was about 1 percent below the 2017 value. The ERS retail broiler composite averaged $1.87 per pound last year, about 0.15 percent below its 2017 level of $1.88 per pound. The Bureau of Labor Statistics (BLS) frozen whole turkey retail price last year averaged $1.50, about 5 percent lower than turkey retail prices in 2017. The ERS retail choice beef value for 2018 was $5.92 per pound, 0.25 percent above the 2017 average. The BLS 2018 retail price of grade A eggs—$1.74 per dozen—averaged almost 19 percent above prices in 2017. The BLS natural cheddar cheese price last year averaged $5.14 per pound, almost 5 percent above the $4.90-per pound average in 2017.
0.3
-1.1-0.2
-5.1
18.7
4.9
-10
-5
0
5
10
15
20
beef pork broilers turkey eggs cheddar cheese
Year-over-year percent changes in 2018 retail prices of selected animal proteins
Source: USDA, Economic Research Service; U.S. Dept. of Labor, Bureau of Labor Statistics.
Economic Research Service | Situation and Outlook Report
Next release is March 14, 2019
LDP-M-296 | February 14, 2019
2 Livestock, Dairy, and Poultry Outlook, LDP-M-296, February 14, 2019
USDA, Economic Research Service
Beef/Cattle: A slower pace of slaughter and lighter weights at the end of 2018 reduced the beef production estimate slightly. The 2019 production forecast was reduced on lighter expected carcass weights and a reduced pace of slaughter in the first half of the year. Fed steer prices in first-quarter 2019 are raised from the December forecast, reflecting a slower pace of marketings. The beef import and export forecasts for 2018 and 2019 were lowered from the December estimates based on trade data. Dairy: Most global dairy product prices rose from December to January. Tighter milk supplies among some major dairy exporters likely contributed to the higher prices. For the top four global dairy exporters combined (New Zealand, the EU, the United States, and Australia), November milk production was 216 million pounds below November 2017. For the United States, November milk production was 17.370 billion pounds, a modest 0.6 percent above November 2017. With higher expected international prices, export forecasts for 2019 have been raised on both the milk-fat and skim-solids milk-equivalent bases. The all-milk price forecast is $16.90-$17.60 per cwt, an increase from $16.40-$17.20 forecast in December. Pork/Hogs: Latest available USDA data point to pork production of 27.3 billion pounds in 2019, almost 4 percent greater than the record-high production of 2018. Hog prices are expected to reflect large hog supplies, with first-quarter prices forecast at about 17 percent below same-period a year ago, and second-quarter prices at 8 percent below a year earlier. November pork exports were 4 percent lower, year over year, with weaker shipments to Japan, Mexico, and China accounting for most of the difference. Lower pork prices are expected to drive pork exports higher in 2019. Total exports are forecast at 6.3 billion pounds, 6 percent above shipments in 2018. Poultry/Eggs: Broiler production projections were reduced on slowed slaughter and lower average live weights in recent weeks, while prices were revised upward based on a recent price increase. Broiler export forecasts were increased on expectation that relatively low domestic wholesale prices will encourage increased shipments. Egg production was revised up based on increasing layer inventory and eggs per layer. Wholesale egg prices were revised upward based on a recent increase in prices.
3 Livestock, Dairy, and Poultry Outlook, LDP-M-296, February 14, 2019
USDA, Economic Research Service
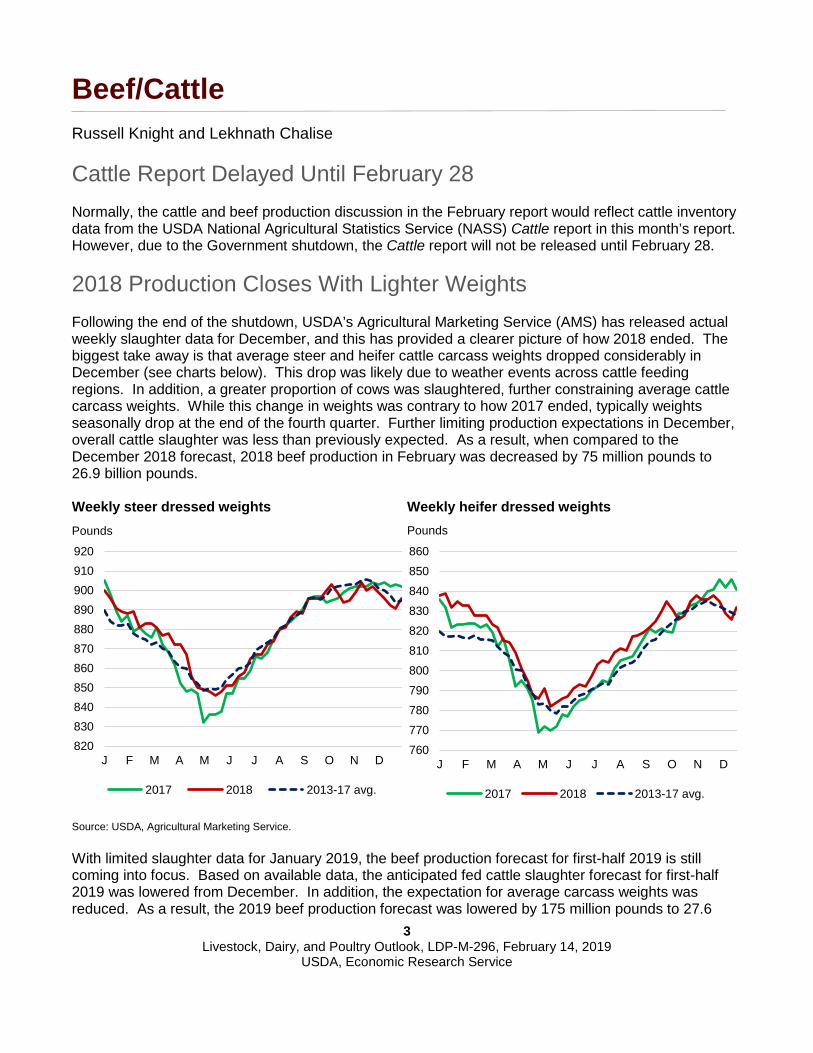
Beef/Cattle Russell Knight and Lekhnath Chalise Cattle Report Delayed Until February 28 Normally, the cattle and beef production discussion in the February report would reflect cattle inventory data from the USDA National Agricultural Statistics Service (NASS) Cattle report in this month’s report. However, due to the Government shutdown, the Cattle report will not be released until February 28. 2018 Production Closes With Lighter Weights Following the end of the shutdown, USDA’s Agricultural Marketing Service (AMS) has released actual weekly slaughter data for December, and this has provided a clearer picture of how 2018 ended. The biggest take away is that average steer and heifer cattle carcass weights dropped considerably in December (see charts below). This drop was likely due to weather events across cattle feeding regions. In addition, a greater proportion of cows was slaughtered, further constraining average cattle carcass weights. While this change in weights was contrary to how 2017 ended, typically weights seasonally drop at the end of the fourth quarter. Further limiting production expectations in December, overall cattle slaughter was less than previously expected. As a result, when compared to the December 2018 forecast, 2018 beef production in February was decreased by 75 million pounds to 26.9 billion pounds.
Source: USDA, Agricultural Marketing Service. With limited slaughter data for January 2019, the beef production forecast for first-half 2019 is still coming into focus. Based on available data, the anticipated fed cattle slaughter forecast for first-half 2019 was lowered from December. In addition, the expectation for average carcass weights was reduced. As a result, the 2019 beef production forecast was lowered by 175 million pounds to 27.6
820830840850860870880890900910920
J F M A M J J A S O N D
2017 2018 2013-17 avg.
Pounds
Weekly steer dressed weights
760770780790800810820830840850860
J F M A M J J A S O N D
2017 2018 2013-17 avg.
Weekly heifer dressed weightsPounds
4 Livestock, Dairy, and Poultry Outlook, LDP-M-296, February 14, 2019
USDA, Economic Research Service
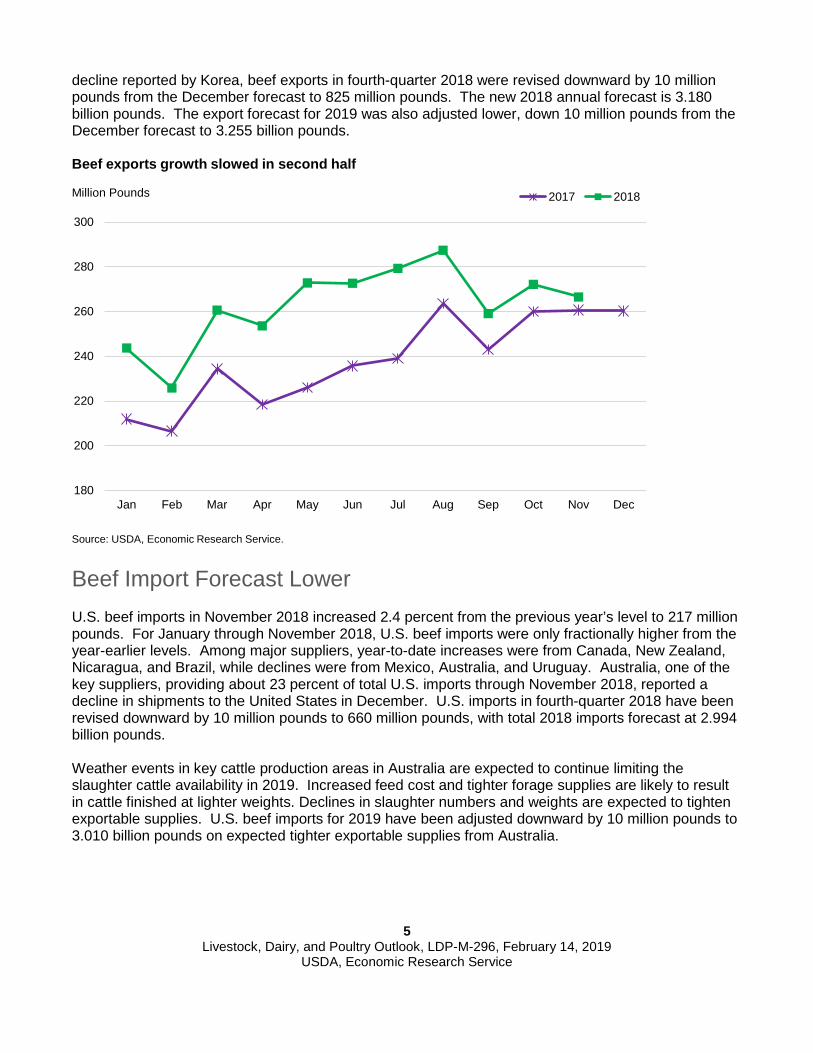
billion pounds. Cattle Held on Feed Longer Heading into 2019 Based on the Cattle on Feed report for November—released by NASS on December 21—there were 5.5 percent fewer net placements and 1.4 percent higher marketings year over year, for a December 1 cattle on feed number of 11.7 million head. However, the count of cattle on feed continued to grow as the number of placements was higher than marketings, keeping the December 1 cattle on feed number the largest for the month since 2011. Among cattle on feed, there were 20 percent more cattle held over 150 days on December 1 than at the same time in 2017. With larger supplies of slaughter-ready cattle available in December, the number of fed cattle slaughtered in December was lower than expected. Winter weather events that month may have hampered feedlots’ ability to finish and market cattle in a timely manner. Expected Feeder Calf Demand Pressures 2019 Prices Compared to fall 2017, it was expected that with improved forage conditions in the Southern Plains, producers would be able to stock a greater number of calves on winter wheat in 2018 to absorb large seasonal supplies of calves in the fall. Based on weekly data from the National Feeder & Stocker Cattle Summary, there were about 1 percent more calves sold in 2018 than in 2017. This was particularly true in fourth-quarter 2018, where about 7 percent more calves were sold than for the same period in 2017. However, in late 2018, feedlots’ pace of marketings slowed more than expected. The large numbers of cattle in feedlots may have stymied feeder calf prices. The fourth-quarter 2018 feeder steer price was $147.90 per hundredweight (cwt) for an annual price of $146.93/cwt. With continued large supplies of cattle in feedlots and a slower expected pace of placements in early 2019, feeder steer prices in first-half 2019 were lowered, bringing the annual price forecast down to $140-$149/cwt, with a midpoint price of $144.50/cwt. Fed Cattle Prices Similar to Last Year Since the December Outlook report, fed cattle prices have continued their seasonal trend upward; prices typically peak in the spring. This reflects a period when fewer fed cattle are slaughtered, carcass weights are lighter, and demand picks up in anticipation of the grilling season. The fourth-quarter 2018 price for fed steers in the 5-area marketing region was $115.32/cwt, making the annual price $117.12/cwt. Based on current price data and an expected slower pace of marketings in the first quarter, the price forecast for first-quarter 2019 increased to $122-$126/cwt, for an annual price forecast of $115-$122/cwt. The slower expected pace of fed cattle marketings and slaughter combined with lower carcass weights could help support higher boxed beef prices in the face of low winter beef demand. Beef Export Forecast Reduced November 2018 U.S. beef exports were 266 million pounds, up 2.2 percent from year-earlier levels, which was the lowest year-over-year growth in 2018. Among major destinations, year-over-year higher volumes were shipped to South Korea, Japan, and Taiwan, while shipments to Hong Kong declined. January through November export growth was above 11 percent, although the pace of year-over-year export growth in 2018 has slowed since July (see chart below). South Korea has reported a notable decline in beef imported from the United States in December from November 2018. Based on the
5 Livestock, Dairy, and Poultry Outlook, LDP-M-296, February 14, 2019
USDA, Economic Research Service
decline reported by Korea, beef exports in fourth-quarter 2018 were revised downward by 10 million pounds from the December forecast to 825 million pounds. The new 2018 annual forecast is 3.180 billion pounds. The export forecast for 2019 was also adjusted lower, down 10 million pounds from the December forecast to 3.255 billion pounds.
Beef Import Forecast Lower U.S. beef imports in November 2018 increased 2.4 percent from the previous year’s level to 217 million pounds. For January through November 2018, U.S. beef imports were only fractionally higher from the year-earlier levels. Among major suppliers, year-to-date increases were from Canada, New Zealand, Nicaragua, and Brazil, while declines were from Mexico, Australia, and Uruguay. Australia, one of the key suppliers, providing about 23 percent of total U.S. imports through November 2018, reported a decline in shipments to the United States in December. U.S. imports in fourth-quarter 2018 have been revised downward by 10 million pounds to 660 million pounds, with total 2018 imports forecast at 2.994 billion pounds. Weather events in key cattle production areas in Australia are expected to continue limiting the slaughter cattle availability in 2019. Increased feed cost and tighter forage supplies are likely to result in cattle finished at lighter weights. Declines in slaughter numbers and weights are expected to tighten exportable supplies. U.S. beef imports for 2019 have been adjusted downward by 10 million pounds to 3.010 billion pounds on expected tighter exportable supplies from Australia.
180
200
220
240
260
280
300
Jan Feb Mar Apr May Jun Jul Aug Sep Oct Nov Dec
2017 2018
Beef exports growth slowed in second half
Million Pounds
Source: USDA, Economic Research Service.

6 Livestock, Dairy, and Poultry Outlook, LDP-M-296, February 14, 2019
USDA, Economic Research Service
Cattle Imports Forecast Higher, Exports Forecast Lower November 2018 U.S. cattle imports were 208,127 head, about 1 percent above year-earlier levels. January through November imports totaled 1.705 million head, up 5 percent year-over-year. Increased imports from Mexico more than offset the decline from Canada and contributed to the year-to-date growth. USDA AMS weekly estimates indicate higher imports from Mexico in December. The 2018 cattle import forecast is raised by 10,000 head to 1.895 million head. The 2019 import forecast is also adjusted upward by 10,000 head to 1.970 million head. U.S. cattle exports in November were down more than 10,000 head year-over-year to 26,237 head. Most of the decline was in shipments to Canada. October and November are typically peak months for placement of cattle into feedlots in Canada. In 2018, U.S. cattle exports to Canada peaked in October, 1 month earlier than the previous year, and declined in November. December 2018 exports are expected to decline further from November. Based on these data, the 2018 export forecasts are revised downward by 10,000 head to 240,000 head. Similarly, the 2019 export forecast was reduced 10,000 head to 245,000 head.
7 Livestock, Dairy, and Poultry Outlook, LDP-M-296, February 14, 2019
USDA, Economic Research Service
Dairy Jerry Cessna and Jonathan Law
Recent Developments in Dairy Markets Usually, in February most dairy-related data are available for the entire previous year. However, due to the recent Government shutdown, most dairy-related data reported by USDA National Agricultural Statistics (NASS) and trade data reported by the U.S. Census Bureau have been updated through November but are not yet available for December. Since USDA Agricultural Marketing Service (AMS) continued to provide data during the shutdown period, AMS data referenced in this publication are up to date. From December 2018 to January 2019, with the exception of a 0.8-cent per pound decline in the U.S. butter price, all of the U.S. major domestic wholesale dairy prices and international prices rose.
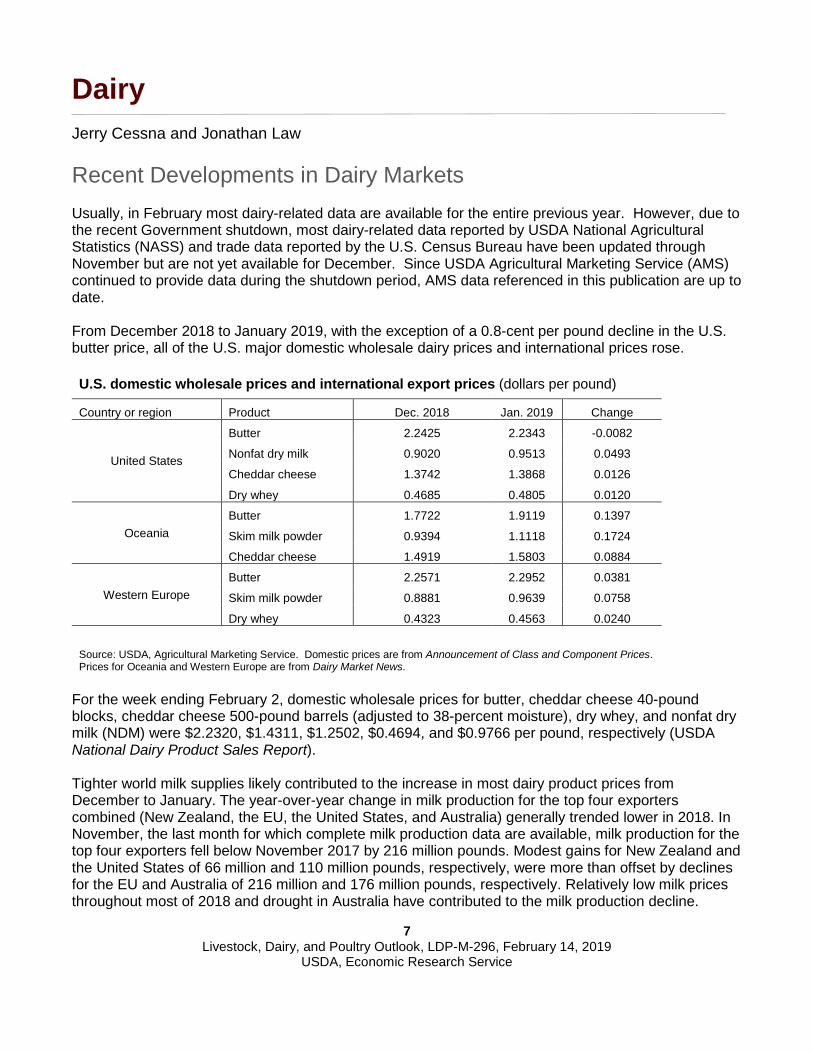
U.S. domestic wholesale prices and international export prices (dollars per pound)
Country or region Product Dec. 2018 Jan. 2019 Change
United States
Butter 2.2425 2.2343 -0.0082
Nonfat dry milk 0.9020 0.9513 0.0493
Cheddar cheese 1.3742 1.3868 0.0126
Dry whey 0.4685 0.4805 0.0120
Oceania Butter 1.7722 1.9119 0.1397
Skim milk powder 0.9394 1.1118 0.1724
Cheddar cheese 1.4919 1.5803 0.0884
Western Europe Butter 2.2571 2.2952 0.0381
Skim milk powder 0.8881 0.9639 0.0758
Dry whey 0.4323 0.4563 0.0240
Source: USDA, Agricultural Marketing Service. Domestic prices are from Announcement of Class and Component Prices. Prices for Oceania and Western Europe are from Dairy Market News.
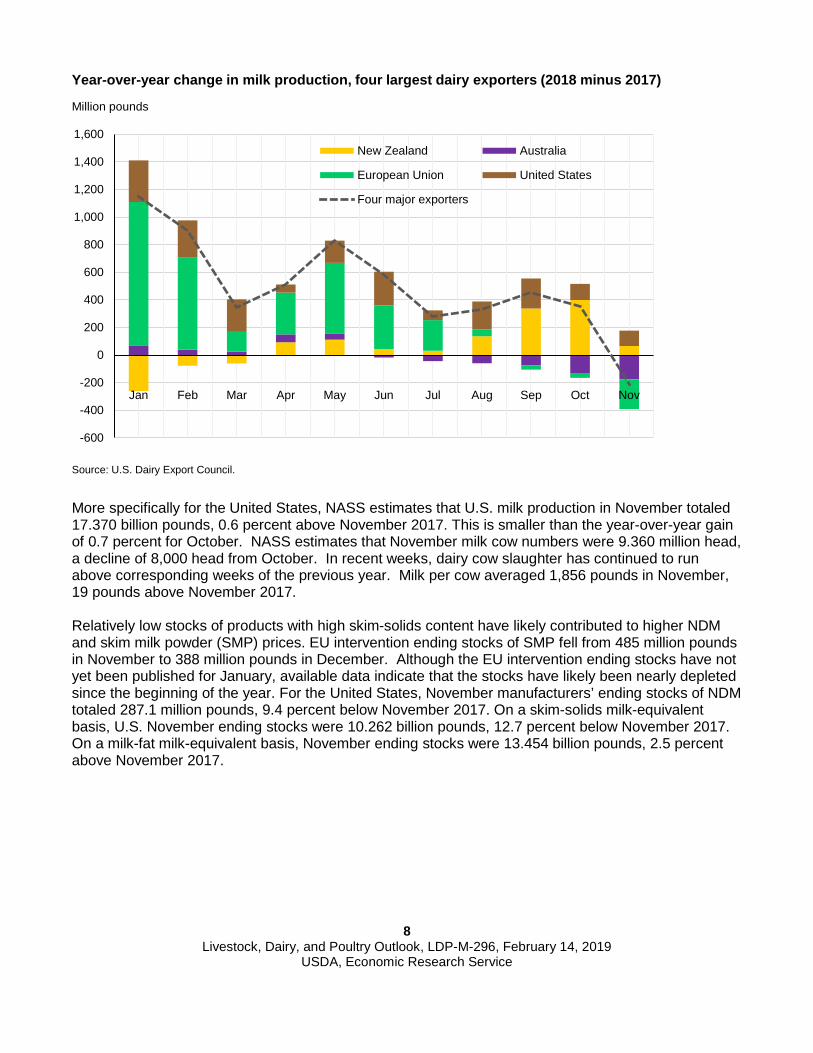
For the week ending February 2, domestic wholesale prices for butter, cheddar cheese 40-pound blocks, cheddar cheese 500-pound barrels (adjusted to 38-percent moisture), dry whey, and nonfat dry milk (NDM) were $2.2320, $1.4311, $1.2502, $0.4694, and $0.9766 per pound, respectively (USDA National Dairy Product Sales Report). Tighter world milk supplies likely contributed to the increase in most dairy product prices from December to January. The year-over-year change in milk production for the top four exporters combined (New Zealand, the EU, the United States, and Australia) generally trended lower in 2018. In November, the last month for which complete milk production data are available, milk production for the top four exporters fell below November 2017 by 216 million pounds. Modest gains for New Zealand and the United States of 66 million and 110 million pounds, respectively, were more than offset by declines for the EU and Australia of 216 million and 176 million pounds, respectively. Relatively low milk prices throughout most of 2018 and drought in Australia have contributed to the milk production decline.
8 Livestock, Dairy, and Poultry Outlook, LDP-M-296, February 14, 2019
USDA, Economic Research Service
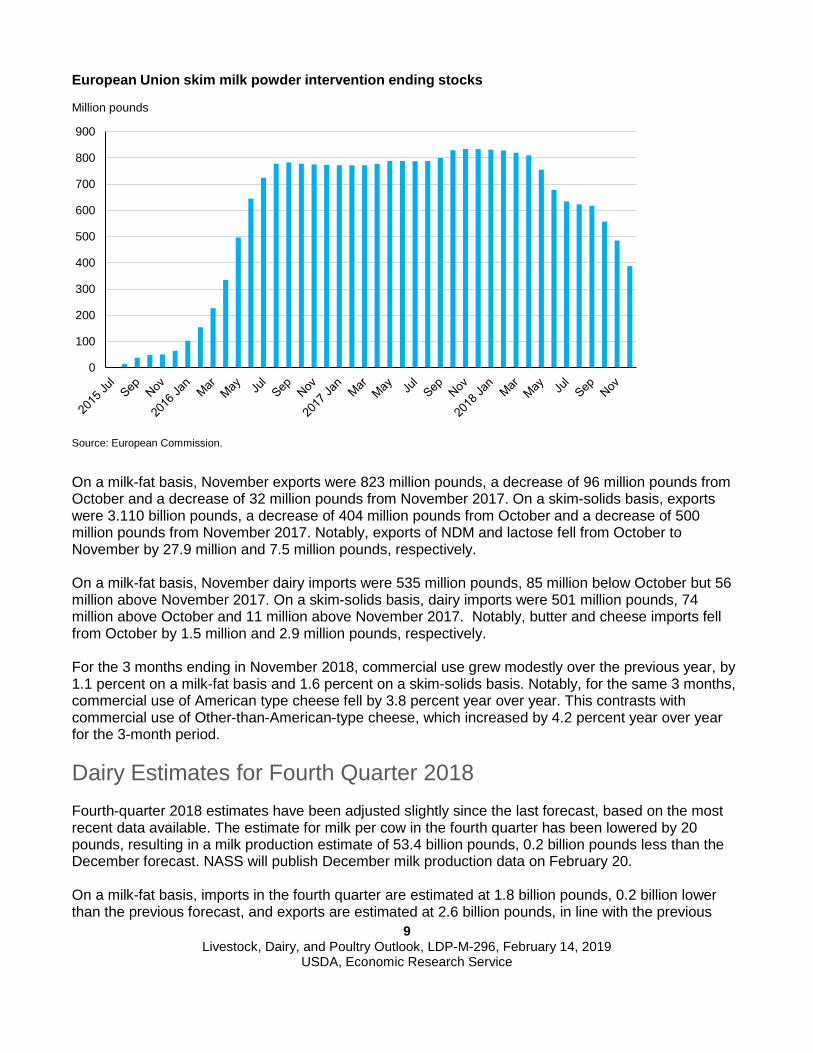
More specifically for the United States, NASS estimates that U.S. milk production in November totaled 17.370 billion pounds, 0.6 percent above November 2017. This is smaller than the year-over-year gain of 0.7 percent for October. NASS estimates that November milk cow numbers were 9.360 million head, a decline of 8,000 head from October. In recent weeks, dairy cow slaughter has continued to run above corresponding weeks of the previous year. Milk per cow averaged 1,856 pounds in November, 19 pounds above November 2017. Relatively low stocks of products with high skim-solids content have likely contributed to higher NDM and skim milk powder (SMP) prices. EU intervention ending stocks of SMP fell from 485 million pounds in November to 388 million pounds in December. Although the EU intervention ending stocks have not yet been published for January, available data indicate that the stocks have likely been nearly depleted since the beginning of the year. For the United States, November manufacturers’ ending stocks of NDM totaled 287.1 million pounds, 9.4 percent below November 2017. On a skim-solids milk-equivalent basis, U.S. November ending stocks were 10.262 billion pounds, 12.7 percent below November 2017. On a milk-fat milk-equivalent basis, November ending stocks were 13.454 billion pounds, 2.5 percent above November 2017.
-600
-400
-200
0
200
400
600
800
1,000
1,200
1,400
1,600
Jan Feb Mar Apr May Jun Jul Aug Sep Oct Nov
New Zealand Australia
European Union United States
Four major exporters
Source: U.S. Dairy Export Council.
Year-over-year change in milk production, four largest dairy exporters (2018 minus 2017)
Million pounds
9 Livestock, Dairy, and Poultry Outlook, LDP-M-296, February 14, 2019
USDA, Economic Research Service
On a milk-fat basis, November exports were 823 million pounds, a decrease of 96 million pounds from October and a decrease of 32 million pounds from November 2017. On a skim-solids basis, exports were 3.110 billion pounds, a decrease of 404 million pounds from October and a decrease of 500 million pounds from November 2017. Notably, exports of NDM and lactose fell from October to November by 27.9 million and 7.5 million pounds, respectively. On a milk-fat basis, November dairy imports were 535 million pounds, 85 million below October but 56 million above November 2017. On a skim-solids basis, dairy imports were 501 million pounds, 74 million above October and 11 million above November 2017. Notably, butter and cheese imports fell from October by 1.5 million and 2.9 million pounds, respectively. For the 3 months ending in November 2018, commercial use grew modestly over the previous year, by 1.1 percent on a milk-fat basis and 1.6 percent on a skim-solids basis. Notably, for the same 3 months, commercial use of American type cheese fell by 3.8 percent year over year. This contrasts with commercial use of Other-than-American-type cheese, which increased by 4.2 percent year over year for the 3-month period. Dairy Estimates for Fourth Quarter 2018 Fourth-quarter 2018 estimates have been adjusted slightly since the last forecast, based on the most recent data available. The estimate for milk per cow in the fourth quarter has been lowered by 20 pounds, resulting in a milk production estimate of 53.4 billion pounds, 0.2 billion pounds less than the December forecast. NASS will publish December milk production data on February 20. On a milk-fat basis, imports in the fourth quarter are estimated at 1.8 billion pounds, 0.2 billion lower than the previous forecast, and exports are estimated at 2.6 billion pounds, in line with the previous
0
100
200
300
400
500
600
700
800
900
Source: European Commission.
European Union skim milk powder intervention ending stocks
Million pounds
10 Livestock, Dairy, and Poultry Outlook, LDP-M-296, February 14, 2019
USDA, Economic Research Service
forecast. Ending stocks are now forecast at 13.7 billion pounds, 0.4 billion pounds lower than previously estimated. Domestic use for the quarter is estimated at 56.0 billion pounds, 0.1 billion pounds higher than the December forecast. On a skim-solids basis, fourth-quarter imports are estimated at 1.4 billion pounds for the fourth quarter, 0.1 billion pounds higher than previously expected. Exports are estimated at 9.9 billion pounds, 0.4 billion pounds lower than the previous forecast due to relatively low November exports of NDM and lactose. Ending stocks are expected to be 0.5 billion pounds higher than the last forecast, at 11.2 billion pounds. Domestic use is expected to be slightly lower in the fourth quarter than previously projected, at 44.1 billion pounds. Most product prices remained within the previously forecast ranges for the fourth quarter following the release of December data. The cheddar cheese price was an exception, ending up above the previous forecast at $1.463 per pound. The fourth-quarter dry whey, butter, and NDM prices were $0.459, $2.264 and $0.887 per pound, respectively. The Class III price for the fourth quarter was $14.58 per cwt, above the previously forecast range; the Class IV price was $15.05 per cwt, within the forecast range. The all-milk price for the fourth quarter is estimated at $16.95-$17.05 per cwt, in line with the December forecast. NASS will report the December all-milk price on February 20. Dairy Forecasts for 2019 Following a decline in the number of milk cows in November and relatively high slaughter rates during December, the forecast for the size of the milking herd has been lowered 5 thousand head for the first half of 2019; however, the rounded estimate for the year remains at 9.365 million head. Based on relatively weak yield growth continuing in November, the 2019 milk per cow forecast has been lowered 50 pounds to 23,505. These changes result in a milk production forecast of 220.1 billion pounds for 2019, 0.5 billion pounds lower than the previous forecast. The outlook for feed prices has changed only slightly since the December forecasts. The corn price forecast for 2018/19 is $3.35-$3.85 per bushel, unchanged at the midpoint of the range. The 2018/19 soybean meal price forecast has been raised to $295-$335 per short ton, $5 higher at the midpoint of the range. The alfalfa hay price for November was $175 per short ton, $3 higher than October and $25 higher than November 2017. For more information, see the ERS Feed Price Outlook publication. On a milk-fat basis, the export forecast for 2019 has been raised 0.3 billion pounds to 10.3 billion, as cheese exports should be stronger than previously forecast and butter exports should find more support from rising EU and Oceania prices. The import forecast for the year has been lowered 0.1 billion pounds to 6.6 billion. The forecast for ending stocks has been lowered to 13.3 billion pounds, as stocks should draw down during the year from a lower forecast base. Domestic use is forecast 0.8 billion pounds lower than previously forecast, at 215.5 billion pounds. On a skim-solids basis, the 2019 export forecast has been raised 0.5 billion pounds to 44.6 billion, as EU intervention stocks of SMP have likely been almost completely sold off and drought in Australia has led to flagging production there. The import forecast for 2019 is unchanged at 5.2 billion pounds. The ending stock forecast on a skim-solids basis has been raised to 11.1 billion pounds, 0.7 billion higher than the previous forecast. The 2019 domestic use forecast is 179.6 billion pounds, 1.3 billion less than last month’s forecast. Product price forecasts have mostly been raised for 2019. The exception is the cheddar cheese price, which is forecast slightly lower at $1.480-$1.550 per pound, based on recent weakness in prices. The
11 Livestock, Dairy, and Poultry Outlook, LDP-M-296, February 14, 2019
USDA, Economic Research Service
dry whey price forecast has been raised to $0.435-$0.465 per pound for the year, also based on recent price data. The butter price is forecast slightly higher than previously at $2.230-$2.330 per pound for the year, due to expected strength in exports of butter and butterfat products. NDM prices have increased lately and should continue to find support from export growth in 2019; as a result, the NDM price forecast for the year has been raised 12 cents at the midpoint of the range to $0.955-$1.015 per pound. The Class III price forecast for 2019 is $14.70-$15.40 per cwt, unchanged from the midpoint from the December forecast, as the lower cheese price is expected to be offset by the higher whey price. With higher prices for butter and NDM in 2019, the Class IV price forecast for the year has been raised to $15.55-$16.35 per cwt. The all-milk price forecast for 2019 is $16.90-$17.60 per cwt, an increase of 45 cents from the last forecast at the midpoint of the range.
12 Livestock, Dairy, and Poultry Outlook, LDP-M-296, February 14, 2019
USDA, Economic Research Service
Pork/Hogs Mildred Haley
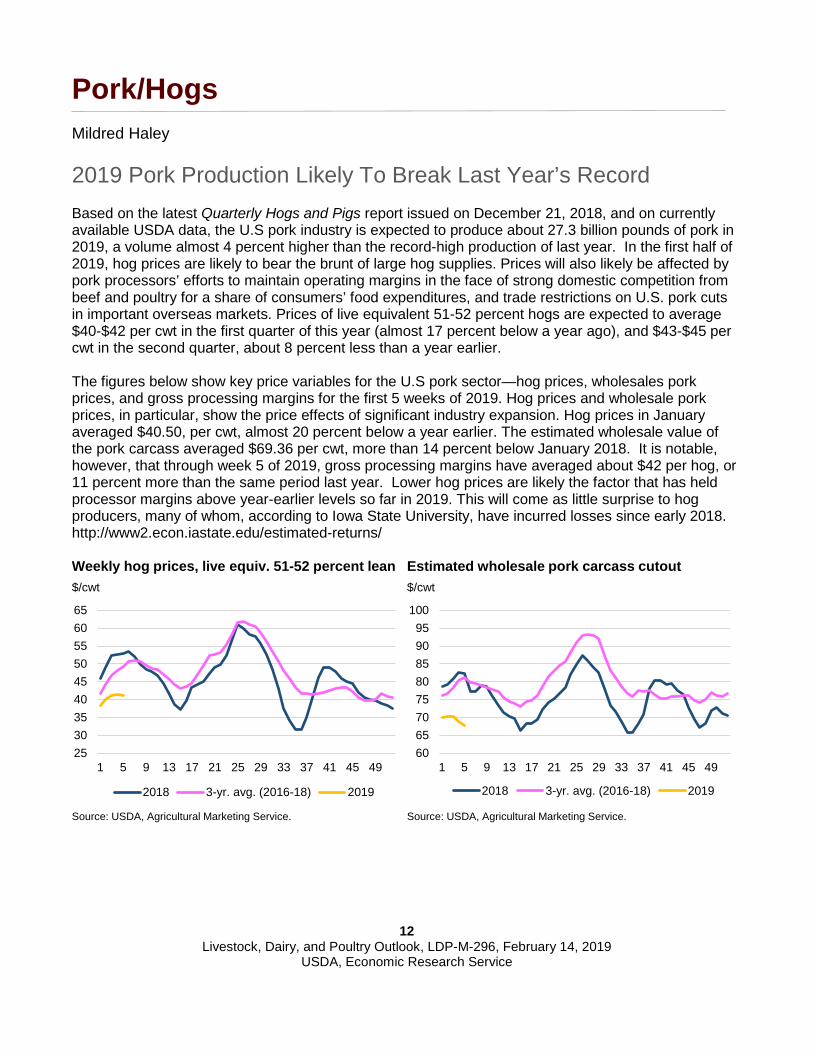
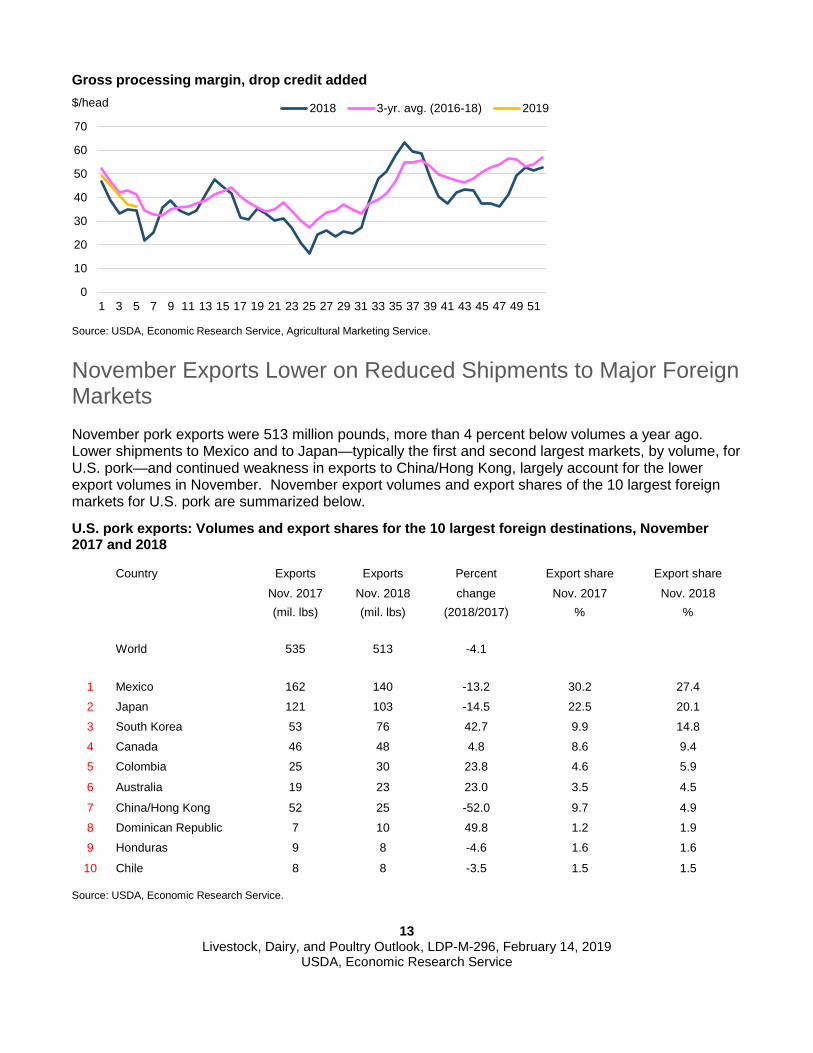
2019 Pork Production Likely To Break Last Year’s Record Based on the latest Quarterly Hogs and Pigs report issued on December 21, 2018, and on currently available USDA data, the U.S pork industry is expected to produce about 27.3 billion pounds of pork in 2019, a volume almost 4 percent higher than the record-high production of last year. In the first half of 2019, hog prices are likely to bear the brunt of large hog supplies. Prices will also likely be affected by pork processors’ efforts to maintain operating margins in the face of strong domestic competition from beef and poultry for a share of consumers’ food expenditures, and trade restrictions on U.S. pork cuts in important overseas markets. Prices of live equivalent 51-52 percent hogs are expected to average $40-$42 per cwt in the first quarter of this year (almost 17 percent below a year ago), and $43-$45 per cwt in the second quarter, about 8 percent less than a year earlier. The figures below show key price variables for the U.S pork sector—hog prices, wholesales pork prices, and gross processing margins for the first 5 weeks of 2019. Hog prices and wholesale pork prices, in particular, show the price effects of significant industry expansion. Hog prices in January averaged $40.50, per cwt, almost 20 percent below a year earlier. The estimated wholesale value of the pork carcass averaged $69.36 per cwt, more than 14 percent below January 2018. It is notable, however, that through week 5 of 2019, gross processing margins have averaged about $42 per hog, or 11 percent more than the same period last year. Lower hog prices are likely the factor that has held processor margins above year-earlier levels so far in 2019. This will come as little surprise to hog producers, many of whom, according to Iowa State University, have incurred losses since early 2018. http://www2.econ.iastate.edu/estimated-returns/
253035404550556065
1 5 9 13 17 21 25 29 33 37 41 45 49
2018 3-yr. avg. (2016-18) 2019
Weekly hog prices, live equiv. 51-52 percent lean$/cwt
Source: USDA, Agricultural Marketing Service.
6065707580859095
100
1 5 9 13 17 21 25 29 33 37 41 45 49
2018 3-yr. avg. (2016-18) 2019
Estimated wholesale pork carcass cutout$/cwt
Source: USDA, Agricultural Marketing Service.
13 Livestock, Dairy, and Poultry Outlook, LDP-M-296, February 14, 2019
USDA, Economic Research Service
November Exports Lower on Reduced Shipments to Major Foreign Markets November pork exports were 513 million pounds, more than 4 percent below volumes a year ago. Lower shipments to Mexico and to Japan—typically the first and second largest markets, by volume, for U.S. pork—and continued weakness in exports to China/Hong Kong, largely account for the lower export volumes in November. November export volumes and export shares of the 10 largest foreign markets for U.S. pork are summarized below.
U.S. pork exports: Volumes and export shares for the 10 largest foreign destinations, November 2017 and 2018
Country Exports Exports Percent Export share Export share
Nov. 2017 Nov. 2018 change Nov. 2017 Nov. 2018 (mil. lbs) (mil. lbs) (2018/2017) % % World 535 513 -4.1
1 Mexico 162 140 -13.2 30.2 27.4 2 Japan 121 103 -14.5 22.5 20.1 3 South Korea 53 76 42.7 9.9 14.8 4 Canada 46 48 4.8 8.6 9.4 5 Colombia 25 30 23.8 4.6 5.9
6 Australia 19 23 23.0 3.5 4.5
7 China/Hong Kong 52 25 -52.0 9.7 4.9 8 Dominican Republic 7 10 49.8 1.2 1.9 9 Honduras 9 8 -4.6 1.6 1.6
10 Chile 8 8 -3.5 1.5 1.5
Source: USDA, Economic Research Service.
0
10
20
30
40
50
60
70
1 3 5 7 9 11 13 15 17 19 21 23 25 27 29 31 33 35 37 39 41 43 45 47 49 51
2018 3-yr. avg. (2016-18) 2019
Source: USDA, Economic Research Service, Agricultural Marketing Service.
$/head
Gross processing margin, drop credit added
14 Livestock, Dairy, and Poultry Outlook, LDP-M-296, February 14, 2019
USDA, Economic Research Service
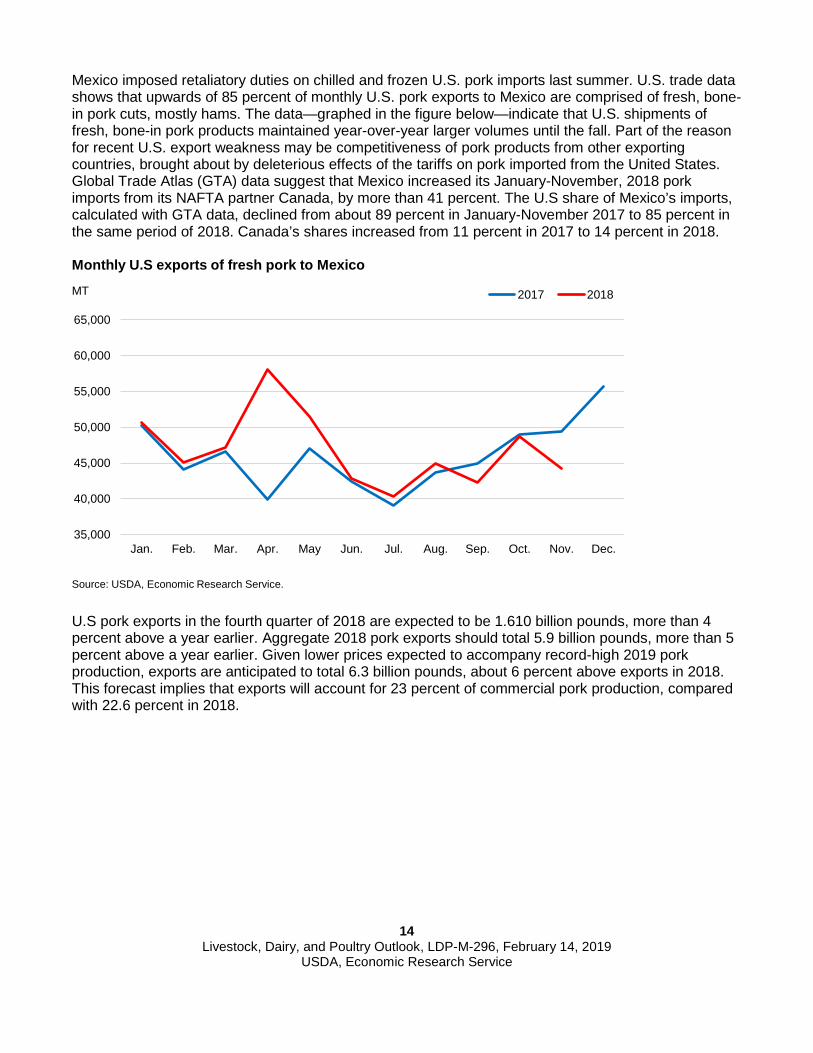
Mexico imposed retaliatory duties on chilled and frozen U.S. pork imports last summer. U.S. trade data shows that upwards of 85 percent of monthly U.S. pork exports to Mexico are comprised of fresh, bone-in pork cuts, mostly hams. The data—graphed in the figure below—indicate that U.S. shipments of fresh, bone-in pork products maintained year-over-year larger volumes until the fall. Part of the reason for recent U.S. export weakness may be competitiveness of pork products from other exporting countries, brought about by deleterious effects of the tariffs on pork imported from the United States. Global Trade Atlas (GTA) data suggest that Mexico increased its January-November, 2018 pork imports from its NAFTA partner Canada, by more than 41 percent. The U.S share of Mexico’s imports, calculated with GTA data, declined from about 89 percent in January-November 2017 to 85 percent in the same period of 2018. Canada’s shares increased from 11 percent in 2017 to 14 percent in 2018.
U.S pork exports in the fourth quarter of 2018 are expected to be 1.610 billion pounds, more than 4 percent above a year earlier. Aggregate 2018 pork exports should total 5.9 billion pounds, more than 5 percent above a year earlier. Given lower prices expected to accompany record-high 2019 pork production, exports are anticipated to total 6.3 billion pounds, about 6 percent above exports in 2018. This forecast implies that exports will account for 23 percent of commercial pork production, compared with 22.6 percent in 2018.
35,000
40,000
45,000
50,000
55,000
60,000
65,000
Jan. Feb. Mar. Apr. May Jun. Jul. Aug. Sep. Oct. Nov. Dec.
2017 2018
Monthly U.S exports of fresh pork to Mexico
MT
Source: USDA, Economic Research Service.
15 Livestock, Dairy, and Poultry Outlook, LDP-M-296, February 14, 2019
USDA, Economic Research Service
Poultry Kim Ha and Alex Melton
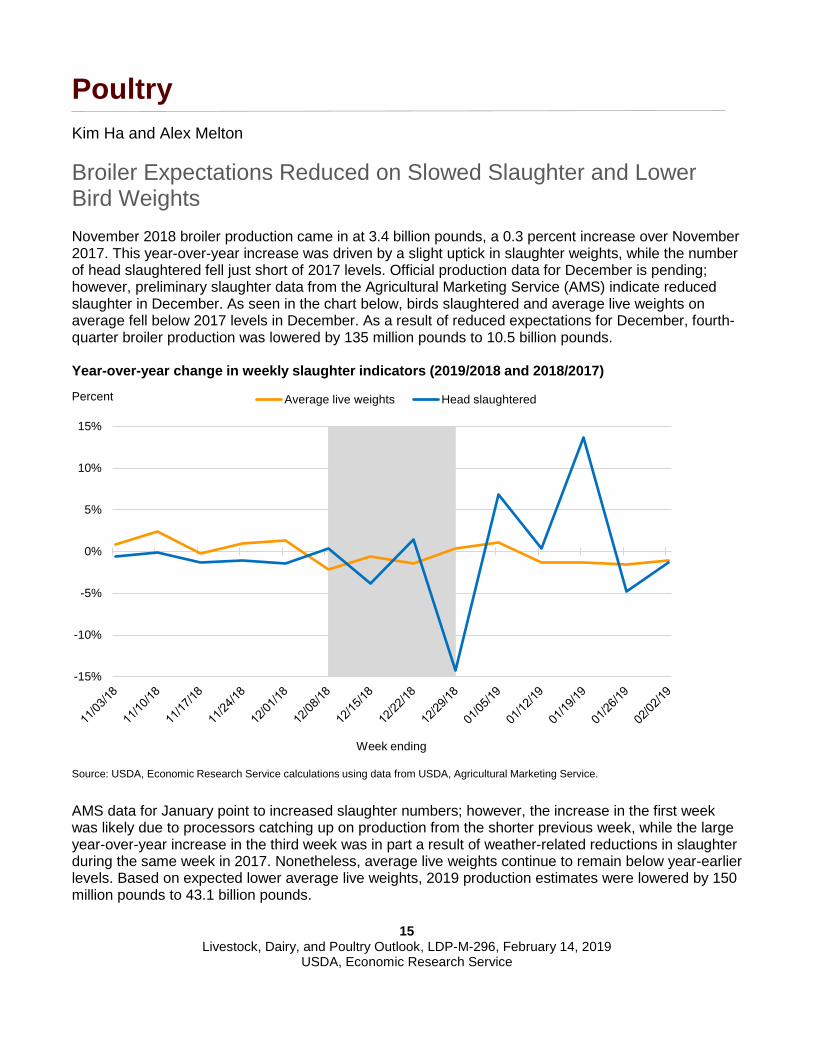
Broiler Expectations Reduced on Slowed Slaughter and Lower Bird Weights November 2018 broiler production came in at 3.4 billion pounds, a 0.3 percent increase over November 2017. This year-over-year increase was driven by a slight uptick in slaughter weights, while the number of head slaughtered fell just short of 2017 levels. Official production data for December is pending; however, preliminary slaughter data from the Agricultural Marketing Service (AMS) indicate reduced slaughter in December. As seen in the chart below, birds slaughtered and average live weights on average fell below 2017 levels in December. As a result of reduced expectations for December, fourth-quarter broiler production was lowered by 135 million pounds to 10.5 billion pounds.
AMS data for January point to increased slaughter numbers; however, the increase in the first week was likely due to processors catching up on production from the shorter previous week, while the large year-over-year increase in the third week was in part a result of weather-related reductions in slaughter during the same week in 2017. Nonetheless, average live weights continue to remain below year-earlier levels. Based on expected lower average live weights, 2019 production estimates were lowered by 150 million pounds to 43.1 billion pounds.
-15%
-10%
-5%
0%
5%
10%
15%
Week ending
Average live weights Head slaughtered
Year-over-year change in weekly slaughter indicators (2019/2018 and 2018/2017)
Source: USDA, Economic Research Service calculations using data from USDA, Agricultural Marketing Service.
Percent
16 Livestock, Dairy, and Poultry Outlook, LDP-M-296, February 14, 2019
USDA, Economic Research Service
Benchmark Broiler Price Rallies in January, Forecasts Revised Upward Weekly whole broiler (national composite) prices averaged 89.75 cents per pound in December and 98.90 cents per pound in January. These average prices were 2.8 percent and 5.2 percent higher year over year, respectively. Beginning in the 3rd week of December, prices rallied for 4 weeks, climbing to almost 105 cents per pound in early January before falling back down to 92 cents per pound at the end of the month. The brief increase in price was likely in part a result of tightening supplies from the reduced production during the last few weeks of 2018. First- and second-quarter prices are forecast slightly higher at 97-99 cents per pound and 102-108 cents per pound, respectively.
Low Domestic Wholesale Prices Continue To Drive Broiler Exports, Forecasts Increased Broiler exports totaled 621.5 billion pounds in November, nearly 8 percent higher than last year. Increased shipments to Mexico, Angola, Guatemala, and the Philippines contributed to this growth. Average value per unit of exports continued to slide in November and remain below levels during the outbreak of avian influenza in 2015. Domestic wholesale prices for leg quarters—which constitute on average half of broiler export volumes—remained low in December and January. These low domestic prices will likely continue to make U.S. leg quarters attractive to foreign buyers, supporting strong shipments. Fourth-quarter exports were increased by 25 million pounds, and 2019 exports were increased by 60 million pounds.
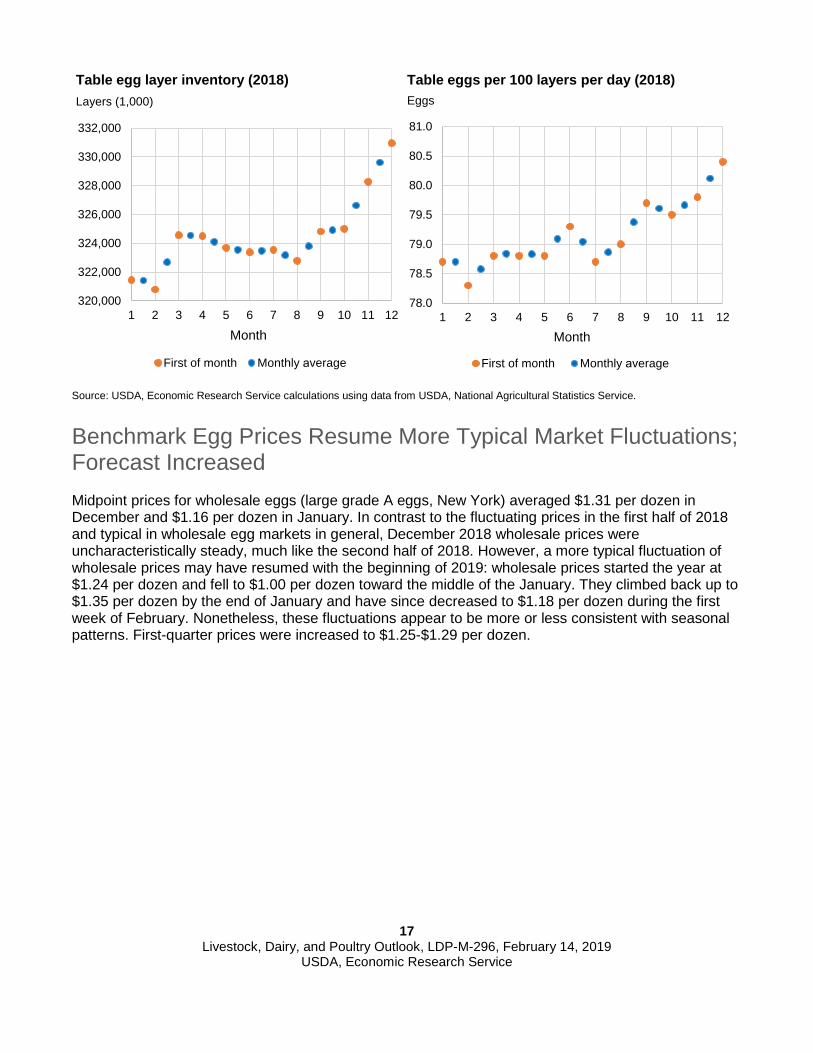
Table Egg Layer Inventory and Eggs Per Layer Continue To Increase, Production Forecasts Revised Upward Table egg production was 660 million dozen in November, a 3.2-percent increase over last year. This increase was comprised of a 2.8-percent increase in average table egg layer inventory and a 0.4-percent increase in average eggs per layer. Average layer inventory and eggs per layer have been on an upward trend for most of 2018, and December 1 data suggest a likely continuation of this trend for the month of December. While first-of-month data only provide data for 1 day, they often signal the direction of trends for the coming month, as illustrated in the charts below. Based on expectations of a continued increase in layer inventory and eggs per layer, the forecast for 2018 fourth-quarter table egg production was increased by 10 million dozen, and first-half 2019 table egg production was raised by 10 million dozen.
17 Livestock, Dairy, and Poultry Outlook, LDP-M-296, February 14, 2019
USDA, Economic Research Service
Source: USDA, Economic Research Service calculations using data from USDA, National Agricultural Statistics Service.
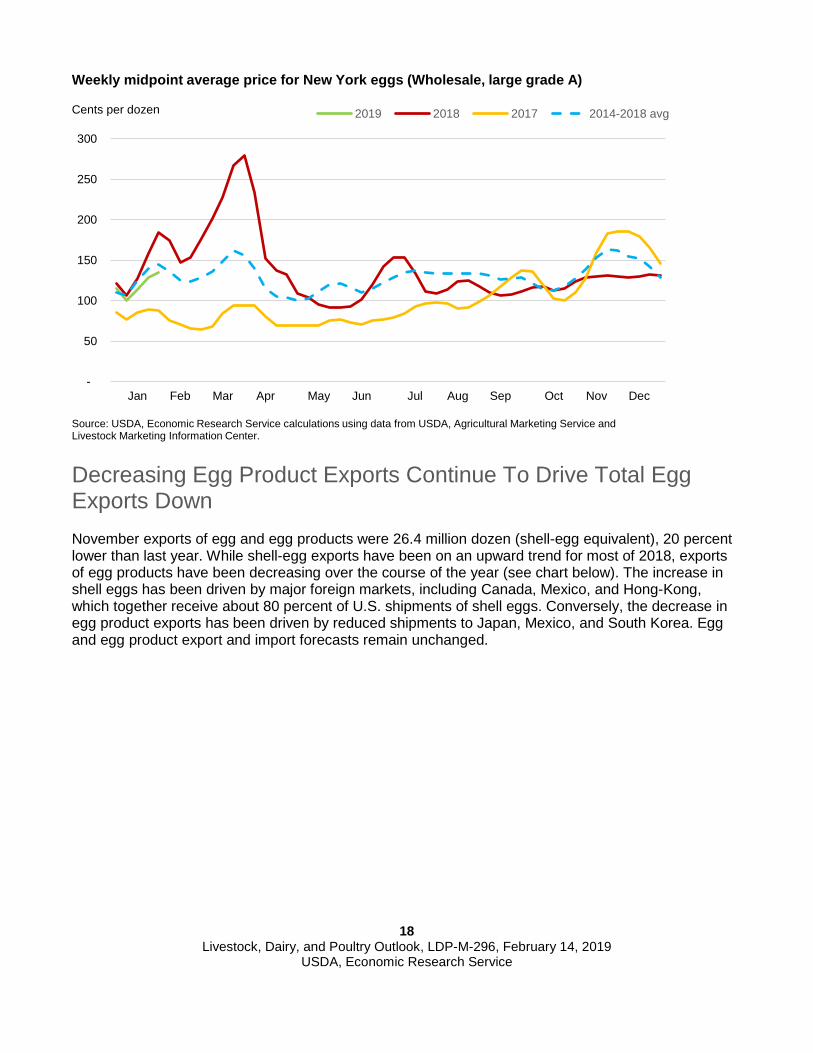
Benchmark Egg Prices Resume More Typical Market Fluctuations; Forecast Increased Midpoint prices for wholesale eggs (large grade A eggs, New York) averaged $1.31 per dozen in December and $1.16 per dozen in January. In contrast to the fluctuating prices in the first half of 2018 and typical in wholesale egg markets in general, December 2018 wholesale prices were uncharacteristically steady, much like the second half of 2018. However, a more typical fluctuation of wholesale prices may have resumed with the beginning of 2019: wholesale prices started the year at $1.24 per dozen and fell to $1.00 per dozen toward the middle of the January. They climbed back up to $1.35 per dozen by the end of January and have since decreased to $1.18 per dozen during the first week of February. Nonetheless, these fluctuations appear to be more or less consistent with seasonal patterns. First-quarter prices were increased to $1.25-$1.29 per dozen.
320,000
322,000
324,000
326,000
328,000
330,000
332,000
1 2 3 4 5 6 7 8 9 10 11 12
Month
First of month Monthly average
Table egg layer inventory (2018)Layers (1,000)
78.0
78.5
79.0
79.5
80.0
80.5
81.0
1 2 3 4 5 6 7 8 9 10 11 12Month
First of month Monthly average
EggsTable eggs per 100 layers per day (2018)
18 Livestock, Dairy, and Poultry Outlook, LDP-M-296, February 14, 2019
USDA, Economic Research Service
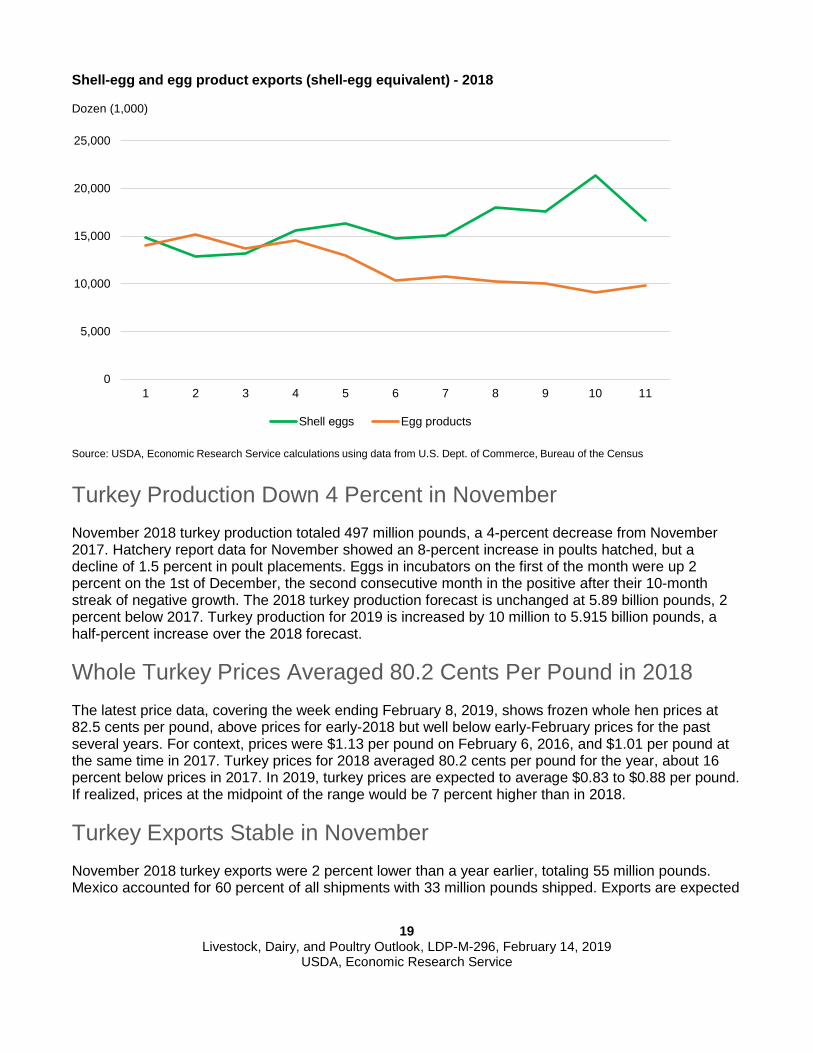
Decreasing Egg Product Exports Continue To Drive Total Egg Exports Down November exports of egg and egg products were 26.4 million dozen (shell-egg equivalent), 20 percent lower than last year. While shell-egg exports have been on an upward trend for most of 2018, exports of egg products have been decreasing over the course of the year (see chart below). The increase in shell eggs has been driven by major foreign markets, including Canada, Mexico, and Hong-Kong, which together receive about 80 percent of U.S. shipments of shell eggs. Conversely, the decrease in egg product exports has been driven by reduced shipments to Japan, Mexico, and South Korea. Egg and egg product export and import forecasts remain unchanged.
-
50
100
150
200
250
300
Jan Feb Mar Apr May Jun Jul Aug Sep Oct Nov Dec
2019 2018 2017 2014-2018 avg
Source: USDA, Economic Research Service calculations using data from USDA, Agricultural Marketing Service and Livestock Marketing Information Center.
Weekly midpoint average price for New York eggs (Wholesale, large grade A)
Cents per dozen
19 Livestock, Dairy, and Poultry Outlook, LDP-M-296, February 14, 2019
USDA, Economic Research Service
Turkey Production Down 4 Percent in November November 2018 turkey production totaled 497 million pounds, a 4-percent decrease from November 2017. Hatchery report data for November showed an 8-percent increase in poults hatched, but a decline of 1.5 percent in poult placements. Eggs in incubators on the first of the month were up 2 percent on the 1st of December, the second consecutive month in the positive after their 10-month streak of negative growth. The 2018 turkey production forecast is unchanged at 5.89 billion pounds, 2 percent below 2017. Turkey production for 2019 is increased by 10 million to 5.915 billion pounds, a half-percent increase over the 2018 forecast.
Whole Turkey Prices Averaged 80.2 Cents Per Pound in 2018 The latest price data, covering the week ending February 8, 2019, shows frozen whole hen prices at 82.5 cents per pound, above prices for early-2018 but well below early-February prices for the past several years. For context, prices were $1.13 per pound on February 6, 2016, and $1.01 per pound at the same time in 2017. Turkey prices for 2018 averaged 80.2 cents per pound for the year, about 16 percent below prices in 2017. In 2019, turkey prices are expected to average $0.83 to $0.88 per pound. If realized, prices at the midpoint of the range would be 7 percent higher than in 2018.
Turkey Exports Stable in November November 2018 turkey exports were 2 percent lower than a year earlier, totaling 55 million pounds. Mexico accounted for 60 percent of all shipments with 33 million pounds shipped. Exports are expected
0
5,000
10,000
15,000
20,000
25,000
1 2 3 4 5 6 7 8 9 10 11
Shell eggs Egg products
Source: USDA, Economic Research Service calculations using data from U.S. Dept. of Commerce, Bureau of the Census
Shell-egg and egg product exports (shell-egg equivalent) - 2018
Dozen (1,000)
20 Livestock, Dairy, and Poultry Outlook, LDP-M-296, February 14, 2019
USDA, Economic Research Service
to total 606 million pounds in 2018, a 3-percent decrease from 2017. In 2019, turkey meat exports are expected to total 610 million pounds, a 1-percent increase from the 2018 forecast.
Suggested Citation Livestock, Dairy, and Poultry Outlook, LDP-M-296, U.S. Department of Agriculture, Economic Research Service, February 14, 2019.
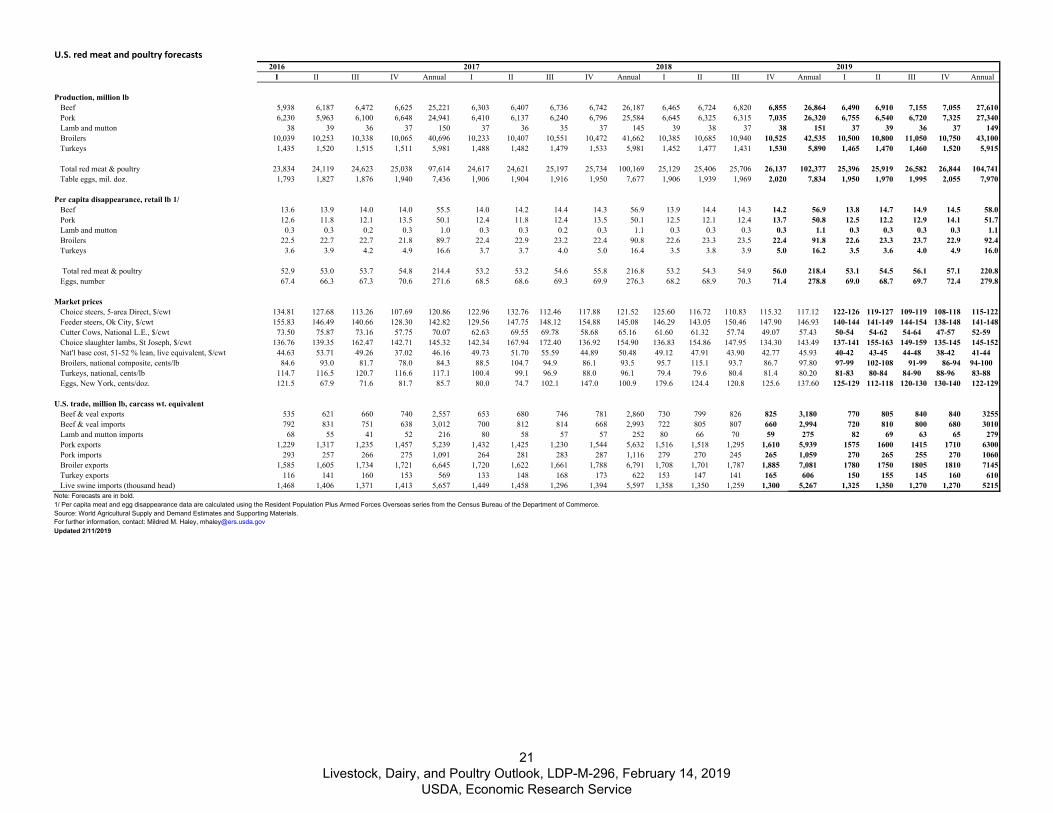
U.S. red meat and poultry forecasts2016 2017 2018 2019
I II III IV Annual I II III IV Annual I II III IV Annual I II III IV Annual
Production, million lb Beef 5,938 6,187 6,472 6,625 25,221 6,303 6,407 6,736 6,742 26,187 6,465 6,724 6,820 6,855 26,864 6,490 6,910 7,155 7,055 27,610 Pork 6,230 5,963 6,100 6,648 24,941 6,410 6,137 6,240 6,796 25,584 6,645 6,325 6,315 7,035 26,320 6,755 6,540 6,720 7,325 27,340 Lamb and mutton 38 39 36 37 150 37 36 35 37 145 39 38 37 38 151 37 39 36 37 149 Broilers 10,039 10,253 10,338 10,065 40,696 10,233 10,407 10,551 10,472 41,662 10,385 10,685 10,940 10,525 42,535 10,500 10,800 11,050 10,750 43,100 Turkeys 1,435 1,520 1,515 1,511 5,981 1,488 1,482 1,479 1,533 5,981 1,452 1,477 1,431 1,530 5,890 1,465 1,470 1,460 1,520 5,915
Total red meat & poultry 23,834 24,119 24,623 25,038 97,614 24,617 24,621 25,197 25,734 100,169 25,129 25,406 25,706 26,137 102,377 25,396 25,919 26,582 26,844 104,741 Table eggs, mil. doz. 1,793 1,827 1,876 1,940 7,436 1,906 1,904 1,916 1,950 7,677 1,906 1,939 1,969 2,020 7,834 1,950 1,970 1,995 2,055 7,970
Per capita disappearance, retail lb 1/ Beef 13.6 13.9 14.0 14.0 55.5 14.0 14.2 14.4 14.3 56.9 13.9 14.4 14.3 14.2 56.9 13.8 14.7 14.9 14.5 58.0 Pork 12.6 11.8 12.1 13.5 50.1 12.4 11.8 12.4 13.5 50.1 12.5 12.1 12.4 13.7 50.8 12.5 12.2 12.9 14.1 51.7 Lamb and mutton 0.3 0.3 0.2 0.3 1.0 0.3 0.3 0.2 0.3 1.1 0.3 0.3 0.3 0.3 1.1 0.3 0.3 0.3 0.3 1.1 Broilers 22.5 22.7 22.7 21.8 89.7 22.4 22.9 23.2 22.4 90.8 22.6 23.3 23.5 22.4 91.8 22.6 23.3 23.7 22.9 92.4 Turkeys 3.6 3.9 4.2 4.9 16.6 3.7 3.7 4.0 5.0 16.4 3.5 3.8 3.9 5.0 16.2 3.5 3.6 4.0 4.9 16.0
Total red meat & poultry 52.9 53.0 53.7 54.8 214.4 53.2 53.2 54.6 55.8 216.8 53.2 54.3 54.9 56.0 218.4 53.1 54.5 56.1 57.1 220.8 Eggs, number 67.4 66.3 67.3 70.6 271.6 68.5 68.6 69.3 69.9 276.3 68.2 68.9 70.3 71.4 278.8 69.0 68.7 69.7 72.4 279.8
Market prices Choice steers, 5-area Direct, $/cwt 134.81 127.68 113.26 107.69 120.86 122.96 132.76 112.46 117.88 121.52 125.60 116.72 110.83 115.32 117.12 122-126 119-127 109-119 108-118 115-122 Feeder steers, Ok City, $/cwt 155.83 146.49 140.66 128.30 142.82 129.56 147.75 148.12 154.88 145.08 146.29 143.05 150.46 147.90 146.93 140-144 141-149 144-154 138-148 141-148 Cutter Cows, National L.E., $/cwt 73.50 75.87 73.16 57.75 70.07 62.63 69.55 69.78 58.68 65.16 61.60 61.32 57.74 49.07 57.43 50-54 54-62 54-64 47-57 52-59 Choice slaughter lambs, St Joseph, $/cwt 136.76 139.35 162.47 142.71 145.32 142.34 167.94 172.40 136.92 154.90 136.83 154.86 147.95 134.30 143.49 137-141 155-163 149-159 135-145 145-152 Nat'l base cost, 51-52 % lean, live equivalent, $/cwt 44.63 53.71 49.26 37.02 46.16 49.73 51.70 55.59 44.89 50.48 49.12 47.91 43.90 42.77 45.93 40-42 43-45 44-48 38-42 41-44 Broilers, national composite, cents/lb 84.6 93.0 81.7 78.0 84.3 88.5 104.7 94.9 86.1 93.5 95.7 115.1 93.7 86.7 97.80 97-99 102-108 91-99 86-94 94-100 Turkeys, national, cents/lb 114.7 116.5 120.7 116.6 117.1 100.4 99.1 96.9 88.0 96.1 79.4 79.6 80.4 81.4 80.20 81-83 80-84 84-90 88-96 83-88 Eggs, New York, cents/doz. 121.5 67.9 71.6 81.7 85.7 80.0 74.7 102.1 147.0 100.9 179.6 124.4 120.8 125.6 137.60 125-129 112-118 120-130 130-140 122-129
U.S. trade, million lb, carcass wt. equivalent Beef & veal exports 535 621 660 740 2,557 653 680 746 781 2,860 730 799 826 825 3,180 770 805 840 840 3255 Beef & veal imports 792 831 751 638 3,012 700 812 814 668 2,993 722 805 807 660 2,994 720 810 800 680 3010 Lamb and mutton imports 68 55 41 52 216 80 58 57 57 252 80 66 70 59 275 82 69 63 65 279 Pork exports 1,229 1,317 1,235 1,457 5,239 1,432 1,425 1,230 1,544 5,632 1,516 1,518 1,295 1,610 5,939 1575 1600 1415 1710 6300 Pork imports 293 257 266 275 1,091 264 281 283 287 1,116 279 270 245 265 1,059 270 265 255 270 1060 Broiler exports 1,585 1,605 1,734 1,721 6,645 1,720 1,622 1,661 1,788 6,791 1,708 1,701 1,787 1,885 7,081 1780 1750 1805 1810 7145 Turkey exports 116 141 160 153 569 133 148 168 173 622 153 147 141 165 606 150 155 145 160 610 Live swine imports (thousand head) 1,468 1,406 1,371 1,413 5,657 1,449 1,458 1,296 1,394 5,597 1,358 1,350 1,259 1,300 5,267 1,325 1,350 1,270 1,270 5215Note: Forecasts are in bold.1/ Per capita meat and egg disappearance data are calculated using the Resident Population Plus Armed Forces Overseas series from the Census Bureau of the Department of Commerce.Source: World Agricultural Supply and Demand Estimates and Supporting Materials.For further information, contact: Mildred M. Haley, [email protected] 2/11/2019
21 Livestock, Dairy, and Poultry Outlook, LDP-M-296, February 14, 2019
USDA, Economic Research Service

Dairy Forecasts2017
Annual I II III IV Annual I II III IV Annual
Milk cows (thousands) 9,392 9,406 9,402 9,375 9,360 9,385 9,355 9,360 9,365 9,370 9,365Milk per cow (pounds) 22,941 5,780 5,936 5,756 5,710 23,180 5,845 6,035 5,820 5,805 23,505Milk production (billion pounds) 215.5 54.4 55.8 54.0 53.4 217.6 54.7 56.5 54.5 54.4 220.1Farm use 1.0 0.2 0.2 0.2 0.2 1.0 0.2 0.2 0.2 0.2 1.0Milk marketings 214.5 54.1 55.6 53.7 53.2 216.6 54.4 56.2 54.3 54.1 219.1
Milk-fat (billion pounds milk equiv.)Milk marketings 214.5 54.1 55.6 53.7 53.2 216.6 54.4 56.2 54.3 54.1 219.1Beginning commercial stocks 12.7 13.4 16.4 19.1 17.3 13.4 13.7 16.2 18.6 16.5 13.7Imports 6.0 1.2 1.6 1.7 1.8 6.3 1.4 1.5 1.7 2.0 6.6Total supply 233.2 68.8 73.5 74.5 72.3 236.4 69.5 74.0 74.5 72.6 239.4Commercial exports 9.2 2.4 3.0 2.6 2.6 10.6 2.5 2.8 2.6 2.4 10.3Ending commercial stocks 13.4 16.4 19.1 17.3 13.7 13.7 16.2 18.6 16.5 13.3 13.3Commodity Credit Corporation donations 0.0 0.0 0.0 0.0 0.0 0.0 0.1 0.1 0.0 0.0 0.3Domestic commercial use 210.5 50.0 51.5 54.6 56.0 212.1 50.7 52.4 55.4 56.9 215.5
Skim solids (billion pounds milk equiv.)Milk marketings 214.5 54.1 55.6 53.7 53.2 216.6 54.4 56.2 54.3 54.1 219.1Beginning commercial stocks 9.5 11.8 11.4 11.5 10.5 11.8 11.2 11.2 11.9 10.8 11.2Imports 6.1 1.4 1.4 1.3 1.4 5.5 1.3 1.2 1.3 1.4 5.2Total supply 230.1 67.3 68.4 66.5 65.1 233.9 67.0 68.7 67.4 66.3 235.5Commercial exports 40.7 11.5 12.5 10.9 9.9 44.8 10.8 11.7 11.0 11.0 44.6Ending commercial stocks 11.8 11.4 11.5 10.5 11.2 11.2 11.2 11.9 10.8 11.1 11.1Commodity Credit Corporation donations 0.0 0.0 0.0 0.0 0.0 0.0 0.1 0.1 0.0 0.0 0.2Domestic commercial use 177.6 44.4 44.3 45.1 44.1 177.9 44.9 45.0 45.6 44.2 179.6
Milk prices (dollars/cwt) 1 All milk 17.65 15.67 16.10 16.00 16.95 16.20 16.80 16.80 16.70 17.30 16.90
-17.05 -17.10 -17.40 -17.60 -18.30 -17.60
Class III 16.17 13.87 14.95 15.05 14.58 14.61 13.85 14.45 15.15 15.30 14.70-14.15 -15.05 -16.05 -16.30 -15.40
Class IV 15.16 13.01 14.32 14.53 15.05 14.23 15.60 15.65 15.55 15.45 15.55-16.00 -16.35 -16.55 -16.55 -16.35
Product prices (dollars/pound) 2Cheddar cheese 1.634 1.515 1.608 1.565 1.463 1.538 1.385 1.455 1.535 1.550 1.480
-1.415 -1.515 -1.625 -1.650 -1.550
Dry whey 0.444 0.260 0.280 0.369 0.459 0.342 0.455 0.435 0.425 0.425 0.435-0.475 -0.465 -0.455 -0.455 -0.465
Butter 2.330 2.161 2.320 2.284 2.264 2.257 2.230 2.235 2.230 2.215 2.230-2.290 -2.325 -2.350 -2.345 -2.330
Nonfat dry milk 0.867 0.700 0.774 0.816 0.887 0.795 0.960 0.965 0.955 0.955 0.955-0.990 -1.015 -1.025 -1.025 -1.015
Totals may not add due to rounding.1 Simple averages of monthly prices. May not match reported annual averages.
For further information, contact Jerry Cessna, 202-694-5171, [email protected], or contact Jonathan Law, 202-694-5544, [email protected] by USDA, Economic Research Service, in Livestock, Dairy, and Poultry Outlook.
20192018
2 Simple averages of monthly prices calculated by the Agricultural Marketing Service for use in class price formulas. Based on weekly U.S. Dept. of Agriculture, National Dairy Products Sales Report .
Sources: USDA: National Agricultural Statistics Service, Agricultural Marketing Service, Foreign Agricultural Service, and World Agricultural Outlook Board.
22 Livestock, Dairy, and Poultry Outlook, LDP-M-296, February 14, 2019
USDA, Economic Research Service


