www.dataself.com Confidential Information Page 1
LIST OF OUT-OF-THE-BOX
REPORTS, DASHBOARDS AND KPIs
Revision Date: 05/06/2014
Subject to change without notice.
We are in the process of converting our client-side out-of-the-box templates into DataSelf Analytics in-memory platform (powered by
Tableau OEM). The client-side solution has been greatly improved with better and faster data visualization and reporting
capabilities. Clients will be able to take advantage of the converted templates as we roll them out. Some modules may not be
available for a specific ERP or CRM system, please consult DataSelf for details.
www.dataself.com Confidential Information Page 2
Table of Contents
EXAMPLES OF OUT-OF-THE-BOX DASHBOARDS ............................................................................................................ 2
LIST OF OUT-OF-THE-BOX REPORTS, DASHBOARDS AND KPIs – v1010 ......................................................................... 8
EXAMPLES OF OUT-OF-THE-BOX DASHBOARDS
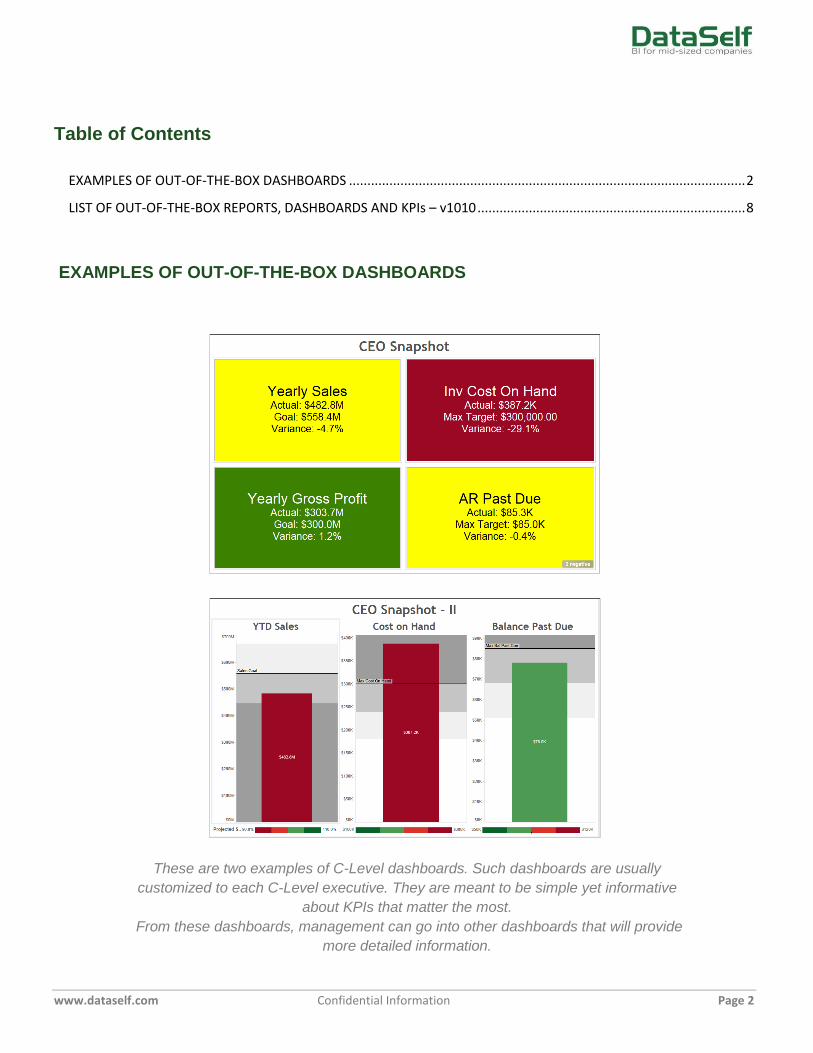
These are two examples of C-Level dashboards. Such dashboards are usually
customized to each C-Level executive. They are meant to be simple yet informative
about KPIs that matter the most.
From these dashboards, management can go into other dashboards that will provide
more detailed information.
www.dataself.com Confidential Information Page 3
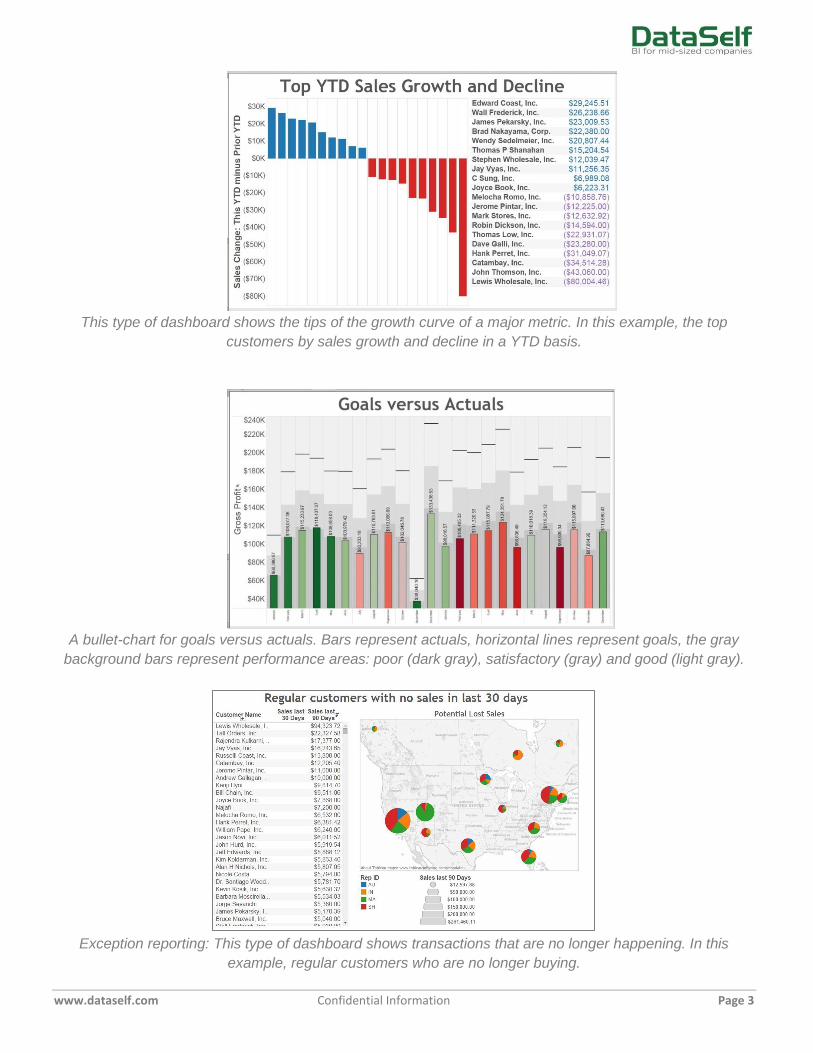
This type of dashboard shows the tips of the growth curve of a major metric. In this example, the top
customers by sales growth and decline in a YTD basis.
A bullet-chart for goals versus actuals. Bars represent actuals, horizontal lines represent goals, the gray
background bars represent performance areas: poor (dark gray), satisfactory (gray) and good (light gray).
Exception reporting: This type of dashboard shows transactions that are no longer happening. In this
example, regular customers who are no longer buying.
www.dataself.com Confidential Information Page 4
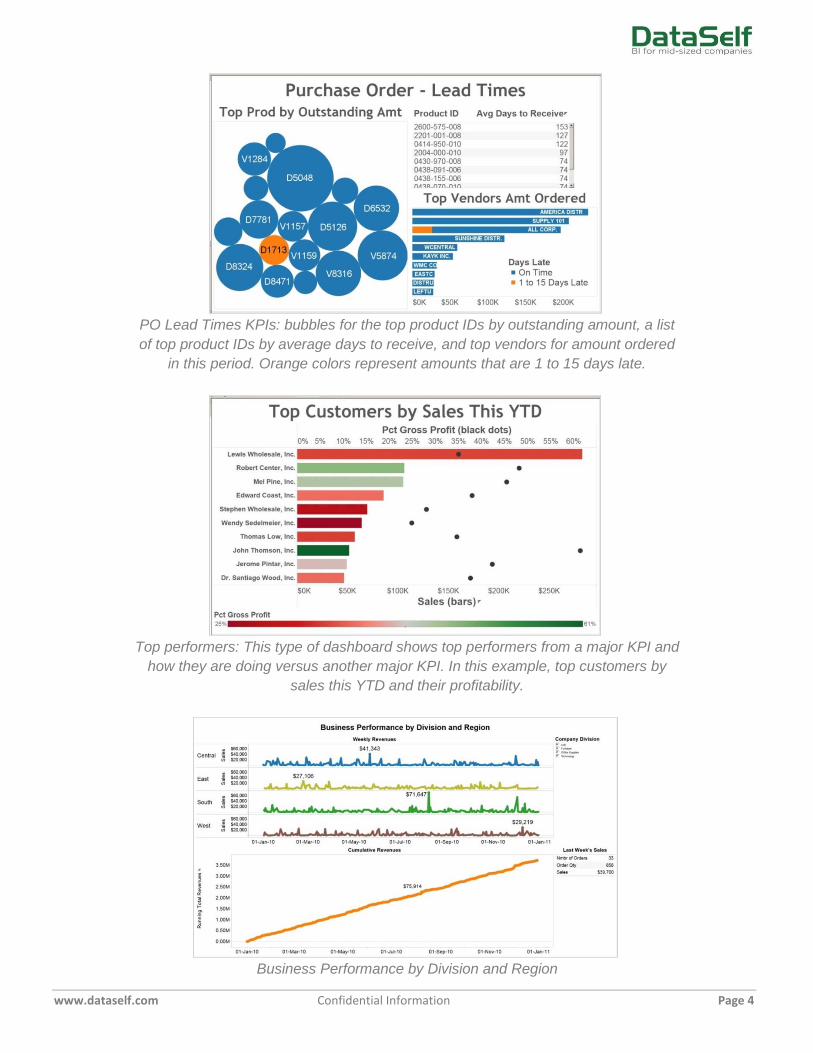
PO Lead Times KPIs: bubbles for the top product IDs by outstanding amount, a list
of top product IDs by average days to receive, and top vendors for amount ordered
in this period. Orange colors represent amounts that are 1 to 15 days late.
Top performers: This type of dashboard shows top performers from a major KPI and
how they are doing versus another major KPI. In this example, top customers by
sales this YTD and their profitability.
Business Performance by Division and Region
www.dataself.com Confidential Information Page 5
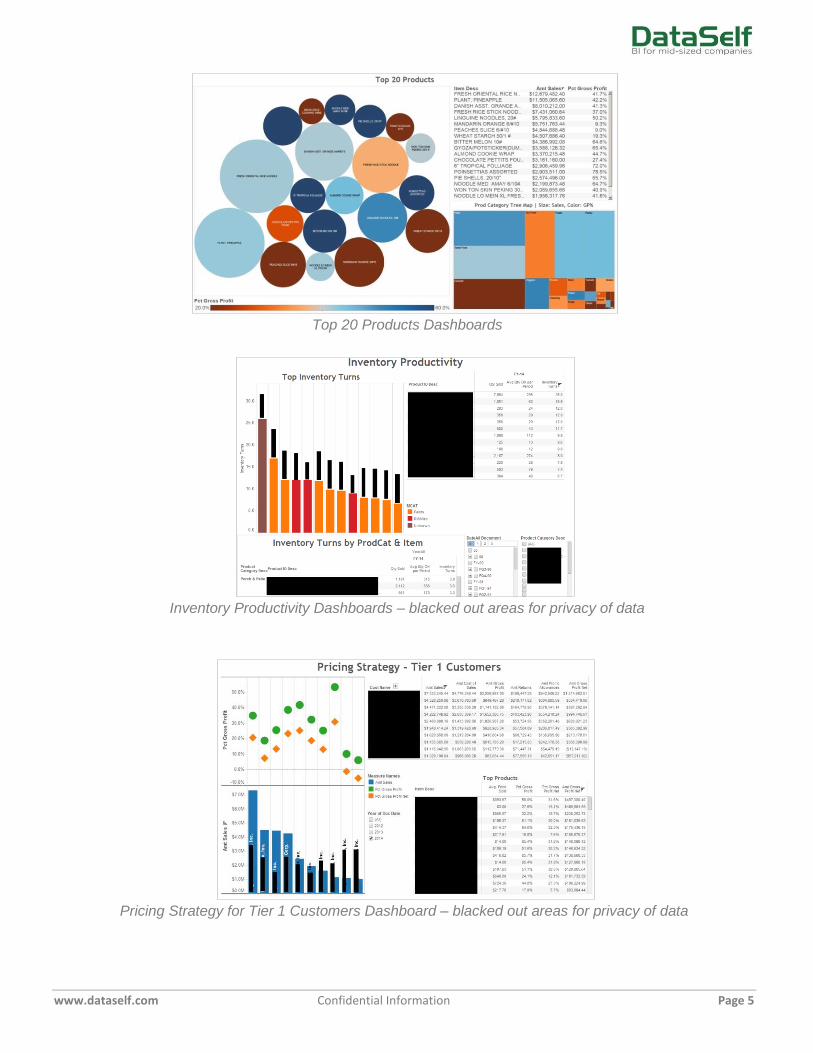
Top 20 Products Dashboards
Inventory Productivity Dashboards – blacked out areas for privacy of data
Pricing Strategy for Tier 1 Customers Dashboard – blacked out areas for privacy of data
www.dataself.com Confidential Information Page 6
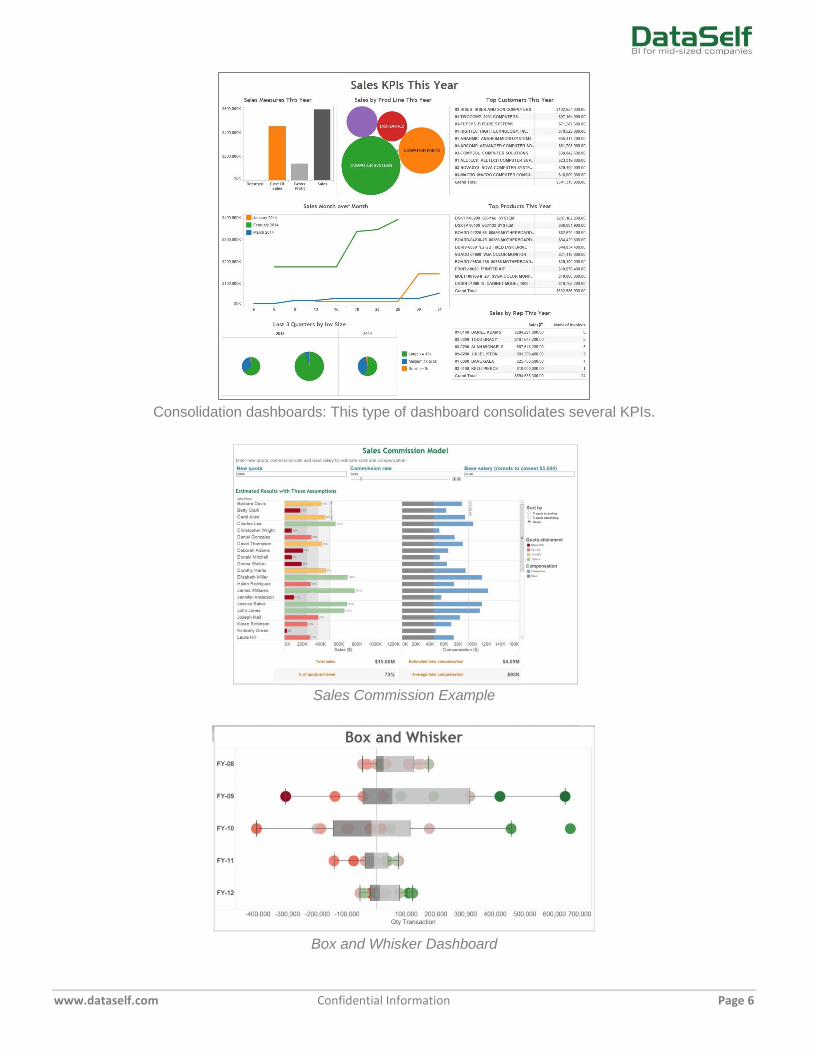
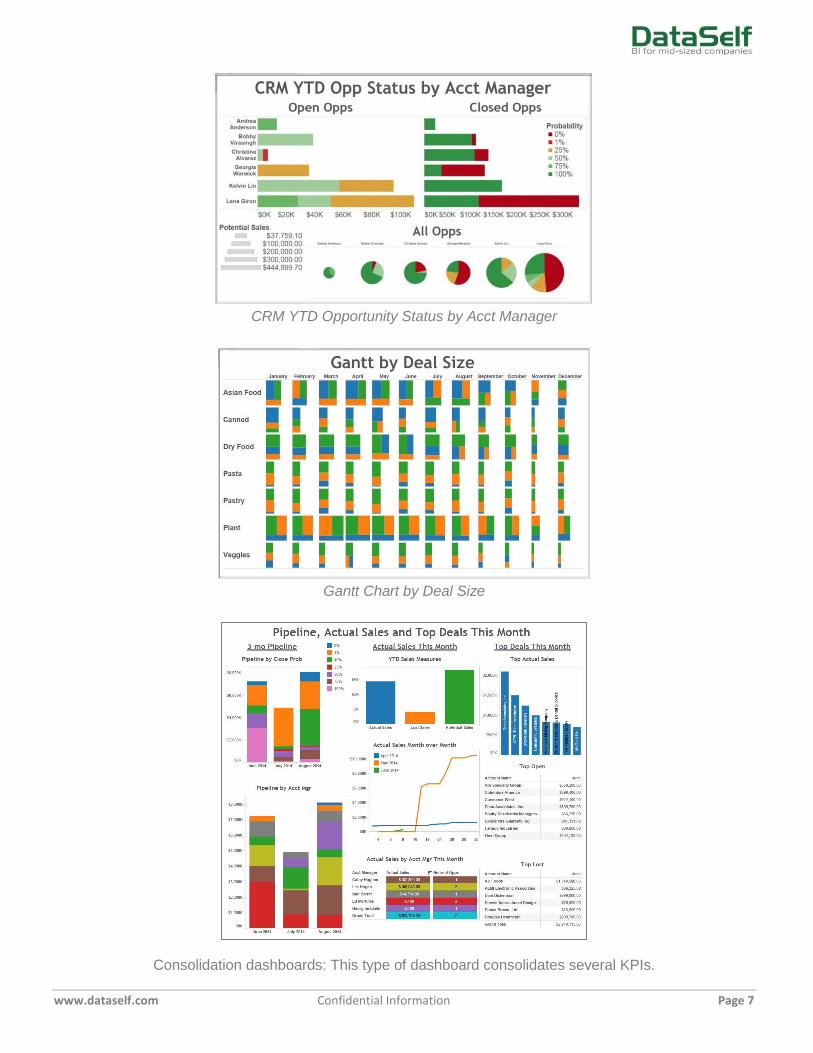
Consolidation dashboards: This type of dashboard consolidates several KPIs.
Sales Commission Example
Box and Whisker Dashboard
www.dataself.com Confidential Information Page 7
CRM YTD Opportunity Status by Acct Manager
Gantt Chart by Deal Size
Consolidation dashboards: This type of dashboard consolidates several KPIs.
www.dataself.com Confidential Information Page 8
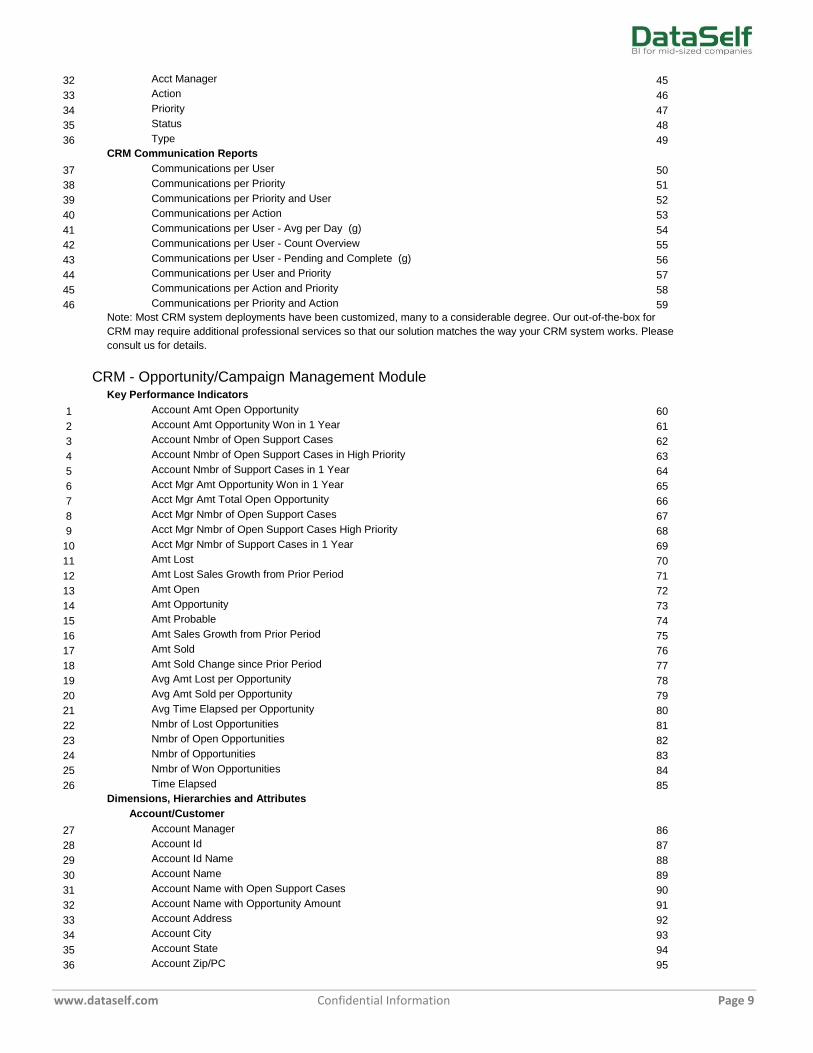
LIST OF OUT-OF-THE-BOX REPORTS, DASHBOARDS AND KPIs – v1010
Cash Flow Module
This module factors today's cash, receivables, payables, recurring revenues and expenses, and allows you to make
adjustments as needed. You can see the information in any granularity down to customer, vendor and days.
Example of Key Performance Indicators
1 Amt Available Today 1
2 Amt Available Projected 2
3 Amt Outstanding Payments 3
4 Amt Outstanding Receits 4
Example of Dimensions, Hierarchies and Attributes
5 Bank Account 5
6 Customer 6
7 Expected Date 7
8 GL Account 8
9 Vendor 9
Example of Cash Flow Reports
10 Cash Flow Forecast by GL Account 10
11 Cash Flow Forecast by Bank Account 11
12 Cash Flow Forecast with Customer and Vendor Info 12
13 Cash Flow Overview 13
CRM - Communications Module
Key Performance Indicators
1 Nmbr of Communications 14
2 Nmbr of Complete Communications 15
3 Nmbr of Pending Communications 16
4 Pct Complete Communications 17
5 Pct of Team's Communications 18
6 Avg Nmbr of Communications per Day 19
Dimensions, Hierarchies and Attributes
Communication Date
7 a Season 20
8 a Date 21
9 a Day of Period 22
10 a Day of Quarter 23
11 a Day of Week 24
12 a Day of Year 25
13 a Period 26
14 a Period Name 27
15 a Quarter 28
16 a Quarter Name 29
17 a Week 30
18 a Week of Year 31
19 a Year 32
20 Date 33
21 Period 34
22 Quarter 35
23 Rolling Half Year 36
24 Rolling Month 37
25 Rolling Quarter 38
26 Rolling Week 39
27 Rolling Year 40
28 td Period 41
29 td Quarter 42
30 td Year 43
31 Year 44
CRM Communication
www.dataself.com Confidential Information Page 9
32 Acct Manager 45
33 Action 46
34 Priority 47
35 Status 48
36 Type 49
CRM Communication Reports
37 Communications per User 50
38 Communications per Priority 51
39 Communications per Priority and User 52
40 Communications per Action 53
41 Communications per User - Avg per Day (g) 54
42 Communications per User - Count Overview 55
43 Communications per User - Pending and Complete (g) 56
44 Communications per User and Priority 57
45 Communications per Action and Priority 58
46 Communications per Priority and Action 59
Note: Most CRM system deployments have been customized, many to a considerable degree. Our out-of-the-box for
CRM may require additional professional services so that our solution matches the way your CRM system works. Please
consult us for details.
CRM - Opportunity/Campaign Management Module
Key Performance Indicators
1 Account Amt Open Opportunity 60
2 Account Amt Opportunity Won in 1 Year 61
3 Account Nmbr of Open Support Cases 62
4 Account Nmbr of Open Support Cases in High Priority 63
5 Account Nmbr of Support Cases in 1 Year 64
6 Acct Mgr Amt Opportunity Won in 1 Year 65
7 Acct Mgr Amt Total Open Opportunity 66
8 Acct Mgr Nmbr of Open Support Cases 67
9 Acct Mgr Nmbr of Open Support Cases High Priority 68
10 Acct Mgr Nmbr of Support Cases in 1 Year 69
11 Amt Lost 70
12 Amt Lost Sales Growth from Prior Period 71
13 Amt Open 72
14 Amt Opportunity 73
15 Amt Probable 74
16 Amt Sales Growth from Prior Period 75
17 Amt Sold 76
18 Amt Sold Change since Prior Period 77
19 Avg Amt Lost per Opportunity 78
20 Avg Amt Sold per Opportunity 79
21 Avg Time Elapsed per Opportunity 80
22 Nmbr of Lost Opportunities 81
23 Nmbr of Open Opportunities 82
24 Nmbr of Opportunities 83
25 Nmbr of Won Opportunities 84
26 Time Elapsed 85
Dimensions, Hierarchies and Attributes
Account/Customer
27 Account Manager 86
28 Account Id 87
29 Account Id Name 88
30 Account Name 89
31 Account Name with Open Support Cases 90
32 Account Name with Opportunity Amount 91
33 Account Address 92
34 Account City 93
35 Account State 94
36 Account Zip/PC 95
www.dataself.com Confidential Information Page 10
37 Account Country 96
38 Account Type 97
39 Territory 98
Account Manager
40 Account Manager Id 99
41 Account Manager Id Name 100
42 Account Manager Name 101
43 Account Manager Name with Open Support Cases 102
44 Account Manager Name with Opportunity Amount 103
45 Territory 104
46 Title 105
Campaign
47 Campaign Description 106
48 Campaign Id 107
49 Campaign Id Description 108
CRM Opportunity Details
50 Acct Manager 109
51 Close Probability 110
52 Decision Timeframe 111
53 Department 112
54 Lear Source 113
55 Opportunity Description 114
56 Opportunity Id 115
57 Priority 116
58 Product 117
59 Sales Cycle State 118
60 Status 119
61 Type 120
Close Date
62 a Season 121
63 a Date 122
64 a Day of Period 123
65 a Day of Quarter 124
66 a Day of Week 125
67 a Day of Year 126
68 a Period 127
69 a Period Name 128
70 a Quarter 129
71 a Quarter Name 130
72 a Week 131
73 a Week of Year 132
74 a Year 133
75 Date 134
76 Period 135
77 Quarter 136
78 Rolling Half Year 137
79 Rolling Month 138
80 Rolling Quarter 139
81 Rolling Week 140
82 Rolling Year 141
83 td Period 142
84 td Quarter 143
85 td Year 144
86 Year 145
Document Date
87 a Season 146
88 a Date 147
89 a Day of Period 148
90 a Day of Quarter 149
91 a Day of Week 150
www.dataself.com Confidential Information Page 11
92 a Day of Year 151
93 a Period 152
94 a Period Name 153
95 a Quarter 154
96 a Quarter Name 155
97 a Week 156
98 a Week of Year 157
99 a Year 158
100 Date 159
101 Period 160
102 Quarter 161
103 Rolling Half Year 162
104 Rolling Month 163
105 Rolling Quarter 164
106 Rolling Week 165
107 Rolling Year 166
108 td Period 167
109 td Quarter 168
110 td Year 169
111 Year 170
Target Close Date
112 a Season 171
113 a Date 172
114 a Day of Period 173
115 a Day of Quarter 174
116 a Day of Week 175
117 a Day of Year 176
118 a Period 177
119 a Period Name 178
120 a Quarter 179
121 a Quarter Name 180
122 a Week 181
123 a Week of Year 182
124 a Year 183
125 Date 184
126 Period 185
127 Quarter 186
128 Rolling Half Year 187
129 Rolling Month 188
130 Rolling Quarter 189
131 Rolling Week 190
132 Rolling Year 191
133 td Period 192
134 td Quarter 193
135 td Year 194
136 Year 195
Reports by Acct Manager
137 Average Time Elapsed per Opportunity by Acct Mgr 196
138 Acct Mgr Overview - Opport & Cases (g) 197
139 Acct Mgr Overview - All Opportunities 198
140 Acct Mgr Overview - Top Open Amts 199
141 Open Amt by Acct Mgr and Close Probability 200
142 Open Amt by Acct Mgr and Decision Frame 201
143 Open Amt & Open Opport Count by Acct Mgr (g) 202
144 Open Amt & Open SuppCases Count by Acct Mgr (g) 203
145 Open and Probable Amt by Acct Mgr 204
146 Open and Probable Amt by Department (g) 205
147 Opportunities by Account Sliced by Acct Mgr 206
148 Opportunity Categorization by Acct Mgr - Stacked (g) 207
149 Opportunity Count by Acct Mgr 208
www.dataself.com Confidential Information Page 12
150 Probable Amt and Open Opport Count by Acct Mgr 209
151 Sales, Open and Probable Amt by Acct Mgr 210
152 Sales by Acct Mgr 211
153 Sales Forecast by Close Date and Acct Mgr 212
154 Territory Pie Chart by Opport Amt (g) 213
155 Top Acct Mgr by Sales (g) 214
156 Top Acct Mgr by Open Amt (g) 215
157 Top Acct Mgr by Lost Amt (g) 216
158 Top Acct Mgr by Probable Amt (g) 217
159 Top Acct Mgr by Sales Growth in a Period (g) 218
160 Top Acct Mgr by Sales Decline in a Period (g) 219
161 Top Acct Mgr by Lost Sales Growth in a Period (g) 220
162 Top Acct Mgr by Lost Sales Decline in a Period (g) 221
163 Win vs. Loss by Acct Manager (g) 222
164 Win vs. Loss by Territory (g) 223
165 Win vs. Loss by Department (g) 224
Reports by Account/Customer
166 Average Time Elapsed per Opportunity by Account 225
167 Account Overview - Opport & Cases (g) 226
168 Account Overview - All Opportunities 227
169 Account Overview - Top Open Amts 228
170 Open Amt & Open Opport Count by Account 229
171 Open Amt by Account and Close Probability 230
172 Open Amt by Account and Decision Frame 231
173 Open and Probable Amt by Account w/ OpenSuppCases 232
174 Open and Probable Amt by Account Type (g) 233
175 Open and Probable by Account + Cases 234
176 Opportunity Count by Account w/ OpenSuppCases 235
177 Probable Amt by Account w/ OpenSuppCases 236
178 Probable Amt by Account + Support Cases 237
179 Sales, Open and Probable Amt by Account w/ OpenSuppCases 238
180 Sales by Account 239
181 Sales by Account Region 240
182 Sales Forecast by Close Date and Account w/ OpenSuppCases 241
183 Top Accounts by Sales (g) 242
184 Top Accounts by Open Amt (w/ OpenSuppCases) (g) 243
185 Top Accounts by Lost Amt (w/ OpenSuppCases) (g) 244
186 Top Accounts by Probable Amt + Support Cases (g) 245
187 Top Accounts by Sales Growth in a Period (g) 246
188 Top Accounts by Sales Decline in a Period (g) 247
189 Top Accounts by Lost Sales Growth in a Period (g) 248
190 Top Accounts by Lost Sales Decline in a Period (g) 249
191 Win vs. Loss by Account Type (g) 250
192 Win vs. Loss by Account (g) 251
193 Win vs. Loss by Account Region (g) 252
Reports by Campaign
194 Average Time Elapsed per Opportunity by Campaign 253
195 Campaign Overview - Opport & Cases (g) 254
196 Campaign Overview - All Opportunities 255
197 Campaign Overview - Top Open Amts 256
198 Open Amt by Campaign and Close Probability 257
199 Open Amt by Campaign and Decision Frame 258
200 Open Amt & Open Opport Count by Campaign (g) 259
201 Open Amt & Open SuppCases Count by Campaign (g) 260
202 Open and Probable Amt by Campaign 261
203 Open and Probable Amt by Department (g) 262
204 Opportunities by Account Sliced by Campaign 263
205 Opportunity Categorization by Campaign - Stacked (g) 264
206 Opportunity Count by Campaign 265
207 Probable Amt and Open Opport Count by Campaign 266
www.dataself.com Confidential Information Page 13
208 Sales, Open and Probable Amt by Campaign 267
209 Sales by Campaign 268
210 Sales Forecast by Close Date and Campaign 269
211 Territory Pie Chart by Opport Amt (g) 270
212 Top Campaign by Sales (g) 271
213 Top Campaign by Open Amt (g) 272
214 Top Campaign by Lost Amt (g) 273
215 Top Campaign by Probable Amt (g) 274
216 Top Campaign by Sales Growth in a Period (g) 275
217 Top Campaign by Sales Decline in a Period (g) 276
218 Top Campaign by Lost Sales Growth in a Period (g) 277
219 Top Campaign by Lost Sales Decline in a Period (g) 278
220 Win vs. Loss by Campaign (g) 279
Misc Reports
221 Lead Source Pie Chart (g) 280
222 Opportunity Type Pie Chart (g) 281
223 Product Pie Chart (g) 282
224 Sales Cycle Pie Chart (g) 283
225 Sales Forecast by Close Date (g) 284
226 Win vs. Loss by Close Date (g) 285
227 Win vs. Loss by Opport Type (g) 286
228 Win vs. Loss by Lead Source (g) 287
Reports by Account Region
229 Account Region Overview (g) 288
230 Open Amt by Account Region and Close Probability 289
231 Open Amt by Account Region and Decision Frame 290
232 Open and Probable Amt by Account Region 291
233 Opportunity Categorization by Account Region - Stacked (g) 292
234 Opportunity Count by Account Region 293
235 Probable Amt by Account Region 294
236 Sales, Open and Probable Amt by Account Region 295
237 Sales by Account Region (g) 296
238 Sales Forecast by Close Date and Account Region 297
239 Top Account Regions by Sales (g) 298
240 Top Account Regions by Open Amt (g) 299
241 Top Account Regions by Lost Amt (g) 300
242 Top Account Regions by Probable Amt (g) 301
243 Win vs. Loss by Account Region (g) 302
Reports by Product
244 Product Overview - All Opportunities 303
245 Product Overview - Top Open Amts 304
246 Open Amt by Product and Close Probability 305
247 Open Amt by Product and Decision Frame 306
248 Open Amt & Open Opport Count by Product 307
249 Open and Probable Amt by Product 308
250 Sales, Open and Probable Amt by Product 309
251 Sales by Product 310
252 Sales Forecast by Close Date and Product 311
253 Top Products by Lost Amt (g) 312
254 Top Product by Open Amt (g) 313
255 Top Product by Sales (g) 314
256 Win vs. Loss by Product (g) 315
Note: Most CRM system deployments have been customized, many to a considerable degree. Our out-of-the-box for
CRM may require additional professional services so that our solution matches the way your CRM system works. Please
consult us for details.
CRM - Technical Support Module
Key Performance Indicators
1 Account Amt Open Opportunity 316
2 Account Amt Opportunity Won in 1 Year 317
www.dataself.com Confidential Information Page 14
3 Avg Resolution Time 318
4 Nmbr of 1st Call Resolutions 319
5 Nmbr of Case Steps 320
6 Nmbr of Cases 321
7 Nmbr of Closed Cases 322
8 Nmbr of Open Cases 323
9 Pct of 1st Call Resolutions 324
10 Pct Closed Cases 325
11 Pct Open Cases 326
12 Nmbr of Cases Growth from Prior Period 327
13 SupportRep Amt Total Open Opportunity 328
14 SupportRep Amt Total Opportunity Won in 1 Year 329
15 Time Elapsed 330
Dimensions, Hierarchies and Attributes
Close Date
16 a Season 331
17 a Date 332
18 a Day of Period 333
19 a Day of Quarter 334
20 a Day of Week 335
21 a Day of Year 336
22 a Period 337
23 a Period Name 338
24 a Quarter 339
25 a Quarter Name 340
26 a Week 341
27 a Week of Year 342
28 a Year 343
29 Date 344
30 Period 345
31 Quarter 346
32 Rolling Half Year 347
33 Rolling Month 348
34 Rolling Quarter 349
35 Rolling Week 350
36 Rolling Year 351
37 td Period 352
38 td Quarter 353
39 td Year 354
40 Year 355
Document Date
41 a Season 356
42 a Date 357
43 a Day of Period 358
44 a Day of Quarter 359
45 a Day of Week 360
46 a Day of Year 361
47 a Period 362
48 a Period Name 363
49 a Quarter 364
50 a Quarter Name 365
51 a Week 366
52 a Week of Year 367
53 a Year 368
54 Date 369
55 Period 370
56 Quarter 371
57 Rolling Half Year 372
58 Rolling Month 373
59 Rolling Quarter 374
www.dataself.com Confidential Information Page 15
60 Rolling Week 375
61 Rolling Year 376
62 td Period 377
63 td Quarter 378
64 td Year 379
65 Year 380
Target Close Date
66 a Season 381
67 a Date 382
68 a Day of Period 383
69 a Day of Quarter 384
70 a Day of Week 385
71 a Day of Year 386
72 a Period 387
73 a Period Name 388
74 a Quarter 389
75 a Quarter Name 390
76 a Week 391
77 a Week of Year 392
78 a Year 393
79 Date 394
80 Period 395
81 Quarter 396
82 Rolling Half Year 397
83 Rolling Month 398
84 Rolling Quarter 399
85 Rolling Week 400
86 Rolling Year 401
87 td Period 402
88 td Quarter 403
89 td Year 404
90 Year 405
Account/Customer
91 Account Manager 406
92 Account Id 407
93 Account Id Name 408
94 Account Name 409
95 Account Name with Open Support Cases 410
96 Account Name with Opportunity Amount 411
97 Account Address 412
98 Account City 413
99 Account State 414
100 Account Zip/PC 415
101 Account Country 416
102 Account Type 417
103 Territory 418
CRM Support Case Details
104 Case Description 419
105 Case Id 420
106 Priority 421
107 Problem Type 422
108 Solution Type 423
109 Stage 424
110 Status 425
111 Support Rep 426
Support Rep
112 Department 427
113 Support Rep with Open Support Cases 428
114 Support Rep with Opportunity Amt 429
115 Support Rep Name 430
www.dataself.com Confidential Information Page 16
116 Territory 431
117 Title 432
Reports by Account/Customer
118 Avg Resolution Time by Account Region (g) 433
119 Case Count Change by Account Region by Period (g) 434
120 Case Count Change by Account Type by Period (g) 435
121 Cases Overview by Account w/ OppAmt 436
122 Cases Overview by Account w/ OppAmt and Problem Type 437
123 Cases Overview by Account Region - Bars (g) 438
124 Cases Overview by Account Region - Stacked (g) 439
125 Cases Overview by Account Type - Bars (g) 440
126 Cases Overview by Account Type - Stacked (g) 441
127 Historic Cases and Resolution Time sliced by Account Region (g) 442
128 Historic Case Count by Account Type and Period (g) 443
129 Open Cases by Account w/ OppAmt 444
130 Open Cases by Account w/ OppAmt and Case Stage 445
Misc Reports
131 Historic Case Count & Avg Resolution Time by Period (g) 446
132 Cases by Stage by Year - Stacked (g) 447
Reports by Problem Type
133 Avg Resolution Time by Problem Type (g) 448
134 Cases by Problem and Solution Type 449
135 Case Count Change by Problem Type by Period (g) 450
136 Cases Overview by Problem Type - Bars (g) 451
137 Cases Overview by Problem Type - Stacked (g) 452
138 Cases Overview by Problem Type and SuppRep 453
139 Historic 1st Call Resolution Count by Problem Type and Period (g) 454
140 Historic Avg Resolution Time by Problem Type - Horizontal (g) 455
141 Historic Avg Resolution Time by Problem Type - Vertical (g) 456
142 Historic Cases and Resolution Time sliced by Problem Type (g) 457
143 Historic Case Count & Avg Resolution Time by Problem Type (g) 458
144 Historic Case Count by Problem Type and Period (g) 459
145 Open and Closed Cases by Problem Type 460
146 Performance by Problem Type (g) 461
147 Performance Map: Case Count and Pct Closed by Problem Type (g) 462
148 Performance Map: Case Count and Avg Resolution Time by Problem Type (g) 463
Reports by Support Rep
149 Avg Resolution Time by SuppRep (g) 464
150 Count Case and Avg Resolution Time by SuppRep (g) 465
151 Case Count Change by SuppRep by Period (g) 466
152 Cases Overview by SuppRep - Bars (g) 467
153 Cases Overview by SuppRep - Stacked (g) 468
154 Cases Overview by Problem Type and Account w/ OppAmt 469
155 Cases Overview by SuppRep and Problem Type 470
156 Historic 1st Call Resolution Count by SuppRep and Period (g) 471
157 Historic Avg Resolution Time by SuppRep (g) 472
158 Historic Case Count by SuppRep and Period (g) 473
159 Historic Cases and Resolution Time sliced by SuppRep (g) 474
160 Open and Closed Cases by SuppRep (g) 475
161 Open Cases by SuppRep, Account w/ OppAmt, and Case Stage 476
162 Open Cases by SuppRep, Account w/ OppAmt, and Problem Type 477
163 Open Cases by SuppRep, Account w/ OppAmt, and Priority 478
164 Performance by SuppRep 479
165 Performance Map: Case Count and Avg Resolution Time by SuppRep (g) 480
166 Performance Map: Case Count and Pct Closed by SuppRep (g) 481
Note: Most CRM system deployments have been customized, many to a considerable degree. Our out-of-the-box for
CRM may require additional professional services so that our solution matches the way your CRM system works. Please
consult us for details.
DataSelf BI BAM (Alerts) Module
www.dataself.com Confidential Information Page 17
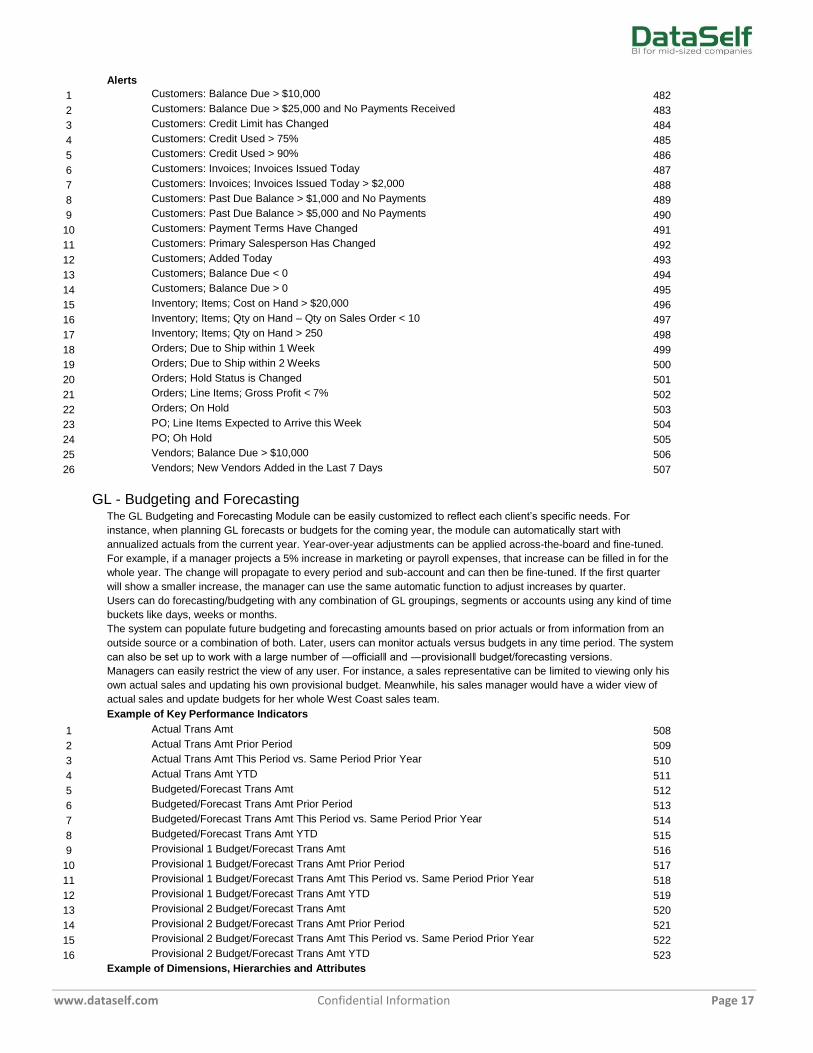
Alerts
1 Customers: Balance Due > $10,000 482
2 Customers: Balance Due > $25,000 and No Payments Received 483
3 Customers: Credit Limit has Changed 484
4 Customers: Credit Used > 75% 485
5 Customers: Credit Used > 90% 486
6 Customers: Invoices; Invoices Issued Today 487
7 Customers: Invoices; Invoices Issued Today > $2,000 488
8 Customers: Past Due Balance > $1,000 and No Payments 489
9 Customers: Past Due Balance > $5,000 and No Payments 490
10 Customers: Payment Terms Have Changed 491
11 Customers: Primary Salesperson Has Changed 492
12 Customers; Added Today 493
13 Customers; Balance Due < 0 494
14 Customers; Balance Due > 0 495
15 Inventory; Items; Cost on Hand > $20,000 496
16 Inventory; Items; Qty on Hand – Qty on Sales Order < 10 497
17 Inventory; Items; Qty on Hand > 250 498
18 Orders; Due to Ship within 1 Week 499
19 Orders; Due to Ship within 2 Weeks 500
20 Orders; Hold Status is Changed 501
21 Orders; Line Items; Gross Profit < 7% 502
22 Orders; On Hold 503
23 PO; Line Items Expected to Arrive this Week 504
24 PO; Oh Hold 505
25 Vendors; Balance Due > $10,000 506
26 Vendors; New Vendors Added in the Last 7 Days 507
GL - Budgeting and Forecasting
The GL Budgeting and Forecasting Module can be easily customized to reflect each client’s specific needs. For
instance, when planning GL forecasts or budgets for the coming year, the module can automatically start with
annualized actuals from the current year. Year-over-year adjustments can be applied across-the-board and fine-tuned.
For example, if a manager projects a 5% increase in marketing or payroll expenses, that increase can be filled in for the
whole year. The change will propagate to every period and sub-account and can then be fine-tuned. If the first quarter
will show a smaller increase, the manager can use the same automatic function to adjust increases by quarter.
Users can do forecasting/budgeting with any combination of GL groupings, segments or accounts using any kind of time
buckets like days, weeks or months.
The system can populate future budgeting and forecasting amounts based on prior actuals or from information from an
outside source or a combination of both. Later, users can monitor actuals versus budgets in any time period. The system
can also be set up to work with a large number of ―official‖ and ―provisional‖ budget/forecasting versions.
Managers can easily restrict the view of any user. For instance, a sales representative can be limited to viewing only his
own actual sales and updating his own provisional budget. Meanwhile, his sales manager would have a wider view of
actual sales and update budgets for her whole West Coast sales team.
Example of Key Performance Indicators
1 Actual Trans Amt 508
2 Actual Trans Amt Prior Period 509
3 Actual Trans Amt This Period vs. Same Period Prior Year 510
4 Actual Trans Amt YTD 511
5 Budgeted/Forecast Trans Amt 512
6 Budgeted/Forecast Trans Amt Prior Period 513
7 Budgeted/Forecast Trans Amt This Period vs. Same Period Prior Year 514
8 Budgeted/Forecast Trans Amt YTD 515
9 Provisional 1 Budget/Forecast Trans Amt 516
10 Provisional 1 Budget/Forecast Trans Amt Prior Period 517
11 Provisional 1 Budget/Forecast Trans Amt This Period vs. Same Period Prior Year 518
12 Provisional 1 Budget/Forecast Trans Amt YTD 519
13 Provisional 2 Budget/Forecast Trans Amt 520
14 Provisional 2 Budget/Forecast Trans Amt Prior Period 521
15 Provisional 2 Budget/Forecast Trans Amt This Period vs. Same Period Prior Year 522
16 Provisional 2 Budget/Forecast Trans Amt YTD 523
Example of Dimensions, Hierarchies and Attributes
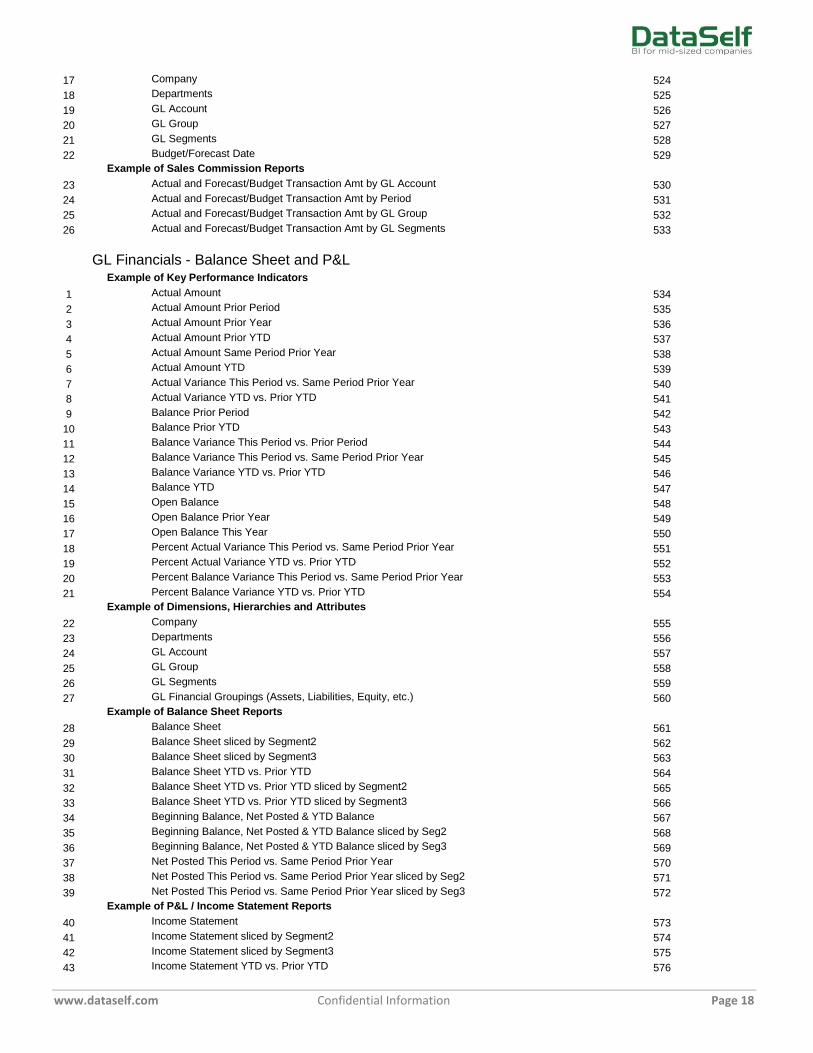
www.dataself.com Confidential Information Page 18
17 Company 524
18 Departments 525
19 GL Account 526
20 GL Group 527
21 GL Segments 528
22 Budget/Forecast Date 529
Example of Sales Commission Reports
23 Actual and Forecast/Budget Transaction Amt by GL Account 530
24 Actual and Forecast/Budget Transaction Amt by Period 531
25 Actual and Forecast/Budget Transaction Amt by GL Group 532
26 Actual and Forecast/Budget Transaction Amt by GL Segments 533
GL Financials - Balance Sheet and P&L
Example of Key Performance Indicators
1 Actual Amount 534
2 Actual Amount Prior Period 535
3 Actual Amount Prior Year 536
4 Actual Amount Prior YTD 537
5 Actual Amount Same Period Prior Year 538
6 Actual Amount YTD 539
7 Actual Variance This Period vs. Same Period Prior Year 540
8 Actual Variance YTD vs. Prior YTD 541
9 Balance Prior Period 542
10 Balance Prior YTD 543
11 Balance Variance This Period vs. Prior Period 544
12 Balance Variance This Period vs. Same Period Prior Year 545
13 Balance Variance YTD vs. Prior YTD 546
14 Balance YTD 547
15 Open Balance 548
16 Open Balance Prior Year 549
17 Open Balance This Year 550
18 Percent Actual Variance This Period vs. Same Period Prior Year 551
19 Percent Actual Variance YTD vs. Prior YTD 552
20 Percent Balance Variance This Period vs. Same Period Prior Year 553
21 Percent Balance Variance YTD vs. Prior YTD 554
Example of Dimensions, Hierarchies and Attributes
22 Company 555
23 Departments 556
24 GL Account 557
25 GL Group 558
26 GL Segments 559
27 GL Financial Groupings (Assets, Liabilities, Equity, etc.) 560
Example of Balance Sheet Reports
28 Balance Sheet 561
29 Balance Sheet sliced by Segment2 562
30 Balance Sheet sliced by Segment3 563
31 Balance Sheet YTD vs. Prior YTD 564
32 Balance Sheet YTD vs. Prior YTD sliced by Segment2 565
33 Balance Sheet YTD vs. Prior YTD sliced by Segment3 566
34 Beginning Balance, Net Posted & YTD Balance 567
35 Beginning Balance, Net Posted & YTD Balance sliced by Seg2 568
36 Beginning Balance, Net Posted & YTD Balance sliced by Seg3 569
37 Net Posted This Period vs. Same Period Prior Year 570
38 Net Posted This Period vs. Same Period Prior Year sliced by Seg2 571
39 Net Posted This Period vs. Same Period Prior Year sliced by Seg3 572
Example of P&L / Income Statement Reports
40 Income Statement 573
41 Income Statement sliced by Segment2 574
42 Income Statement sliced by Segment3 575
43 Income Statement YTD vs. Prior YTD 576
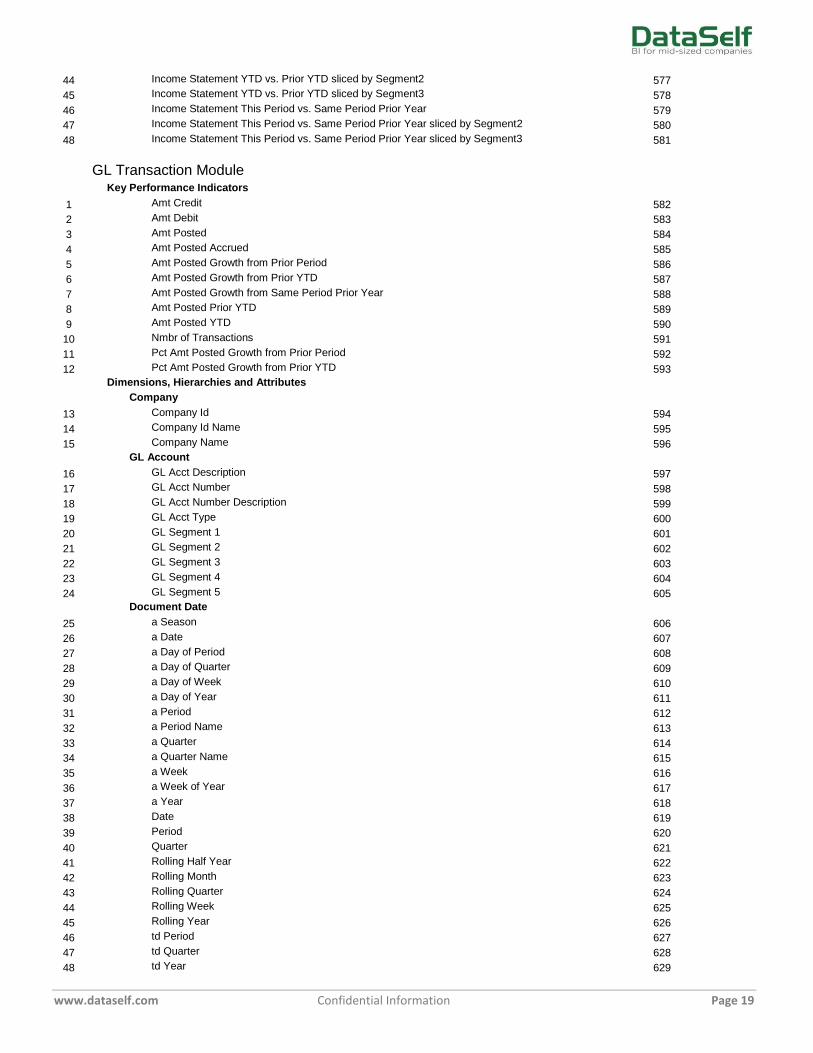
www.dataself.com Confidential Information Page 19
44 Income Statement YTD vs. Prior YTD sliced by Segment2 577
45 Income Statement YTD vs. Prior YTD sliced by Segment3 578
46 Income Statement This Period vs. Same Period Prior Year 579
47 Income Statement This Period vs. Same Period Prior Year sliced by Segment2 580
48 Income Statement This Period vs. Same Period Prior Year sliced by Segment3 581
GL Transaction Module
Key Performance Indicators
1 Amt Credit 582
2 Amt Debit 583
3 Amt Posted 584
4 Amt Posted Accrued 585
5 Amt Posted Growth from Prior Period 586
6 Amt Posted Growth from Prior YTD 587
7 Amt Posted Growth from Same Period Prior Year 588
8 Amt Posted Prior YTD 589
9 Amt Posted YTD 590
10 Nmbr of Transactions 591
11 Pct Amt Posted Growth from Prior Period 592
12 Pct Amt Posted Growth from Prior YTD 593
Dimensions, Hierarchies and Attributes
Company
13 Company Id 594
14 Company Id Name 595
15 Company Name 596
GL Account
16 GL Acct Description 597
17 GL Acct Number 598
18 GL Acct Number Description 599
19 GL Acct Type 600
20 GL Segment 1 601
21 GL Segment 2 602
22 GL Segment 3 603
23 GL Segment 4 604
24 GL Segment 5 605
Document Date
25 a Season 606
26 a Date 607
27 a Day of Period 608
28 a Day of Quarter 609
29 a Day of Week 610
30 a Day of Year 611
31 a Period 612
32 a Period Name 613
33 a Quarter 614
34 a Quarter Name 615
35 a Week 616
36 a Week of Year 617
37 a Year 618
38 Date 619
39 Period 620
40 Quarter 621
41 Rolling Half Year 622
42 Rolling Month 623
43 Rolling Quarter 624
44 Rolling Week 625
45 Rolling Year 626
46 td Period 627
47 td Quarter 628
48 td Year 629
www.dataself.com Confidential Information Page 20
49 Year 630
GL Transaction Reports
50 Posted Amt This Year by GL Account 631
51 Posted Amt This Year by GL Segment 632
52 Posted Amt This Year by GL Segment and 633
52 Posted Amt This Year by GL Segment and 633
53 Posted Amt This Year by GL Segment 634
54 Posted Amt This Year by GL Segment and 635
54 Posted Amt This Year by GL Segment and 635
55 Posted Amt This Year by GL Segment 636
56 Posted Amt This Year by GL Segment and 637
57 Posted Amt and Accrued Balance This Year by GL Account 638
58 Posted Amt and Accrued Balance This Year by GL Segment 639
59 Posted Amt and Accrued Balance This Year by GL Segment and 640
59 Posted Amt and Accrued Balance This Year by GL Segment and 640
60 Posted Amt and Accrued Balance This Year by GL Segment 641
61 Posted Amt and Accrued Balance This Year by GL Segment and 642
62 Posted Amt and Accrued Balance This Year by GL Segment 643
63 Posted Amt and Accrued Balance This Year by GL Segment and 644
64 Posted Amt This YTD vs. Prior YTD by GL Account 645
65 Posted Amt This YTD vs. Prior YTD by GL Segment 646
66 Posted Amt This YTD vs. Prior YTD by GL Segment and 647
66 Posted Amt This YTD vs. Prior YTD by GL Segment and 647
67 Posted Amt This YTD vs. Prior YTD by GL Segment, and 648
68 Posted Amt This YTD vs. Prior YTD by GL Segment 649
69 Posted Amt This YTD vs. Prior YTD by GL Segment and 650
69 Posted Amt This YTD vs. Prior YTD by GL Segment and 650
70 Posted Amt This YTD vs. Prior YTD by GL Segment 651
71 Posted Amt This YTD vs. Prior YTD by GL Segment and 652
72 Posted Amt This YTD vs. Prior YTD by GL Segment, and 653
73 Posted Amt This Period vs. Prior Period by GL Account 654
74 Posted Amt This Period vs. Prior Period by GL Segment 655
75 Posted Amt This Period vs. Prior Period by GL Segment and 656
75 Posted Amt This Period vs. Prior Period by GL Segment and 656
76 Posted Amt This Period vs. Prior Period by GL Segment 657
77 Posted Amt This Period vs. Prior Period by GL Segment and 658
77 Posted Amt This Period vs. Prior Period by GL Segment and 658
78 Posted Amt This Period vs. Prior Period by GL Segment 659
79 Posted Amt This Period vs. Prior Period by GL Segment and 660
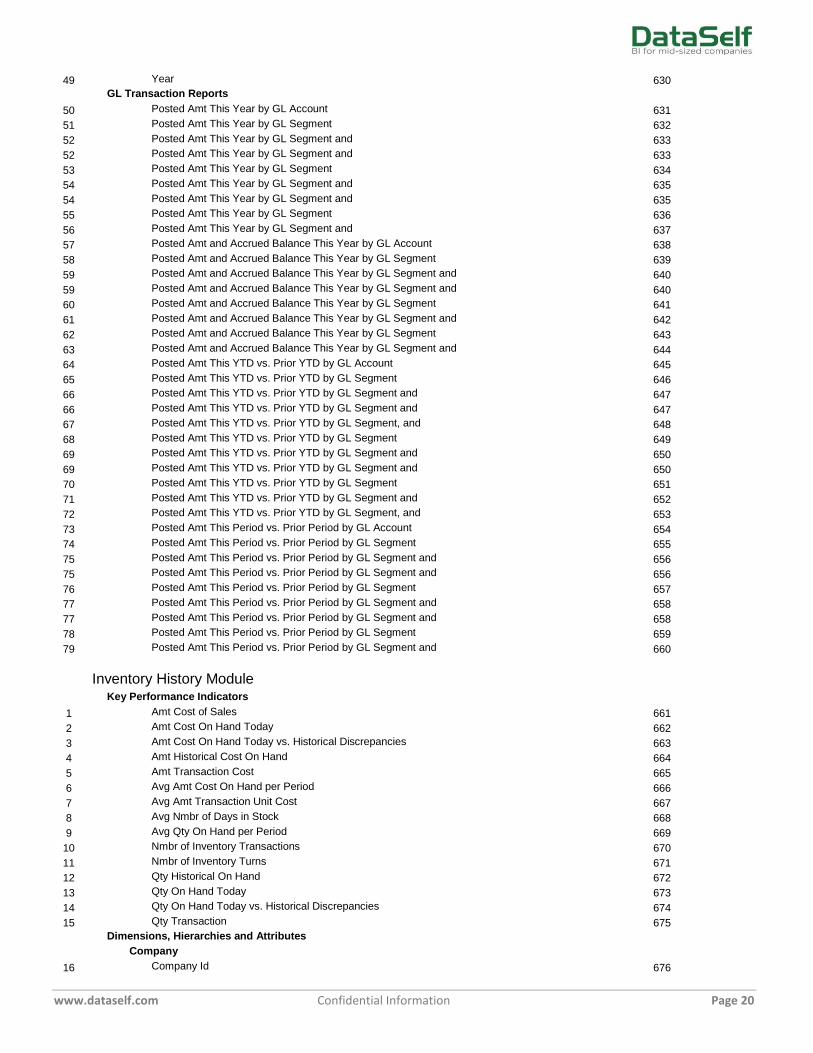
Inventory History Module
Key Performance Indicators
1 Amt Cost of Sales 661
2 Amt Cost On Hand Today 662
3 Amt Cost On Hand Today vs. Historical Discrepancies 663
4 Amt Historical Cost On Hand 664
5 Amt Transaction Cost 665
6 Avg Amt Cost On Hand per Period 666
7 Avg Amt Transaction Unit Cost 667
8 Avg Nmbr of Days in Stock 668
9 Avg Qty On Hand per Period 669
10 Nmbr of Inventory Transactions 670
11 Nmbr of Inventory Turns 671
12 Qty Historical On Hand 672
13 Qty On Hand Today 673
14 Qty On Hand Today vs. Historical Discrepancies 674
15 Qty Transaction 675
Dimensions, Hierarchies and Attributes
Company
16 Company Id 676
www.dataself.com Confidential Information Page 21
17 Company Id Name 677
18 Company Name 678
Document Date
19 a Season 679
20 a Date 680
21 a Day of Period 681
22 a Day of Quarter 682
23 a Day of Week 683
24 a Day of Year 684
25 a Period 685
26 a Period Name 686
27 a Quarter 687
28 a Quarter Name 688
29 a Week 689
30 a Week of Year 690
31 a Year 691
32 Date 692
33 Period 693
34 Quarter 694
35 Rolling Half Year 695
36 Rolling Month 696
37 Rolling Quarter 697
38 Rolling Week 698
39 Rolling Year 699
40 td Period 700
41 td Quarter 701
42 td Year 702
43 Year 703
Product
44 Product Description 704
45 Product Id 705
46 Product Id Description 706
47 Product Line/Cat/Class Description 707
48 Product Line/Cat/Class Id 708
49 Product Line/Cat/Class Id Description 709
50 Quantity On Hand 710
51 Unit Cost 711
52 Unit of Measure 712
53 Unit Price 713
Warehouse
54 Warehouse Name 714
55 Warehouse Id 715
56 Warehouse Id Name 716
Inventory History Reports
57 Avg Cost OH per Period by Product 717
58 Avg Cost OH per Period by Product Line 718
59 Avg Cost OH per Period by Warehouse 719
60 Avg Nmbr of Days in Stock by Product 720
61 Avg Nmbr of Days in Stock by Product Line 721
62 Avg Nmbr of Days in Stock by Warehouse 722
63 Avg Nmbr of Days in Stock by Warehouse and Product 723
64 Historical Cost OH by Product by Period (g) 724
65 Historical Cost OH by Product by Period, Prod Line sliced (g) 725
66 Historical Cost OH by Product by Period, Warehouse sliced (g) 726
67 Historical Cost OH by Product Line by Period 727
68 Historical Cost OH by Warehouse by Period 728
69 Historical Cost and Qty OH by Period, Product sliced (g) 729
70 Historical Cost and Qty OH by Period, Prod Line sliced (g) 730
71 Historical Cost and Qty OH by Period, Warehouse sliced (g) 731
72 Historical Qty OH by Product by Period (g) 732
www.dataself.com Confidential Information Page 22
73 Historical Qty OH by Product by Period, Prod Line sliced (g) 733
74 Historical Qty OH by Product by Period, Warehouse sliced (g) 734
75 Inventory Transaction Code Analysis This Year by Product 735
76 Inventory Transaction Code Analysis This Year by Product Line 736
77 Inventory Transaction Code Analysis This Year by Warehouse 737
78 Inventory Turnover This Year by Product 738
79 Inventory Turnover This Year by Product and Warehouse 739
80 Inventory Turnover This Year by Product Line 740
81 Inventory Turnover This Year by Warehouse and Product 741
On Hand Today Reports
82 Cost OH Today by Product, Pie Chart Top 0 (g) 742
83 Cost OH Today by Product, Pie Chart Top 00, Prod Line sliced (g) 743
84 Cost OH Today by Product, Pie Chart Top 00, Warehouse sliced (g) 744
85 Cost OH Today Pie Chart by Product Line (g) 745
86 Cost OH Today Pie Chart by Warehouse (g) 746
87 Qty and Cost OH Today by Product 747
88 Qty and Cost OH Today by Product and Warehouse 748
89 Qty and Cost OH Today by Product Line 749
90 Qty and Cost OH Today by Product Line and Product 750
91 Qty and Cost OH Today by Product Line and Warehouse 751
92 Qty and Cost OH Today by Warehouse 752
93 Qty and Cost OH Today by Warehouse and Product 753
94 Qty and Cost OH Today by Warehouse and Product Line 754
Top and Bottom Performers Reports
95 Bottom Products by Inventory Turnover This Year 755
96 Performance Map-Cost OH Today and Inventory Turns This Year (g) 756
97 Performance Map-Qty OH Today and Inventory Turns This Year (g) 757
98 Products with Inv Transactions Last Days, No Tran Last days 758
99 Slow Moving Products This Year 759
100 Slow Moving Products This Year , Prod Line sliced 760
101 Slow Moving Products This Year , Warehouse sliced 761
102 Stacked Cost OH Today by Top - Products- by -COS- This - Year (g) 762
103 Stacked Cost OH Today by Top - Products- by -Cost-OH-Today (g) 763
104 Top Products by Cost OH Today (g) 764
105 Top Products by Inventory Turnover This Year (g) 765
106 Top Products by Nmbr of Days in Stock This Year (g) 766
107 Top Products by Nmbr of Days in Stock This Year, Prod Line sliced (g) 767
108 Top Products by Nmbr of Inventory Transactions This Year (g) 768
109 Top Products by Nmbr of Inventory Transactions This Year , Prod Line sliced (g) 769
110 Top Products by Nmbr of Item Transfers Last Days (g) 770
111 Top Products by Nmbr of Item Transfers This Year (g) 771
112 Top Products by Qty OH Today (g) 772
113 Top Product Categories by Cost OH Today (g) 773
114 Top Warehouses by Cost OH Today (g) 774
Note: For the purpose of calculating historical on-hand values, the out-of-the-box DataSelf BI system assumes that the
inventory transactions have never been purged. Your DataSelf BI system may require adjusting entries. Please contact
us for details.
Inventory Projection Module
Key Performance Indicators
1 Amt On Hand Today 775
2 Amt Open PO 776
3 Amt Open SO 777
4 Amt Sold 778
5 Qty On Hand Today 779
6 Qty Open PO 780
7 Qty Open SO 781
8 Qty Sold 782
9 Amt On Hand Projected End of Period 783
10 Amt onPO Accrued 784
www.dataself.com Confidential Information Page 23
11 Amt onSO Accrued 785
12 Qty Below Reorder Point 786
13 Qty On Hand Projected End of Period 787
14 Qty onPO Accrued 788
15 Qty onSO Accrued 789
16 Qty Reorder Point 790
Dimensions, Hierarchies and Attributes
Company
17 Company Id 791
18 Company Id Name 792
19 Company Name 793
Activity Date
20 a Season 794
21 a Date 795
22 a Day of Period 796
23 a Day of Quarter 797
24 a Day of Week 798
25 a Day of Year 799
26 a Period 800
27 a Period Name 801
28 a Quarter 802
29 a Quarter Name 803
30 a Week 804
31 a Week of Year 805
32 a Year 806
33 Date 807
34 Period 808
35 Quarter 809
36 Rolling Half Year 810
37 Rolling Month 811
38 Rolling Quarter 812
39 Rolling Week 813
40 Rolling Year 814
41 td Period 815
42 td Quarter 816
43 td Year 817
44 Year 818
Product
45 Product Description 819
46 Product Id 820
47 Product Id Description 821
48 Product Line/Cat/Class Description 822
49 Product Line/Cat/Class Id 823
50 Product Line/Cat/Class Id Description 824
51 Quantity On Hand 825
52 Unit Cost 826
53 Unit of Measure 827
54 Unit Price 828
Warehouse
55 Warehouse Name 829
56 Warehouse Id 830
57 Warehouse Id Name 831
Inventory Projection Reports
58 Amt OH Projection by Product 832
59 Amt OH Projection by Product and Warehouse 833
60 Amt OH Projection by Warehouse 834
61 Amt OH Projection by Warehouse and Product 835
62 Amt and Qty OH Projection Chart, Product sliced (g) 836
63 Amt and Qty OH Projection Chart, Prod Line sliced (g) 837
64 Amt and Qty OH Projection Chart, Warehouse sliced (g) 838
www.dataself.com Confidential Information Page 24
65 Amt Sold, on SO and Projected Chart, Product sliced (g) 839
66 Amt Sold, on SO and Projected Chart, Prod Line sliced (g) 840
67 Amt Sold, on SO and Projected Chart, Warehouse sliced (g) 841
68 Amt Sold, Projected, Accrued on PO and SO Chart, Product sliced (g) 842
69 Amt Sold, Projected, Accrued on PO and SO Chart, Prod Line sliced (g) 843
70 Amt Sold, Projected, Accrued on PO and SO Chart, Warehouse sliced (g) 844
71 Qty OH Projection by Product 845
72 Qty OH Projection by Product and Warehouse 846
73 Qty OH Projection by Warehouse 847
74 Qty OH Projection by Warehouse and Product 848
75 Qty Sold, Projected, Accrued on PO and SO Chart, Product sliced (g) 849
76 Qty Sold, Projected, Accrued on PO and SO Chart, Prod Line sliced (g) 850
77 Qty Sold, Projected, Accrued on PO and SO Chart, Warehouse sliced (g) 851
78 Qty Sold, on SO and Projected Chart, Products sliced (g) 852
79 Qty Sold, on SO and Projected Chart, Prod Line sliced (g) 853
80 Qty Sold, on SO and Projected Chart, Warehouse sliced (g) 854
Inventory Replenishment Plan Module
It’s easy to customize the Inventory Replenishment Planning Module for each a client’s specific needs. For instance,
decision-makers can plan inventory replenishment for any item over any period. The module works at any level of
granularity, down to individual item numbers, item groups or even subgroups like color, size and style.
Users can choose to predict demand based on past sales, on sales forecasts from salespeople or customers, on market
trends or even on a blend of metrics.
The solution integrates current data for inventory on hand, outstanding purchase or production orders outstanding sales
orders, forecasted demand and reorder parameters. For reordering, it can take into account parameters like minimum
quantity on hand, minimum reorder quantity and lead time per item.
If the solution determines that any items may run short or become overstocked, it alerts the user with the details. The
system also tells what day a purchase order or work order should be placed. Users can monitor inventory by location or
by business unit. They can also adjust parameters and see instantly what effect their adjustments would have in any
period.
Example of Key Performance Indicators
1 Quantity on Hand Today 855
2 Quantity Outstanding on PO by Receiving Date 856
3 Quantity Outstanding on SO by Shipping Date 857
4 Projected Quantity to Ship by Shipping Date 858
5 Minimum On Hand Quantity 859
6 Minimum Reorder Quantity 860
7 Expected Lead Time 861
8 Projected Quantity to Order 862
Example of Dimensions, Hierarchies and Attributes
9 Company 863
10 Expected Receiving Date 864
11 Expected PO Date 865
12 Product 866
13 Product Class/Cat/Line 867
14 Vendor 868
15 Warehouse 869
Purchase Order Module
Key Performance Indicators
1 Amt Ordered 870
2 Amt Ordered Growth from Prior Period 871
3 Amt Outstanding 872
4 Amt Received 873
5 Avg Amt Ordered per PO 874
6 Avg Amt Unit Cost Received 875
7 Avg Nmbr of Days to Receive 876
8 Avg Nmbr of PO Headers per Day 877
9 Avg Qty Ordered per PO 878
10 Nmbr of PO Headers 879
www.dataself.com Confidential Information Page 25
11 Nmbr of PO Lines 880
12 Qty Ordered 881
13 Qty Ordered Growth from Prior Period 882
14 Qty Outstanding 883
15 Qty Received 884
Dimensions, Hierarchies and Attributes
Company
16 Company Id 885
17 Company Id Name 886
18 Company Name 887
Date Required
19 a Season 888
20 a Date 889
21 a Day of Period 890
22 a Day of Quarter 891
23 a Day of Week 892
24 a Day of Year 893
25 a Period 894
26 a Period Name 895
27 a Quarter 896
28 a Quarter Name 897
29 a Week 898
30 a Week of Year 899
31 a Year 900
32 Date 901
33 Period 902
34 Quarter 903
35 Rolling Half Year 904
36 Rolling Month 905
37 Rolling Quarter 906
38 Rolling Week 907
39 Rolling Year 908
40 td Period 909
41 td Quarter 910
42 td Year 911
43 Year 912
Product
44 Product Description 913
45 Product Id 914
46 Product Id Description 915
47 Product Line/Cat/Class Description 916
48 Product Line/Cat/Class Id 917
49 Product Line/Cat/Class Id Description 918
50 Quantity On Hand 919
51 Unit Cost 920
52 Unit of Measure 921
53 Unit Price 922
PO Line
54 Date Required 923
55 Days Late 924
56 Document Date 925
57 Document Number 926
58 PO Status 927
59 PO Type 928
60 Product 929
61 Product Cat/Class/Line 930
62 UoM Conversion Factor 931
63 Vendor 932
64 Warehouse 933
Vendor
www.dataself.com Confidential Information Page 26
65 Payment Terms 934
66 Vendor Name 935
67 Vendor Id 936
68 Vendor Id Name 937
Warehouse
69 Warehouse Id 938
70 Warehouse Id Name 939
71 Warehouse Name 940
Open PO Details Reports
72 Open PO Details for a Period by Product and Vendor 941
73 Open PO Details for a Period by Product and Warehouse 942
74 Open PO Details for a Period by Product, Warehouse sliced 943
75 Open PO Details for a Period by Vendor and Product 944
76 Open PO Details for a Period by Warehouse and Product 945
77 Open PO Details for a Period by Warehouse, Product sliced 946
Reports by Product
78 Avg Amt and Qty Ordered per PO by Product 947
79 Avg Amt and Qty Ordered per PO by Product and Vendor 948
80 Avg Nmbr of Days to Receive by Product 949
81 Avg Nmbr of Days to Receive by Product and Vendor 950
82 Avg Nmbr of PO Headers per Day by Product 951
83 Avg Nmbr of PO Headers per Day by Product and Vendor 952
84 Avg Unit Cost Received by Product 953
85 Avg Unit Cost Received by Product and Vendor 954
86 Avg Unit Cost Received by Product and Warehouse 955
87 Open POs by Product 956
88 Open POs by Product and Vendor 957
89 Open POs by Product and Warehouse 958
90 Open POs by Product, Required Date and Status 959
91 Open POs by Product, Vendor, Required Date and Status 960
92 PO Headers: Nmbr and Avg Amt Ordered per Required Period (g) 961
93 PO Headers: Nmbr and Avg Amt Ordered per Required Period, Product sliced (g) 962
94 Qty Ordered Growth from Prior Period by Product 963
95 Qty Ordered Growth from Prior Period by Product and Vendor 964
Top and Bottom Performers Reports
96 Bottom Products by Avg Nmbr of Days to Receive This Year (g) 965
97 Bottom Vendors by Avg Nmbr of Days to Receive This Year (g) 966
98 Top Products by Amt Ordered (g) 967
99 Top Products by Amt Ordered Growth from Prior Period (g) 968
100 Top Products by Amt Outstanding (g) 969
101 Top Products by Nmbr of Open PO Headers (g) 970
102 Top Products by Nmbr of Open PO Headers and Avg Amt Ordered (g) 971
103 Top Products by Nmbr of Open PO Headers and Avg Amt Ordered 972
104 Top Products by Qty Ordered 973
105 Top Products by Qty Ordered Growth from Prior Period 974
106 Top Products by Qty Outstanding 975
107 Top Vendors by Amt Outstanding 976
108 Top Vendors by Amt Ordered 977
109 Top Vendors by Amt Ordered Growth from Prior Period 978
110 Top Vendors by Nmbr of Open PO Headers 979
111 Top Vendors by Nmbr of Open PO Headers and Avg Amt Ordered (g) 980
112 Top Vendors by Nmbr of Open PO Headers and Avg Amt Ordered 981
Reports by Vendor
113 Avg Amt and Qty Ordered per PO by Vendor 982
114 Avg Amt and Qty Ordered per PO by Vendor and Product 983
115 Avg Nmbr of Days to Receive by Vendor 984
116 Avg Nmbr of Days to Receive by Vendor and Product 985
117 Avg Nmbr of PO Headers per Day by Vendor 986
118 Avg Nmbr of PO Headers per Day by Vendor and Product 987
119 Avg Unit Cost Received by Vendor 988
www.dataself.com Confidential Information Page 27
120 Avg Unit Cost Received by Vendor and Product 989
121 Open POs by Vendor 990
122 Open POs by Vendor and Product 991
123 Open POs by Vendor and Warehouse 992
124 Open POs by Vendor, Product, Required Date and Status 993
125 PO Headers: Nmbr and Avg Amt Ordered per Required Period, Vendor sliced (g) 994
126 Qty Ordered Growth from Prior Period by Vendor 995
127 Qty Ordered Growth from Prior Period by Vendor and Product 996
Reports by Warehouse
128 Avg Amt and Qty Ordered per PO by Warehouse 997
129 Avg Nmbr of Days to Receive by Warehouse and Product 998
130 Avg Unit Cost Received by Warehouse and Product 999
131 Open POs by Warehouse 1000
132 Open POs by Warehouse and Product 1001
133 Open POs by Warehouse and Vendor 1002
134 Open POs by Warehouse Product, Required Date and Status 1003
135 PO Headers: Nmbr and Avg Amt Ordered per Required Period, Whse sliced (g) 1004
Payables Module
Key Performance Indicators
1 Amt Balance 1005
2 Amt Balance Accrued 1006
3 Amt Discount 1007
4 Amt Invoiced 1008
5 Amt Paid 1009
6 Avg Amt Balance per Document 1010
7 Avg Amt Balance per Vendor 1011
8 Avg Amt Invoiced per Document 1012
9 Avg Amt Invoiced per Vendor 1013
10 Nmbr of Documents 1014
11 Nmbr of Unique Vendors 1015
Dimensions, Hierarchies and Attributes
Company
12 Company Id 1016
13 Company Id Name 1017
14 Company Name 1018
Date Due
15 a Season 1019
16 a Date 1020
17 a Day of Period 1021
18 a Day of Quarter 1022
19 a Day of Week 1023
20 a Day of Year 1024
21 a Period 1025
22 a Period Name 1026
23 a Quarter 1027
24 a Quarter Name 1028
25 a Week 1029
26 a Week of Year 1030
27 a Year 1031
28 Date 1032
29 Period 1033
30 Quarter 1034
31 Rolling Half Year 1035
32 Rolling Month 1036
33 Rolling Quarter 1037
34 Rolling Week 1038
35 Rolling Year 1039
36 td Period 1040
37 td Quarter 1041
www.dataself.com Confidential Information Page 28
38 td Year 1042
39 Year 1043
Payables Line
40 Days Late 1044
41 Document Date 1045
42 Document Number 1046
43 Due Date 1047
44 Payment Status 1048
45 Vendor 1049
Vendor
46 Payment Terms 1050
47 Vendor Name 1051
48 Vendor Id 1052
49 Vendor Id Name 1053
Payables Reports
50 Accrued Balance by Date Due (g) 1054
51 Accrued Balance Due This Year by Vendor, Pie Chart Top 0 (g) 1055
52 Amt Paid by Period Due (g) 1056
53 Amt Paid Due This Year by Vendor, Pie Chart Top 0 (g) 1057
54 Avg -Balance-per-Document by Period Due 1058
55 Avg -Balance-per-Document by Vendor 1059
56 Avg -Balance-per-Vendor by Period Due (g) 1060
57 Balance and Balance Accrued by Vendor and Period Due 1061
58 Balance by Aging Status (g) 1062
59 Balance by Aging Status and Vendor 1063
60 Balance by Date Due (g) 1064
61 Balance by Period Due (g) 1065
62 Balance by Vendor 1066
63 Balance Accrued by Vendors 1067
64 Nmbr of Documents by Period Due (g) 1068
65 Nmbr of Vendors with Payables by Period Due 1069
66 Payables Details: Due Date, Vendor, Doc Date, Doc Nmbr, Date Due sliced 1070
67 Payables Details: Vendor, Doc Date, Due Date, Date Due sliced 1071
68 Payables Details: Paymt Status, Vendor, Doc Date, Doc Nmbr, Date Due 1072
69 Payables Details: Vendor, Doc Date, Doc Nmbr, Date Due, Date Due sliced 1073
70 Payables Metrics by Vendor and Year Due 1074
71 Stacked Amt Paid by Period Due and Top -Vendors- by -Balance (g) 1075
72 Stacked Balance by Period Due and Top -Vendors- by -Balance (g) 1076
73 Top Vendors by Amt Invoiced (Due This Year ) (g) 1077
74 Top Vendors by Amt Paid(Due This Year ) (g) 1078
75 Top Vendors by Avg -Balance-per-Document(Due This Year ) (g) 1079
76 Top Vendors by Balance(Due This Year ) (g) 1080
77 Top Vendors by Nmbr of Documents (Due This Year ) (g) 1081
78 Top Vendors by Nmbr of Documents (Due This Year ) and Avg Amt Invoiced (g) 1082
79 Top Vendors by Nmbr of Documents (Due This Year ) and Avg Amt Invoiced 1083
Note: Accounting systems vary in how much payment history data is included with the open payables records.
Project/Job Costing Module
Key Performance Indicators
1 Actual Cost 1084
2 Actual Profit 1085
3 Actual Qty 1086
4 Actual Sales 1087
5 Actual Work Time 1088
6 Billable Time Available 1089
7 Billable Work Time 1090
8 Billed Cost 1091
9 Billed Sales 1092
10 Cost to Complete 1093
11 Estimated Cost 1094
www.dataself.com Confidential Information Page 29
12 Estimated Profit 1095
13 Estimated Qty 1096
14 Estimated Sales 1097
15 Estimated Work Time 1098
16 Percent Complete by Job 1099
17 Ratio of Billable versus Total Time 1100
18 Sales to Complete 1101
19 Unbilled Cost 1102
20 Unbilled Sales 1103
21 Unbilled Work Time 1104
Dimensions, Hierarchies and Attributes
Company
22 Company Id 1105
23 Company Id Name 1106
24 Company Name 1107
Customer
25 Account Manager 1108
26 Credit Limit 1109
27 Credit On Hold 1110
28 Customer Group/Type 1111
29 Customer Id 1112
30 Customer Id Name 1113
31 Customer Name 1114
32 Customer Address 1115
33 Customer City 1116
34 Customer State 1117
35 Customer Zip/PC 1118
36 Customer Country 1119
37 Days in Business with Us 1120
38 Division 1121
39 National Account 1122
40 Payment Terms 1123
41 Territory 1124
Estimated Start Date
42 a Season 1125
43 a Date 1126
44 a Day of Period 1127
45 a Day of Quarter 1128
46 a Day of Week 1129
47 a Day of Year 1130
48 a Period 1131
49 a Period Name 1132
50 a Quarter 1133
51 a Quarter Name 1134
52 a Week 1135
53 a Week of Year 1136
54 a Year 1137
55 Date 1138
56 Period 1139
57 Quarter 1140
58 Rolling Half Year 1141
59 Rolling Month 1142
60 Rolling Quarter 1143
61 Rolling Week 1144
62 Rolling Year 1145
63 td Period 1146
64 td Quarter 1147
65 td Year 1148
66 Year 1149
Actual Start Date
www.dataself.com Confidential Information Page 30
67 a Season 1150
68 a Date 1151
69 a Day of Period 1152
70 a Day of Quarter 1153
71 a Day of Week 1154
72 a Day of Year 1155
73 a Period 1156
74 a Period Name 1157
75 a Quarter 1158
76 a Quarter Name 1159
77 a Week 1160
78 a Week of Year 1161
79 a Year 1162
80 Date 1163
81 Period 1164
82 Quarter 1165
83 Rolling Half Year 1166
84 Rolling Month 1167
85 Rolling Quarter 1168
86 Rolling Week 1169
87 Rolling Year 1170
88 td Period 1171
89 td Quarter 1172
90 td Year 1173
91 Year 1174
Estimated Completion Date
92 a Season 1175
93 a Date 1176
94 a Day of Period 1177
95 a Day of Quarter 1178
96 a Day of Week 1179
97 a Day of Year 1180
98 a Period 1181
99 a Period Name 1182
100 a Quarter 1183
101 a Quarter Name 1184
102 a Week 1185
103 a Week of Year 1186
104 a Year 1187
105 Date 1188
106 Period 1189
107 Quarter 1190
108 Rolling Half Year 1191
109 Rolling Month 1192
110 Rolling Quarter 1193
111 Rolling Week 1194
112 Rolling Year 1195
113 td Period 1196
114 td Quarter 1197
115 td Year 1198
116 Year 1199
Actual Completion Date
117 a Season 1200
118 a Date 1201
119 a Day of Period 1202
120 a Day of Quarter 1203
121 a Day of Week 1204
122 a Day of Year 1205
123 a Period 1206
124 a Period Name 1207
www.dataself.com Confidential Information Page 31
125 a Quarter 1208
126 a Quarter Name 1209
127 a Week 1210
128 a Week of Year 1211
129 a Year 1212
130 Date 1213
131 Period 1214
132 Quarter 1215
133 Rolling Half Year 1216
134 Rolling Month 1217
135 Rolling Quarter 1218
136 Rolling Week 1219
137 Rolling Year 1220
138 td Period 1221
139 td Quarter 1222
140 td Year 1223
141 Year 1224
Project/Cost
142 Department 1225
143 Job/Project Id 1226
144 Job/Project Id Description 1227
145 Job/Project Status 1228
146 Job/Project Type 1229
147 Worker Id 1230
148 Worker Id Name 1231
149 Worker Name 1232
Reports by Company
150 Actual vs. Estimated Analysis by Customer 1233
151 Actual vs. Estimated Analysis by Customer Region 1234
152 Actual vs. Estimated Analysis by Customer Type 1235
153 Actual vs. Estimated Analysis by Job 1236
154 Actual vs. Estimated Analysis by Job Type 1237
155 Actual vs. Estimated Analysis by Cost Type 1238
156 Actual vs. Estimated Analysis by Start/End Date 1239
157 Cost and Qty Analysis by Customer 1240
158 Cost and Qty Analysis by Customer Region 1241
159 Cost and Qty Analysis by Customer Type 1242
160 Cost and Qty Analysis by Job 1243
161 Cost and Qty Analysis by Job Type 1244
162 Cost and Qty Analysis by Cost Type 1245
163 Cost and Qty Analysis by Start/End Date 1246
164 Profitability Analysis by Customer 1247
165 Profitability Analysis by Customer Region 1248
166 Profitability Analysis by Customer Type 1249
167 Profitability Analysis by Job 1250
168 Profitability Analysis by Job Type 1251
169 Profitability Analysis by Cost Type 1252
170 Profitability Analysis by Start/End Date 1253
171 Utilization by Customer Region 1254
172 Utilization by Department/Division 1255
173 Utilization by Job 1256
174 Utilization by Worker 1257
Receivables Module
Key Performance Indicators
1 Amt Balance 1258
2 Amt Balance Accrued 1259
3 Amt Discount 1260
4 Amt Invoiced 1261
5 Amt Paid 1262
www.dataself.com Confidential Information Page 32
6 Amt Received 1263
7 Amt Received Accrued 1264
8 Amt Sales Tax 1265
9 Avg Amt Balance per Customer 1266
10 Avg Amt Balance per Document 1267
11 Avg Amt Invoiced per Customer 1268
12 Avg Amt Invoiced per Document 1269
13 Avg Nmbr of Days to Receive 1270
14 Nmbr of Documents 1271
15 Nmbr of Unique Customers 1272
Dimensions, Hierarchies and Attributes
Company
16 Company Id 1273
17 Company Id Name 1274
18 Company Name 1275
Customer
19 Account Manager 1276
20 Credit Limit 1277
21 Credit On Hold 1278
22 Customer Group/Type 1279
23 Customer Id 1280
24 Customer Id Name 1281
25 Customer Name 1282
26 Customer Address 1283
27 Customer City 1284
28 Customer State 1285
29 Customer Zip/PC 1286
30 Customer Country 1287
31 Days in Business with Us 1288
32 Division 1289
33 National Account 1290
34 Payment Terms 1291
35 Territory 1292
Date Due
36 a Season 1293
37 a Date 1294
38 a Day of Period 1295
39 a Day of Quarter 1296
40 a Day of Week 1297
41 a Day of Year 1298
42 a Period 1299
43 a Period Name 1300
44 a Quarter 1301
45 a Quarter Name 1302
46 a Week 1303
47 a Week of Year 1304
48 a Year 1305
49 Date 1306
50 Period 1307
51 Quarter 1308
52 Rolling Half Year 1309
53 Rolling Month 1310
54 Rolling Quarter 1311
55 Rolling Week 1312
56 Rolling Year 1313
57 td Period 1314
58 td Quarter 1315
59 td Year 1316
60 Year 1317
Receivables Line
www.dataself.com Confidential Information Page 33
61 Aging Status 1318
62 Customer 1319
63 Customer PO Number 1320
64 Document Date 1321
65 Due Date 1322
66 Days Late 1323
67 Document Amt Size 1324
68 Document Number 1325
69 Document Type 1326
70 Payment Status 1327
71 Payment Terms 1328
72 Salesperson 1329
Salesperson
73 Salesperson Id 1330
74 Salesperson Id Name 1331
75 Salesperson Name 1332
Reports by Company
76 Amt Balance 1333
77 Amt Balance Accrued 1334
78 Amt Discount 1335
79 Amt Invoiced 1336
80 Amt Paid 1337
81 Amt Received 1338
82 Amt Received Accrued 1339
83 Amt Sales Tax 1340
84 Avg Amt Balance per Customer 1341
85 Avg Amt Balance per Document 1342
86 Avg Amt Invoiced per Customer 1343
87 Avg Amt Invoiced per Document 1344
88 Avg Nmbr of Days to Receive 1345
89 Nmbr of Documents 1346
90 Nmbr of Unique Customers 1347
Reports by Customer
91 Accrued Balance Due This Year by Customer , Pie Chart Top 0 (g) 1348
92 Accrued Balance Due This Year by Customer Region, Pie Chart (g) 1349
93 Amt Received Due This Year by Customer , Pie Chart Top 0 (g) 1350
94 Amt Received Due This Year by Customer Region, Pie Chart (g) 1351
95 Avg -Amt-Invoiced-per- Customer by Due Period (g) 1352
96 Avg -Balance-per- Customer by Period Due (g) 1353
97 Avg -Balance-per-Document by Customer 1354
98 Avg -Balance-per-Document by Customer Region 1355
99 Avg -Nmbr- of -Days-to-Receive by Customer , Paid Invoices 1356
100 Avg -Nmbr- of -Days-to-Receive and Balance by Customer 1357
101 Balance by Aging Status and Customer 1358
102 Balance by Aging Status and Customer Region 1359
103 Balance by Customer 1360
104 Balance by Customer Region 1361
105 Balance and Balance Accrued by Customer and Period Due 1362
106 Balance and Balance Accrued by Customer Region and Period Due 1363
107 Nmbr of Customers with Receivables by Period Due (g) 1364
108 Nmbr of Customers with Receivables by Period Due, Customer Region sliced (g) 1365
109 Nmbr of Customers with Receivables by Period Due, Salespeople sliced (g) 1366
110 Nmbr of Documents by Customer Region and Due Period (g) 1367
111 Nmbr of Unique Customers by Due Period (g) 1368
112 Receivables Metrics by Customer and Year Due 1369
113 Receivables Metrics by Customer Region and Year Due 1370
114 Stacked Amt Balance Accumulated by Period Due and Customer Regions (g) 1371
115 Stacked Amt Received Accumulated by Period Due and Customer Regions (g) 1372
Receivables Details Reports
116 Receivables Details: Customer , Doc Date, Doc Nmbr, Date Due, Date Due sliced 1373
www.dataself.com Confidential Information Page 34
117 Receivables Details: Date Due, Customer , Doc Date, Doc Nmbr, Date Due sliced 1374
118 Receivables Details: Salesperson, Customer , Doc Date, Doc Nmbr, Date Due 1375
119 Receivables Details: Salesperson, Doc Date, Doc Nmbr, Date Due 1376
Reports by Salesperson
120 Accrued Balance Due This Year by Salesperson, Pie Chart (g) 1377
121 Amt Received Due This Year by Salesperson, Pie Chart 1378
122 Avg -Amt-Invoiced-per- Customer and Balance by Salesperson 1379
123 Avg -Balance-per-Document by Salesperson 1380
124 Avg -Nmbr- of -Days-to-Receive by Salesperson, Paid Invoices 1381
125 Avg -Nmbr- of -Days-to-Receive and Balance by Salesperson 1382
126 Balance by Aging Status and Salesperson 1383
127 Balance by Salesperson 1384
128 Balance and Balance Accumulated by Salesperson and Period Due 1385
129 Nmbr of Documents by Salesperson and Due Period (g) 1386
130 Nmbr of Unique Customers by Salesperson and Due Period (g) 1387
131 Receivables Metrics by Salesperson and Year Due 1388
132 Stacked Amt Balance by Period Due and Salespeople (g) 1389
133 Stacked Amt Balance Accumulated by Period Due and Salespeople (g) 1390
134 Stacked Amt Received Accumulated by Period Due and Salespeople (g) 1391
135 Stacked Amt Received by Period Due and Salespeople (g) 1392
Top and Bottom Performers Reports
136 Stacked Balance by Period Due and Top - Customers - by -Balance (g) 1393
137 Stacked Balance Accrued by Period Due and Top - Customers - by -Balance (g) 1394
138 Stacked Amt Received by Period Due and Top - Customers - by -Balance (g) 1395
139 Stacked Amt Received Accrued by Period Due and Top-Customers-by-Balance 1396
140 Top Customers by Amt Invoiced (Due This Year ) (g) 1397
141 Top Customers by Amt Invoiced and Avg -Nmbr- of -Days-to-Receive 1398
142 Top Customers by Amt Invoiced and Avg -Nmbr- of -Days-to-Receive (g) 1399
143 Top Customers by Amt Received (Due This Year ) (g) 1400
144 Top Customers by Avg -Balance-per-Document(Due This Year ) (g) 1401
145 Top Customers by Balance(Due This Year ) (g) 1402
146 Top Customers by Nmbr- of -Documents (Due This Year ) (g) 1403
147 Top Customer Regions by Amt Invoiced (Due This Year ) (g) 1404
148 Top Customer Regions by Amt Received (Due This Year ) (g) 1405
149 Top Customer Regions by Balance(Due This Year ) (g) 1406
150 Top Customers by Nmbr-of-Documents & Avg Amt Invoiced per Doc 1407
151 Top Customers by Nmbr-of-Documents & Avg Amt Invoiced per Doc (g) 1408
152 Top Salespeople by Amt Invoiced (Due This Year ) (g) 1409
153 Top Salespeople by Amt Received (Due This Year ) (g) 1410
154 Top Salespeople by Balance(Due This Year ) (g) 1411
Notes: Accounting systems vary in how much payment history is included within the open receivable records. The
validity of the Average Days to Receive calculation is dependent on the availability of historical payment records.
Sales Module
Key Performance Indicators
1 a Amt Sales DayOfPer-ToDate 1412
2 a Amt Sales Same Season Prior Year 1413
3 a Amt Sales To Date Growth from Same Season Prior Year 1414
4 a Amt Sales To Date Same Season Prior Year 1415
5 a Amt Sales To Date This Season 1416
6 a Pct Sales To Date Growth from Same Season Prior Year 1417
7 Amt Cost of Sales 1418
8 Amt Discount H 1419
9 Amt Gross Profit 1420
10 Amt Gross Profit Growth from Prior PTD 1421
11 Amt Gross Profit Growth from Prior QTD 1422
12 Amt Gross Profit Growth from Prior YTD 1423
13 Amt Gross Profit Prior PTD 1424
14 Amt Gross Profit Prior QTD 1425
15 Amt Gross Profit Prior YTD 1426
www.dataself.com Confidential Information Page 35
16 Amt Gross Profit PTD 1427
17 Amt Gross Profit QTD 1428
18 Amt Gross Profit YTD 1429
19 Amt Returned 1430
20 Amt Returned YTD 1431
21 Amt Sales 1432
22 Amt Sales Growth from Prior Period 1433
23 Amt Sales Growth from Prior PTD 1434
24 Amt Sales Growth from Prior QTD 1435
25 Amt Sales Growth from Prior Quarter 1436
26 Amt Sales Growth from Prior Rolling Half Year 1437
27 Amt Sales Growth from Prior Rolling Month 1438
28 Amt Sales Growth from Prior Rolling Quarter 1439
29 Amt Sales Growth from Prior Rolling Week 1440
30 Amt Sales Growth from Prior Rolling Year 1441
31 Amt Sales Growth from Prior Year 1442
32 Amt Sales Growth from Prior YTD 1443
33 Amt Sales Growth from Same Period Prior Year 1444
34 Amt Sales Prior Period 1445
35 Amt Sales Prior PTD 1446
36 Amt Sales Prior QTD 1447
37 Amt Sales Prior Quarter 1448
38 Amt Sales Prior Year 1449
39 Amt Sales Prior YTD 1450
40 Amt Sales PTD 1451
41 Amt Sales QTD 1452
42 Amt Sales Same Period Prior Year 1453
43 Amt Sales Tax H 1454
44 Amt Sales YTD 1455
45 Avg Amt Discount per Invoice 1456
46 Avg Amt Sales 3-Rolling Months 1457
47 Avg Amt Sales 3-Rolling Quarters 1458
48 Avg Amt Sales 3-Rolling Weeks 1459
49 Avg Amt Sales per Day 1460
50 Avg Amt Sales per Invoice 1461
51 Avg Amt Sales per Period 1462
52 Avg Amt Sales per Quarter 1463
53 Avg Amt Unit Price Sold 1464
54 Avg Nmbr of Days between Sales 1465
55 Avg Nmbr of Invoices per Period 1466
56 Avg Qty Sold per Day 1467
57 Avg Qty Sold per Invoice 1468
58 Avg Qty Sold per Period 1469
59 Avg Qty Sold per Quarter 1470
60 Customer Group Large By Sales Amt Volume 1471
61 Customer Group Small By Sales Amt Volume 1472
62 Flags Amt Sales and Growth Prior Period 1473
63 Nmbr of Activity Days H 1474
64 Nmbr of Periods 1475
65 Nmbr of Quarters 1476
66 Nmbr of Sales Headers H 1477
67 Nmbr of Sales Lines 1478
68 Nmbr of Unique Customers H 1479
69 Nmbr of Unique Products 1480
70 Nmbr of Unique Salespeople H 1481
71 Nmbr of Work Days 1482
72 Pct Avg Sales Growth from Prior 3-Rolling Months 1483
73 Pct Avg Sales Growth from Prior 3-Rolling Quarters 1484
74 Pct Avg Sales Growth from Prior 3-Rolling Weeks 1485
75 Pct Gross Profit 1486

www.dataself.com Confidential Information Page 36
76 Pct Gross Profit Growth from Prior PTD 1487
77 Pct Gross Profit Growth from Prior QTD 1488
78 Pct Gross Profit Growth from Prior YTD 1489
79 Pct Qty Sold Growth from Prior Period 1490
80 Pct Qty Sold Growth from Prior PTD 1491
81 Pct Qty Sold Growth from Prior QTD 1492
82 Pct Qty Sold Growth from Prior YTD 1493
83 Pct Qty Sold Growth from Same Period Prior Year 1494
84 Pct Sales Growth from Prior Period 1495
85 Pct Sales Growth from Prior PTD 1496
86 Pct Sales Growth from Prior QTD 1497
87 Pct Sales Growth from Prior Rolling Half Year 1498
88 Pct Sales Growth from Prior Rolling Month 1499
89 Pct Sales Growth from Prior Rolling Quarter 1500
90 Pct Sales Growth from Prior Rolling Week 1501
91 Pct Sales Growth from Prior Rolling Year 1502
92 Pct Sales Growth from Prior YTD 1503
93 Pct Sales Growth from Same Period Prior Year 1504
94 Product Group Large By Sales Amt Volume 1505
95 Product Group Small By Sales Amt Volume 1506
96 Qty On Hand Today 1507
97 Qty On PO Today 1508
98 Qty On SO Today 1509
99 Qty Returned 1510
100 Qty Sold 1511
101 Qty Sold Growth from Prior Period 1512
102 Qty Sold Growth from Prior PTD 1513
103 Qty Sold Growth from Prior QTD 1514
104 Qty Sold Growth from Prior YTD 1515
105 Qty Sold Growth from Same Period Prior Year 1516
106 Qty Sold Prior Period 1517
107 Qty Sold Prior PTD 1518
108 Qty Sold Prior QTD 1519
109 Qty Sold Prior YTD 1520
110 Qty Sold PTD 1521
111 Qty Sold QTD 1522
112 Qty Sold Same Period Prior Year 1523
113 Qty Sold in Unit of Measure 1524
114 Qty Sold YTD 1525
115 td Avg Amt Sales per Day 1526
116 td Avg Amt Sales per Month 1527
117 td Avg Nmbr of Days between Sales 1528
118 td Avg Qty Sold per Day 1529
119 td Avg Qty Sold per Month 1530
Dimensions, Hierarchies and Attributes
Company
120 Company Id 1531
121 Company Id Name 1532
122 Company Name 1533
Customer
123 Account Manager 1534
124 Credit Limit 1535
125 Credit On Hold 1536
126 Customer Group/Type 1537
127 Customer Id 1538
128 Customer Id Name 1539
129 Customer Name 1540
130 Customer Address 1541
131 Customer City 1542
132 Customer State 1543
www.dataself.com Confidential Information Page 37
133 Customer Zip/PC 1544
134 Customer Country 1545
135 Days in Business with Us 1546
136 Division 1547
137 National Account 1548
138 Payment Terms 1549
139 Territory 1550
Document Date
140 a Season 1551
141 a Date 1552
142 a Day of Period 1553
143 a Day of Quarter 1554
144 a Day of Week 1555
145 a Day of Year 1556
146 a Period 1557
147 a Period Name 1558
148 a Quarter 1559
149 a Quarter Name 1560
150 a Week 1561
151 a Week of Year 1562
152 a Year 1563
153 Date 1564
154 Period 1565
155 Quarter 1566
156 Rolling Half Year 1567
157 Rolling Month 1568
158 Rolling Quarter 1569
159 Rolling Week 1570
160 Rolling Year 1571
161 td Period 1572
162 td Quarter 1573
163 td Year 1574
164 Year 1575
Product
165 Product Description 1576
166 Product Id 1577
167 Product Id Description 1578
168 Product Line/Cat/Class Description 1579
169 Product Line/Cat/Class Id 1580
170 Product Line/Cat/Class Id Description 1581
171 Quantity On Hand 1582
172 Unit Cost 1583
173 Unit of Measure 1584
174 Unit Price 1585
Sales Header
175 Aging Status 1586
176 Customer 1587
177 Customer PO Number 1588
178 Document Date 1589
179 Due Date 1590
180 Days Late 1591
181 Document Amt Size 1592
182 Document Number 1593
183 Document Type 1594
184 Order Number 1595
185 Payment Status 1596
186 Payment Terms 1597
187 Salesperson 1598
Sales Line
188 Customer 1599
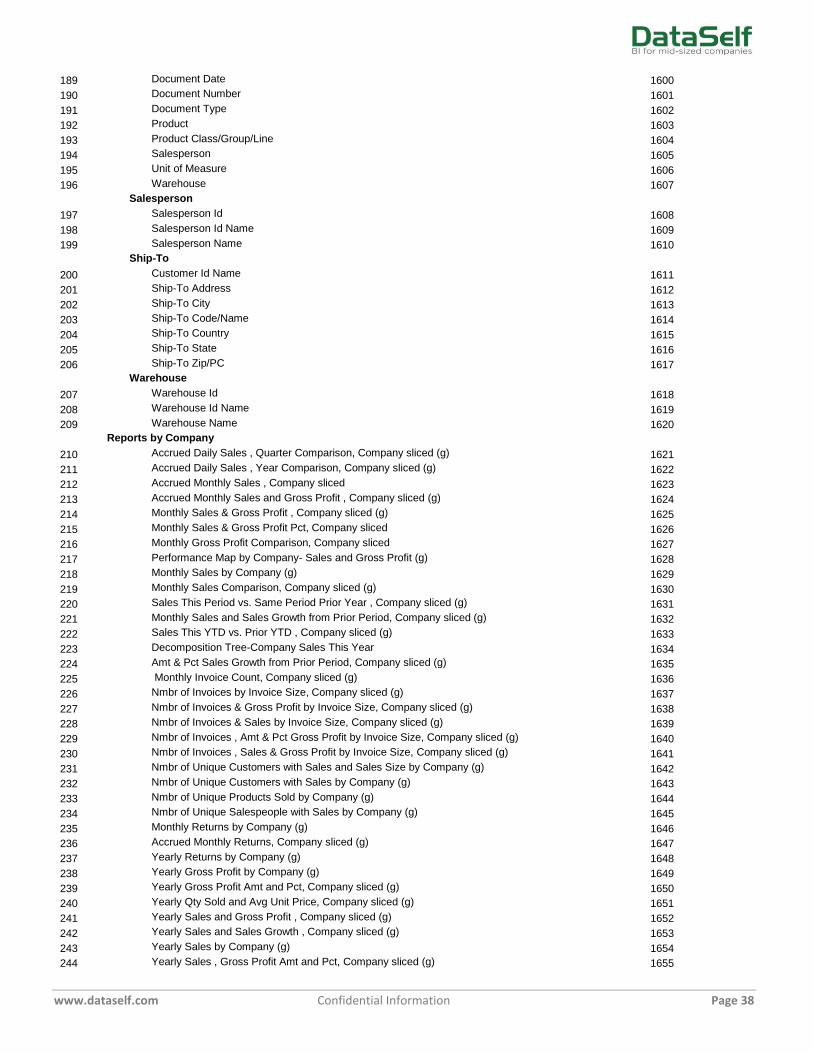
www.dataself.com Confidential Information Page 38
189 Document Date 1600
190 Document Number 1601
191 Document Type 1602
192 Product 1603
193 Product Class/Group/Line 1604
194 Salesperson 1605
195 Unit of Measure 1606
196 Warehouse 1607
Salesperson
197 Salesperson Id 1608
198 Salesperson Id Name 1609
199 Salesperson Name 1610
Ship-To
200 Customer Id Name 1611
201 Ship-To Address 1612
202 Ship-To City 1613
203 Ship-To Code/Name 1614
204 Ship-To Country 1615
205 Ship-To State 1616
206 Ship-To Zip/PC 1617
Warehouse
207 Warehouse Id 1618
208 Warehouse Id Name 1619
209 Warehouse Name 1620
Reports by Company
210 Accrued Daily Sales , Quarter Comparison, Company sliced (g) 1621
211 Accrued Daily Sales , Year Comparison, Company sliced (g) 1622
212 Accrued Monthly Sales , Company sliced 1623
213 Accrued Monthly Sales and Gross Profit , Company sliced (g) 1624
214 Monthly Sales & Gross Profit , Company sliced (g) 1625
215 Monthly Sales & Gross Profit Pct, Company sliced 1626
216 Monthly Gross Profit Comparison, Company sliced 1627
217 Performance Map by Company- Sales and Gross Profit (g) 1628
218 Monthly Sales by Company (g) 1629
219 Monthly Sales Comparison, Company sliced (g) 1630
220 Sales This Period vs. Same Period Prior Year , Company sliced (g) 1631
221 Monthly Sales and Sales Growth from Prior Period, Company sliced (g) 1632
222 Sales This YTD vs. Prior YTD , Company sliced (g) 1633
223 Decomposition Tree-Company Sales This Year 1634
224 Amt & Pct Sales Growth from Prior Period, Company sliced (g) 1635
225 Monthly Invoice Count, Company sliced (g) 1636
226 Nmbr of Invoices by Invoice Size, Company sliced (g) 1637
227 Nmbr of Invoices & Gross Profit by Invoice Size, Company sliced (g) 1638
228 Nmbr of Invoices & Sales by Invoice Size, Company sliced (g) 1639
229 Nmbr of Invoices , Amt & Pct Gross Profit by Invoice Size, Company sliced (g) 1640
230 Nmbr of Invoices , Sales & Gross Profit by Invoice Size, Company sliced (g) 1641
231 Nmbr of Unique Customers with Sales and Sales Size by Company (g) 1642
232 Nmbr of Unique Customers with Sales by Company (g) 1643
233 Nmbr of Unique Products Sold by Company (g) 1644
234 Nmbr of Unique Salespeople with Sales by Company (g) 1645
235 Monthly Returns by Company (g) 1646
236 Accrued Monthly Returns, Company sliced (g) 1647
237 Yearly Returns by Company (g) 1648
238 Yearly Gross Profit by Company (g) 1649
239 Yearly Gross Profit Amt and Pct, Company sliced (g) 1650
240 Yearly Qty Sold and Avg Unit Price, Company sliced (g) 1651
241 Yearly Sales and Gross Profit , Company sliced (g) 1652
242 Yearly Sales and Sales Growth , Company sliced (g) 1653
243 Yearly Sales by Company (g) 1654
244 Yearly Sales , Gross Profit Amt and Pct, Company sliced (g) 1655
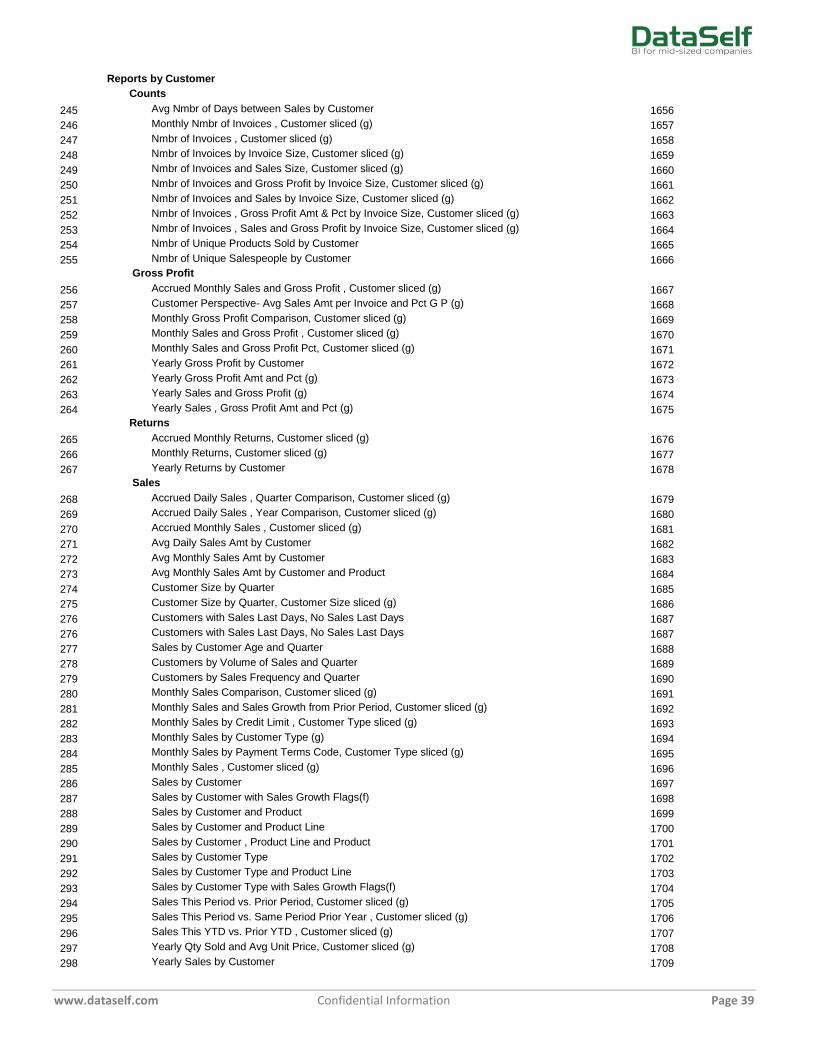
www.dataself.com Confidential Information Page 39
Reports by Customer
Counts
245 Avg Nmbr of Days between Sales by Customer 1656
246 Monthly Nmbr of Invoices , Customer sliced (g) 1657
247 Nmbr of Invoices , Customer sliced (g) 1658
248 Nmbr of Invoices by Invoice Size, Customer sliced (g) 1659
249 Nmbr of Invoices and Sales Size, Customer sliced (g) 1660
250 Nmbr of Invoices and Gross Profit by Invoice Size, Customer sliced (g) 1661
251 Nmbr of Invoices and Sales by Invoice Size, Customer sliced (g) 1662
252 Nmbr of Invoices , Gross Profit Amt & Pct by Invoice Size, Customer sliced (g) 1663
253 Nmbr of Invoices , Sales and Gross Profit by Invoice Size, Customer sliced (g) 1664
254 Nmbr of Unique Products Sold by Customer 1665
255 Nmbr of Unique Salespeople by Customer 1666
Gross Profit
256 Accrued Monthly Sales and Gross Profit , Customer sliced (g) 1667
257 Customer Perspective- Avg Sales Amt per Invoice and Pct G P (g) 1668
258 Monthly Gross Profit Comparison, Customer sliced (g) 1669
259 Monthly Sales and Gross Profit , Customer sliced (g) 1670
260 Monthly Sales and Gross Profit Pct, Customer sliced (g) 1671
261 Yearly Gross Profit by Customer 1672
262 Yearly Gross Profit Amt and Pct (g) 1673
263 Yearly Sales and Gross Profit (g) 1674
264 Yearly Sales , Gross Profit Amt and Pct (g) 1675
Returns
265 Accrued Monthly Returns, Customer sliced (g) 1676
266 Monthly Returns, Customer sliced (g) 1677
267 Yearly Returns by Customer 1678
Sales
268 Accrued Daily Sales , Quarter Comparison, Customer sliced (g) 1679
269 Accrued Daily Sales , Year Comparison, Customer sliced (g) 1680
270 Accrued Monthly Sales , Customer sliced (g) 1681
271 Avg Daily Sales Amt by Customer 1682
272 Avg Monthly Sales Amt by Customer 1683
273 Avg Monthly Sales Amt by Customer and Product 1684
274 Customer Size by Quarter 1685
275 Customer Size by Quarter, Customer Size sliced (g) 1686
276 Customers with Sales Last Days, No Sales Last Days 1687
276 Customers with Sales Last Days, No Sales Last Days 1687
277 Sales by Customer Age and Quarter 1688
278 Customers by Volume of Sales and Quarter 1689
279 Customers by Sales Frequency and Quarter 1690
280 Monthly Sales Comparison, Customer sliced (g) 1691
281 Monthly Sales and Sales Growth from Prior Period, Customer sliced (g) 1692
282 Monthly Sales by Credit Limit , Customer Type sliced (g) 1693
283 Monthly Sales by Customer Type (g) 1694
284 Monthly Sales by Payment Terms Code, Customer Type sliced (g) 1695
285 Monthly Sales , Customer sliced (g) 1696
286 Sales by Customer 1697
287 Sales by Customer with Sales Growth Flags(f) 1698
288 Sales by Customer and Product 1699
289 Sales by Customer and Product Line 1700
290 Sales by Customer , Product Line and Product 1701
291 Sales by Customer Type 1702
292 Sales by Customer Type and Product Line 1703
293 Sales by Customer Type with Sales Growth Flags(f) 1704
294 Sales This Period vs. Prior Period, Customer sliced (g) 1705
295 Sales This Period vs. Same Period Prior Year , Customer sliced (g) 1706
296 Sales This YTD vs. Prior YTD , Customer sliced (g) 1707
297 Yearly Qty Sold and Avg Unit Price, Customer sliced (g) 1708
298 Yearly Sales by Customer 1709
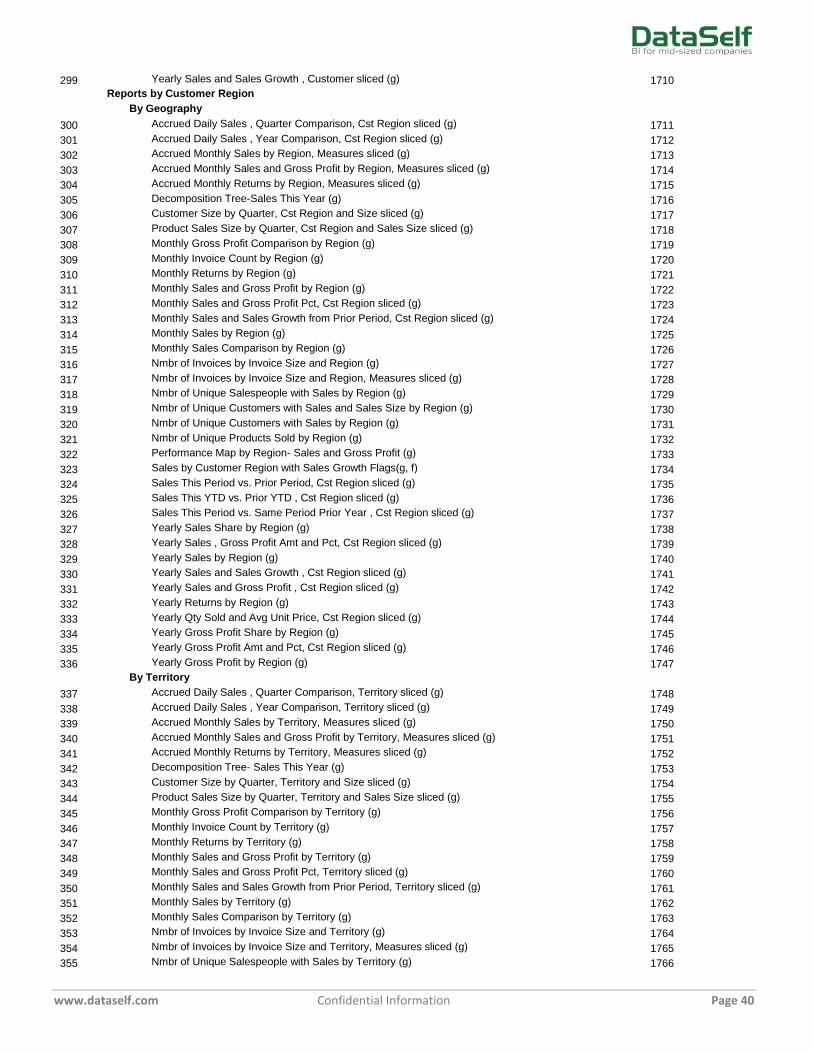
www.dataself.com Confidential Information Page 40
299 Yearly Sales and Sales Growth , Customer sliced (g) 1710
Reports by Customer Region
By Geography
300 Accrued Daily Sales , Quarter Comparison, Cst Region sliced (g) 1711
301 Accrued Daily Sales , Year Comparison, Cst Region sliced (g) 1712
302 Accrued Monthly Sales by Region, Measures sliced (g) 1713
303 Accrued Monthly Sales and Gross Profit by Region, Measures sliced (g) 1714
304 Accrued Monthly Returns by Region, Measures sliced (g) 1715
305 Decomposition Tree-Sales This Year (g) 1716
306 Customer Size by Quarter, Cst Region and Size sliced (g) 1717
307 Product Sales Size by Quarter, Cst Region and Sales Size sliced (g) 1718
308 Monthly Gross Profit Comparison by Region (g) 1719
309 Monthly Invoice Count by Region (g) 1720
310 Monthly Returns by Region (g) 1721
311 Monthly Sales and Gross Profit by Region (g) 1722
312 Monthly Sales and Gross Profit Pct, Cst Region sliced (g) 1723
313 Monthly Sales and Sales Growth from Prior Period, Cst Region sliced (g) 1724
314 Monthly Sales by Region (g) 1725
315 Monthly Sales Comparison by Region (g) 1726
316 Nmbr of Invoices by Invoice Size and Region (g) 1727
317 Nmbr of Invoices by Invoice Size and Region, Measures sliced (g) 1728
318 Nmbr of Unique Salespeople with Sales by Region (g) 1729
319 Nmbr of Unique Customers with Sales and Sales Size by Region (g) 1730
320 Nmbr of Unique Customers with Sales by Region (g) 1731
321 Nmbr of Unique Products Sold by Region (g) 1732
322 Performance Map by Region- Sales and Gross Profit (g) 1733
323 Sales by Customer Region with Sales Growth Flags(g, f) 1734
324 Sales This Period vs. Prior Period, Cst Region sliced (g) 1735
325 Sales This YTD vs. Prior YTD , Cst Region sliced (g) 1736
326 Sales This Period vs. Same Period Prior Year , Cst Region sliced (g) 1737
327 Yearly Sales Share by Region (g) 1738
328 Yearly Sales , Gross Profit Amt and Pct, Cst Region sliced (g) 1739
329 Yearly Sales by Region (g) 1740
330 Yearly Sales and Sales Growth , Cst Region sliced (g) 1741
331 Yearly Sales and Gross Profit , Cst Region sliced (g) 1742
332 Yearly Returns by Region (g) 1743
333 Yearly Qty Sold and Avg Unit Price, Cst Region sliced (g) 1744
334 Yearly Gross Profit Share by Region (g) 1745
335 Yearly Gross Profit Amt and Pct, Cst Region sliced (g) 1746
336 Yearly Gross Profit by Region (g) 1747
By Territory
337 Accrued Daily Sales , Quarter Comparison, Territory sliced (g) 1748
338 Accrued Daily Sales , Year Comparison, Territory sliced (g) 1749
339 Accrued Monthly Sales by Territory, Measures sliced (g) 1750
340 Accrued Monthly Sales and Gross Profit by Territory, Measures sliced (g) 1751
341 Accrued Monthly Returns by Territory, Measures sliced (g) 1752
342 Decomposition Tree- Sales This Year (g) 1753
343 Customer Size by Quarter, Territory and Size sliced (g) 1754
344 Product Sales Size by Quarter, Territory and Sales Size sliced (g) 1755
345 Monthly Gross Profit Comparison by Territory (g) 1756
346 Monthly Invoice Count by Territory (g) 1757
347 Monthly Returns by Territory (g) 1758
348 Monthly Sales and Gross Profit by Territory (g) 1759
349 Monthly Sales and Gross Profit Pct, Territory sliced (g) 1760
350 Monthly Sales and Sales Growth from Prior Period, Territory sliced (g) 1761
351 Monthly Sales by Territory (g) 1762
352 Monthly Sales Comparison by Territory (g) 1763
353 Nmbr of Invoices by Invoice Size and Territory (g) 1764
354 Nmbr of Invoices by Invoice Size and Territory, Measures sliced (g) 1765
355 Nmbr of Unique Salespeople with Sales by Territory (g) 1766
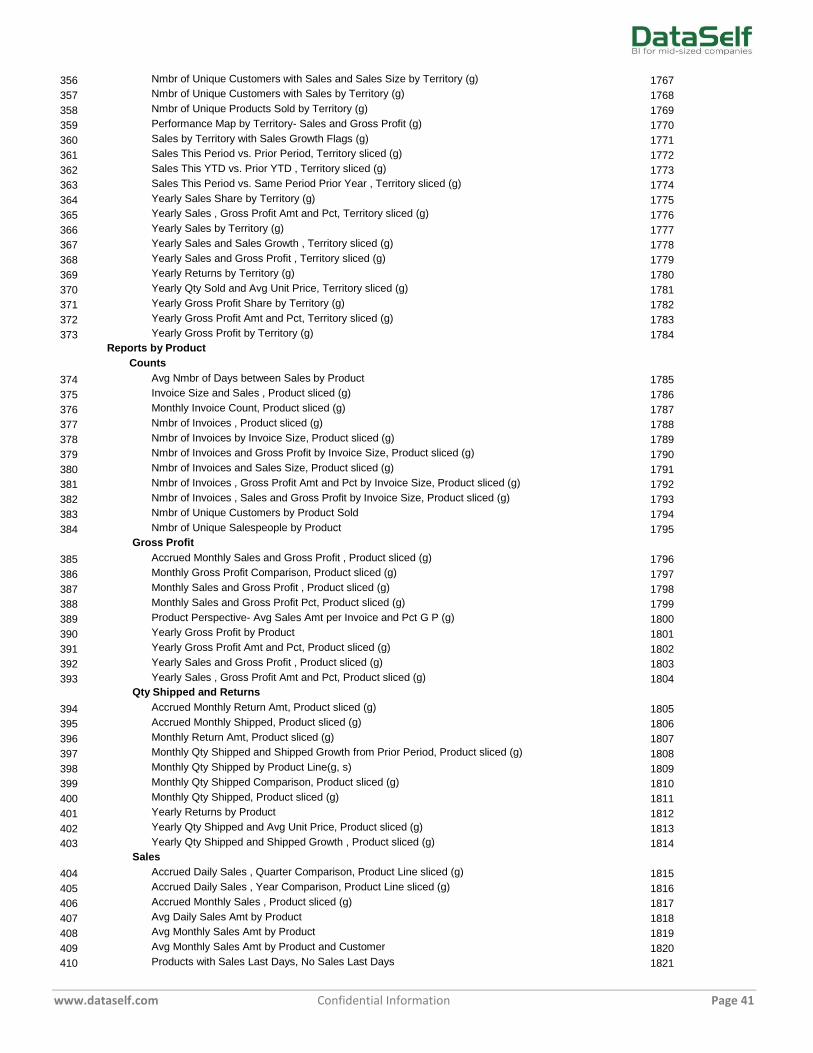
www.dataself.com Confidential Information Page 41
356 Nmbr of Unique Customers with Sales and Sales Size by Territory (g) 1767
357 Nmbr of Unique Customers with Sales by Territory (g) 1768
358 Nmbr of Unique Products Sold by Territory (g) 1769
359 Performance Map by Territory- Sales and Gross Profit (g) 1770
360 Sales by Territory with Sales Growth Flags (g) 1771
361 Sales This Period vs. Prior Period, Territory sliced (g) 1772
362 Sales This YTD vs. Prior YTD , Territory sliced (g) 1773
363 Sales This Period vs. Same Period Prior Year , Territory sliced (g) 1774
364 Yearly Sales Share by Territory (g) 1775
365 Yearly Sales , Gross Profit Amt and Pct, Territory sliced (g) 1776
366 Yearly Sales by Territory (g) 1777
367 Yearly Sales and Sales Growth , Territory sliced (g) 1778
368 Yearly Sales and Gross Profit , Territory sliced (g) 1779
369 Yearly Returns by Territory (g) 1780
370 Yearly Qty Sold and Avg Unit Price, Territory sliced (g) 1781
371 Yearly Gross Profit Share by Territory (g) 1782
372 Yearly Gross Profit Amt and Pct, Territory sliced (g) 1783
373 Yearly Gross Profit by Territory (g) 1784
Reports by Product
Counts
374 Avg Nmbr of Days between Sales by Product 1785
375 Invoice Size and Sales , Product sliced (g) 1786
376 Monthly Invoice Count, Product sliced (g) 1787
377 Nmbr of Invoices , Product sliced (g) 1788
378 Nmbr of Invoices by Invoice Size, Product sliced (g) 1789
379 Nmbr of Invoices and Gross Profit by Invoice Size, Product sliced (g) 1790
380 Nmbr of Invoices and Sales Size, Product sliced (g) 1791
381 Nmbr of Invoices , Gross Profit Amt and Pct by Invoice Size, Product sliced (g) 1792
382 Nmbr of Invoices , Sales and Gross Profit by Invoice Size, Product sliced (g) 1793
383 Nmbr of Unique Customers by Product Sold 1794
384 Nmbr of Unique Salespeople by Product 1795
Gross Profit
385 Accrued Monthly Sales and Gross Profit , Product sliced (g) 1796
386 Monthly Gross Profit Comparison, Product sliced (g) 1797
387 Monthly Sales and Gross Profit , Product sliced (g) 1798
388 Monthly Sales and Gross Profit Pct, Product sliced (g) 1799
389 Product Perspective- Avg Sales Amt per Invoice and Pct G P (g) 1800
390 Yearly Gross Profit by Product 1801
391 Yearly Gross Profit Amt and Pct, Product sliced (g) 1802
392 Yearly Sales and Gross Profit , Product sliced (g) 1803
393 Yearly Sales , Gross Profit Amt and Pct, Product sliced (g) 1804
Qty Shipped and Returns
394 Accrued Monthly Return Amt, Product sliced (g) 1805
395 Accrued Monthly Shipped, Product sliced (g) 1806
396 Monthly Return Amt, Product sliced (g) 1807
397 Monthly Qty Shipped and Shipped Growth from Prior Period, Product sliced (g) 1808
398 Monthly Qty Shipped by Product Line(g, s) 1809
399 Monthly Qty Shipped Comparison, Product sliced (g) 1810
400 Monthly Qty Shipped, Product sliced (g) 1811
401 Yearly Returns by Product 1812
402 Yearly Qty Shipped and Avg Unit Price, Product sliced (g) 1813
403 Yearly Qty Shipped and Shipped Growth , Product sliced (g) 1814
Sales
404 Accrued Daily Sales , Quarter Comparison, Product Line sliced (g) 1815
405 Accrued Daily Sales , Year Comparison, Product Line sliced (g) 1816
406 Accrued Monthly Sales , Product sliced (g) 1817
407 Avg Daily Sales Amt by Product 1818
408 Avg Monthly Sales Amt by Product 1819
409 Avg Monthly Sales Amt by Product and Customer 1820
410 Products with Sales Last Days, No Sales Last Days 1821
www.dataself.com Confidential Information Page 42
410 Products with Sales Last Days, No Sales Last Days 1821
411 Product Lines with Sales Last Days, No Sales Last Days 1822
412 Product Sales Size by Quarter 1823
413 Product Sales Size by Quarter, Sales Size sliced (g) 1824
414 Monthly Sales , Product sliced (g) 1825
415 Monthly Sales Comparison, Product sliced (g) 1826
416 Monthly Sales & Sales Growth from Prior Period, Product sliced (g) 1827
417 Monthly Sales by Product Line (g) 1828
418 Sales by Product 1829
419 Sales by Product and Customer 1830
420 Sales by Product Line 1831
421 Sales by Product Line and Customer 1832
422 Sales by Product Line and Customer Type 1833
423 Sales by Product Line, Product and Customer 1834
424 Sales by Product with Sales Growth Flags(f) 1835
425 Sales by Product Line with Sales Growth Flags(f) 1836
426 Sales This Period vs. Prior Period, Product sliced (g) 1837
427 Sales This Period vs. Same Period Prior Year , Product sliced (g) 1838
428 Sales This YTD vs. Prior YTD , Product sliced (g) 1839
429 Yearly Sales by Product 1840
430 Yearly Sales and Sales Growth , Product sliced (g) 1841
Reports by Salesperson
Counts
431 Avg Nmbr of Days between Sales by Salesperson 1842
432 Monthly Invoice Count, Salesperson sliced (g) 1843
433 Nmbr of Invoices by Invoice Size, Salesperson sliced (g) 1844
434 Nmbr of Invoices by Invoice Size and Salesperson 1845
435 Nmbr of Invoices and Gross Profit by Invoice Size, Salesperson sliced (g) 1846
436 Nmbr of Invoices and Sales by Invoice Size, Salesperson sliced (g) 1847
437 Nmbr of Invoices and Sales Size, Salesperson sliced (g) 1848
438 Nmbr of Invoices, GP Amt and Pct by Invoice Size, Salesperson sliced (g) 1849
439 Nmbr of Invoices, Sales and GP by Invoice Size, Salesperson sliced (g) 1850
440 Nmbr of Invoices by Salesperson (g) 1851
441 Nmbr of Unique Customers by Salesperson 1852
442 Nmbr of Unique Products Sold by Salesperson 1853
Gross Profit
443 Accrued Monthly Sales and Gross Profit , Salesperson sliced (g) 1854
444 Monthly Gross Profit Comparison, Salesperson sliced (g) 1855
445 Monthly Sales and Gross Profit , Salesperson sliced (g) 1856
446 Monthly Sales and Gross Profit Pct, Salesperson sliced (g) 1857
447 Salesperson Perspective- Avg Sales Amt per Invoice and Pct G P (g) 1858
448 Yearly Gross Profit by Salesperson 1859
449 Yearly Gross Profit Amt and Pct, Salesperson sliced (g) 1860
450 Yearly Sales and Gross Profit , Salesperson sliced (g) 1861
451 Yearly Sales , Gross Profit Amt and Pct, Salesperson sliced (g) 1862
Qty Shipped and Returns
452 Accrued Monthly Returns by Salesperson (g) 1863
453 Monthly Returns by Salesperson (g) 1864
454 Yearly Returns by Salesperson 1865
455 Yearly Qty Shipped and Avg Unit Price, Salesperson sliced (g) 1866
Sales
456 Accrued Daily Sales , Quarter Comparison, Salesperson sliced (g) 1867
457 Accrued Daily Sales , Year Comparison, Salesperson sliced (g) 1868
458 Accrued Monthly Sales by Salesperson (g) 1869
459 Avg Daily Sales Amt by Salesperson 1870
460 Avg Monthly Sales Amt by Salesperson 1871
461 Avg Monthly Sales Amt by Salesperson and Product 1872
462 Customer Size by Salesperson and Quarter, Measure sliced (g) 1873
463 Product Sales Size by Salesperson and Quarter, Measure sliced (g) 1874
464 Monthly Sales Comparison, Salesperson sliced (g) 1875
www.dataself.com Confidential Information Page 43
465 Monthly Sales by Salesperson (g) 1876
466 Monthly Sales and Sales Growth from Prior Period, Salesperson sliced (g) 1877
467 Sales by Salesperson 1878
468 Sales by Salespeople with Sales Growth Flags(f) 1879
469 Sales by Salesperson and Customer 1880
470 Sales by Salesperson, Customer and Product 1881
471 Sales by Salesperson, Customer and Product Line 1882
472 Sales by Salesperson and Customer Type 1883
473 Sales by Salesperson, Customer Type and Product 1884
474 Sales by Salesperson, Customer Type and Product Line 1885
475 Sales by Salesperson and Product 1886
476 Sales by Salesperson, Product and Customer 1887
477 Sales by Salesperson and Product Line 1888
478 Sales by Salesperson, Product Line and Product 1889
479 Sales by Salesperson, Product Line and Customer 1890
480 Sales This Period vs. Prior Period, Salesperson sliced (g) 1891
481 Sales This Period vs. Same Period Prior Year , Salesperson sliced (g) 1892
482 Sales This YTD vs. Prior YTD , Salesperson sliced (g) 1893
483 Stacked Accrued Sales by Salesperson by Period (g) 1894
484 Stacked Sales by Salesperson by Period (g) 1895
485 Yearly Sales and Sales Growth , Salesperson sliced (g) 1896
486 Yearly Sales by Salesperson (g) 1897
Reports by Ship-To
487 Sales by Customer Ship-To 1898
488 Sales by Customer Ship-To and Product 1899
489 Sales by Product and Customer Ship-To 1900
490 Sales by Salesperson, Customer Ship-To and Product 1901
491 Sales by Salesperson, Product and Customer Ship-To 1902
492 Sales by Warehouse and Customer Ship-To 1903
493 Sales by Customer Ship-To 1904
494 Sales by Customer Ship-To and Product 1905
495 Sales by Product and Customer Ship-To 1906
496 Sales by Salesperson, Product and Customer Ship-To 1907
497 Sales by Salesperson, Customer Ship-To and Product 1908
498 Sales by Warehouse and Customer Ship-To 1909
Sales Details
499 Sales Detail Cube Definitions 1910
500 Sales Detail Cube-Query Reset 1911
501 Sales Details in a Period by Customer 1912
502 Sales Details in a Period by Customer and Product 1913
503 Sales Details in a Period by Customer and Product Line 1914
504 Sales Details in a Period by Customer , Product Line and Product 1915
505 Sales Details in a Period by Product 1916
506 Sales Details in a Period by Product and Customer 1917
507 Sales Details in a Period by Product and Salesperson 1918
508 Sales Details in a Period by Product, Salesperson and Customer 1919
509 Sales Details in a Period by Product Line and Customer 1920
510 Sales Details in a Period by Product Line and Product 1921
511 Sales Details in a Period by Product Line and Salesperson 1922
512 Sales Details in a Period by Product Line, Customer and Product 1923
513 Sales Details in a Period by Product Line Product and Customer 1924
514 Sales Details in a Period by Product Line, Product and Salesperson 1925
515 Sales Details in a Period by Product Line, Salesperson and Product 1926
516 Sales Details in a Period by Salesperson 1927
517 Sales Details in a Period by Salesperson and Customer 1928
518 Sales Details in a Period by Salesperson, Customer and Product 1929
519 Sales Details in a Period by Salesperson, Customer and Product Line 1930
520 Sales Details in a Period by Salesperson and Product 1931
521 Sales Details in a Period by Salesperson, Product and Customer 1932
522 Sales Details in a Period by Salesperson and Product Line 1933
www.dataself.com Confidential Information Page 44
523 Sales Details in a Period by Salesperson, Product Line and Product 1934
524 Sales Details in a Period by Warehouse and Product 1935
525 Sales Details in a Period by Warehouse and Product Line 1936
Top and Bottom Performers
Customers
526 Nmbr of Invoices by Invoice Size and Top Customers (g) 1937
527 Sales of Top Customers by Top Products 1938
528 Sales by Top Customers This Year and Product 1939
529 Sales by Top Customers This Year and Salesperson 1940
530 Stacked Accrued Sales by Top Customers This Year by Period (g) 1941
531 Stacked Sales by Top Customers by Salesperson (g) 1942
532 Stacked Sales by Top Customers This Year by Customer Type (g) 1943
533 Stacked Sales by Top Customers This Year by Period (g) 1944
534 Stacked Sales by Top Customers This Year by Top Products (g) 1945
535 Top Customers by Avg Monthly Sales Amt Decrease ($000/mo) 1946
536 Top Customers by Avg Nmbr of Days between Sales Decrease (days) 1947
537 Top Customers by Nmbr of Invoices This Year (g) 1948
538 Top Customers by Nmbr of Large Invoices This Year (g) 1949
539 Top Customers by Nmbr of Small Invoices This Year (g) 1950
540 Top Customers by Nmbr of Unique Products This Year (g) 1951
541 Top Customers by Return Amt This Year (g) 1952
542 Top Customers by Gross Profit Last Year (g) 1953
543 Top Customers by Gross Profit This Year (g) 1954
544 Top Customers by Lowest Gross Profit Last Year (g) 1955
545 Top Customers by Lowest Gross Profit This Year (g) 1956
546 Top Customers by Sales Amt Decrease This Year vs. Prior Year (g) 1957
547 Top Customers by Sales Amt Decrease This YTD vs. Prior YTD (g) 1958
548 Top Customers by Sales Amt Increase This Year vs. Prior Year (g) 1959
549 Top Customers by Sales Amt Increase This YTD vs. Prior YTD (g) 1960
550 Top Customers by Sales Last Year (g) 1961
551 Top Customers by Sales This Year (g) 1962
552 Top Customers by Sales This Year with Sales Growth Flags(g, f) 1963
553 Top Customers by Sales Last YTD (g) 1964
554 Top Customers by Sales This YTD (g) 1965
555 Customers Representing 0% of Sales Last Year (g) 1966
556 Customers Representing 0% of Sales This Year (g) 1967
557 Customers Representing 0% of Gross Profit Last Year (g) 1968
558 Customers Representing 0% of Gross Profit This Year (g) 1969
Products
559 Sales by Top Products This Year and Customer 1970
560 Sales of Top Products by Salesperson 1971
561 Sales of Top Products to Top Customers 1972
562 Stacked Accrued Sales by Top Products This Year by Period (g) 1973
563 Stacked Sales by Top Products This Year by Period (g) 1974
564 Stacked Sales by Top Products This Year by Customer Type (g) 1975
565 Stacked Sales by Top Products This Year by Top Customers (g) 1976
566 Top Products by Avg Monthly Sales Amt Decrease ($000/mo) 1977
567 Top Products by Avg Nmbr of Days between Sales Decrease (days) 1978
568 Top Products by Nmbr of Invoices This Year (g) 1979
569 Top Products by Nmbr of Unique Customers This Year (g) 1980
570 Top Products by Qty Returned This Year (g) 1981
571 Top Products by Qty Shipped Decrease This Year vs. Prior Year (g) 1982
572 Top Products by Qty Shipped Increase This Year vs. Prior Year (g) 1983
573 Top Products by Qty Shipped Last Year (g) 1984
574 Top Products by Qty Shipped This Year (g) 1985
575 Top Products by Return Amt This Year (g) 1986
576 Top Products by Gross Profit Last Year (g) 1987
577 Top Products by Gross Profit This Year (g) 1988
578 Top Products by Negative Gross Profit Last Year (g) 1989
579 Top Products by Negative Gross Profit This Year (g) 1990
www.dataself.com Confidential Information Page 45
580 Top Products by Sales Amt Decrease This Year vs. Prior Year (g) 1991
581 Top Products by Sales Amt Decrease This YTD vs. Prior YTD (g) 1992
582 Top Products by Sales Amt Increase This Year vs. Prior Year (g) 1993
583 Top Products by Sales Amt Increase This YTD vs. Prior YTD (g) 1994
584 Top Products by Sales Last Year (g) 1995
585 Top Products by Sales This Year (g) 1996
586 Top Products by Sales This Year with Sales Growth Flags(g, f) 1997
587 Top Products by Sales Last YTD (g) 1998
588 Top Products by Sales This YTD (g) 1999
589 Products Representing 0% of Sales Last Year (g) 2000
590 Products Representing 0% of Sales This Year (g) 2001
591 Products Representing 0% of Gross Profit Last Year (g) 2002
592 Products Representing 0% of Gross Profit This Year (g) 2003
Salespeople
593 Nmbr of Invoices by Invoice Size and Top Salespeople (g) 2004
594 Stacked Sales by Salesperson by Top Products (g) 2005
595 Top Salespeople by Gross Profit This Year (g) 2006
596 Top Salespeople by Nmbr of Invoices This Year (g) 2007
597 Top Salespeople by Nmbr of Large Invoices This Year (g) 2008
598 Top Salespeople by Nmbr of Small Invoices This Year (g) 2009
599 Top Salespeople by Nmbr of Unique Customers This Year (g) 2010
600 Top Salespeople by Nmbr of Unique Products This Year (g) 2011
601 Top Salespeople by Return Amt This Year (g) 2012
602 Top Salespeople by Sales Amt Decrease This Year vs. Prior Year (g) 2013
603 Top Salespeople by Sales Amt Decrease This YTD vs. Prior YTD (g) 2014
604 Top Salespeople by Sales Amt Increase This Year vs. Prior Year (g) 2015
605 Top Salespeople by Sales Amt Increase This YTD vs. Prior YTD (g) 2016
606 Top Salespeople by Sales Last Year (g) 2017
607 Top Salespeople by Sales This Year (g) 2018
608 Top Salespeople by Sales This Year with Sales Growth Flags(g, f) 2019
609 Top Salespeople by Sales Last YTD (g) 2020
610 Top Salespeople by Sales This YTD (g) 2021
Advanced Analysis
611 Perspective- Customer , Sales and G P 2022
612 Perspective- Product, Sales and G P 2023
613 Decomposition Tree, Sales by Customer (g) 2024
614 Decomposition Tree, Sales by Customer Region (g) 2025
615 Decomposition Tree, Sales by Product (g) 2026
616 Decomposition Tree, Sales by Product Line (g) 2027
617 Decomposition Tree, Sales by Salespeople (g) 2028
618 Performance Map by Customer - Sales and Gross Profit (g) 2029
619 Performance Map by Customer - Sales and Nmbr of Invoices (g) 2030
620 Performance Map by Customer Type- Sales and Gross Profit (g) 2031
621 Performance Map by Customer Region- Sales and Gross Profit (g) 2032
622 Performance Map by Product- Sales and Gross Profit (g) 2033
623 Performance Map by Product- Sales and Nmbr of Invoices (g) 2034
624 Performance Map by Product Class- Sales and Gross Profit (g) 2035
625 Performance Map by Product Type- Sales and Gross Profit (g) 2036
626 Performance Map by Product Line- Sales and Gross Profit (g) 2037
627 Performance Map by Salesperson- Sales and Gross Profit (g) 2038
628 Performance Map by Salesperson- Sales and Nmbr of Invoices (g) 2039
629 Performance Map by Territory- Sales and Gross Profit (g) 2040
Sales Commissions
Too many mid-size organizations spend hours and even days every month
The DataSelf BI Sales Commission Module automates the commission calculation process. Managers can usually
generate commission reports — even progress reports — at any time.
Other advantages:
• The Sales Commissions Module can be easily customized for each client’s specific needs.
• The module lets organizations calculate commissions immediately after month-end closing, not days or weeks later.
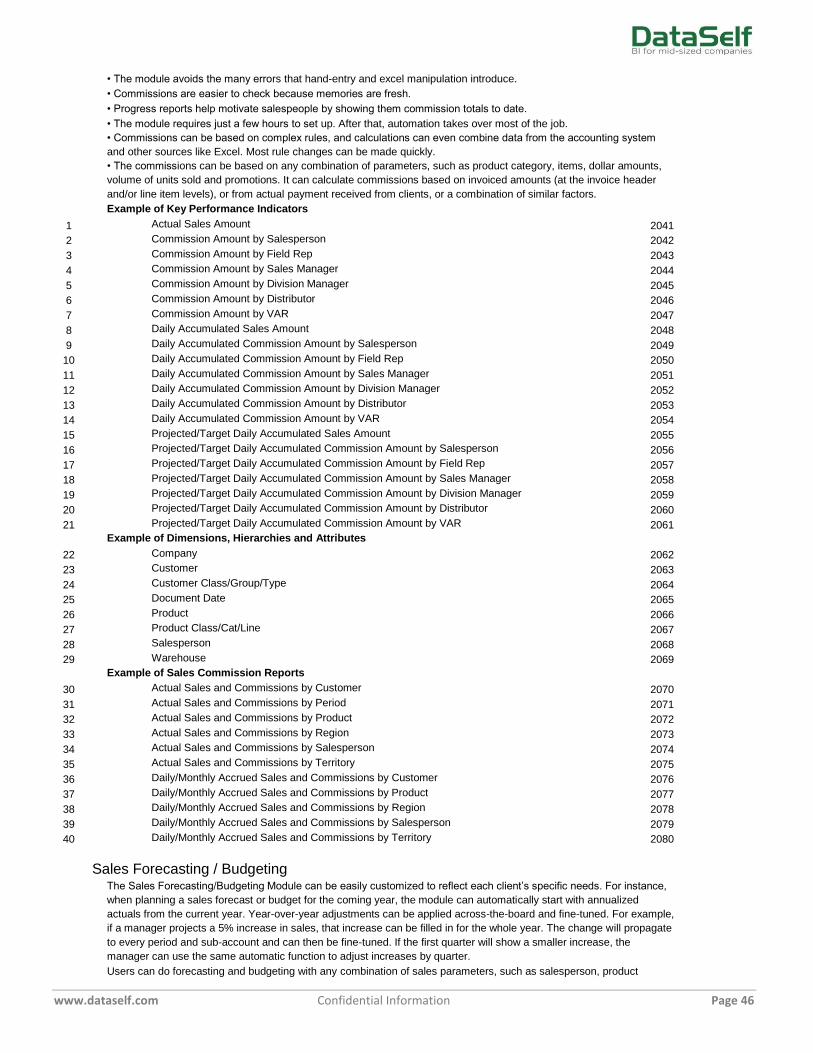
www.dataself.com Confidential Information Page 46
• The module avoids the many errors that hand-entry and excel manipulation introduce.
• Commissions are easier to check because memories are fresh.
• Progress reports help motivate salespeople by showing them commission totals to date.
• The module requires just a few hours to set up. After that, automation takes over most of the job.
• Commissions can be based on complex rules, and calculations can even combine data from the accounting system
and other sources like Excel. Most rule changes can be made quickly.
• The commissions can be based on any combination of parameters, such as product category, items, dollar amounts,
volume of units sold and promotions. It can calculate commissions based on invoiced amounts (at the invoice header
and/or line item levels), or from actual payment received from clients, or a combination of similar factors.
Example of Key Performance Indicators
1 Actual Sales Amount 2041
2 Commission Amount by Salesperson 2042
3 Commission Amount by Field Rep 2043
4 Commission Amount by Sales Manager 2044
5 Commission Amount by Division Manager 2045
6 Commission Amount by Distributor 2046
7 Commission Amount by VAR 2047
8 Daily Accumulated Sales Amount 2048
9 Daily Accumulated Commission Amount by Salesperson 2049
10 Daily Accumulated Commission Amount by Field Rep 2050
11 Daily Accumulated Commission Amount by Sales Manager 2051
12 Daily Accumulated Commission Amount by Division Manager 2052
13 Daily Accumulated Commission Amount by Distributor 2053
14 Daily Accumulated Commission Amount by VAR 2054
15 Projected/Target Daily Accumulated Sales Amount 2055
16 Projected/Target Daily Accumulated Commission Amount by Salesperson 2056
17 Projected/Target Daily Accumulated Commission Amount by Field Rep 2057
18 Projected/Target Daily Accumulated Commission Amount by Sales Manager 2058
19 Projected/Target Daily Accumulated Commission Amount by Division Manager 2059
20 Projected/Target Daily Accumulated Commission Amount by Distributor 2060
21 Projected/Target Daily Accumulated Commission Amount by VAR 2061
Example of Dimensions, Hierarchies and Attributes
22 Company 2062
23 Customer 2063
24 Customer Class/Group/Type 2064
25 Document Date 2065
26 Product 2066
27 Product Class/Cat/Line 2067
28 Salesperson 2068
29 Warehouse 2069
Example of Sales Commission Reports
30 Actual Sales and Commissions by Customer 2070
31 Actual Sales and Commissions by Period 2071
32 Actual Sales and Commissions by Product 2072
33 Actual Sales and Commissions by Region 2073
34 Actual Sales and Commissions by Salesperson 2074
35 Actual Sales and Commissions by Territory 2075
36 Daily/Monthly Accrued Sales and Commissions by Customer 2076
37 Daily/Monthly Accrued Sales and Commissions by Product 2077
38 Daily/Monthly Accrued Sales and Commissions by Region 2078
39 Daily/Monthly Accrued Sales and Commissions by Salesperson 2079
40 Daily/Monthly Accrued Sales and Commissions by Territory 2080
Sales Forecasting / Budgeting
The Sales Forecasting/Budgeting Module can be easily customized to reflect each client’s specific needs. For instance,
when planning a sales forecast or budget for the coming year, the module can automatically start with annualized
actuals from the current year. Year-over-year adjustments can be applied across-the-board and fine-tuned. For example,
if a manager projects a 5% increase in sales, that increase can be filled in for the whole year. The change will propagate
to every period and sub-account and can then be fine-tuned. If the first quarter will show a smaller increase, the
manager can use the same automatic function to adjust increases by quarter.
Users can do forecasting and budgeting with any combination of sales parameters, such as salesperson, product
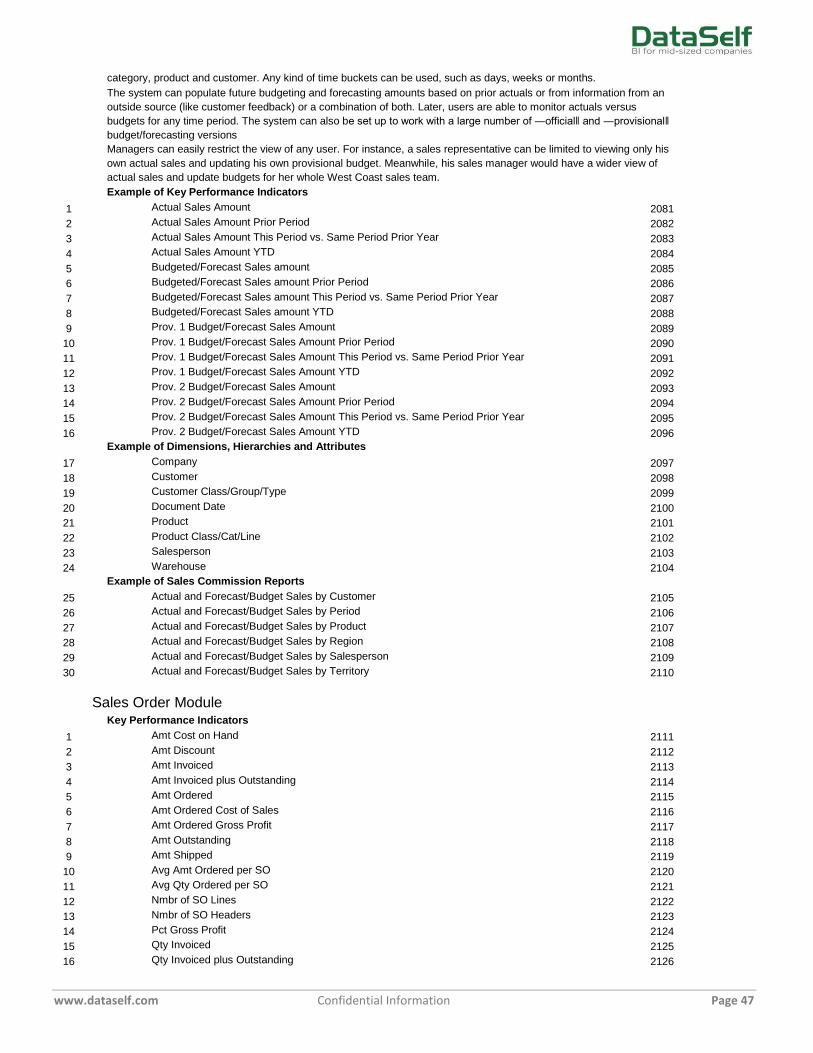
www.dataself.com Confidential Information Page 47
category, product and customer. Any kind of time buckets can be used, such as days, weeks or months.
The system can populate future budgeting and forecasting amounts based on prior actuals or from information from an
outside source (like customer feedback) or a combination of both. Later, users are able to monitor actuals versus
budgets for any time period. The system can also be set up to work with a large number of ―official‖ and ―provisional‖
budget/forecasting versions
Managers can easily restrict the view of any user. For instance, a sales representative can be limited to viewing only his
own actual sales and updating his own provisional budget. Meanwhile, his sales manager would have a wider view of
actual sales and update budgets for her whole West Coast sales team.
Example of Key Performance Indicators
1 Actual Sales Amount 2081
2 Actual Sales Amount Prior Period 2082
3 Actual Sales Amount This Period vs. Same Period Prior Year 2083
4 Actual Sales Amount YTD 2084
5 Budgeted/Forecast Sales amount 2085
6 Budgeted/Forecast Sales amount Prior Period 2086
7 Budgeted/Forecast Sales amount This Period vs. Same Period Prior Year 2087
8 Budgeted/Forecast Sales amount YTD 2088
9 Prov. 1 Budget/Forecast Sales Amount 2089
10 Prov. 1 Budget/Forecast Sales Amount Prior Period 2090
11 Prov. 1 Budget/Forecast Sales Amount This Period vs. Same Period Prior Year 2091
12 Prov. 1 Budget/Forecast Sales Amount YTD 2092
13 Prov. 2 Budget/Forecast Sales Amount 2093
14 Prov. 2 Budget/Forecast Sales Amount Prior Period 2094
15 Prov. 2 Budget/Forecast Sales Amount This Period vs. Same Period Prior Year 2095
16 Prov. 2 Budget/Forecast Sales Amount YTD 2096
Example of Dimensions, Hierarchies and Attributes
17 Company 2097
18 Customer 2098
19 Customer Class/Group/Type 2099
20 Document Date 2100
21 Product 2101
22 Product Class/Cat/Line 2102
23 Salesperson 2103
24 Warehouse 2104
Example of Sales Commission Reports
25 Actual and Forecast/Budget Sales by Customer 2105
26 Actual and Forecast/Budget Sales by Period 2106
27 Actual and Forecast/Budget Sales by Product 2107
28 Actual and Forecast/Budget Sales by Region 2108
29 Actual and Forecast/Budget Sales by Salesperson 2109
30 Actual and Forecast/Budget Sales by Territory 2110
Sales Order Module
Key Performance Indicators
1 Amt Cost on Hand 2111
2 Amt Discount 2112
3 Amt Invoiced 2113
4 Amt Invoiced plus Outstanding 2114
5 Amt Ordered 2115
6 Amt Ordered Cost of Sales 2116
7 Amt Ordered Gross Profit 2117
8 Amt Outstanding 2118
9 Amt Shipped 2119
10 Avg Amt Ordered per SO 2120
11 Avg Qty Ordered per SO 2121
12 Nmbr of SO Lines 2122
13 Nmbr of SO Headers 2123
14 Pct Gross Profit 2124
15 Qty Invoiced 2125
16 Qty Invoiced plus Outstanding 2126
www.dataself.com Confidential Information Page 48
17 Qty On Hand 2127
18 Qty Ordered 2128
19 Qty Outstanding 2129
20 Qty Shipped 2130
21 Amt Back Ordered ToDate 2131
22 Amt Outstanding ToDate 2132
23 Qty Back Ordered ToDate 2133
24 Qty Outstanding ToDate 2134
Dimensions, Hierarchies and Attributes
Company
25 Company Id 2135
26 Company Id Name 2136
27 Company Name 2137
Customer
28 Account Manager 2138
29 Credit Limit 2139
30 Credit On Hold 2140
31 Customer Group/Type 2141
32 Customer Id 2142
33 Customer Id Name 2143
34 Customer Name 2144
35 Customer Address 2145
36 Customer City 2146
37 Customer State 2147
38 Customer Zip/PC 2148
39 Customer Country 2149
40 Days in Business with Us 2150
41 Division 2151
42 National Account 2152
43 Payment Terms 2153
44 Territory 2154
Document Date
45 a Season 2155
46 a Date 2156
47 a Day of Period 2157
48 a Day of Quarter 2158
49 a Day of Week 2159
50 a Day of Year 2160
51 a Period 2161
52 a Period Name 2162
53 a Quarter 2163
54 a Quarter Name 2164
55 a Week 2165
56 a Week of Year 2166
57 a Year 2167
58 Date 2168
59 Period 2169
60 Quarter 2170
61 Rolling Half Year 2171
62 Rolling Month 2172
63 Rolling Quarter 2173
64 Rolling Week 2174
65 Rolling Year 2175
66 td Period 2176
67 td Quarter 2177
68 td Year 2178
69 Year 2179
Expected Ship Date
70 a Season 2180
71 a Date 2181
www.dataself.com Confidential Information Page 49
72 a Day of Period 2182
73 a Day of Quarter 2183
74 a Day of Week 2184
75 a Day of Year 2185
76 a Period 2186
77 a Period Name 2187
78 a Quarter 2188
79 a Quarter Name 2189
80 a Week 2190
81 a Week of Year 2191
82 a Year 2192
83 Date 2193
84 Period 2194
85 Quarter 2195
86 Rolling Half Year 2196
87 Rolling Month 2197
88 Rolling Quarter 2198
89 Rolling Week 2199
90 Rolling Year 2200
91 td Period 2201
92 td Quarter 2202
93 td Year 2203
94 Year 2204
Product
95 Product Description 2205
96 Product Id 2206
97 Product Id Description 2207
98 Product Line/Cat/Class Description 2208
99 Product Line/Cat/Class Id 2209
100 Product Line/Cat/Class Id Description 2210
101 Quantity On Hand 2211
102 Unit Cost 2212
103 Unit of Measure 2213
104 Unit Price 2214
Sales Order Line
105 Customer 2215
106 Date Document 2216
107 Days Late 2217
108 Document Number 2218
109 Document Type 2219
110 Expected Ship Date 2220
111 On Time Flag 2221
112 Payment Terms 2222
113 Product 2223
114 Product Class/Cat/Line 2224
115 Salesperson 2225
116 SO Status 2226
117 Unit of Measure 2227
118 Warehouse 2228
Salesperson
119 Salesperson Id 2229
120 Salesperson Id Name 2230
121 Salesperson Name 2231
Warehouse
122 Warehouse Id 2232
123 Warehouse Id Name 2233
124 Warehouse Name 2234
Reports by Company
125 Amt Gross Profit by Required Date, Company sliced (g) 2235
126 Amt Outstanding and Back Ordered for Next Periods, Company sliced (g) 2236
www.dataself.com Confidential Information Page 50
127 Amt Outstanding by Required Date, Company sliced (g) 2237
128 Avg Order Amt by Company 2238
129 Sales History and Outstanding Orders by Required Date, Company sliced (g) 2239
Reports by Customer
130 Avg Order Amt by Customer 2240
131 Avg Order Amt by Customer and Product 2241
132 Open Orders by Customer and Days Late 2242
133 Open Orders by Customer , Product and Days Late, Measures sliced 2243
134 Open Orders by Customer and Required Date 2244
135 Open Orders by Customer , Product and Required Date, Measures sliced 2245
136 Orders Placed This Period by Customer and Required Date 2246
137 Orders Placed This Period by Customer , Product and Required Date, Amts 2247
138 Sales History and Open Orders by Customer , Customers sliced (g) 2248
139 Sales History and Open Orders by Customer & Salesperson, Measures sliced (g) 2249
140 Sales History and Open Orders by Customer and Product, Measures sliced (g) 2250
141 To Date Amt Outstanding and Back ordered by Customer 2251
142 To Date Amt Outstanding and Back ordered by Customer and Product 2252
143 Total Open Orders by Customer 2253
144 Total Open Orders by Customer and Product 2254
145 Total Open Orders by Customer and Product Line 2255
Reports by Customer Region
146 Avg Order Amt by Region (g) 2256
147 Open Orders by Region and Days Late (g) 2257
148 Orders Placed This Period by Region and Required Date 2258
149 Sales History and Outstanding Orders by Region, Customer sliced (g) 2259
150 To Date Amt Outstanding and Back ordered by Region (g) 2260
151 Total Open Orders by Region (g) 2261
Reports by Product
152 Avg Order Amt by Product 2262
153 Avg Order Amt by Product and Customer 2263
154 Open Orders by Product and Days Late, Measures sliced 2264
155 Open Orders by Product, Customer and Days Late, Measures sliced) 2265
156 Open Orders by Product, Salesperson and Days Late, Measures sliced 2266
157 Open Orders by Product and Required Date, Measures sliced 2267
158 Open Orders by Product, Customer and Required Date, Measures sliced 2268
159 Open Orders by Product, Salesperson and Required Date, Measures sliced 2269
160 Orders Placed This Period by Product and Required Date, Amts 2270
161 Orders Placed This Period by Product and Required Date, Qties 2271
162 Orders Placed This Period by Product, Customer and Required Date, Amts 2272
163 Orders Placed This Period by Product, Salesperson and Required Date, Amts 2273
164 Sales History and Open Orders by Product, Product sliced (g) 2274
165 Sales History and Open Orders by Product and Customer , Measures sliced (g) 2275
166 Sales History and Open Orders by Product & Salesperson, Measures sliced (g) 2276
167 Total Open Orders by Product 2277
168 Total Open Orders by Product and Customer 2278
169 Total Open Orders by Product and Salesperson 2279
170 Total Open Orders by Product and Warehouse 2280
171 Total Open Orders by Product, Customer and Salesperson 2281
172 Total Open Orders by Product, Salespeople and Customer 2282
173 Total Open Orders by Product Line 2283
174 Total Open Orders by Product Line and Customer 2284
175 Total Open Orders by Product Line and Product 2285
176 Total Open Orders by Product Line and Salespeople 2286
177 Total Open Orders by Product Line and Warehouse 2287
178 Total Open Orders by Product Line, Customer and Salesperson 2288
179 Total Open Orders by Product Line, Salesperson and Customer 2289
180 To Date Qty Outstanding and Back ordered by Product 2290
181 To Date Qty Outstanding and Back ordered by Product and Customer 2291
182 To Date Qty Outstanding and Back ordered by Product and Salesperson 2292
Reports by Salesperson
www.dataself.com Confidential Information Page 51
183 Avg Order Amt by Salesperson 2293
184 Open Orders by Salesperson and Days Late 2294
185 Open Orders by Salesperson, Customer and Days Late, Measures sliced 2295
186 Open Orders by Salesperson, Product and Days Late, Measures sliced 2296
187 Open Orders by Salesperson and Required Date, Measures sliced 2297
188 Open Orders by Salesperson, Customer and Required Date, Measures sliced 2298
189 Open Orders by Salesperson, Product and Required Date, Measures sliced 2299
190 Orders Placed This Period by Salesperson and Required Date 2300
191 Orders Placed This Period by Salesperson, Customer and Required Date 2301
192 Orders Placed This Period by Salesperson, Product and Required Date, Amts 2302
193 Sales History and Open Orders by Salesperson, Salesperson sliced (g) 2303
194 Sales History and Open Orders by Salesp & Customer , Measures sliced (g) 2304
195 Sales History and Open Orders by Salesp and Product, Measures sliced (g) 2305
196 Total Open Orders by Salesperson 2306
197 Total Open Orders by Salesperson and Customer 2307
198 Total Open Orders by Salesperson and Product 2308
199 Total Open Orders by Salesperson and Product Line 2309
200 Total Open Orders by Salesperson and Warehouse 2310
201 Total Open Orders by Salesperson, Customer and Product 2311
202 Total Open Orders by Salesperson, Product and Customer 2312
203 To Date Amt Outstanding and Back ordered by Salesperson 2313
204 To Date Amt Outstanding and Back ordered by Salesperson and Customer 2314
205 To Date Qty Outstanding and Back ordered by Salesperson and Product 2315
Sales Order Details Reports
206 Sales Order Details by Customer This Period 2316
207 Sales Order Details by Customer and Product This Period 2317
208 Sales Order Details by Product This Period 2318
209 Sales Order Details by Product and Customer This Period 2319
210 Sales Order Details by Product and Salesperson This Period 2320
211 Sales Order Details by Salesperson This Period 2321
212 Sales Order Details by Salesperson and Customer This Period 2322
213 Sales Order Details by Salesperson and Product This Period 2323
Top and Bottom Performers Reports
214 Decomposition Tree- Customer Outstanding Amt (g) 2324
215 Decomposition Tree-Region Outstanding Amt (g) 2325
216 Decomposition Tree- Product Outstanding Amt (g) 2326
217 Decomposition Tree- Salespeople Outstanding Amt (g) 2327
218 Performance Map by Customer - Outstanding Amt and Gross Profit (g) 2328
219 Performance Map by Region- Outstanding Amt and Gross Profit (g) 2329
220 Performance Map by Product- Outstanding Amt and Gross Profit (g) 2330
221 Performance Map by Salesperson- Outstanding Amt and Gross Profit (g) 2331
222 Top Customers by Gross Profit Amt (g) 2332
223 Top Customers by Late Outstanding Amt and Invoiced Amt 2333
224 Top Customers by Outstanding Amt (g) 2334
225 Top Customers by Outstanding Amt plus Invoiced Amt (g) 2335
226 Top Product by Gross Profit Amt (g) 2336
227 Top Products by Late Outstanding Qty and Invoiced Qty 2337
228 Top Products by Outstanding Amt (g) 2338
229 Top Products by Outstanding Qty (g) 2339
230 Top Products by Outstanding Amt plus Invoiced Amt (g) 2340
231 Top Regions by Gross Profit Amt (g) 2341
232 Top Regions by Late Outstanding Amt and Invoiced Amt 2342
233 Top Regions by Outstanding Amt (g) 2343
234 Top Regions by Outstanding Amt plus Invoiced Amt (g) 2344
235 Top Salespeople by Gross Profit Amt (g) 2345
236 Top Salespeople by Late Outstanding Amt and Invoiced Amt 2346
237 Top Salespeople by Outstanding Amt (g) 2347
238 Top Salespeople by Outstanding Amt plus Invoiced Amt (g) 2348
End of document


