LINKER-BASED LECITHIN MICROEMULSIONS
AS TRANSDERMAL DRUG DELIVERY SYSTEMS
By
Jessica Shuhong Yuan
A thesis submitted in conformity with the requirements
for the degree of Doctor of Philosophy
Graduate Department of Chemical Engineering and Applied Chemistry
University of Toronto
©Copyright by Jessica Shuhong Yuan 2009
ii
Linker-based lecithin microemulsions as transdermal drug delivery systems
Doctor of philosophy, 2009
Jessica Shuhong Yuan
Department of Chemical Engineering and Applied Chemistry
University of Toronto
ABSTRACT
The interest in microemulsions as transdermal delivery systems have been motivated by their
large surface area for mass transfer, their high solubilization capacity of hydrophobic actives,
and their ability to improve skin penetration. Lecithins (mixtures of phospholipids similar to
those find in the skin) have been proposed as ideal surfactants in microemulsions due to their
skin compatibility. Unfortunately, their incorporation into microemulsions used to require toxic
medium-chain alcohols or viscous polymeric co-surfactants. Recently, microemulsion-base
“green solvents” were formulated with lecithin and linker molecules. The main objective of this
dissertation was to test this concept of linker-based lecithin microemulsions in transdermal
delivery.
In the first part of this study, linker-based lecithin formulations were developed using soybean
lecithin as main surfactant, sorbitol monooleate as lipophilic linker, and caprylic acid/sodium
caprylate as hydrophilic linkers. These additives, at the suggested concentration, are safe for
cosmetic and pharmaceutical applications. The low toxicity of these formulations was confirmed
in cultured human skin tissues. The solubilization and permeation of a common anaesthetic,
lidocaine, was evaluated. The concept of “skin” permeability was introduced to account for the
differences in solvent-skin partition when comparing different delivery systems. The linker-
iii
based lecithin microemulsion produced a substantial absorption of lidocaine into the skin, when
compared to a conventional pentanol-lecithin microemulsion. The second part of this study
takes advantage of the lidocaine adsorbed in the skin with the linker-based lecithin
microemulsion as reservoir for in situ skin patches. The in situ patches were able to release 90%
of the lidocaine over 24 hours, which is comparable to the release profile obtained from
conventional polymer or gel-based patches. In the third part of this work, the role of surfactant
droplets on the transport of lidocaine was studied. A mass balance model that accounted for mass
transfer and partition coefficients was introduced. The parameters generated from the model
confirm that in most cases the transport through the skin limits the overall penetration of
lidocaine. Besides the conventional diffusion mechanism, the results suggest that surfactant
droplets, carrying lidocaine, also penetrate into the skin and contribute to the accumulation of the
lidocaine in the skin.
iv
ACKNOWLEDGEMENTS
I would like to express my sincere gratitude to:
• Professor. Edgar J. Acosta, my supervisor, for his intellectual guidance, endless support, and constant encouragement as an incredible driving force throughout the entire course of this project. I have been amazingly fortunate to have an advisor who gave me the freedom to explore on my own, and at the same time the guidance to recover when my steps faltered.
• Professor Levente L. Diosady, Professor Ping Lee, Professor Christine Allen and Professor
Pu Chen (University of Waterloo), my committee members, for their advice, insightful comments, and constructive criticisms at different stages of the research. I am grateful to them for holding me to a high research standard and enforcing strict validations for each research result.
• Professor X. Y. Wen from Department of Medicine, for his guidance in fluorescence
microscopy technology and kindness to share the facility. • The Government of Ontario for Ontario Graduate Scholarship (OGS) 2008-2009, the
Government of Ontario/DuPont Canada Scholarship in Science and Technology (OGSST) 2007-2008, and the Government of Ontario/McLean Foundation Graduate Scholarship in Science and Technology (OGSST) 2006-2007 for the financial support in pursuing this degree.
• The Innovations group at University of Toronto, especially Mr. Ian Stewart, for assisting in
the applications of a patent and Ontario Research and Commercialization Program grant from the Canada Foundation for Innovation, which contributes to the economical support of this work.
• The Society of Cosmetics Chemists (SCC) Ontario Chapter, especially Dr. Dennis Zuccolin,
for providing me the opportunities to discuss this work with people in the cosmeceutical industry.
• My fellow researchers in the Laboratory of Colloid and Formulation Engineering (LCFE):
Floryunuen Garcia Becerra, Gelareh Bankian-Tabrizi, Sumit Kiran, Arti Bhakta, Nga Phuong Nguyen, Carol Xuan, Jacquelene Phia Chu, Alice Yip, Chong Liang, Micheline Samaan, Maham Ansari, and Suniya Quraishi for their discussion, friendship and smiles.
• The staff of Chemical Engineering and Applied Chemistry Department with all
administrative of this work. • My husband, Ted Liao, for his support, encouragement, concern and unwavering love within
the past four years; my parents, especially my farther Mr. Famao Yuan, for their faith in me and allowing me to be as ambitious as I wanted; My kids, Sonya and Tim, who have taught me to enjoy life outside the lab.
v
TABLE OF CONTENTS
ABSTRACT................................................................................................................................... ii
ACKNOWLEDGEMENTS ........................................................................................................ iv
TABLE OF CONTENTS ............................................................................................................. v
LIST OF FIGURES ..................................................................................................................... ix
LIST OF TABLES ..................................................................................................................... xiii
CHAPTER 1 OVERVIEW .....................................................................................................- 1 -
1.1 OVERVIEW.......................................................................................................................- 2 -
1.2 HYPOTHESIS ...................................................................................................................- 5 -
1.3 SPECIFIC OBJECTIVES..................................................................................................- 5 -
1.4 THESIS OUTLINE............................................................................................................- 6 -
1.5 INDUSTRIAL SIGNIFICANCE ........................................................................................- 7 -
1.6 REFERENCES ..................................................................................................................- 8 -
CHAPTER 2 BACKGROUND.............................................................................................- 10 -
2.1 TRANSDERMAL DRUG DELIVERY .............................................................................- 11 -
2.1.1 The skin barrier ........................................................................................................- 12 -
2.1.2 Routes of skin penetration .......................................................................................- 13 -
2.1.3 Drugs........................................................................................................................- 14 -
2.1.4 Formulation approaches...........................................................................................- 15 -
2.2 MICROEMULSIONS ......................................................................................................- 16 -
2.2.1 Structures .................................................................................................................- 17 -
2.2.2 Formation.................................................................................................................- 18 -
2.2.3 Dynamic behaviour..................................................................................................- 19 -
2.2.4 Advantages and disadvantages ................................................................................- 20 -
2.2.5 Formulation constraints ...........................................................................................- 22 -
2.2.6 Lecithin microemulsions..........................................................................................- 24 -
2.3 LINKER MOLECULES IN MICROEMULSIONS ..........................................................- 28 -
2.3.1 Lipophilic linker.......................................................................................................- 28 -
2.3.2 Hydrophilic linker....................................................................................................- 29 -
vi
2.3.3 Self-assembly between hydrophilic and lipophilic linkers ......................................- 30 -
2.3.4 Difference with other additives................................................................................- 31 -
2.3.5 Linker-based lecithin microemulsions.....................................................................- 33 -
2.4 CONCLUSIONS..............................................................................................................- 33 -
2.5 SCOPE ............................................................................................................................- 35 -
2.6 REFERENCES ................................................................................................................- 37 -
CHAPTER 3 LINKER-BASED LECITHIN MICROEMULSIONS FOR TRANSDERMAL DELIVERY OF LIDOCAINE ..............................................................- 43 -
3.1 ABSTRACT......................................................................................................................- 44 -
3.2 INTRODUCTION ...........................................................................................................- 44 -
3.3 MATERIALS AND METHODS.......................................................................................- 49 -
3.3.1 Materials ..................................................................................................................- 49 -
3.3.2 Microemulsion preparation......................................................................................- 50 -
3.3.3 Physicochemical characterization............................................................................- 53 -
3.3.4 Lidocaine partitioning studies..................................................................................- 53 -
3.3.5 In vitro permeation studies.......................................................................................- 53 -
3.3.6 In vitro cytotoxicity studies .....................................................................................- 55 -
3.3.7 Lidocaine quantification ..........................................................................................- 55 -
3.3.8 Statistical data analysis ............................................................................................- 56 -
3.4 RESULTS AND DISCUSSION........................................................................................- 56 -
3.4.1 Phase behaviour .......................................................................................................- 56 -
3.4.2 Physicochemical characterization............................................................................- 63 -
3.4.3 Lidocaine partitioning between microemulsion and excess phases.........................- 66 -
3.4.4 Permeation flux and permeability............................................................................- 67 -
3.4.5 Cytotoxicity..............................................................................................................- 74 -
3.5 CONCLUSIONS..............................................................................................................- 76 -
3.6 REFERNECES ................................................................................................................- 77 -
CHAPTER 4 EXTENDED RELEASE OF LIDOCAINE FROM LINKER-BASED LECITHIN MICROEMULSIONS .......................................................................................- 82 -
4.1 ABSTRACT......................................................................................................................- 83 -
4.2 INTRODUCTION ...........................................................................................................- 83 -
vii
4.3 MATERIALS AND METHODS.......................................................................................- 86 -
4.3.1 Materials ..................................................................................................................- 86 -
4.3.2 Microemulsion preparation......................................................................................- 87 -
4.3.3 In vitro extended release studies ..............................................................................- 88 -
4.3.4 Fluorescence Microscopy ........................................................................................- 90 -
4.4 RESULTS AND DISCUSSION........................................................................................- 91 -
4.4.1 In vitro extended release ..........................................................................................- 91 -
4.4.4.1 Effect of formulation conditions: drug loading and microemulsion morphology - 91 -
4.4.4.2 Drug release kinetics.............................................................................................- 94 -
4.4.4.3 Effect of application conditions: dosage and application time ...........................- 100 -
4.4.2 Microscopic observations ......................................................................................- 104 -
4.5 CONCLUSIONS............................................................................................................- 105 -
4.6 REFERENCES ..............................................................................................................- 106 -
CHAPTER 5 EFFECT OF SURFACTANT CONCENTRATION ON TRANSERMAL DELIVERY OF LIDOCAINE WITH LINKER-BASED LECITHIN MICROMEULSIONS .................................................................................................................................................- 108 -
5.1 ABSTRACT....................................................................................................................- 109 -
5.2 INTRODUCTION .........................................................................................................- 110 -
5.3 MATERIALS AND METHODS.....................................................................................- 112 -
5.3.1 Materials ................................................................................................................- 112 -
5.3.2 Microemulsion preparation and selection..............................................................- 113 -
5.3.3 In vitro permeation studies.....................................................................................- 116 -
5.3.4 Fluorescence studies ................................................................................................................ - 119-
5.4 RESULTS AND DISCUSSION......................................................................................- 119 -
5.4.1 Phase behaviour .....................................................................................................- 119 -
5.4.2 Particle size ............................................................................................................- 120 -
5.4.3 Effect of surfactant on drug partitioning into microemulsions..............................- 122 -
5.4.4 Effect of surfactant on lidocaine absorption in the skin ........................................- 123 -
5.4.5 In vitro permeation parameters ..............................................................................- 125 -
5.4.6 Effect of surfactant on transdermal flux ................................................................- 133 -
5.4.7 Fluorescence studies ................................................................................................................ - 136 -
5.5 CONCLUSIONS............................................................................................................- 137 -
viii
5.6 REFERENCES ..............................................................................................................- 138 -
CHAPTER 6 CONCLUSIONS AND FUTURE RECOMMENDATIONS....................- 141 -
6.1 CONCLUSIONS............................................................................................................- 142 -
6.2 RECOMMENDATIONS FOR FUTURE WORK ..........................................................- 145 -
6.3 REFERENCES ..............................................................................................................- 149 -
APPENDIX 1 EFFECT OF OILS ON LINKER-BASED LECITHIN MICROEMULSIONS FOR TRANSDERMAL DELIVERY OF LIDOCAINE............- 150 -
APPENDIX 2 EFFECT OF DRUGS ON LINKER-BASED LECITHIN MICROEMULSIONS FOR TRANSDERMAL DELIVERY ..........................................- 167 -
ix
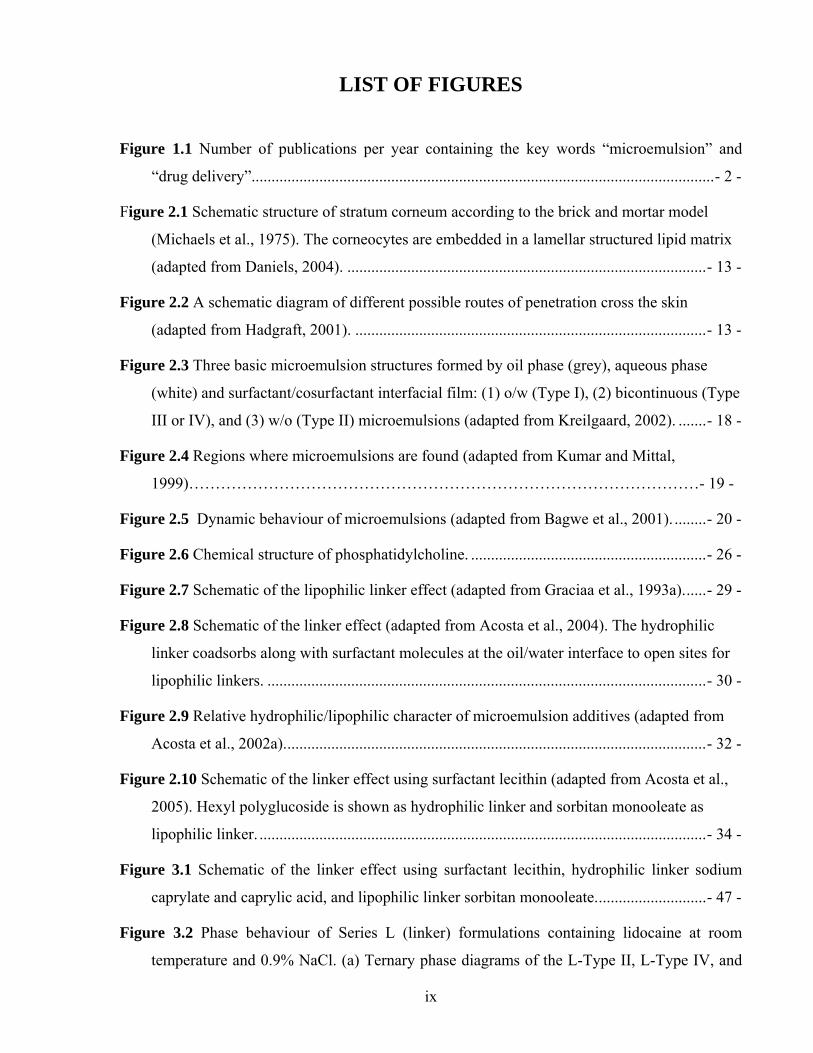
LIST OF FIGURES
Figure 1.1 Number of publications per year containing the key words “microemulsion” and
“drug delivery”....................................................................................................................- 2 -
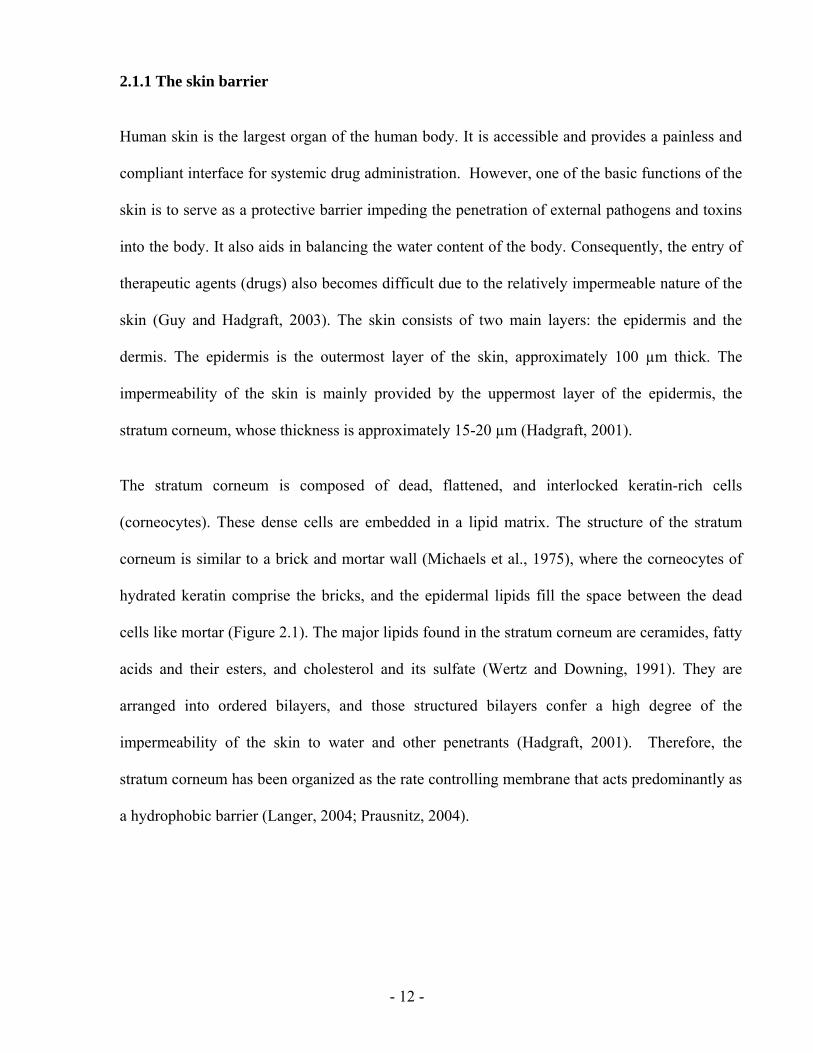
Figure 2.1 Schematic structure of stratum corneum according to the brick and mortar model
(Michaels et al., 1975). The corneocytes are embedded in a lamellar structured lipid matrix
(adapted from Daniels, 2004). ..........................................................................................- 13 -
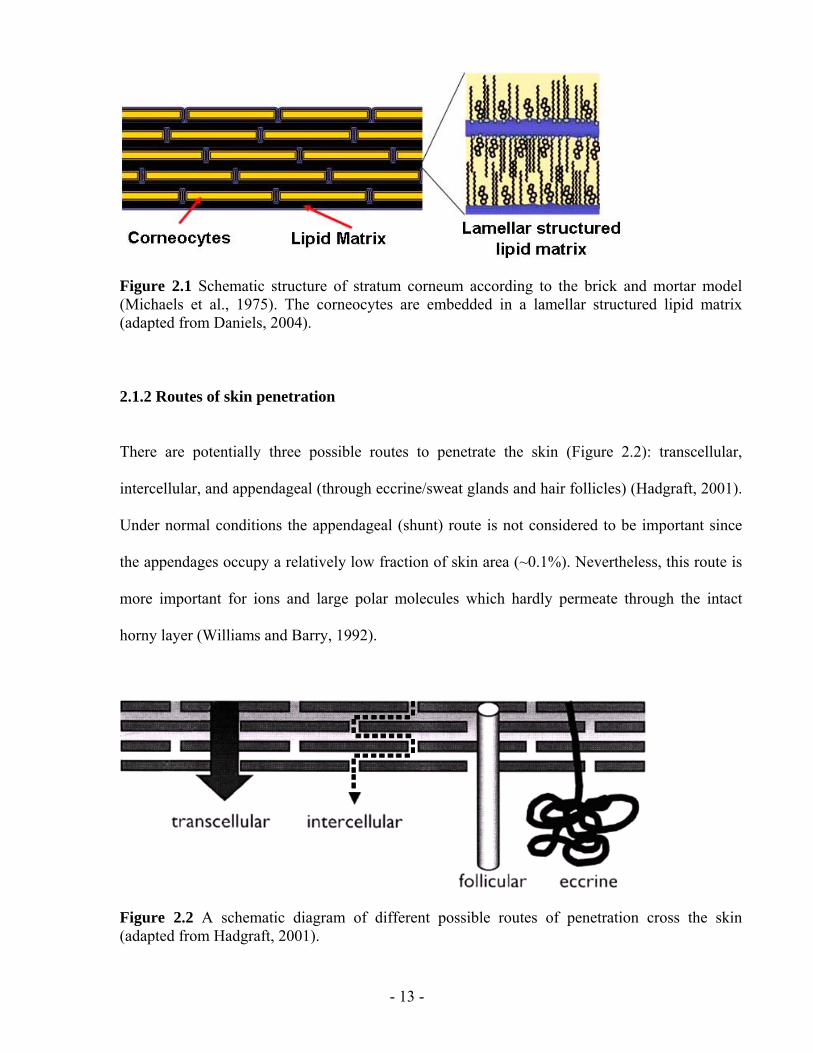
Figure 2.2 A schematic diagram of different possible routes of penetration cross the skin
(adapted from Hadgraft, 2001). ........................................................................................- 13 -
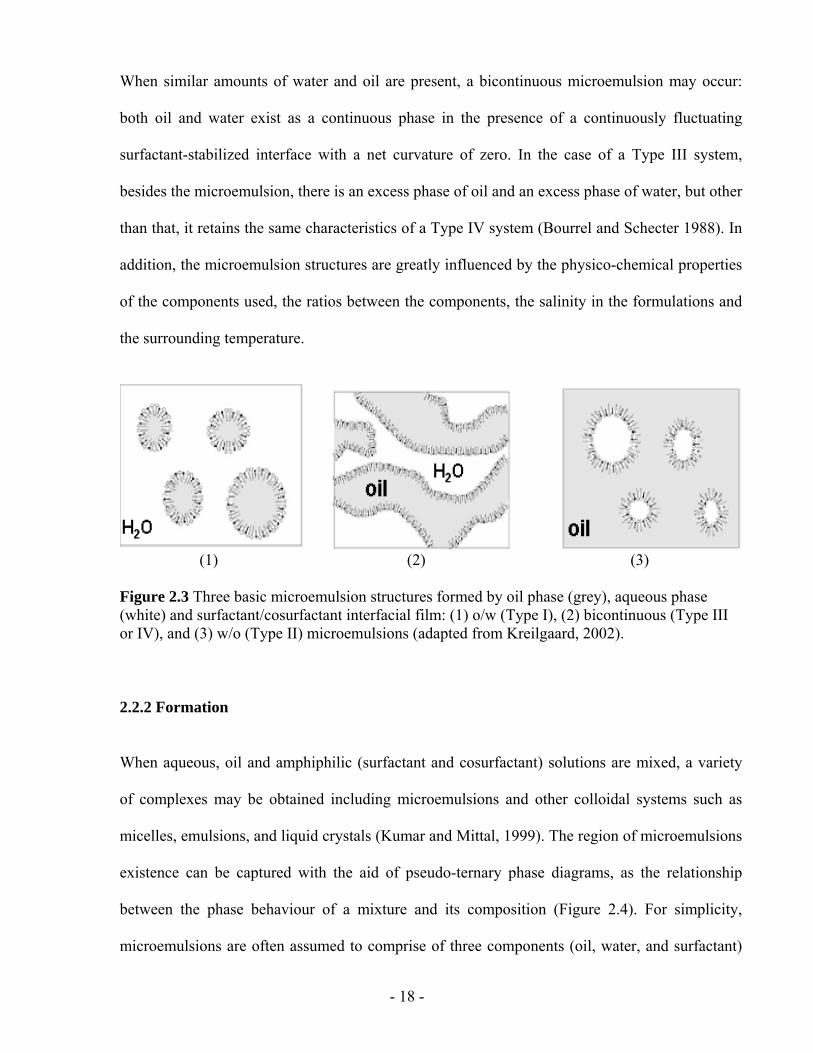
Figure 2.3 Three basic microemulsion structures formed by oil phase (grey), aqueous phase
(white) and surfactant/cosurfactant interfacial film: (1) o/w (Type I), (2) bicontinuous (Type
III or IV), and (3) w/o (Type II) microemulsions (adapted from Kreilgaard, 2002). .......- 18 -
Figure 2.4 Regions where microemulsions are found (adapted from Kumar and Mittal,
1999)……………………………………………………………………………………- 19 -
Figure 2.5 Dynamic behaviour of microemulsions (adapted from Bagwe et al., 2001). ........- 20 -
Figure 2.6 Chemical structure of phosphatidylcholine. ...........................................................- 26 -
Figure 2.7 Schematic of the lipophilic linker effect (adapted from Graciaa et al., 1993a)......- 29 -
Figure 2.8 Schematic of the linker effect (adapted from Acosta et al., 2004). The hydrophilic
linker coadsorbs along with surfactant molecules at the oil/water interface to open sites for
lipophilic linkers. ..............................................................................................................- 30 -
Figure 2.9 Relative hydrophilic/lipophilic character of microemulsion additives (adapted from
Acosta et al., 2002a)..........................................................................................................- 32 -
Figure 2.10 Schematic of the linker effect using surfactant lecithin (adapted from Acosta et al.,
2005). Hexyl polyglucoside is shown as hydrophilic linker and sorbitan monooleate as
lipophilic linker. ................................................................................................................- 34 -
Figure 3.1 Schematic of the linker effect using surfactant lecithin, hydrophilic linker sodium
caprylate and caprylic acid, and lipophilic linker sorbitan monooleate............................- 47 -
Figure 3.2 Phase behaviour of Series L (linker) formulations containing lidocaine at room
temperature and 0.9% NaCl. (a) Ternary phase diagrams of the L-Type II, L-Type IV, and
x
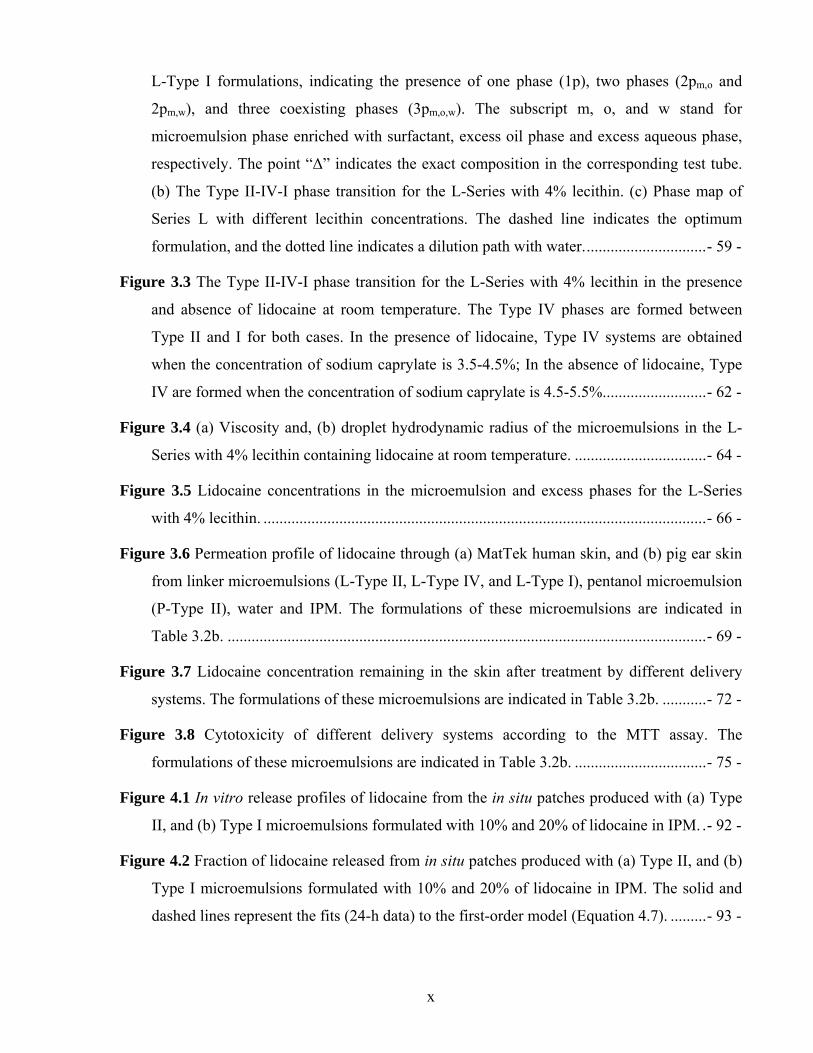
L-Type I formulations, indicating the presence of one phase (1p), two phases (2pm,o and
2pm,w), and three coexisting phases (3pm,o,w). The subscript m, o, and w stand for
microemulsion phase enriched with surfactant, excess oil phase and excess aqueous phase,
respectively. The point “Δ” indicates the exact composition in the corresponding test tube.
(b) The Type II-IV-I phase transition for the L-Series with 4% lecithin. (c) Phase map of
Series L with different lecithin concentrations. The dashed line indicates the optimum
formulation, and the dotted line indicates a dilution path with water...............................- 59 -
Figure 3.3 The Type II-IV-I phase transition for the L-Series with 4% lecithin in the presence
and absence of lidocaine at room temperature. The Type IV phases are formed between
Type II and I for both cases. In the presence of lidocaine, Type IV systems are obtained
when the concentration of sodium caprylate is 3.5-4.5%; In the absence of lidocaine, Type
IV are formed when the concentration of sodium caprylate is 4.5-5.5%..........................- 62 -
Figure 3.4 (a) Viscosity and, (b) droplet hydrodynamic radius of the microemulsions in the L-
Series with 4% lecithin containing lidocaine at room temperature. .................................- 64 -
Figure 3.5 Lidocaine concentrations in the microemulsion and excess phases for the L-Series
with 4% lecithin. ...............................................................................................................- 66 -
Figure 3.6 Permeation profile of lidocaine through (a) MatTek human skin, and (b) pig ear skin
from linker microemulsions (L-Type II, L-Type IV, and L-Type I), pentanol microemulsion
(P-Type II), water and IPM. The formulations of these microemulsions are indicated in
Table 3.2b. ........................................................................................................................- 69 -
Figure 3.7 Lidocaine concentration remaining in the skin after treatment by different delivery
systems. The formulations of these microemulsions are indicated in Table 3.2b. ...........- 72 -
Figure 3.8 Cytotoxicity of different delivery systems according to the MTT assay. The
formulations of these microemulsions are indicated in Table 3.2b. .................................- 75 -
Figure 4.1 In vitro release profiles of lidocaine from the in situ patches produced with (a) Type
II, and (b) Type I microemulsions formulated with 10% and 20% of lidocaine in IPM. .- 92 -
Figure 4.2 Fraction of lidocaine released from in situ patches produced with (a) Type II, and (b)
Type I microemulsions formulated with 10% and 20% of lidocaine in IPM. The solid and
dashed lines represent the fits (24-h data) to the first-order model (Equation 4.7). .........- 93 -
xi
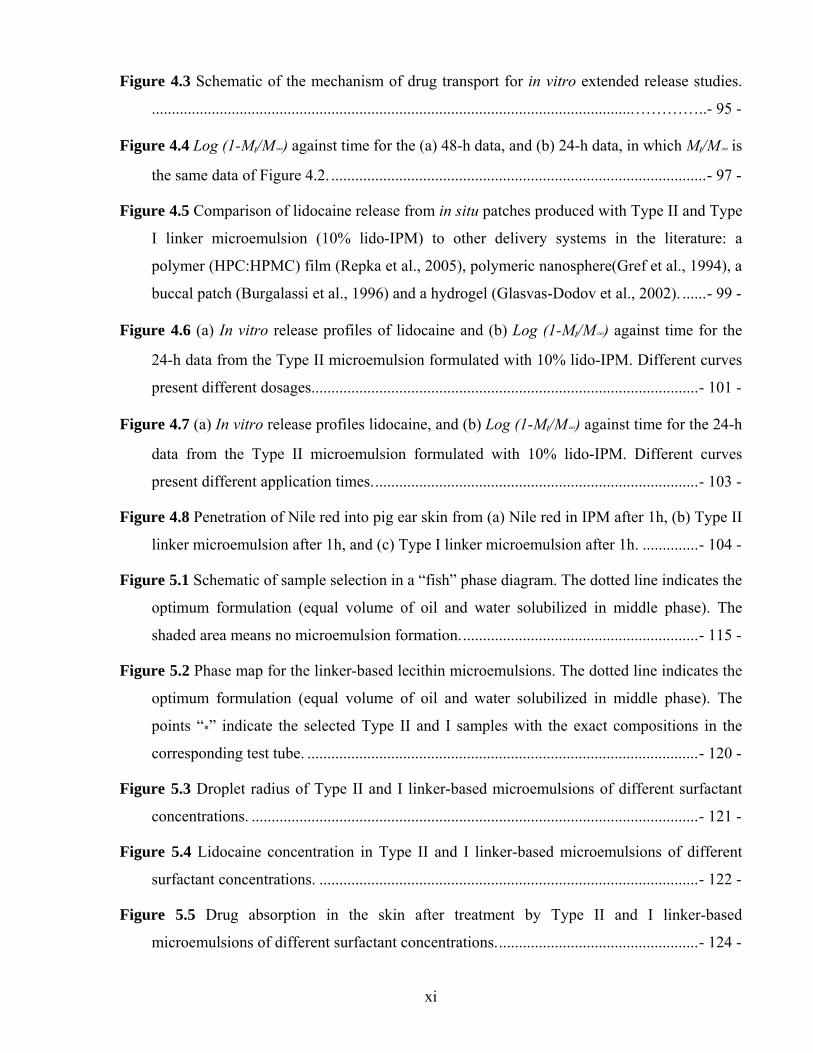
Figure 4.3 Schematic of the mechanism of drug transport for in vitro extended release studies.
.........................................................................................................................…………..- 95 -
Figure 4.4 Log (1-Mt/M∞) against time for the (a) 48-h data, and (b) 24-h data, in which Mt/M∞ is
the same data of Figure 4.2. ..............................................................................................- 97 -
Figure 4.5 Comparison of lidocaine release from in situ patches produced with Type II and Type
I linker microemulsion (10% lido-IPM) to other delivery systems in the literature: a
polymer (HPC:HPMC) film (Repka et al., 2005), polymeric nanosphere(Gref et al., 1994), a
buccal patch (Burgalassi et al., 1996) and a hydrogel (Glasvas-Dodov et al., 2002). ......- 99 -
Figure 4.6 (a) In vitro release profiles of lidocaine and (b) Log (1-Mt/M∞) against time for the
24-h data from the Type II microemulsion formulated with 10% lido-IPM. Different curves
present different dosages.................................................................................................- 101 -
Figure 4.7 (a) In vitro release profiles lidocaine, and (b) Log (1-Mt/M∞) against time for the 24-h
data from the Type II microemulsion formulated with 10% lido-IPM. Different curves
present different application times..................................................................................- 103 -
Figure 4.8 Penetration of Nile red into pig ear skin from (a) Nile red in IPM after 1h, (b) Type II
linker microemulsion after 1h, and (c) Type I linker microemulsion after 1h. ..............- 104 -
Figure 5.1 Schematic of sample selection in a “fish” phase diagram. The dotted line indicates the
optimum formulation (equal volume of oil and water solubilized in middle phase). The
shaded area means no microemulsion formation............................................................- 115 -
Figure 5.2 Phase map for the linker-based lecithin microemulsions. The dotted line indicates the
optimum formulation (equal volume of oil and water solubilized in middle phase). The
points “*” indicate the selected Type II and I samples with the exact compositions in the
corresponding test tube. ..................................................................................................- 120 -
Figure 5.3 Droplet radius of Type II and I linker-based microemulsions of different surfactant
concentrations. ................................................................................................................- 121 -
Figure 5.4 Lidocaine concentration in Type II and I linker-based microemulsions of different
surfactant concentrations. ...............................................................................................- 122 -
Figure 5.5 Drug absorption in the skin after treatment by Type II and I linker-based
microemulsions of different surfactant concentrations...................................................- 124 -
xii
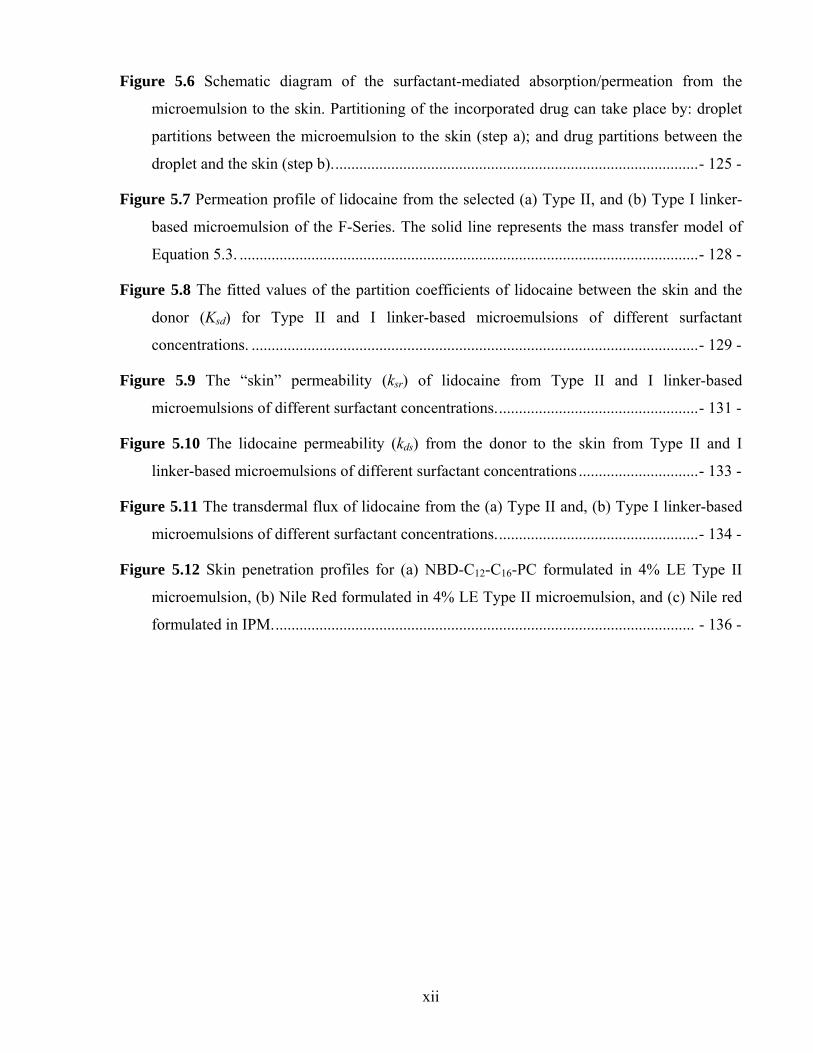
Figure 5.6 Schematic diagram of the surfactant-mediated absorption/permeation from the
microemulsion to the skin. Partitioning of the incorporated drug can take place by: droplet
partitions between the microemulsion to the skin (step a); and drug partitions between the
droplet and the skin (step b)............................................................................................- 125 -
Figure 5.7 Permeation profile of lidocaine from the selected (a) Type II, and (b) Type I linker-
based microemulsion of the F-Series. The solid line represents the mass transfer model of
Equation 5.3. ...................................................................................................................- 128 -
Figure 5.8 The fitted values of the partition coefficients of lidocaine between the skin and the
donor (Ksd) for Type II and I linker-based microemulsions of different surfactant
concentrations. ................................................................................................................- 129 -
Figure 5.9 The “skin” permeability (ksr) of lidocaine from Type II and I linker-based
microemulsions of different surfactant concentrations...................................................- 131 -
Figure 5.10 The lidocaine permeability (kds) from the donor to the skin from Type II and I
linker-based microemulsions of different surfactant concentrations ..............................- 133 -
Figure 5.11 The transdermal flux of lidocaine from the (a) Type II and, (b) Type I linker-based
microemulsions of different surfactant concentrations...................................................- 134 -
Figure 5.12 Skin penetration profiles for (a) NBD-C12-C16-PC formulated in 4% LE Type II
microemulsion, (b) Nile Red formulated in 4% LE Type II microemulsion, and (c) Nile red
formulated in IPM.......................................................................................................... - 136 -
xiii
LIST OF TABLES
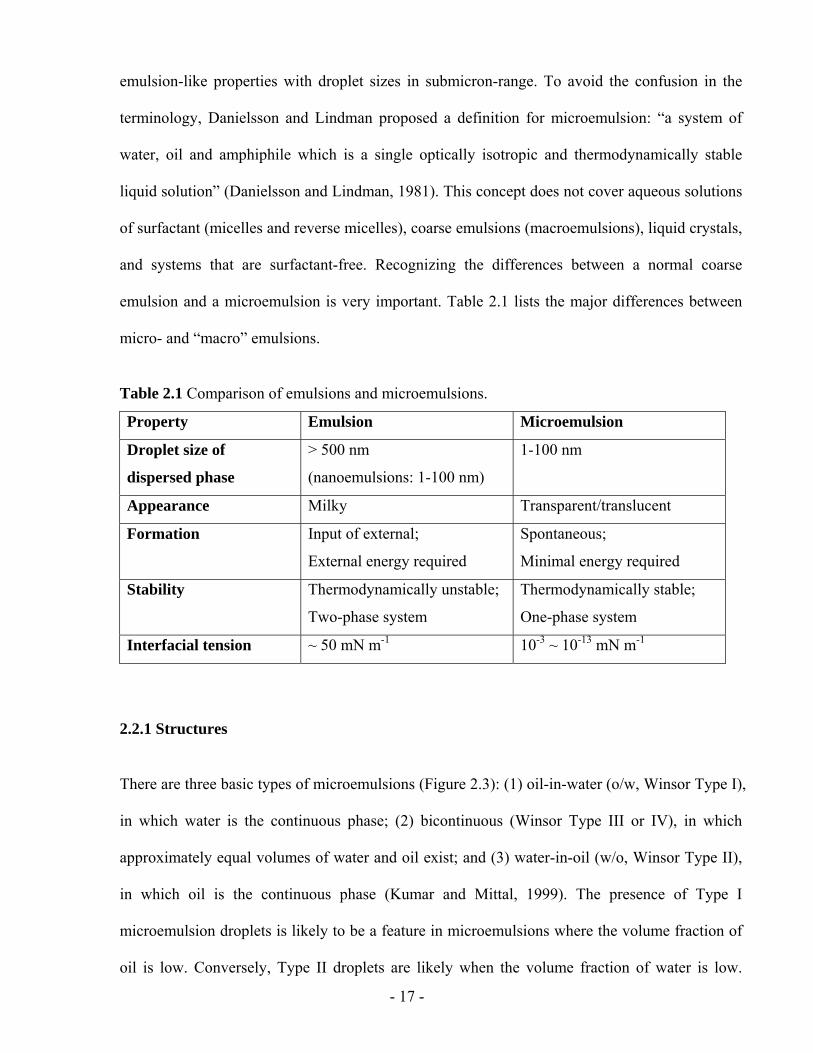
Table 2.1 Comparison of emulsions and microemulsions. ......................................................- 17 -
Table 3.1 Toxicological information for the materials used in microemulsions .....................- 47 -
Table 3.2 (a) The compositions of the linker microemulsions with different sorbitan monooleate
to lecithin ratios (%, w/w).................................................................................................- 51 -
Table 3.3 The steady-state flux (J, µg/h/cm2) of lidocaine, through MatTek human skin and pig
ear skin from different delivery systems...........................................................................- 69 -
Table 3.4 The normal permeability (kp, ×103 cm/h) and “skin” permeability (ksr, ×103 cm/h) of
lidocaine calculated for two types of skin sources............................................................- 73 -
Table 4.1 Compositions of Type II and Type I linker-based lecithin microemulsions (%, w/w)
...................................................................................................................………………- 88 -
Table 4.2 Formulation and release kinetic parameters: lidocaine loading in microemulsions,
initial drug absorption in the skin (Cs0, mg/ml), release rate constants of lidocaine (ksr, ×103
cm/h) and the time required to reach 50% release (t50% , h) calculated by the first-order
model fitted to the 24 h release data. ................................................................................- 92 -
Table 5.1 The compositions of the linker-based lecithin microemulsions from Series A to L with
different surfactant and linker concentrations (%, w/w).................................................- 114 -
Table 5.2 Effect of increasing surfactant concentration on permeation parameters. .............- 134 -

- 1 -
CHAPTER 1
OVERVIEW
- 2 -
1.1 OVERVIEW
In recent years, microemulsions have attracted considerable interest as promising colloidal drug
delivery vehicles (Bagwe et al., 2001; Lawrence and Rees, 2000; Tenjarla, 1999). There are
many advantages for microemulsions in pharmaceutical applications over other systems,
including high solubilization capacity for both water-soluble and oil-soluble drugs,
thermodynamic stability, transparency, and ease of preparation. Searching the database
SciFinder® with “microemulsion” and “drug delivery” as key words retrieved over fifteen
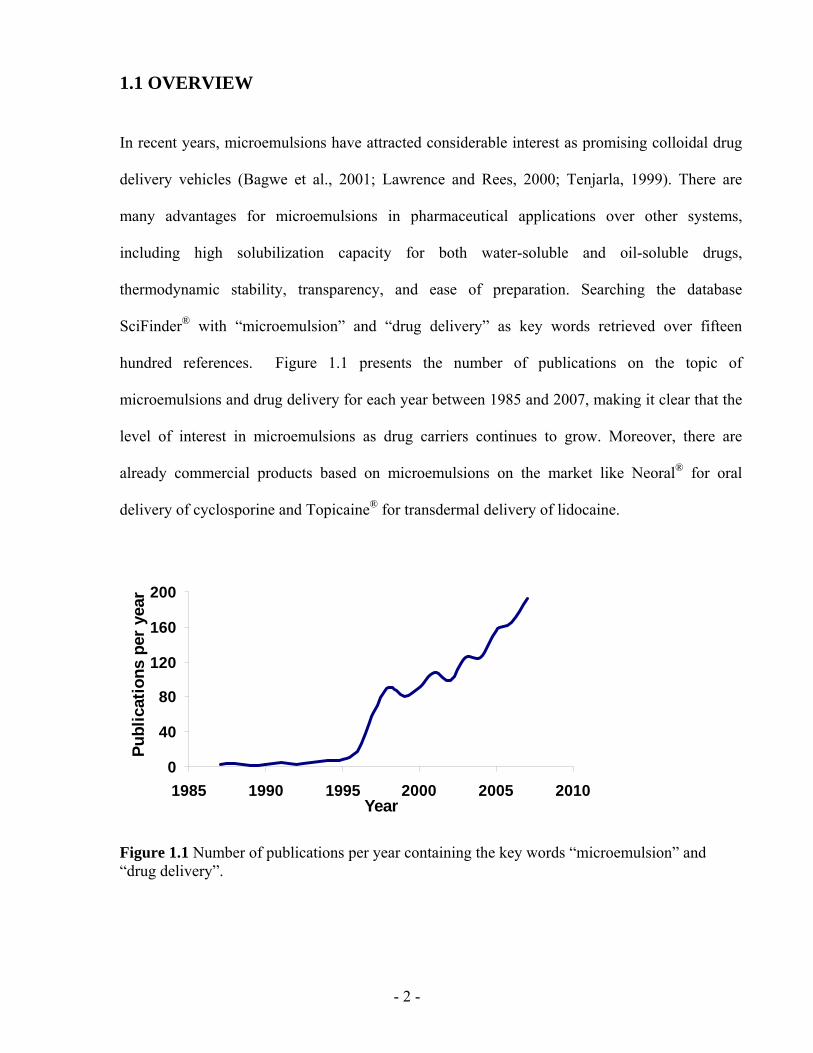
hundred references. Figure 1.1 presents the number of publications on the topic of
microemulsions and drug delivery for each year between 1985 and 2007, making it clear that the
level of interest in microemulsions as drug carriers continues to grow. Moreover, there are
already commercial products based on microemulsions on the market like Neoral® for oral
delivery of cyclosporine and Topicaine® for transdermal delivery of lidocaine.
0
40
80
120
160
200
1985 1990 1995 2000 2005 2010Year
Publ
icat
ions
per
yea
r
Figure 1.1 Number of publications per year containing the key words “microemulsion” and “drug delivery”.
- 3 -
Transdermal drug delivery (TDD) is a method of drug delivery in which a drug is administered
by skin absorption, such as a patch. A well designed TDD system reduces drug degradation, side
effects and patient discomfort (Amann and Osborne, 1990; Guy and Hadgraft, 2003). Because of
the barrier properties of the skin, particularly stratum corneum (Michaels et al., 1975), only
potent drugs with low molecular weight and adequate solubility can be easily delivered through
the skin. In the development of a TDD vehicle, skin penetration of the active is a key factor, as
well as low skin irritation.
Compared to conventional colloidal carriers like emulsions, hydrogels and liposomes,
microemulsions have been shown to be superior for transdermal delivery of both oil-soluble and
water-soluble drugs (Heuschkel et al., 2008; Date and Patravale, 2007; Kreilgaard, 2002).
Microemulsions are thermodynamically stable systems comprised of oil, water and surfactants,
which solubilize oil and/or water in nano-domains (1-100 nm) (Danielsson and Lindman 1981).
Depending on the surfactant used in formulations, three types of microemulsions can be formed:
oil-in-water (o/w, Winsor Type I), water-in-oil (w/o, Winsor Type II) and bicontinuous (middle-
phase, Winsor Type III or IV) systems. The most important property of microemulsions for drug
delivery is their excellent drug solubilization capacity due to the coexistence of hydrophilic and
lipophilic solubilization sites (Kreilgaard, 2002).
The crucial point for microemulsions in pharmaceutical applications is the type and amount of
surfactants selected in the systems. Generally, surfactants of natural origins are preferred over
synthetic surfactants (Tenjarla, 1999). Among synthetic surfactants, nonionic surfactants are
preferred over cationic and anionic surfactants. Microemulsions usually require large
concentration of surfactants in formulations. For example, Delgado-Charro et al. formulated
microemulsion systems with about 25-44% surfactant mixture to deliver drugs through the skin
(Delgado-charro et al., 1997). In one case, the surfactant concentration was as high as 70% in
- 4 -
microemulsions (Kreilgaard et al., 2000). Unfortunately, skin irritation has been linked to high
surfactant concentrations and therefore the surfactant concentration should be kept to a minimum
in microemulsion formulations.
Aboofazeli and Lawrence showed that phospholipids, particularly lecithin, are good surfactants
for microemulsion formulations because they are non toxic even at high concentrations
(Aboofazeli and Lawrence, 1993). Lecithin, a mixture of phospholipids, is a naturally-occurring
biological surfactant and can be found in all plants and animals. However, the problem in using
lecithin as a surfactant for microemulsions is that phospholipids are too hydrophobic to
spontaneously form zero curvature lipid layers as required for the formation of bicontinuous
microemulsions (Bagwe, 2001; Tenjarla, 1999). Typical lecithin microemulsions have to use a
large amount of medium-chain alcohols as cosurfactants. These alcohols can cause drying and
skin irritation making them less attractive for clinical applications (Bommannan et al., 1991).
Alcohol-free lecithin microemulsions have been formulated using linker molecules to replace
alcohols. Linker molecules are amphiphiles that segregate near the oil/water interface to enhance
the surfactant-oil (lipophilic linkers) or surfactant-water (hydrophilic linkers) interactions
(Sabatini et al., 2003). Acosta et al. found that linker-based lecithin microemulsions have a large
solubilization capacity for a wide range of oils, when using hexyl polyglucoside as the
hydrophilic linker and sorbitan monooleate as the lipophilic linker (Acosta et al., 2005). The
authors proposed the lecithin-linker systems as “green solvents” in dry-cleaning applications and
solvent delivery systems for pharmaceutical applications. However, before this project, there had
been no report regarding the use of linker-based lecithin microemulsions in drug delivery, or any
toxicity studies on these systems. Besides, hexyl polyglucoside is not registered in many
countries, including Canada, as cosmetic, food or pharmaceutical ingredient and therefore can
not be used in these applications. Since the toxicity caused by surfactants is a major concern, it is
- 5 -
also necessary to investigate the relationship between the surfactant concentrations and the
transdermal performance of linker-based microemulsion vehicles.
In addition, traditional form for topical treatment of skin diseases is drug-in-adhesive patches, in
which polymers are commonly used as contact membranes to control drug release. Since
patches can not be used over burns, cuts, and irritated skin, there is a need for developing
sprayable formulations for extended release through the skin. Microemulsions are liquid and
sprayable. They have been reported to provide high drug absorption in the skin (Baroli et al.,
2000; Delgado-Charro et al. 1997; Willimann et al., 1992). This skin absorption portion could act
as an “in-situ” patch and provide extended release of drugs. However, all microemulsion studies
as TDD vehicles in the literature are for immediate release style (Kreilgaard, 2002; Lawrence
and Rees, 2000), no work has been done to test them for extended release purposes.
1.2 HYPOTHESIS
Lecithin microemulsions can be formulated using another hydrophilic linker with Generally
Recognized as Safe (GRAS) or food additive status, and the systems can be used as potentially
safe and effective TDD vehicles for immediate and extended release. Moreover, the surfactant
concentrations in the linker-based lecithin microemulsions can be optimized for transdermal
delivery by understanding the drug release mechanism from microemulsions to the skin.
1.3 SPECIFIC OBJECTIVES
The overall objective of this study is to formulate and optimize the formulations of linker-based
lecithin microemulsions and to investigate their potential on the transdermal immediate and
- 6 -
extended delivery of drugs through better understanding the mechanism of drug release from
microemulsions. The specific aims of this work are three-fold:
1. To formulate lecithin microemulsions with another hydrophilic linker (sodium caprylate)
and to investigate their effectiveness as TDD vehicles using in vitro permeation and
cytotoxicity tests;
2. To investigate the possibility of in situ patches for extended drug release by applying the
newly formulated lecithin-linker microemulsions;
3. To investigate the effect of surfactant concentration in the developed microemulsions on
their transdermal potential and to understand the role of surfactants on drug release
mechanism from microemulsions to the skin.
1.4 THESIS OUTLINE
This dissertation is organized in six chapters. A brief introduction of the research topic,
hypothesis, and objectives is presented in Chapter 1. An overview of literature is given in
Chapter 2, including a basic background of TDD, microemulsions, linker molecules and the
scope of this work. The main contributions of this study are included in Chapter 3, 4, and 5.
Chapter 3 reports the formulation and performance of linker-based lecithin microemulsions as
transdermal systems for lidocaine. Chapter 4 takes advantage of the increased drug absorption
found in Chapter 3 to produce an extended release profile where drug-loaded skin is used as an
in situ patch. Chapter 5 describes the impact of surfactant concentrations on transdermal
performance of the studied lecithin-linker systems. Finally, overall conclusions drawn from this
work and an outlook on the potential impact of the findings of this work are presented in Chapter
6.
- 7 -
In addition, there are two appendices that present some experimental results related to this work.
Appendix 1 attempts to investigate the effect of oils on the transdermal performance of the
studied lecithin-linker microemulsions. Appendix 2 shows the effect of drugs on the
incorporation of the developed lecithin-linker systems.
Indeed, this dissertation mainly consists of three publications/preparations submitted to refereed
journals. Two papers based on Chapter 3 and 4 have been published or accepted in the
International Journal of Pharmaceutics. Another paper based on Chapter 5 has been submitted to
Journal of Controlled Release. Additionally, two conference papers derived from the thesis have
been published in the Journal of Cosmetic Science. More than 11 presentations have been given
at peer-reviewed or international conferences. A patent application (Pub. No. 2008/0139392) has
been filed with the US patent office and we were awarded $50,000 Ontario Research and
Commercialization Program grant from Province of Ontario.
1.5 INDUSTRIAL SIGNIFICANCE
The results of this work will enable us to formulate efficient and less toxic surfactant-based
products to deliver a wide range of active ingredients in the pharmaceutical and cosmeceutical
industries. The market for TDD in the U.S. alone was at $3 billion dollars in 2006 and is
expected to reach $4.4 billion by 2008 (Shahani, 2003). Among the targeted nano-scale delivery
vehicles, microemulsions are the only systems that can cosolubilize high concentrations of both
water-soluble and oil-soluble active ingredients. However, there are two major challenges for
microemulsion delivery systems: first the toxicity associated with synthetic surfactants
commonly used in these formulations and second the lack of understanding of the mechanism of
drug delivery in microemulsions which could lead to an optimization on the selection and
- 8 -
concentration of ingredients used to formulate the microemulsions. The results of this research
work not only provide potentially safe and effective formulations as transdermal delivery
vehicles, but also offer a drug release model for tailoring and optimizing the delivery systems.
1.6 REFERENCES
Aboofazeli, R., Lawrence, M.J., 1993. Investigations into the formation and characterization of phospholipid microemulsions. I. Pseudo-ternary phase diagrams of systems containing water-lecithin-alcohol-isopropyl myristate. Int. J. Pharm. 93, 161-175.
Acosta, E.J., Nguyen, T., Witthayapanyanon, A., Harwell, J.H., Sabatini, D.A., 2005. Linker-based bio-compatible microemulsions. Environ. Sci. Technol. 39, 1275-1282.
Amann, A.H., Osborne, D.W., 1990. Topical drug delivery formulations. Marcel Dekker, New York.
Bagwe, R.P., Kanicky, J.R., Palla, B.J., Patanjali, P.K., Shah, D.O., 2001. Improved drug delivery using microemulsions: rationale, recent progress, and new horizons. Crit. Rev. Ther. Drug Carr. Syst. 18, 77-140.
Baroli, B., López-Quintela, M.A., Delgado-Charro, M.B., Fadda, A. M., Blanco-Méndez, J., 2000. Microemulsions for topical delivery of 8-methoxsalen. J. Controlled Release 69, 209-218.
Bommannan, D., Potts, R.O., Guy, R.H., 1991. Examination of the effect of ethanol on human stratum corneum in vivo using infrared spectroscopy. J. Controlled Release 16, 299-304.
Danielsson, I., Lindman, B., 1981. The definition of a microemulsion, Colloids and Surfaces 3, 391–392.
Date, A. A. and Patravale, V. B., 2007. Microemulsions: applications in transdermal and dermal delivery. Crit. Rev. Ther. Drug Carrier Syst. 24(6), 547-596.
Delgado-Charro, M.B., Iglesias-Vilas, G., Blanco-Méndez, J., López-Quintela, M.A., Marty, J., Guy, R. H., 1997. Delivery of a hydrophilic solute through the skin from novel microemulsion systems. Eur. J. Pharm. Biopharm. 43, 37-42.
Guy, R.H., Hadgraft, J., 2003. Transdermal drug delivery, 2nd Ed. Marcel Dekker, New York.
Heuschkel, S., Goebel, A., Neubert, R. H., 2008. Microemulsions-modern colloidal carrier for dermal and transdermal drug delivery. J. Pharm. Sci. 97, 603-631.
Kreilgaard, M., Pedersen, E.J., Jaroszewski, J.W., 2000. NMR characterisation and transdermal drug delivery potential of microemulsion systems. J. Controled Release 69, 421-433.
- 9 -
Kreilgaard, M., 2002. Influence of microemulsions on cutaneous drug delivery. Adv. Drug Deliv. Rev. 54, S77-S98.
Lawrence, M.J., Rees, G.D., 2000. Microemulsion-based media as novel drug delivery systems. Adv. Drug Deliv. Rev. 45, 89-121.
Michaels, A.S., Chandrasekaran, S.K., Shaw, J.E., 1975. Drug permeation through human skin: theory and in vitro experimental measurement. AICHE J., 21, 985-996.
Sabatini, D.A., Acosta, E., Harwell, J.H., 2003. Linker molecules in surfactant mixtures. Curr. Opin. Colloids Interface Sci. 8, 316-326.
Shahani, S. 2003, C-050V advanced drug delivery systems: new developments, new technologies, Business Communications Company, Inc., 1, 0-159.
Tenjarla, S., 1999. Microemulsions: an overview and pharmaceutical applications. Crit. Rev. Ther. Drug Carr. Syst. 16, 461-521.
Willimann, H., Walde, P., Luisi, P.L., Gazzaniga, A., Stroppolo, F., 1992. Lecithin organogel as matrix for transdermal transport of drugs. J. Pharm. Sci. 81, 871-874.

- 10 -
CHAPTER 2
BACKGROUND
- 11 -
Microemulsions have many advantages as transdermal drug delivery (TDD) vehicles, including
high solubilization capacity for hydrophilic and lipophilic active ingredients, thermodynamic
stability, high surface area to volume ratio (desirable for accelerated mass transfer); transparency
and self-emulsifying properties. It has been reported that the transdermal flux of lidocaine from a
microemulsion is up to four times than that from an emulsion (Kreilgaard et al., 2000). However,
the major challenge for microemulsion delivery systems is the toxicity associated with
surfactants and cosurfactants commonly used in these formulations. This chapter presents a
detailed review of microemulsions used for transdermal delivery. To provide the rationale behind
the approaches in this dissertation and address the questions present in the field, the background
will focus on barrier properties of the skin, formulation constraints of microemulsions, and the
approach of using linker molecules in microemulsions.
2.1 TRANSDERMAL DRUG DELIVERY
TDD is a method of drug delivery through the skin to the systemic circulation (Guy and Hadgraft,
2003). It is a convenient mode of administration enabling physicians to provide controlled and
continuous drug delivery to patients without causing distress. Compared to oral and parenteral
routes, the transdermal route of drug administration has the advantages of reducing
gastrointestinal side effects and reducing drug degradation (Bronaugh and Maibach; 2002;
Amann and Osborne, 1990). However, the skin itself is the major barrier preventing drugs into
the body. Chemical approaches have been used to overcome this barrier and the dosage forms
could be patches, creams, gels, ointments, or sprays (Williams and Barry, 2004). This review
does not include physical approaches, such as the use of micro-needles, ultrasound, radio waves,
etc.(Asbill, 2000).
- 12 -
2.1.1 The skin barrier
Human skin is the largest organ of the human body. It is accessible and provides a painless and
compliant interface for systemic drug administration. However, one of the basic functions of the
skin is to serve as a protective barrier impeding the penetration of external pathogens and toxins
into the body. It also aids in balancing the water content of the body. Consequently, the entry of
therapeutic agents (drugs) also becomes difficult due to the relatively impermeable nature of the
skin (Guy and Hadgraft, 2003). The skin consists of two main layers: the epidermis and the
dermis. The epidermis is the outermost layer of the skin, approximately 100 µm thick. The
impermeability of the skin is mainly provided by the uppermost layer of the epidermis, the
stratum corneum, whose thickness is approximately 15-20 µm (Hadgraft, 2001).
The stratum corneum is composed of dead, flattened, and interlocked keratin-rich cells
(corneocytes). These dense cells are embedded in a lipid matrix. The structure of the stratum
corneum is similar to a brick and mortar wall (Michaels et al., 1975), where the corneocytes of
hydrated keratin comprise the bricks, and the epidermal lipids fill the space between the dead
cells like mortar (Figure 2.1). The major lipids found in the stratum corneum are ceramides, fatty
acids and their esters, and cholesterol and its sulfate (Wertz and Downing, 1991). They are
arranged into ordered bilayers, and those structured bilayers confer a high degree of the
impermeability of the skin to water and other penetrants (Hadgraft, 2001). Therefore, the
stratum corneum has been organized as the rate controlling membrane that acts predominantly as
a hydrophobic barrier (Langer, 2004; Prausnitz, 2004).
- 13 -
Figure 2.1 Schematic structure of stratum corneum according to the brick and mortar model (Michaels et al., 1975). The corneocytes are embedded in a lamellar structured lipid matrix (adapted from Daniels, 2004).
2.1.2 Routes of skin penetration
There are potentially three possible routes to penetrate the skin (Figure 2.2): transcellular,
intercellular, and appendageal (through eccrine/sweat glands and hair follicles) (Hadgraft, 2001).
Under normal conditions the appendageal (shunt) route is not considered to be important since
the appendages occupy a relatively low fraction of skin area (~0.1%). Nevertheless, this route is
more important for ions and large polar molecules which hardly permeate through the intact
horny layer (Williams and Barry, 1992).
Figure 2.2 A schematic diagram of different possible routes of penetration cross the skin (adapted from Hadgraft, 2001).
- 14 -
It is difficult to determine the differences between the transcellular and intercellular route.
Daniels proposes that the penetration pathway is decided mainly by the partition coefficient
(octanol/water Log P) (Daniels, 2004). Hydrophilic drugs partition preferentially into the
intracellular domains, whereas lipophilic permeants (Log P >2) traverse the stratum corneum via
the intercellular route. Most molecules pass the stratum corneum by both routes. However other
researchers believe that the intercellular route is more important for the permeation of most drugs,
whereas the nature of the intercellular channels is unclear (Hadgraft, 2001; Fartasch et al., 1993).
Even though the skin is such a heterogeneous membrane in most cases, the underlying transport
process through the skin is controlled by simple passive diffusion (Hadgraft, 2001). Fick’s first
law of diffusion can be used to describe these processes.
hCKDJ Δ
= (Equation 2.1)
Where J is the flux per unit area, K is the skin-vehicle partition coefficient, and D is the diffusion
coefficient in the skin; ΔC is the concentration difference across the skin and h is the diffusional
path length. This equation is often simplified to
CkJ p Δ×= (Equation 2.2)
Where kp (=KD/h) is a permeability coefficient, which has units of velocity (often quoted as
cm/h), i.e., it is a heterogeneous rate constant and encodes both partition and diffusional
characteristics.
2.1.3 Drugs
Only a small number of drug products are currently available via transdermal delivery. In many
cases, the physical properties of a drug, including molecular size and polarity, limit its capacity

- 15 -
to be delivered transdermally. It is generally accepted that the best drug candidates for passive
adhesive transdermal patches must be nonionic, of low molecular weight (less than 500 Daltons),
have adequate solubility in oil and water (log P in the range of 1 to 3), a low melting point (less
than 200°C), and are potent (dose is less than 50 mg per day, and ideally less than 10 mg per day)
(Guy, 1996; Finnin and Morgan, 1999). On the other hand, the biological properties of drug
molecules, including dermal irritation and insufficient bioavailability, have been problematic.
Nevertheless, the use of gels, creams, and sprays makes a wider range of drug compounds
possible to be delivered transdermally.
Currently, there are a number of notable examples of transdermal products on the market based
on 13 drug molecules: fentanyl, nitroglycerin, estradiol, ethinyl estradiol, norethindrone acetate,
testosterone, clonidine, nicotine, lidocaine, prilocaine, scopolamine, norelgestromin and
oxybutynin (www.fda.gov/cder/ob).
2.1.4 Formulation approaches
To increase drug permeation across the skin, different classes of chemical penetration enhancers
have been formulated using surfactants (e.g. Tween), fatty acid/esters (e.g. oleic acid), terpenes
(e.g. limonene), and solvents (e.g. dimethylsulfoxide and ethanol) (Williams and Barry, 2004). In
recent years, colloidal carriers such as emulsions, micelles, liposomes and deformable vesicles
have been used extensively in the topical delivery of cosmetic and dermatological agents (Cevc,
2004). An alternative, perhaps more versatile approach, is the use of microemulsions because
they can cosolubilize high concentrations of both water-soluble and oil-soluble drug molecules.
However, potent chemical enhancers are usually potent irritants to the skin at the concentrations
necessary to achieve reasonable levels of penetration enhancement, making them physiologically
- 16 -
incompatible (Lashmar, 1989). These chemicals may irritate the skin by causing an immune
response, disrupting the epidermal barrier, being cytotoxic to any of the 30 types of skin cells,
causing oxidative stress at a cellular level or any combination of these effects. When chronically
irritated, the skin may become red, scaly, chapped, itchy and sensitive to touch. The skin immune
response involves the coordinated actions of epidermal and dermal cells along with the intricate
network of cytokines (Bos and Kapsenberg, 1993). First, many cytokines produced by activated
keratinocytes in the epidermis are released. This local release, which serves as an early signal to
the host immune system, then initiates the inflammatory cascade. Together, cytokines and
inflammatory mediators allow the skin to recruit leukocytes and monocytes from the blood
vessel in the dermis to the site of inflammation. This reaction is characterized by an increase in
blood flow at the site inflammation (Rougier et al., 1994).
It is important to select chemical penetration enhancers free of irritancy potential. For example,
dimethylsulfoxide may promote drug permeation, but this solvent can dissolve the skin cells and
extract stratum corneum lipids. Short- (C1-C3) and medium-chain (C4-C8) alcohols are also
common enhancers used in TDD with skin irritation as a consequence. Therefore, the researchers
are challenged to come up with formulations that increase the permeability of the drug through
the skin without irreversibly changing the skin barrier function (Wolff, 2000).
2.2 MICROEMULSIONS
The term “microemulsion” itself is sometimes used in a misleading way. Hoar and Schulman
first introduced the word to define a clear solution obtained by titrating a milky emulsion with a
medium-chain alcohol (Hoar and Schulman, 1943). The term was also used to describe various
homogeneous surfactant-containing solutions in the past and the expression itself implies
- 17 -
emulsion-like properties with droplet sizes in submicron-range. To avoid the confusion in the
terminology, Danielsson and Lindman proposed a definition for microemulsion: “a system of
water, oil and amphiphile which is a single optically isotropic and thermodynamically stable
liquid solution” (Danielsson and Lindman, 1981). This concept does not cover aqueous solutions
of surfactant (micelles and reverse micelles), coarse emulsions (macroemulsions), liquid crystals,
and systems that are surfactant-free. Recognizing the differences between a normal coarse
emulsion and a microemulsion is very important. Table 2.1 lists the major differences between
micro- and “macro” emulsions.
Table 2.1 Comparison of emulsions and microemulsions.
Property Emulsion Microemulsion
Droplet size of
dispersed phase
> 500 nm
(nanoemulsions: 1-100 nm)
1-100 nm
Appearance Milky Transparent/translucent
Formation Input of external;
External energy required
Spontaneous;
Minimal energy required
Stability Thermodynamically unstable;
Two-phase system
Thermodynamically stable;
One-phase system
Interfacial tension ~ 50 mN m-1 10-3 ~ 10-13 mN m-1
2.2.1 Structures
There are three basic types of microemulsions (Figure 2.3): (1) oil-in-water (o/w, Winsor Type I),
in which water is the continuous phase; (2) bicontinuous (Winsor Type III or IV), in which
approximately equal volumes of water and oil exist; and (3) water-in-oil (w/o, Winsor Type II),
in which oil is the continuous phase (Kumar and Mittal, 1999). The presence of Type I
microemulsion droplets is likely to be a feature in microemulsions where the volume fraction of
oil is low. Conversely, Type II droplets are likely when the volume fraction of water is low.
- 18 -
When similar amounts of water and oil are present, a bicontinuous microemulsion may occur:
both oil and water exist as a continuous phase in the presence of a continuously fluctuating
surfactant-stabilized interface with a net curvature of zero. In the case of a Type III system,
besides the microemulsion, there is an excess phase of oil and an excess phase of water, but other
than that, it retains the same characteristics of a Type IV system (Bourrel and Schecter 1988). In
addition, the microemulsion structures are greatly influenced by the physico-chemical properties
of the components used, the ratios between the components, the salinity in the formulations and
the surrounding temperature.
(1) (2) (3) Figure 2.3 Three basic microemulsion structures formed by oil phase (grey), aqueous phase (white) and surfactant/cosurfactant interfacial film: (1) o/w (Type I), (2) bicontinuous (Type III or IV), and (3) w/o (Type II) microemulsions (adapted from Kreilgaard, 2002).
2.2.2 Formation
When aqueous, oil and amphiphilic (surfactant and cosurfactant) solutions are mixed, a variety
of complexes may be obtained including microemulsions and other colloidal systems such as
micelles, emulsions, and liquid crystals (Kumar and Mittal, 1999). The region of microemulsions
existence can be captured with the aid of pseudo-ternary phase diagrams, as the relationship
between the phase behaviour of a mixture and its composition (Figure 2.4). For simplicity,
microemulsions are often assumed to comprise of three components (oil, water, and surfactant)
- 19 -
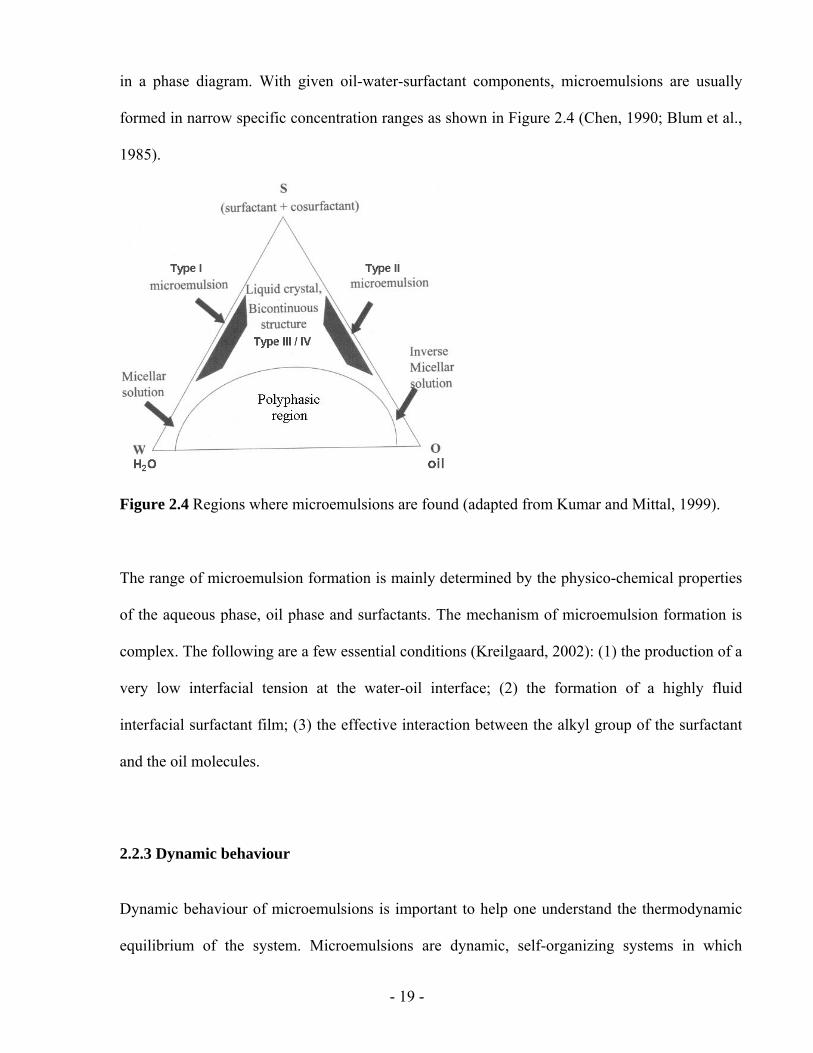
in a phase diagram. With given oil-water-surfactant components, microemulsions are usually
formed in narrow specific concentration ranges as shown in Figure 2.4 (Chen, 1990; Blum et al.,
1985).
Figure 2.4 Regions where microemulsions are found (adapted from Kumar and Mittal, 1999).
The range of microemulsion formation is mainly determined by the physico-chemical properties
of the aqueous phase, oil phase and surfactants. The mechanism of microemulsion formation is
complex. The following are a few essential conditions (Kreilgaard, 2002): (1) the production of a
very low interfacial tension at the water-oil interface; (2) the formation of a highly fluid
interfacial surfactant film; (3) the effective interaction between the alkyl group of the surfactant
and the oil molecules.
2.2.3 Dynamic behaviour
Dynamic behaviour of microemulsions is important to help one understand the thermodynamic
equilibrium of the system. Microemulsions are dynamic, self-organizing systems in which
- 20 -
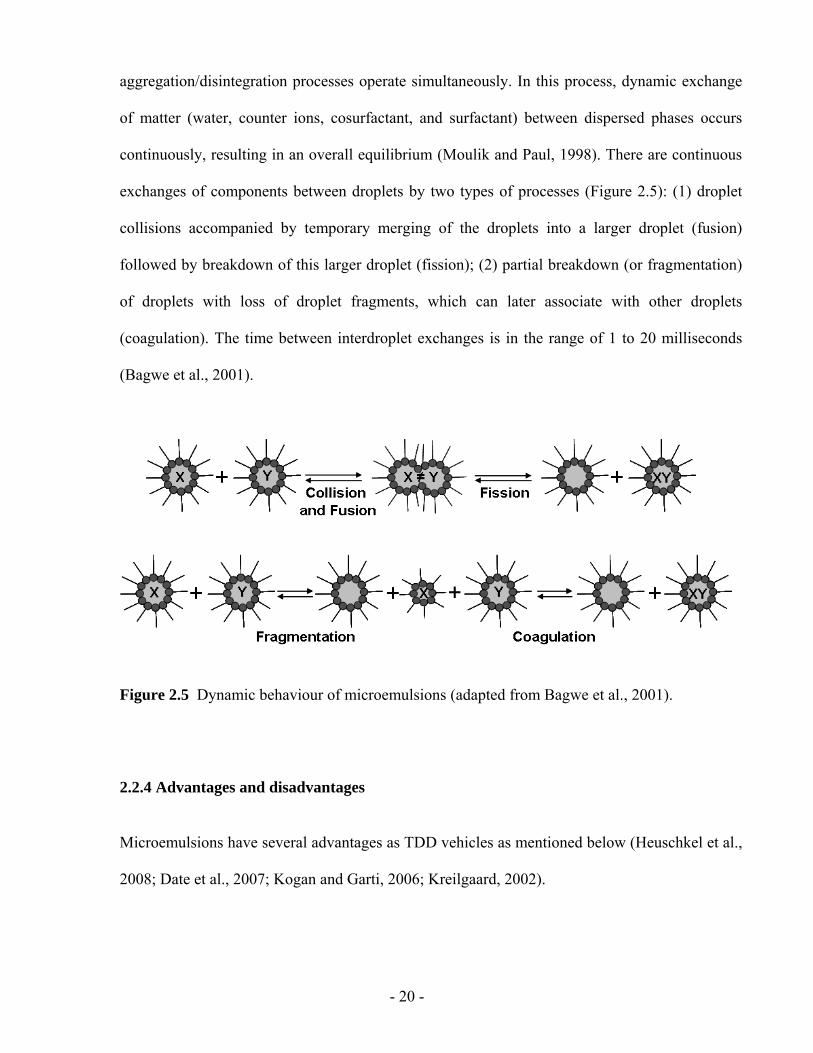
aggregation/disintegration processes operate simultaneously. In this process, dynamic exchange
of matter (water, counter ions, cosurfactant, and surfactant) between dispersed phases occurs
continuously, resulting in an overall equilibrium (Moulik and Paul, 1998). There are continuous
exchanges of components between droplets by two types of processes (Figure 2.5): (1) droplet
collisions accompanied by temporary merging of the droplets into a larger droplet (fusion)
followed by breakdown of this larger droplet (fission); (2) partial breakdown (or fragmentation)
of droplets with loss of droplet fragments, which can later associate with other droplets
(coagulation). The time between interdroplet exchanges is in the range of 1 to 20 milliseconds
(Bagwe et al., 2001).
Figure 2.5 Dynamic behaviour of microemulsions (adapted from Bagwe et al., 2001).
2.2.4 Advantages and disadvantages
Microemulsions have several advantages as TDD vehicles as mentioned below (Heuschkel et al.,
2008; Date et al., 2007; Kogan and Garti, 2006; Kreilgaard, 2002).
- 21 -
1. High solubilization capacity of both hydrophobic and hydrophilic drugs: the various
structures of microemulsions enable the entrapment of both oil-soluble and water-soluble
drugs, either alone or in combination, making them versatile carriers.
2. Thermodynamic stability: the thermodynamic stability of microemulsions helps in
improving the shelf-life of the product making them carriers of choice.
3. Ease of manufacture and scale-up: the spontaneous formation of microemulsions makes
their manufacturing and scale-up very easy as compared to other colloidal carriers, which
require specialized instruments such as high-pressure homogenizers for their
manufacturing.
4. Improved stability of active pharmaceutical ingredients: encapsulation of the drugs in the
microemulsion structures can improve the chemical, photochemical, and enzymatic
stability of therapeutic agents (Date et al., 200).
Other advantages of microemulsions include clarity, their ability to be filtered, and low viscosity.
In recent years, microemulsions have been extensively studied to improve the drug permeability
across the stratum corneum (Peltola et al., 2003; Lee et al., 2003; Baroli et al., 2000; Delgado-
Charro et al., 1997; Kriwet et al., 1995; Trotta et al., 1994; Boltri et al., 1994). These studies
demonstrated that microemulsions significantly increased transdermal flux and the permeation
coefficient through the skin, when compared to other colloidal systems and aqueous solutions
(Kreilgaard et al., 2000; Bhatnagar et al., 1994; Willimann et al., 1992). Furthermore, it has been
suggested that the surfactants and the oil from the microemulsion interact with the rigid lipid
bilayer structure and act as a permeation enhancer (Schmalfu et al., 1997).
The disadvantages of microemulsions stem from the use of a large concentration of surfactant
and cosurfactant necessary for stabilizing the nanodroplets. As mentioned earlier, high level of
- 22 -
surfactants and cosurfactants are always a hazard due to irritations to the skin. Moreover,
microemulsion stability is influenced by environmental parameters such as temperature, pH.
These parameters change upon microemulsion delivery to patients. In addition, the structure of a
microemulsion may change if diluted with water after it is introduced into a physiological
environment (Podlogar et al., 2005). Thus, the effect of such changes on microemulsion stability
must be evaluated in the formation development process.
2.2.5 Formulation constraints
In terms of the pharmaceutical applications, the most significant problem associated with
formulating microemulsions is the selection of a surfactant, cosurfactant and oil. The
components, which are able to form microemulsions should be nontoxic and fulfill the
requirements of a good TDD vehicle, i.e., high solubility and high thermodynamic activity of the
drug.
2.2.5.1 Oil phase
The choice of an oil used in microemulsion formulations is often a balance between its ability to
solubilize the drug candidate and its ability to facilitate formation of microemulsions (structures
and stability). In general, oil molecules with high molecular weight are able to dissolve lipophilic
compounds of multiple sizes. However, oil molecules with small molecular weight produce
microemulsions with high solubilization capacity (Warisnoicharoen et al., 2000; Malcolmson et
al., 1998). A variety of fatty acid and their esters, medium-chain triglycerides, and propylene
glycol esters of fatty acids have been employed as oil phases to facilitate microemulsions (Kogan
and Garti, 2006).
- 23 -
In this study, isopropyl myristate (IPM) is used as the oil phase. IPM is a well known permeation
enhancer in transdermal formulations (Kreilgaard, 2002), but the mechanism of its action is
poorly understood (Kogan and Garti, 2006). For example, in some cases, IPM does not show a
significant effect (Morimoto et al., 1993). Some preliminary consideration of different oils is
included in Appendix 1.
2.2.5.2 Surfactants
A crucial point for pharmaceutical microemulsions is the choice of surfactants. In certain cases,
surfactants, at higher concentrations, may cause skin irritation. Generally, surfactants derived
from natural sources are preferred over synthetic surfactants - for example, phospholipids are
preferred whenever possible because they are naturally present in cell membrane. Among
synthetic surfactants, nonionic surfactants are preferred over cationic and anionic surfactants, as
anionic and cationic surfactants result in membrane perturbation and skin irritation when
compared to nonionic surfactants (Tenjarla, 1999). In general, the surfactant concentration
should be kept to a minimum. Lecithin (phospholipids), nonionic surfactants, and polyglycerol
esters of fatty acid are commonly used in transdermal formulations.
2.2.5.3 Cosurfactants
Most of the time, surfactant alone can not lower the oil/water interfacial tension sufficiently to
yield a microemulsion. Liquid crystalline phases are often formed when the surfactant film is too
rigid (Bagwe et al., 2001; Tenjarla, 1999). It is necessary to add cosolvents (amphiphilic short-
chain molecules) or cosurfactants to bring the interfacial tension close to zero. The amphiphilic
nature of these additives (with the length of the carbon chain ranging from C2 to C9) enables
them to interact with surfactant molecules at the interface, thereby affecting their packing
(Vandamme, 2002; Lawrence and Rees, 2000). Cosurfactants penetrate the surfactant monolayer
- 24 -
providing additional fluidity to the interfacial film by disrupting liquid crystalline phases.
Commonly used cosurfactants include alcohols, derivatives of glycols, polyglycerols or
propylene glycols.
2.2.5.4 Aqueous phase
Water serves as the aqueous phase in most of microemulsions for TDD. In some of the cases,
phosphate buffer of pH 7.4 is used (Trotta et al., 2003; Delgado-Charro et al., 1997). Isotonic
solution (0.9% NaCl) is normally used in microemulsion formulations for drug delivery purpose.
2.2.6 Lecithin microemulsions
Lecithin microemulsions are a good choice for drug delivery because lecithin (phospholipids) is
a naturally occurring biological, nontoxic surfactant. Phospholipids are present in the cell
membrane and can be found in all plants and animals. When administrated in optimum amounts
even in high concentrations, they do not have the toxic and sensitivity problems associated with
other surfactants. In general, phospholipids are recognized as penetration enhancers because the
absorption of phospholipids on the skin can increase tissue hydration, consequently increasing
drug permeation (Williams and Barry, 2004). When phospholipids are applied to the skin as
delivery vehicles, they can fuse with stratum corneum lipids, perturb its structure and facilitate
drug delivery (Williams and Barry, 2004; Kirjavainen et al., 1999). Therefore, lecithin is the
ideal surfactant for preparing pharmaceutically acceptable microemulsions.
In this work, the term lecithin refers to a naturally occurring mixture of phospholipids, including
phosphatidylcholine, phosphatidylethanolamine, and phosphotidylinositol. Soybeans are the
most important source of commercial lecithin and crude soy oil contains an average of 1.2-3.2%
- 25 -
(Du Bois and Christine, 2008; Shurtleff, 2006). Unrefined/natural lecithin is obtained in the
process of degumming vegetable oil and contains 65-70% phospholipids and 30-35% crude soy
oil. The oil in unrefined lecithin can be removed by extraction with acetone to give a dry
granular product called “refined lecithin”. The fatty acid composition of soy lecithin is in
roughly the same proportion as in soy oil: saturated and unsaturated. The profile is
approximately as follow: 11% palmitic acid (C16:0-the first number means the length of carbon
chain and the second number means the number of unsaturated bonds), 4% stearic acid (C18:0),
22% oleic acid (C18:1), 54% linoleic (C18:2) and 7% linolenic (C18:3). For pharmaceutical
applications and research purposes, refined grade lecithin may contain 60-99.7%
phosphotidylcholine (Dyson, 1978).
However, it is difficult to produce microemulsions with lecithin alone. Chemically, lecithin is
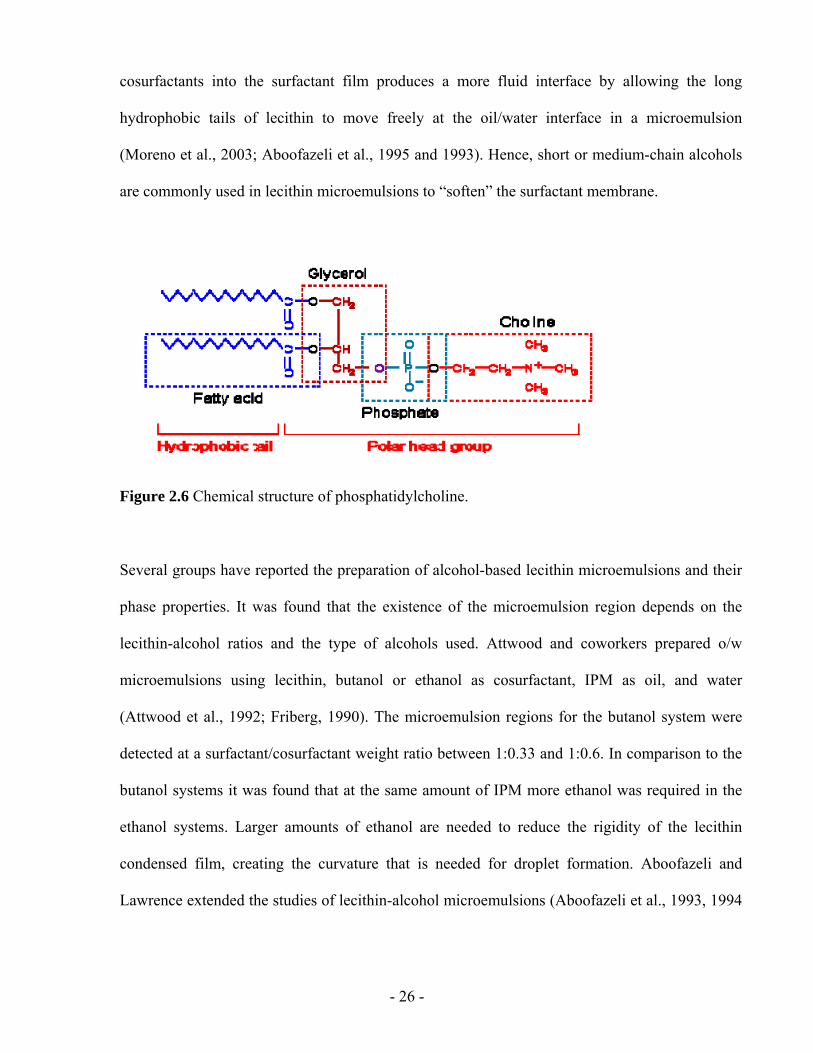
phosphatidylcholine. As shown in Figure 2.6, phosphatidylcholine molecules consist of a
hydrophilic polar head containing one or more phosphate groups and a hydrophobic tail from
two fatty acryl chains. They are too hydrophobic to spontaneously form zero curvature lipid
layers required for the formation of balanced microemulsions (Tenjarla, 1999). When many
phosphatidylcholine molecules are placed in water, they tend to self-assemble in rigid bilayers
(Bagwe, 2001). As a result, it is easy to form gels or liquid crystals when formulating lecithin
microemulsions.
To form lecithin-based microemulsions, it is necessary to adjust the HLB (hydrophilic lipophilic
balance) of lecithin and to inhibit its tendency to form lamellar liquid crystalline phases. The
HLB is an empirical scale of hydrophobicity. HLB values typically range from 0 to 40. The
value of 40 is indicative of highly hydrophilic surfactant such as sodium dodecyl sulphate
(Griffin, 1949). The HLB can be modified by adding short- or medium-chain alcohols
(cosurfactants) that increase interfacial area per lipid polar group. The penetration of the
- 26 -
cosurfactants into the surfactant film produces a more fluid interface by allowing the long
hydrophobic tails of lecithin to move freely at the oil/water interface in a microemulsion
(Moreno et al., 2003; Aboofazeli et al., 1995 and 1993). Hence, short or medium-chain alcohols
are commonly used in lecithin microemulsions to “soften” the surfactant membrane.
Figure 2.6 Chemical structure of phosphatidylcholine.
Several groups have reported the preparation of alcohol-based lecithin microemulsions and their
phase properties. It was found that the existence of the microemulsion region depends on the
lecithin-alcohol ratios and the type of alcohols used. Attwood and coworkers prepared o/w
microemulsions using lecithin, butanol or ethanol as cosurfactant, IPM as oil, and water
(Attwood et al., 1992; Friberg, 1990). The microemulsion regions for the butanol system were
detected at a surfactant/cosurfactant weight ratio between 1:0.33 and 1:0.6. In comparison to the
butanol systems it was found that at the same amount of IPM more ethanol was required in the
ethanol systems. Larger amounts of ethanol are needed to reduce the rigidity of the lecithin
condensed film, creating the curvature that is needed for droplet formation. Aboofazeli and
Lawrence extended the studies of lecithin-alcohol microemulsions (Aboofazeli et al., 1993, 1994
- 27 -
and 1995). They have reported the phase properties of lecithin/alcohols/water/IPM systems in
which the alcohols were n-propanol, isopropanol, n-butanol, s-butanol, t-butanol, and n-pentanol.
The lecithin-alcohol microemulsions have been extensively studied as transdermal formulations
for enhancing the penetration of a range of drugs (Changez et al., 2006; Paolino et al., 2002;
Brime et al., 2002; Rhee et al., 2001; Kreilgaard et al., 2000; Trotta et al., 1994 and 1998; Dreher
et al., 1997; Bonina et al., 1995; Aboofazeli et al., 1994). Microemulsions were compared to
creams, gels, lamellar liquid crystals and liposomes, where all formulations contained
phospholipids. Kriwet et al. found that microemulsions enhance drug permeability compared to
liposomes and lamellar liquid crystals across the skin (Kriwet et al., 1995). Bonina et al., also
showed that lecithin microemulsions led a better skin partitioning of drugs than conventional
formulations like creams and gels (Bonina et al., 1995). Furthermore, good human skin
tolerability of a lecithin-based o/w microemulsions compared to conventional vehicles (o/w and
w/o cream and gel) was observed by Panolino et al. (Paolino et al., 2002). In addition, Dreher et
al. obtained higher drug flux by lecithin microemulsion gels compared to the drug solution in the
pure oil (Dreher et al., 1997). Changez et al. studied the effect of the composition of
microemulsions on barrier properties of the skin. They suggested the lecithin microemulsions
generate a hydration gradient across the skin accompanied by an increased intercellular space in
the epidermis and dermis facilitating drug uptake (Changez et al., 2006).
Unfortunately, the applications of lecithin microemulsions in TDD have been limited due to the
alcohols used in the formulations. On one hand, short- or medium-chain alcohols are well-known
penetration enhancers that help the drug partition into the skin. On the other hand, these alcohols
also penetrate the skin, denaturing the membrane and triggering immunological responses
(irritation) (Higgins and Du, 1992). For example, alcohols can extract the skin lipids and their
presence in the skin will influence the solubility properties of the intercellular channels of the
- 28 -
stratum corneum (Bommannan et al., 1991). These changes in barrier function might make skin
more susceptible to damage.
2.3 LINKER MOLECULES IN MICROEMULSIONS
Linker molecules are additives that are used in microemulsion systems to enhance the interaction
between the surfactant and oil or water phases. They are defined as amphiphiles that segregate
near the oil/water interface either near the surfactant tail (lipophilic linkers) or the surfactant
head group (hydrophilic linkers) (Sabatini et al, 2003).
2.3.1 Lipophilic linker
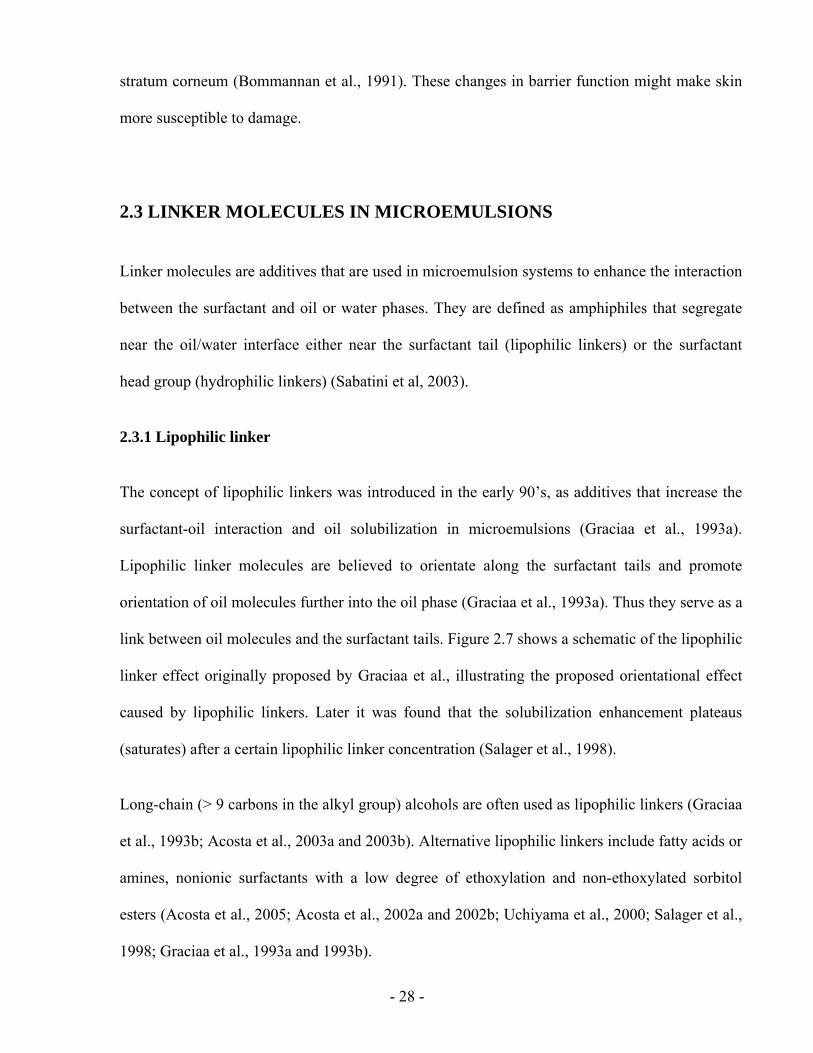
The concept of lipophilic linkers was introduced in the early 90’s, as additives that increase the
surfactant-oil interaction and oil solubilization in microemulsions (Graciaa et al., 1993a).
Lipophilic linker molecules are believed to orientate along the surfactant tails and promote
orientation of oil molecules further into the oil phase (Graciaa et al., 1993a). Thus they serve as a
link between oil molecules and the surfactant tails. Figure 2.7 shows a schematic of the lipophilic
linker effect originally proposed by Graciaa et al., illustrating the proposed orientational effect
caused by lipophilic linkers. Later it was found that the solubilization enhancement plateaus
(saturates) after a certain lipophilic linker concentration (Salager et al., 1998).
Long-chain (> 9 carbons in the alkyl group) alcohols are often used as lipophilic linkers (Graciaa
et al., 1993b; Acosta et al., 2003a and 2003b). Alternative lipophilic linkers include fatty acids or
amines, nonionic surfactants with a low degree of ethoxylation and non-ethoxylated sorbitol
esters (Acosta et al., 2005; Acosta et al., 2002a and 2002b; Uchiyama et al., 2000; Salager et al.,
1998; Graciaa et al., 1993a and 1993b).
- 29 -
Figure 2.7 Schematic of the lipophilic linker effect (adapted from Graciaa et al., 1993a).
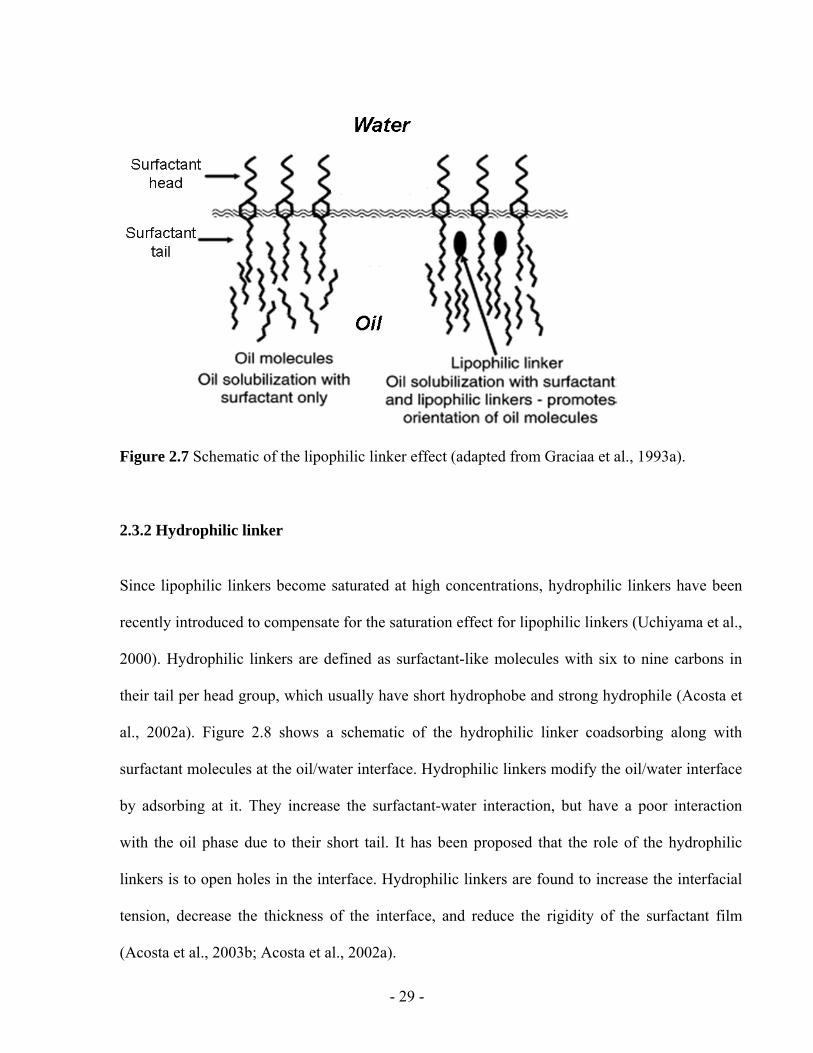
2.3.2 Hydrophilic linker
Since lipophilic linkers become saturated at high concentrations, hydrophilic linkers have been
recently introduced to compensate for the saturation effect for lipophilic linkers (Uchiyama et al.,
2000). Hydrophilic linkers are defined as surfactant-like molecules with six to nine carbons in
their tail per head group, which usually have short hydrophobe and strong hydrophile (Acosta et
al., 2002a). Figure 2.8 shows a schematic of the hydrophilic linker coadsorbing along with
surfactant molecules at the oil/water interface. Hydrophilic linkers modify the oil/water interface
by adsorbing at it. They increase the surfactant-water interaction, but have a poor interaction
with the oil phase due to their short tail. It has been proposed that the role of the hydrophilic
linkers is to open holes in the interface. Hydrophilic linkers are found to increase the interfacial
tension, decrease the thickness of the interface, and reduce the rigidity of the surfactant film
(Acosta et al., 2003b; Acosta et al., 2002a).
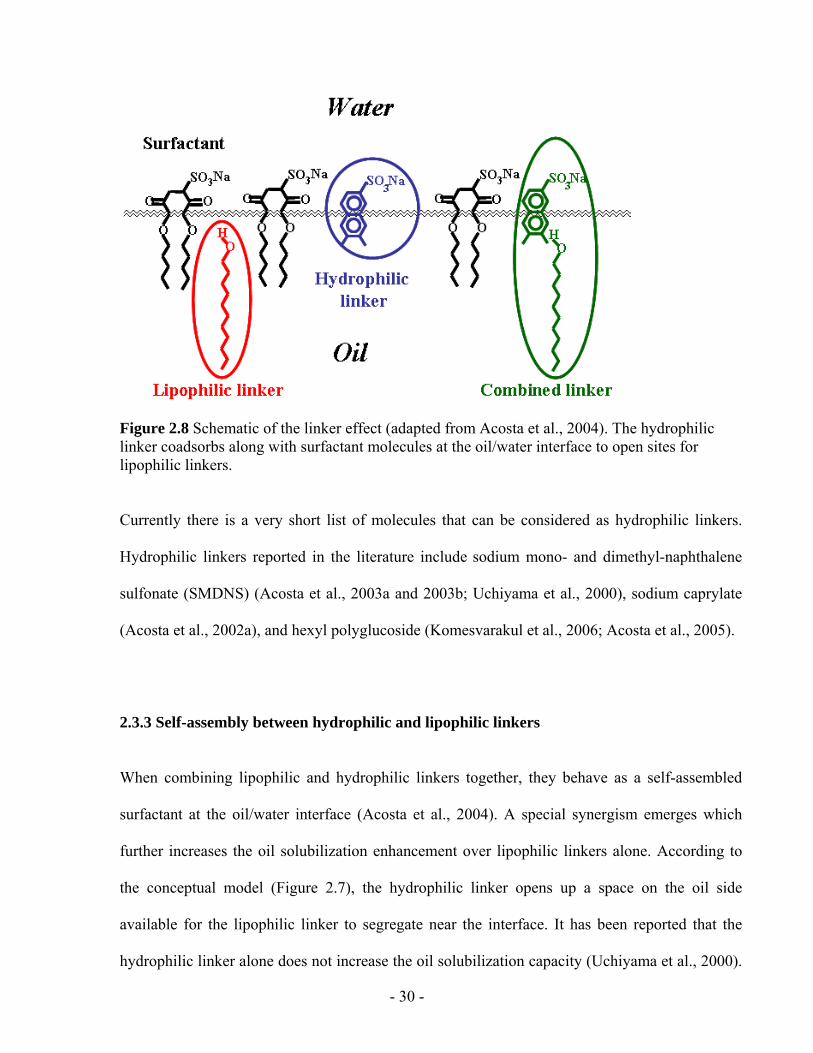
- 30 -
Figure 2.8 Schematic of the linker effect (adapted from Acosta et al., 2004). The hydrophilic linker coadsorbs along with surfactant molecules at the oil/water interface to open sites for lipophilic linkers.
Currently there is a very short list of molecules that can be considered as hydrophilic linkers.
Hydrophilic linkers reported in the literature include sodium mono- and dimethyl-naphthalene
sulfonate (SMDNS) (Acosta et al., 2003a and 2003b; Uchiyama et al., 2000), sodium caprylate
(Acosta et al., 2002a), and hexyl polyglucoside (Komesvarakul et al., 2006; Acosta et al., 2005).
2.3.3 Self-assembly between hydrophilic and lipophilic linkers
When combining lipophilic and hydrophilic linkers together, they behave as a self-assembled
surfactant at the oil/water interface (Acosta et al., 2004). A special synergism emerges which
further increases the oil solubilization enhancement over lipophilic linkers alone. According to
the conceptual model (Figure 2.7), the hydrophilic linker opens up a space on the oil side
available for the lipophilic linker to segregate near the interface. It has been reported that the
hydrophilic linker alone does not increase the oil solubilization capacity (Uchiyama et al., 2000).
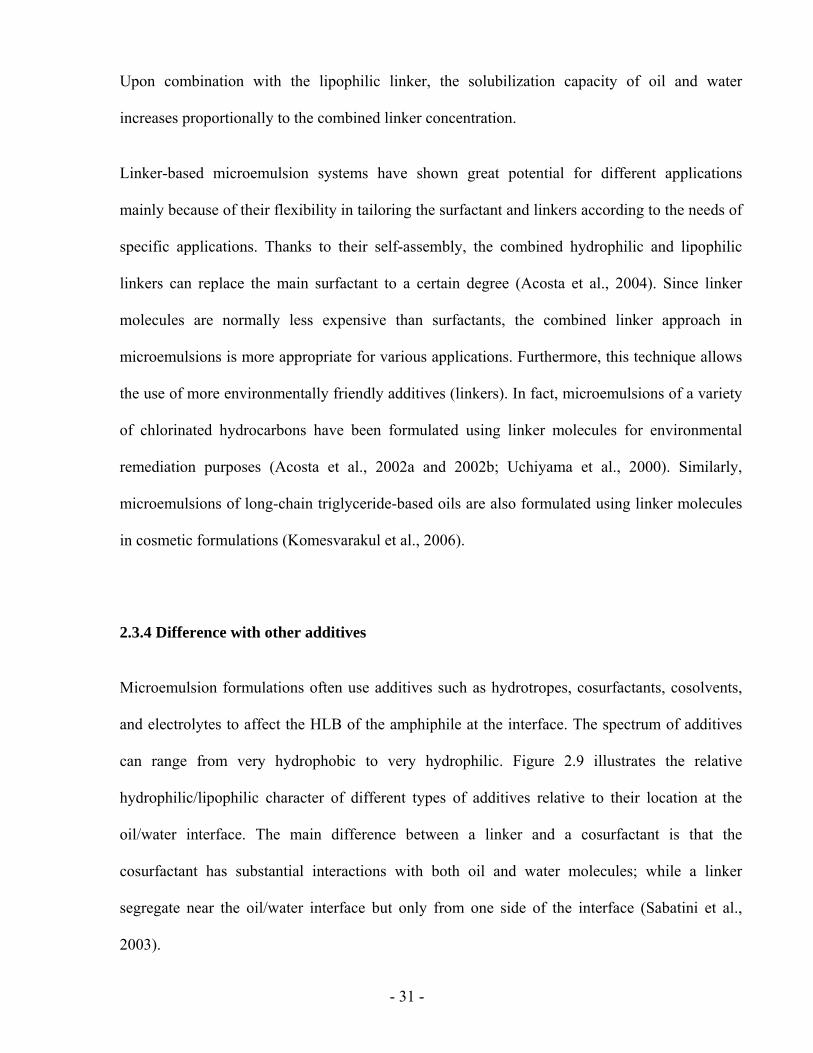
- 31 -
Upon combination with the lipophilic linker, the solubilization capacity of oil and water
increases proportionally to the combined linker concentration.
Linker-based microemulsion systems have shown great potential for different applications
mainly because of their flexibility in tailoring the surfactant and linkers according to the needs of
specific applications. Thanks to their self-assembly, the combined hydrophilic and lipophilic
linkers can replace the main surfactant to a certain degree (Acosta et al., 2004). Since linker
molecules are normally less expensive than surfactants, the combined linker approach in
microemulsions is more appropriate for various applications. Furthermore, this technique allows
the use of more environmentally friendly additives (linkers). In fact, microemulsions of a variety
of chlorinated hydrocarbons have been formulated using linker molecules for environmental
remediation purposes (Acosta et al., 2002a and 2002b; Uchiyama et al., 2000). Similarly,
microemulsions of long-chain triglyceride-based oils are also formulated using linker molecules
in cosmetic formulations (Komesvarakul et al., 2006).
2.3.4 Difference with other additives
Microemulsion formulations often use additives such as hydrotropes, cosurfactants, cosolvents,
and electrolytes to affect the HLB of the amphiphile at the interface. The spectrum of additives
can range from very hydrophobic to very hydrophilic. Figure 2.9 illustrates the relative
hydrophilic/lipophilic character of different types of additives relative to their location at the
oil/water interface. The main difference between a linker and a cosurfactant is that the
cosurfactant has substantial interactions with both oil and water molecules; while a linker
segregate near the oil/water interface but only from one side of the interface (Sabatini et al.,
2003).
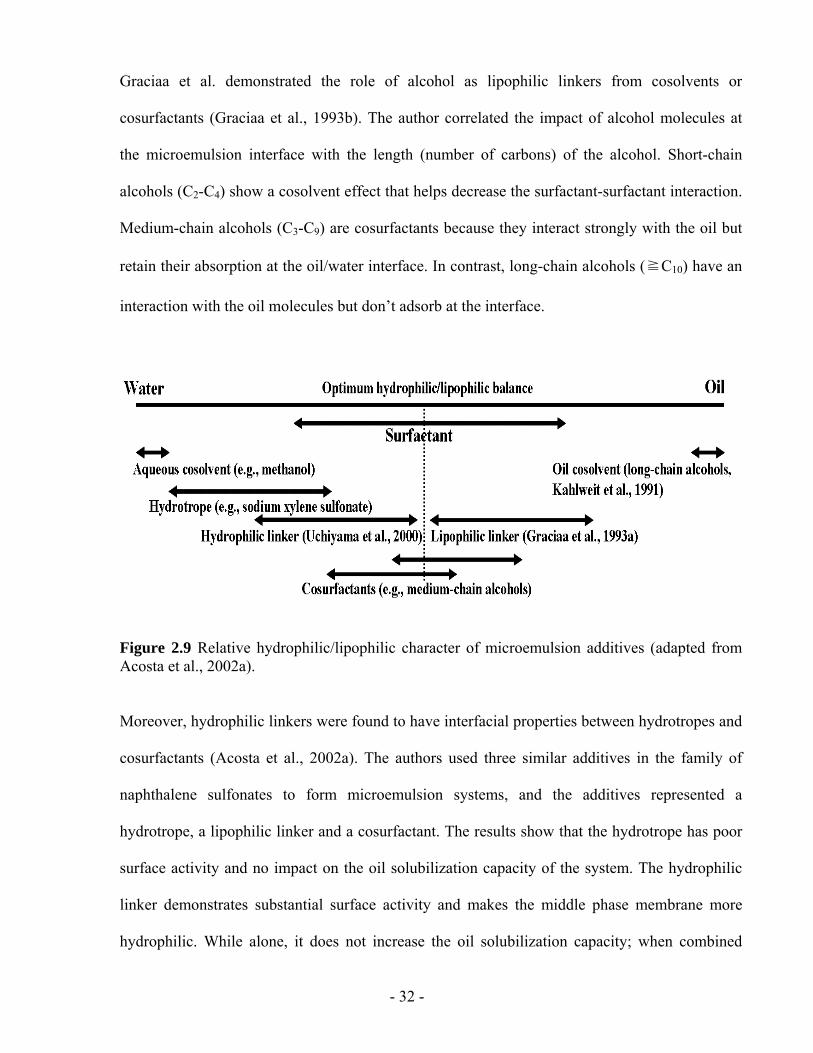
- 32 -
Graciaa et al. demonstrated the role of alcohol as lipophilic linkers from cosolvents or
cosurfactants (Graciaa et al., 1993b). The author correlated the impact of alcohol molecules at
the microemulsion interface with the length (number of carbons) of the alcohol. Short-chain
alcohols (C2-C4) show a cosolvent effect that helps decrease the surfactant-surfactant interaction.
Medium-chain alcohols (C3-C9) are cosurfactants because they interact strongly with the oil but
retain their absorption at the oil/water interface. In contrast, long-chain alcohols (≧C10) have an
interaction with the oil molecules but don’t adsorb at the interface.
Figure 2.9 Relative hydrophilic/lipophilic character of microemulsion additives (adapted from Acosta et al., 2002a).
Moreover, hydrophilic linkers were found to have interfacial properties between hydrotropes and
cosurfactants (Acosta et al., 2002a). The authors used three similar additives in the family of
naphthalene sulfonates to form microemulsion systems, and the additives represented a
hydrotrope, a lipophilic linker and a cosurfactant. The results show that the hydrotrope has poor
surface activity and no impact on the oil solubilization capacity of the system. The hydrophilic
linker demonstrates substantial surface activity and makes the middle phase membrane more
hydrophilic. While alone, it does not increase the oil solubilization capacity; when combined
- 33 -
with a lipophilic linker (dodecanol), they show a synergistic effect and increase the oil
solubilization. The cosurfactant shows increased surface activity over the hydrophilic linker and
increases the oil solubilization alone. Moreover, it does not show a synergistic effect with the
lipophilic linker.
2.3.5 Linker-based lecithin microemulsions
Alocohol-free lecithin microemulsions as “green solvents” have been reported using
biocompatible linker molecules (Acosta et al., 2005). Hexyl polyglucoside was used as the
hydrophilic linker and sorbitan monooleate served as the lipophilic linker in the microemulsion
systems (Figure 2.10). It was found that the linker-based lecithin formulations were able to form
microemulsions without the use of alcohols while achieving high solubilization capacity with a
wide range of oils. These systems have been proposed as alternatives to chlorinated solvents in
dry-cleaning applications and solvent delivery systems for pharmaceutical applications. However,
there have been no direct experiments studying their use in drug delivery. Furthermore, the hexyl
polyglucoside is reported to be a laxative and is not an FDA-approved ingredient.
2.4 CONCLUSIONS
The use of alcohols in conventional lecithin microemulsions is a shortcoming to transdermal
delivery vehicles. Linker-based lecithin formulations reported in literature provide a competitive
alternative to conventional alcohol-based lecithin microemulsions. The main objective of this
dissertation is to evaluate the use of linker-based lecithin microemulsions as TDD vehicles.
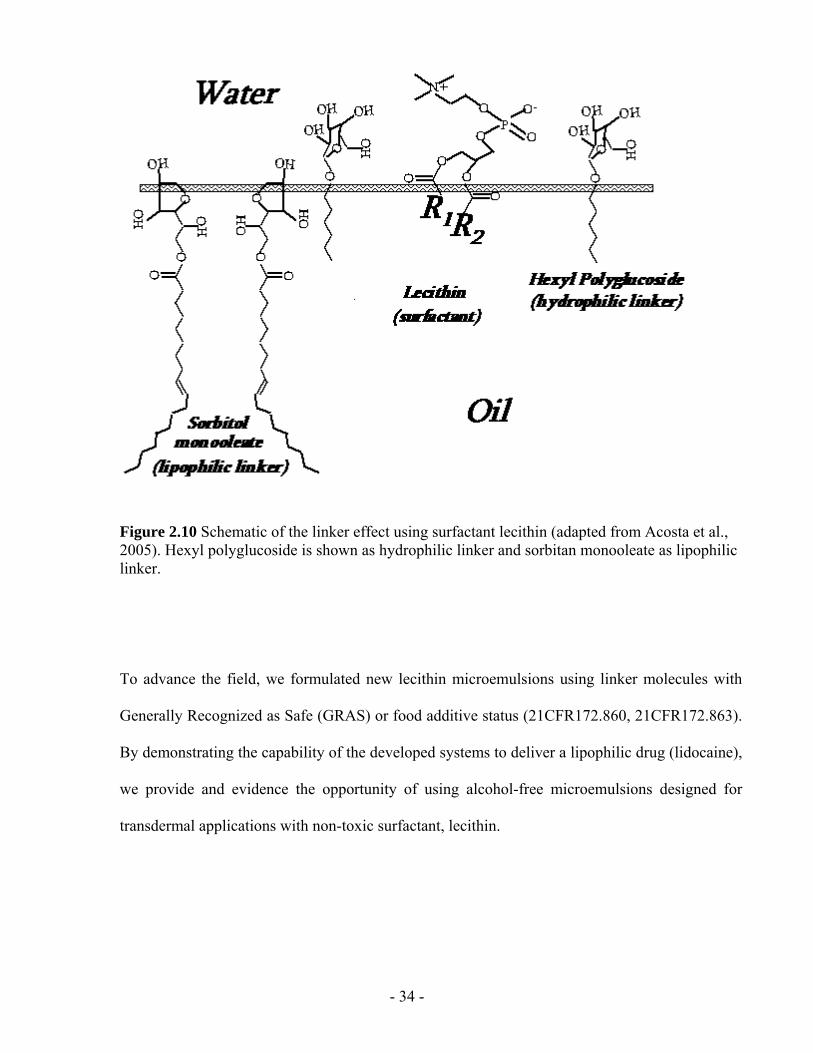
- 34 -
Figure 2.10 Schematic of the linker effect using surfactant lecithin (adapted from Acosta et al., 2005). Hexyl polyglucoside is shown as hydrophilic linker and sorbitan monooleate as lipophilic linker.
To advance the field, we formulated new lecithin microemulsions using linker molecules with
Generally Recognized as Safe (GRAS) or food additive status (21CFR172.860, 21CFR172.863).
By demonstrating the capability of the developed systems to deliver a lipophilic drug (lidocaine),
we provide and evidence the opportunity of using alcohol-free microemulsions designed for
transdermal applications with non-toxic surfactant, lecithin.
- 35 -
2.5 SCOPE
To develop new linker-based lecithin microemulsions and demonstrate their capacity to deliver
an oil-soluble drug, lidocaine, four parts of research were completed in this dissertation:
1. Chapter 3 reports alcohol-free lecithin microemulsions formulated with linker molecules
to act as transdermal delivery vehicles. The food-grade linker system consists of a
combination of sodium caprylate and caprylic acid (hydrophilic linkers), and sorbitan
monooleate (lipophilic linker). IPM was used a “carrier” oil for a lipophilic drug,
lidocaine. By varying the sodium caprylate concentration in the formulations, Type II
(w/o), Type IV (bicontinuous), and Type I (o/w) lecithin microemulsions were obtained.
The newly formulated lecithin-linker systems have low viscosity (10-40 cP) and small
particle size (~10 nm). The in vitro transdermal permeation studies show that, compared
to conventional lecithin-alcohol microemulsions, the newly formulated lecithin-linker
microemulsions provide higher drug flux across the skin, higher drug absorption in the
skin, and higher “skin” permeability. Furthermore, the in vitro cytotoxicity studies show
that the linker-based microemulsions are significantly less toxic than the alcohol-based
systems.
2. Chapter 4 takes advantage of the increased drug absorption found in Chapter 3 to produce
an extended release profile where drug-loaded skin is used as in situ patches. The in situ
patches after applying the lecithin-linker microemulsions are able to release 90% of their
content over a 24 h period which rivals the performance of some polymer-based patches.
Fluorescence micrographs of transversal cuts of skin loaded with Nile red are consistent
with the observed release profiles.
3. Chapter 5 describes the impact of surfactant concentrations on transdermal performance
of the studied lecithin-linker systems. As mentioned earlier, the use of microemulsions
- 36 -
has been limited in drug delivery due to large amounts of surfactants required in
formulations. This chapter includes data on the in vitro permeation and absorption of
lidocaine from the linker-based microemulsions as a function of surfactant concentrations.
The results have shown that increasing surfactant concentration improves the drug
absorption in the skin. Overall transdermal flux is found to increase as the surfactant
concentration increases up to a point where a plateau is reached (saturation). In general,
an optimal surfactant concentration exists in the linker-based lecithin microemulsions to
provide high drug absorption in the skin and a maximum transdermal flux.
4. A differential mass balance model is proposed in Chapter 4 and 5 to describe the drug
release profile from microemulsions to the skin. Chapter 4 presents the drug transfer from
the skin (in situ patch) to the receiver follows a first order release that depends on the
mass of drug initially loaded in the skin and a mass transfer coefficient. Chapter 5
extends the mass balance model from the donor (microemulsions) to the receiver by
understanding the role of surfactants in the transport of drugs through the skin. The
interdependence among different permeation parameters is illustrated.
Overall, the capacity of the new linker-based lecithin microemulsions as potentially safe and
effective TDD vehicles is demonstrated in this dissertation. The lecithin-linker systems are
proven to be less toxic and provide higher flux than the conventional lecithin-alcohol
microemulsions. Moreover, in situ patches can be formed after applying linker-based
microemulsions to provide extended release up to 24 h. There is an optimum surfactant amount
in the linker-based lecithin microemulsions to achieve high enough permeation flux but with
minimal cytotoxicity.
- 37 -
2.6 REFERENCES
Aboofazeli, R., Lawrence, M.J., 1993. Investigations into the formation and characterization of phospholipid microemulsions. I. Pseudo-ternary phase diagrams of systems containing water-lecithin-alcohol-isopropyl myristate. Int. J. Pharm. 93, 161-175.
Aboofazeli, R., Lawrence, C.B., Wicks, S.R., Lawrence, M.J., 1994. Investigations into the formation and characterization of phospholipid microemulsions. III. pseudo-ternary phase diagrams of systems containing water-lecithin-isopropyl myristate and either an alkanoic acid, amine, alkanediol, polyethylene glycol alkyl ether or alcohol as cosurfactant. Int. J. Pharm. 111, 63-72.
Aboofazeli, R., Patel, N., Thomas, M., Lawrence, M.J., 1995. Investigations into the formation and characterization of phospholipid microemulsions. IV. pseudo-ternary phase diagrams of systems containing water-lecithin-alcohol and oil; the influence of oil. Int. J. Pharm. 125,107-116.
Acosta, E., Uchiyama. H., Sabatini, D.A., Harwell, J.H., 2002a. The role of hydrophilic linkers. J. Surfactants Deterg. 5, 151-157.
Acosta, E., Uchiyama. H., Tran, S., Sabatini, D.A., Harwell, J.H., 2002b. Formulating chlorinated hydrocarbon microemulsions using linker molecules. Environ. Sci. Technol. 36, 4618.
Acosta, E., Szekeres, E., Sabatini, D.A., Harwell, J.H., 2003a. Net-average curvature model for solubilization and supersolubilization in surfactant microemulsions. Langmuir, 19, 186-195.
Acosta, E.J., Le, M.A., Harwell, J.H., Sabatini, D.A., 2003b. Coalescence and Solubilization Kinetics in Linker-Modified Microemulsions and Related Systems. Langmuir 19, 566-574.
Acosta E. J., Harwell J. H., Sabatini, D. A., 2004. Self-assembly in linker-modified microemulsions. J. Colloid Interface Sci. 274, 652-664.
Acosta, E.J., Nguyen, T., Witthayapanyanon, A., Harwell, J.H., Sabatini, D.A., 2005. Linker-based bio-compatible microemulsions. Environ. Sci. Technol. 39, 1275-1282.
Asbill, C., 2000. Enhancement of transdermal drug delivery: Chemical and physical approaches. Crit. Rev. Ther. Drug Carr. Syst. 17, 621-658.
Amann, A.H., Osborne, D.W., 1990. Topical drug delivery formulations. Marcel Dekker, New York.
Attwood, D., Mallon, C., Taylor, C.J. 1992. Phase studies on oil-in-water phospholipid microemulsions. Int. J. Pharm. 84, R5-R8.
Bagwe, R.P., Kanicky, J.R., Palla, B.J., Patanjali, P.K., Shah, D.O., 2001. Improved drug delivery using microemulsions: rationale, recent progress, and new horizons. Crit. Rev. Ther. Drug Carr. Syst. 18, 77-140.
- 38 -
Baroli, B., López-Quintela, M.A., Delgado-Charro, M.B., Fadda, A. M., Blanco-Méndez, J., 2000. Microemulsions for topical delivery of 8-methoxsalen. J. Controlled Release 69, 209-218.
Bhatnagar, S., Vyas, S.P., 1994. Organogel-based system for transdermal delivery of propranolol. J. Microencapsul. 11, 431-438.
Blum, F.D., Pickup, S., Ninham, B. 1985. Structure and dynamics in three-component microemulsions. J. Phys. Chem. 89, 711-713.
Bourrel, M., Schecter R., 1988. Microemulsions and related systems. Marcell Dekker, New York.
Boltri, L., Morel, S., Trotta, M., Gasco, M.R., 1994. In vitro transdermal permeation of nifedipine from thickened microemulsions. J. Pharm. Belg. 49, 315-320.
Bonina, F.P., Montenegro, L., Scrofani, N., Esposito, E., Cortesi, R., Menegatti, E., Nastruzzi, C. 1995. Effects of phospholipid based formulations on in vitro and in vivo percutaneous absorption of methyl nicotinate. J. Controlled Release 34, 53-63.
Bommannan, D., Potts, R.O., Guy, R.H., 1991. Examination of the effect of ethanol on human stratum corneum in vivo using infrared spectroscopy. J. Controlled Release 16, 299-304.
Bos., J.D., Kapsenberg., M.L., 1993. The skin immune system: progress in cutaneous biology. Immunology Today.14, 75-78.
Brime, B.A., Moreno, M.A., Frutos, G., Ballesteros, M.P., Frutos, P., 2002. Amphotericin B in oil-water lecithin-based microemulsions: formulation and toxicity evaluation. J. Pharm. Sco. 91, 1178-1185.
Bronaugh, R.L., Maibach, H.I., 2002, Topical absorption of dermatological products, Marcel Dekker, New York.
Cevc, G., 2004. Lipid vesicles and other colloids as drug carriers on the skin. Adv. Drug Deliv. Rev. 56, 675-711.
Changez, M., Chander, J., Dinda A. K., 2006. Transdermal permeation of tetracaine hydrochloride by lecithin microemulsion: In vivo. Colloids and Surfaces B. 48, 58–66
Chen, S. H., 1990. Micellar Solutions and Microemulsions: Structure, Dynamics, and Statistical Thermodynamics. Springer-Verlag, New York.
Daniels R., 2004. Strategies for skin penetration enhancemen. Skin Care Forum Online Issue 37, http://www.scf-online.com/english/37_e/37_e_pr/skinpenetration37_e_pr.htm
Danielsson, I., Lindman, B., 1981. The definition of a microemulsion, Colloids and Surfaces 3, 391–392.
Date, A. A. and Patravale, V. B., 2007. Microemulsions: applications in transdermal and dermal delivery. Crit. Rev. Ther. Drug Carrier Syst. 24(6), 547-596.
- 39 -
Delgado-Charro, M.B., Iglesias-Vilas, G., Blanco-Méndez, J., López-Quintela, M.A., Marty, J., Guy, R. H., 1997. Delivery of a hydrophilic solute through the skin from novel microemulsion systems. Eur. J. Pharm. Biopharm. 43, 37-42.
Dreher, F., Walde, P., Walther, P., Wehrli, E., 1997. Interaction of a lecithin microemulsion gel with human stratum corneum and its effect on transdermal transport. J. Controlled Release 45, 131-140.
Du Bois, Christine M., 2008. The world of soy. University of Illinois Press.
Dyson, R.D., 1978. Essentials of Cell Biology. 2nd ed. Allyn and Bacon, Boston.
Fartasch, M., Bassukas, I.D., Dipegen, T.L., 1993. Structural relationship between epidermal lipid lamellae, lamellar bodies and desmosomes in human epidermis. An ultrastructural study. Br. J. Dermatol. 128, 1-9.
Finnin, B.C., Morgan, T.M., 1999. Transdermal penetration enhancers: applications, limitations, and potential. J. Pharm. Sci. 88, 955-958.
Friberg, S.E., 1990. Micelles, microemulsions, liquid crystals, and the structure of stratum corneum lipids J. Soc. Cos. Chem. 41, 155-171.
Graciaa, A., Lachaise, J., Cucuphat, C., Bourrel, M., Salager, J.L., 1993a. Improving solubilization in microemulsions with additives 1.the lipophilic linker role. Langmuir 9, 669.
Graciaa, A., Lachaise, J., Cucuphat, C., Bourrel, M., Salager, J.L., 1993b. Improving solubilization in microemulsions with additives 2. Long chain alcohol as lipophilic linkers. Langmuir 9, 3371.
Griffin, W.C., 1949. Classification of Surface-Active Agents by HLB. J. Soc. Cosmet. Chem., 1, 311-326.
Guy, R.H., 1996. Current status and future prospects of transdermal drug delivery. Pharm. Res. 13, 1765-1769.
Guy, R.H., Hadgraft, J., 2003. Transdermal drug delivery, 2nd Ed. Marcel Dekker, New York.
Hadgraft, J., 2001. Skin, the final frontier, Int. J. Pharm. 224, 1-18.
Heuschkel. S., Goebel, A., Neubert, H. H., 2007. Microemulsions-modern colloidal carrier for dermal and transdermal drug delivery. J. Pharm. Sci., 97(2), 603-631.
Higgins, E.M., Du Vivier, A.W., 1992. Alcohol and the skin. Alcohol and Alcoholism 27, 595-602.
Hoar, T.P., Schulman, J.H., 1943. Transparent water-in-oil disper- sions: the oleopathic hydro-micelle, Nature 152, 102–103.
- 40 -
Kahlweit, M., Strey, B., Busse, G., 1991. Effect of alcohols on the phase bahvior of microemulsions. J. Phys.Chem. 95, 5344.
Kirjavainen, M., Mo nkkonen, J., Saukkosaari, M., Valjakka-Koskela, R., Kiesvaara, J., Urtti, A., 1999. Phospholipids affect stratum corneum lipid bilayer fluidity and drug partitioning into the bilayers. J. Controlled Release 58, 207-214.
Kogan, A., Garti, N., 2006. Microemulsions as transdermal drug delivery vehicles Adv. in Colloid and Interface Science 123-126 (SPEC. ISS.), 369-385.
Komesvarakul, N., Sanders, M.D., Szekeres, E., Acosta, E.J., Faller, J.F., Mentlik, T., Fisher, L.B., Scamehorn, J.F., 2006. Microemulsions of triglyceride-based oils: The effect of co-oil and salinity on phase diagrams. J. Cos. Sci. 57, 309-325.
Kreilgaard, M., Pedersen, E.J., Jaroszewski, J.W., 2000. NMR characterisation and transdermal drug delivery potential of microemulsion systems. J. Controled Release 69, 421-433.
Kreilgaard, M., 2002. Influence of microemulsions on cutaneous drug delivery. Adv. Drug Deliv. Rev. 54, S77-S98.
Kriwet, K., Mruuml, C.C., 1995. Diclofenac release from phospholipid drug systems and permeation through excised human stratum corneum. Int. J. Pharm. 125, 231-242.
Kumar, P., Mittal, K.L., 1999. Handbook of microemulsion science and technology, Marcel Dekker, New York.
Lawrence, M.J., Rees, G.D., 2000. Microemulsion-based media as novel drug delivery systems. Adv. Drug Deliv. Rev. 45, 89-121.
Langer, R., 2004. Transdermal drug delivery: Past progress, current status, and future prospects. Adv. Drug Deliv. Rev. 56, 557-558.
Lee, P.J., Langer, R., Shastri, V.P., 2003. Novel microemulsion enhancer formulation for simultaneous transdermal delivery of hydrophilic and hydrophobic Drugs. Pharm. Res. 20, 264-269.
Lashmar, 1989. Topical application of penetration enhancers to the skin of nude-mice - A histopathological study. J. Pharm. Pharmaco. 41,118.
Malcolmson, C., Satra, C., Kantaria, S., Sidhu, A., Lawrence, M.J., 1998. Effect of oil on the level of solubilization of testosterone propionate into nonionic oil-in-water microemulsions. J. Pharm. Sci. 87,109-116.
Michaels, A.S., Chandrasekaran, S.K., Shaw, J.E., 1975. Drug permeation through human skin: theory and in vitro experimental measurement. AICHE J., 21, 985-996.
Moreno, M.A., Ballesteros, M.P., Frutos, P., 2003. Lecithin-based oil-in-water microemulsions for parenteral use: pseudoternary phase diagrams, characterization and toxicity studies. J. Pharm. Sci. 92, 1428-1437.
- 41 -
Morimoto, Y., Sugibayashi, K., Kobayashi, D., Shoji, H., Yamazaki, J.-I., Kimura, M., 1993. A new enhancer-coenhancer system to increase skin permeation of morphine hydrochloride in vitro Int. J. Pharm. 91, 9-14
Moulik, S.P., Paul, B.K., 1998. Structure, dynamics and transport properties of microemulsions. Adv. Colloid Interface Sci. 78, 99-195.
Paolino, D., Ventura, C.A., Nisticò, S., Puglisi, G., Fresta, M., 2002. Lecithin microemulsions for the topical administration of ketoprofen: percutaneous adsorption through human skin and in vivo human skin tolerability. Int. J. Pharm. 244, 21-31.
Peltola, S., Saarinen-Savolainen, P., Kiesvaara, J., Suhonen, T.M., Urtti, A., 2003. Microemulsions for topical delivery of estradiol. Int. J. Pharm. 254, 99-107.
Podlogar, F., Bes ter Rogac, M., Gas perlin, M., 2005. The effect of internal structure of selected water-Tween 40®-Imwitor 308®-IPM microemulsions on ketoprofene release. Int. J. Pharm. 302, 68-77.
Prausnitz, 2004. Current status and future potential of transdermal drug delivery. Nature reviews. Drug discovery, 3, 115.
Rhee, Y. S., Choi, J. G., Park, E. S., Chi, S. C., 2001. Transdermal delivery of ketoprofen using microemulsions. Int. J. Pharm, 315, 52-58.
Rougier, A., Goldberg, A. M., Maibach, H.I. 1994. In vitro skin toxicology: irritation, phototoxicity, sensitization. Mary Ann Liebert, Inc. New York.
Sabatini, D.A., Acosta, E., Harwell, J.H., 2003. Linker molecules in surfactant mixtures. Curr. Opin. Colloids Interface Sci. 8, 316-326.
Saint Ruth, H., Attwood, D., Ktistis, G., Taylor, C.J., 1995. Phase studies and particle size analysis of oil-in-water phospholipid microemulsions. Int. J. Pharm., 116, 253-261.
Salager, J.L., Graciaa, A., Lachaise, J., 1998. Improving solubilization in microemulsion with additives. Part III: lipophilic linker optimization. J. Surfactant Deter. 1, 403.
Schmalfu, U., Neubert, R., Wohlrab, W., 1997. Modification of drug penetration into human skin using microemulsions. J. Controlled Release 46, 279-285.
Shahani, S. 2003, "C-050V advanced drug delivery systems: new developments, new technologies", Business Communications Company, Inc.,1, 0-159.
Shurtleff, W., 2006. Thesaurus for SoyaScan database of soybeans and soyfoods : with a count and the earliest date for each subject heading. Soyfoods Center.
Tenjarla, S., 1999. Microemulsions: an overview and pharmaceutical applications. Crit. Rev. Ther. Drug Carr. Syst. 16, 461-521.
- 42 -
Trotta, M., Pattarino, F., Grosa, G., 1998. Formation of lecithin-based microemulsions containing n-alkanol phosphocholines. Int. J. Pharm. 174, 253-259.
Trotta, M., Ugazio, E., Peira, E., Pulitano, C., 2003. Influence of ion pairing on topical delivery of retinoic acid from microemulsions. J. Controled Release 86, 315-321.
Trotta M, Gasco MR, Caputo O, Sancin P. 1994. Transcutaneous diffusion of hematoporphyrin in photodynamic therapy - in-vitro release from microemulsions. Pharma. Sci. 4, 150-154.
Uchiyama, H., Acosta, E., Sabatini, D.A., Harwell, J.H., 2000, Supersolubilization in chlorinated hydrocarbon microemulsions: solubilization enhancement by lipophilic and hydrophilic linkers. Ind. Eng. Chem. Res. 39, 2704.
Vandamme, T.F., 2002. Microemulsions as ocular drug delivery systems: recent developments and future challenges. Prog Ret Eye Res. 21, 15-34.
Wertz, P.W., Downing, D.T., 1991, Epidermal lipids, In: Physiology, Biochemistry and Molecular Biology of the Skin, Goldsmith, L.A. (Ed.). Oxford University Press, Oxford
Williams, A.C., Barry, B.W., 1992. Skin absorption enhancers. Crit. Rev. Ther. Drug Carrier Syst. 9, 305–353.
Warisnoicharoen, W., Lansley, A.B., Lawrence, M.J., 2000. Nonionic oil-in-water microemulsions: The effect of oil type on phase behaviour. Int. J. Pharm., 198, 7-27.
Williams, A.C., Barry, B.W. 2004. Penetration enhancers. Adv. Drug Del. Rev. 56, 603-618.
Willimann, H., Walde, P., Luisi, P.L., Gazzaniga, A., Stroppolo, F., 1992. Lecithin organogel as matrix for transdermal transport of drugs. J. Pharm. Sci. 81, 871-874.
Wolff, H., 2000. Optimal process design for the manufacture of transdermal drug delivery systems. Pharm. Sci. Tech. Today 3, 173-181.
- 43 -
CHAPTER 3
LINKER-BASED LECITHIN MICROEMULSIONS
FOR TRANSDERMAL DELIVERY OF LIDOCAINE
This chapter is derived from the following manuscript:
Yuan, J. S., Ansari, M., Samaan, M., Acosta, E., Linker-based lecithin microemulsions for
transdermal delivery of lidocaine. International Journal of Pharmaceutics. 2008, 349, 130-143.
- 44 -
3.1 ABSTRACT
In this work, we introduce alcohol-free lecithin microemulsions formulated with linkers to
produce transdermal delivery vehicles. The food-grade linker system consists of a combination
of sodium caprylate and caprylic acid (hydrophilic linkers), and sorbitan monooleate (lipophilic
linker). A “carrier” oil, isopropyl myristate (IPM), was used to predissolve a model lipophilic
drug, lidocaine. The first part of the article describes the phase behavior and physical properties
of these linker-based lecithin microemulsions. In the second part of the article, we evaluate the
transdermal permeation and cytotoxicity of lidocaine formulated in oil-in-water (Type I), water-
in-oil (Type II), and bicontinuous (Type IV) linker microemulsions. The transdermal permeation
studies show that, compared to a conventional Type II alcohol-based lecithin microemulsion,
Type II linker-based microemulsions provide twice the absorption and penetration of lidocaine
through skin. The larger flux obtained with linker systems is due to the presence of sodium
caprylate and caprylic acid. These hydrophilic linkers accelerate the microemulsion-skin mass
transfer by reducing the interfacial rigidity of the systems. Furthermore, the cytotoxicity studies
show that these linker microemulsions are significantly less toxic than the alcohol-based system.
The Type II linker microemulsion (containing approximately 4% lidocaine) has a comparable
cytotoxicity to water saturated with lidocaine (0.4% lidocaine).
3.2 INTRODUCTION
Transdermal drug delivery (TDD) is a convenient method of drug administration enabling
physicians to provide controlled delivery of drugs to patients with minimum discomfort.
Compared to oral and parenteral routes, the transdermal route of drug administration has the
- 45 -
advantages of reducing gastrointestinal side effects and reducing drug degradation (Amann and
Osborne, 1990; Bronaugh and Maibach, 2002; Guy and Hadgraft, 2003). However, the poor
permeability of the stratum corneum often limits the topical administration of novel drug
formulations (Walters, 2002; Michaels et al., 1975). There are various chemical and physical
methods to promote transdermal drug permeation through the disruption of the skin barrier. One
such method is the use of permeation enhancers (Asbill, 2000a) such as solvents or surfactants
that, although effective, tend to produce allergic reactions, skin irritation, and sensitization
(Welss et al., 2004). The main challenge for many transdermal formulations is to effectively
increase the permeability of the active ingredient through the stratum corneum while avoiding
allergic reactions, skin irritation, or skin sensitization.
In recent years, microemulsions have emerged as potential TDD vehicles for delivering drugs
through the skin (Bagwe et al., 2001; Kreilgaard, 2002; Lawrence and Rees, 2000; Tenjarla,
1999). Lecithin microemulsions are especially desirable because lecithin is a surfactant with
Generally Recognized as Safe (GRAS) status. However, because of the tendency of lecithin to
form lamellar and other liquid-crystal phases, it is necessary to use medium-chain alcohols as
cosurfactants to prevent the formation of those undesirable phases and promote the formation of
microemulsions (Tenjarla, 1999). Lecithin microemulsions containing pharmaceutically-
acceptable oils, such as IPM, have been formulated at several surfactant/cosurfactant mixing
ratios (Aboofazeli and Lawrence, 1993; Corswant and Söderman, 1998a; Saint Ruth et al., 1995).
Recent studies suggested that lecithin microemulsions produce enhanced transdermal flux for
oil-soluble drugs (Corswant et al., 1998b; Dreher et al., 1997; Paolino et al. 2002; Peltola et al.,
2003). Unfortunately, medium-chain alcohols such as butanol and pentanol used in these
formulations tend to dissolve cell membranes (McKarns et al, 1997) rendering the formulations
cytotoxic, which is a common shortcoming of microemulsion formulas (Bommannan et al., 1991;
- 46 -
Solans and Kunieda, 1997). One alternative to alcohol-based formulations is the use of
polymeric additives such as polyethylene glycol (PEG) (Corswant and Söderman, 1998a, US
patent 6,638,537 B2). While more effective and less toxic than alcohol-based formulas, polymer-
based formulations have a relatively high viscosity (this is desired in some, but not all
formulations).
With the introduction of linker molecules, there is now a second alternative to produce alcohol-
free microemulsion systems. It has been found that linker-based microemulsions with lecithin
have an exceptional solubilization capacity for a wide range of oils (Acosta et al., 2005). In those
linker-based lecithin microemulsions, sorbitan monooleate was used as lipophilic linker and
hexyl polyglucoside as hydrophilic linker. It was proposed that this linker system should mitigate
the toxicity concerns of lecithin formulations and act as a potential delivery vehicle. However,
there have been no previous reports on the use of linker-based lecithin microemulsions as TDD
vehicles, or any previous cytotoxicity studies of these systems.
In this work, we hypothesized that linker-based lecithin microemulsions can be formulated as
effective and potentially safe TDD vehicles for poorly water-soluble drugs. To produce such
formulations, we used the base of lecithin-linker formulation in the previous study (Acosta et al.,
2005), but we replaced the hydrophilic linker hexyl polyglucoside (not FDA-approved) by a
mixture of sodium caprylate and caprylic acid that have food additive status (21CFR172.860,
21CFR172.863). Figure 3.1 shows a schematic of surfactant and linker-self assembly at the
oil/water interface. The toxicological information of the substances used in this work is shown in
Table 3.1.
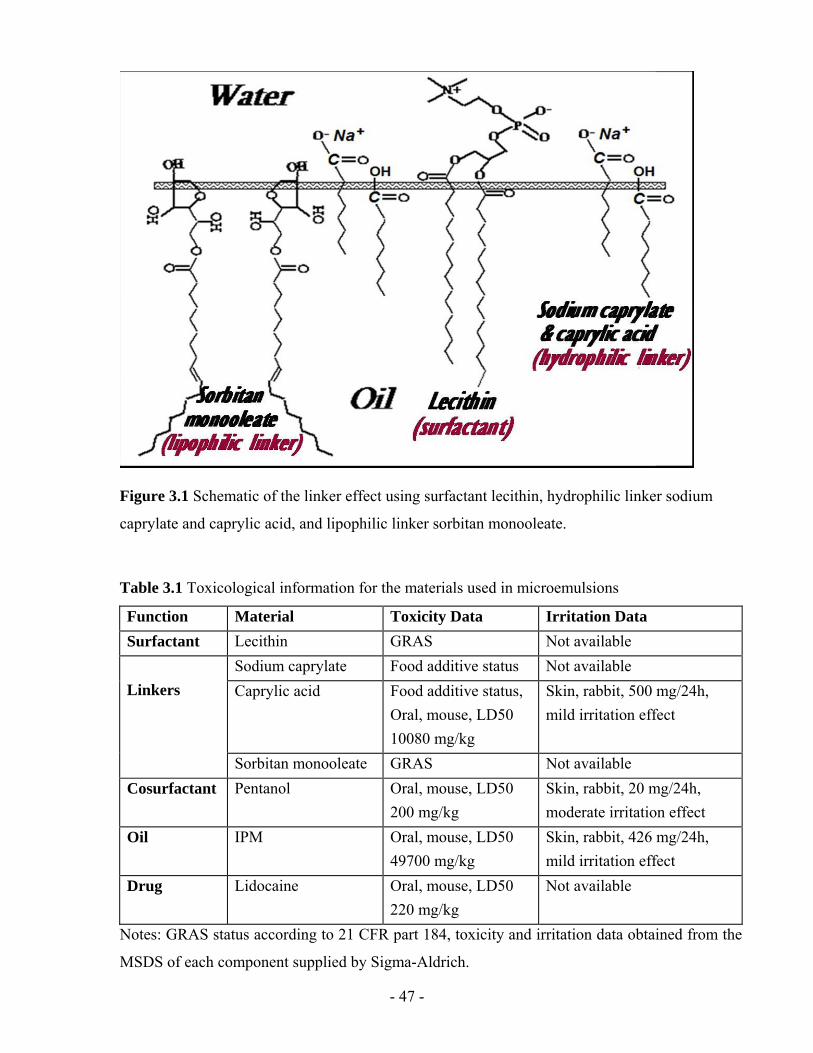
- 47 -
Figure 3.1 Schematic of the linker effect using surfactant lecithin, hydrophilic linker sodium
caprylate and caprylic acid, and lipophilic linker sorbitan monooleate.
Table 3.1 Toxicological information for the materials used in microemulsions
Function Material Toxicity Data Irritation Data Surfactant Lecithin GRAS Not available
Sodium caprylate Food additive status Not available Caprylic acid Food additive status,
Oral, mouse, LD50 10080 mg/kg
Skin, rabbit, 500 mg/24h, mild irritation effect
Linkers
Sorbitan monooleate GRAS Not available Cosurfactant Pentanol Oral, mouse, LD50
200 mg/kg Skin, rabbit, 20 mg/24h, moderate irritation effect
Oil
IPM Oral, mouse, LD50 49700 mg/kg
Skin, rabbit, 426 mg/24h, mild irritation effect
Drug Lidocaine Oral, mouse, LD50 220 mg/kg
Not available
Notes: GRAS status according to 21 CFR part 184, toxicity and irritation data obtained from the
MSDS of each component supplied by Sigma-Aldrich.
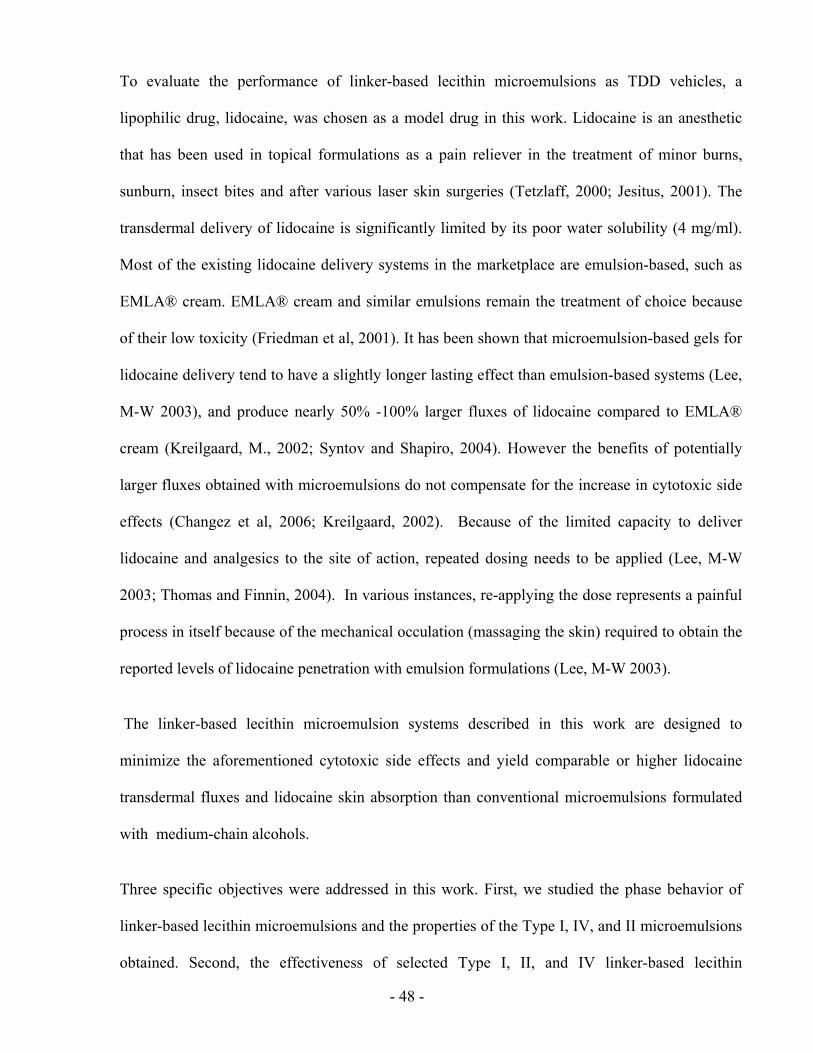
- 48 -
To evaluate the performance of linker-based lecithin microemulsions as TDD vehicles, a
lipophilic drug, lidocaine, was chosen as a model drug in this work. Lidocaine is an anesthetic
that has been used in topical formulations as a pain reliever in the treatment of minor burns,
sunburn, insect bites and after various laser skin surgeries (Tetzlaff, 2000; Jesitus, 2001). The
transdermal delivery of lidocaine is significantly limited by its poor water solubility (4 mg/ml).
Most of the existing lidocaine delivery systems in the marketplace are emulsion-based, such as
EMLA® cream. EMLA® cream and similar emulsions remain the treatment of choice because
of their low toxicity (Friedman et al, 2001). It has been shown that microemulsion-based gels for
lidocaine delivery tend to have a slightly longer lasting effect than emulsion-based systems (Lee,
M-W 2003), and produce nearly 50% -100% larger fluxes of lidocaine compared to EMLA®
cream (Kreilgaard, M., 2002; Syntov and Shapiro, 2004). However the benefits of potentially
larger fluxes obtained with microemulsions do not compensate for the increase in cytotoxic side
effects (Changez et al, 2006; Kreilgaard, 2002). Because of the limited capacity to deliver
lidocaine and analgesics to the site of action, repeated dosing needs to be applied (Lee, M-W
2003; Thomas and Finnin, 2004). In various instances, re-applying the dose represents a painful
process in itself because of the mechanical occulation (massaging the skin) required to obtain the
reported levels of lidocaine penetration with emulsion formulations (Lee, M-W 2003).
The linker-based lecithin microemulsion systems described in this work are designed to
minimize the aforementioned cytotoxic side effects and yield comparable or higher lidocaine
transdermal fluxes and lidocaine skin absorption than conventional microemulsions formulated
with medium-chain alcohols.
Three specific objectives were addressed in this work. First, we studied the phase behavior of
linker-based lecithin microemulsions and the properties of the Type I, IV, and II microemulsions
obtained. Second, the effectiveness of selected Type I, II, and IV linker-based lecithin
- 49 -
microemulsions, and a Type II pentanol-based lecithin microemulsion as TDD vehicles was
investigated using in vitro permeation tests. Finally, the in vitro cell viability of skin tissue
cultures exposed to the microemulsion vehicles was evaluated using the MTT (3-[4,5-
dimethylthiazol-2-yl]-2,5-diphenyltetrazolium bromide) assay.
3.3 MATERIALS AND METHODS
3.3.1 Materials
3.3.1.1 Chemicals
The following chemicals were purchased from Sigma-Aldrich (St. Louis, MO, USA) at the
concentrations shown in parentheses, and were used as received: sorbitan monooleate (Span® 80,
99%+), sodium caprylate (99%+), caprylic acid (99%+), isopropyl myristate (IPM, 98%),
sodium chloride (99%+, Fluka brand), 1-pentanol (99%+), Dulbecco’s phosphate buffered saline
(PBS) and lidocaine powder (base form, 98%+). Laboratory grade soybean lecithin (99%+) was
purchased from Fisher Scientific (Fairlawn, NJ, USA). Soybean lecithin is a mixture of
phospholipids (mainly phosphatidyl cholines) produced by acetone purification of soybean gum
residues. Sodium phosphate monobasic, monohydrate (ACS grade) and acetonitrile (HPLC grade)
were purchased from EMD Chemicals Inc. (Darmstadt, Germany), and they were used as
received. Anhydrous ethyl alcohol was purchased from Commercial Alcohols Inc. (Brampton,
ON, Canada). Unless otherwise stated, the composition is expressed on a mass basis (i.e. % wt.)
throughout this paper.
- 50 -
3.3.1.2 Skin
Two types of skin models were used. Reconstructed human skin models, EpiDermTM EPI-200
were purchased from MatTek Corporation (Ashland, MA, USA). The skin tissue was artificially
derived from normal human epidermal keratinocytes (Faller et al., 2002). The tissues were stored
in a refrigerator at 4°C and used within three days after being received. Pig ear skin from adult
domestic pigs (approximately 6 months old) was studied as a surrogate for human epidermis. Pig
ears were obtained from the local market and frozen overnight. Prior to use, they were thawed by
rinsing with running water for ten seconds at room temperature. The skin of the external side of
the ear was then dermatomed to a thickness that ranged from 700 to 900 μm (Bronaugh and
Maibach, 1991). After that, the thin skin layer was cut in circles of 7.4 mm diameter ready for
use.
3.3.2 Microemulsion preparation
Phase behaviour studies were performed using equal volumes of aqueous solution and oil (5 ml
of each) in flat bottom test tubes. To obtain a phase transition of Winsor Type II - Type III or IV
- Type I, the concentration of sodium caprylate was gradually increased (using a separate test
tube for each concentration increment) while maintaining constant temperature (23±1°C – room
temperature, unless stated otherwise), electrolyte concentration (0.9% NaCl in the aqueous
solution) and pressure (1 atm). This procedure will be referred to as a hydrophilic linker (sodium
caprylate) scan (Acosta et al., 2005). After introducing all the ingredients, the test tubes were
thoroughly vortexed, then vortexed once a day for three days, and left to equilibrate for two
weeks. After these systems reached equilibrium, the microemulsion volume fraction was
calculated by measuring the volume of the microemulsion and excess phase(s) (if any) in the test
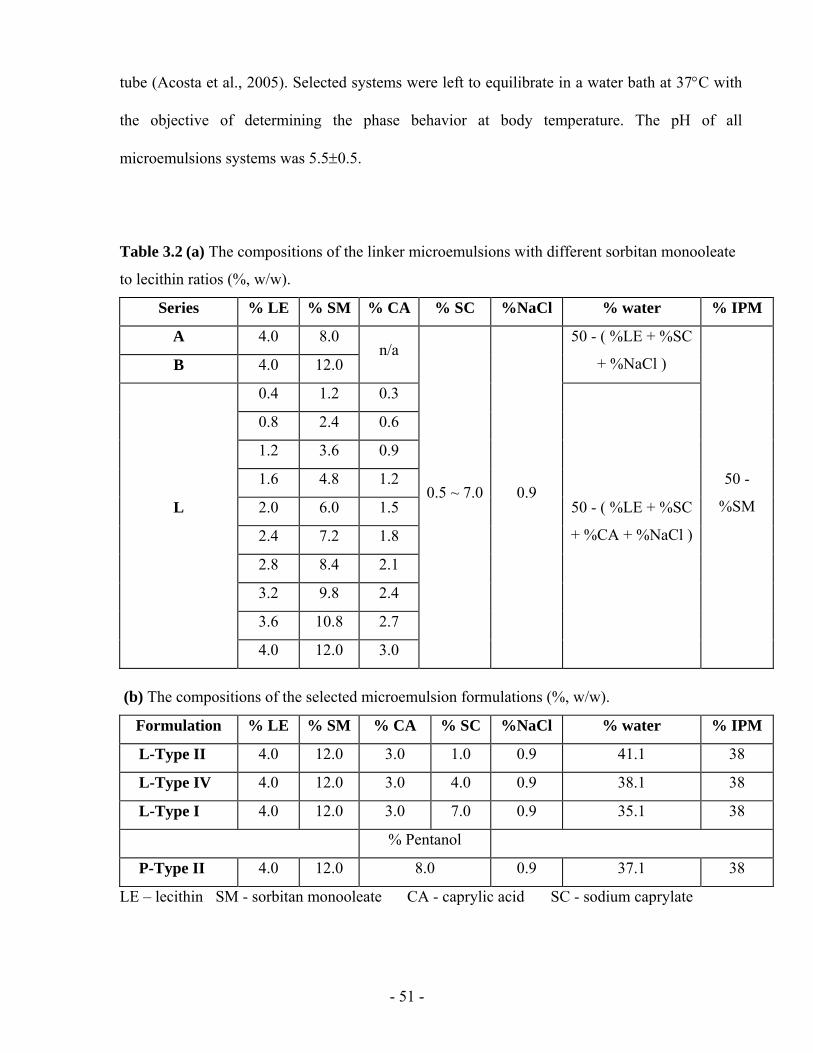
- 51 -
tube (Acosta et al., 2005). Selected systems were left to equilibrate in a water bath at 37°C with
the objective of determining the phase behavior at body temperature. The pH of all
microemulsions systems was 5.5±0.5.
Table 3.2 (a) The compositions of the linker microemulsions with different sorbitan monooleate
to lecithin ratios (%, w/w).
Series % LE % SM % CA % SC %NaCl % water % IPM
A 4.0 8.0
B 4.0 12.0 n/a
50 - ( %LE + %SC
+ %NaCl )
0.4 1.2 0.3
0.8 2.4 0.6
1.2 3.6 0.9
1.6 4.8 1.2
2.0 6.0 1.5
2.4 7.2 1.8
2.8 8.4 2.1
3.2 9.8 2.4
3.6 10.8 2.7
L
4.0 12.0 3.0
0.5 ~ 7.0 0.9 50 - ( %LE + %SC
+ %CA + %NaCl )
50 -
%SM
(b) The compositions of the selected microemulsion formulations (%, w/w).
Formulation % LE % SM % CA % SC %NaCl % water % IPM
L-Type II 4.0 12.0 3.0 1.0 0.9 41.1 38
L-Type IV 4.0 12.0 3.0 4.0 0.9 38.1 38
L-Type I 4.0 12.0 3.0 7.0 0.9 35.1 38
% Pentanol
P-Type II 4.0 12.0 8.0 0.9 37.1 38
LE – lecithin SM - sorbitan monooleate CA - caprylic acid SC - sodium caprylate
- 52 -
Sorbitan monooleate to lecithin weight ratios of 1:1, 2:1 and 3:1 were investigated. Using a
sorbitan monooleate to lecithin ratio of 1:1, microemulsions could not be formed; instead, highly
viscous liquid crystalline phases were found. Table 3.2a presents a summary of the formulations
considered in this study. In series A, the sorbitan monooleate to lecithin ratio was 2:1. In series B,
a sorbitan monooleate to lecithin mass ratio of 3:1 was used. In series L, the 3:1 sorbitan
monooleate to lecithin mass ratio was kept, but caprylic acid was introduced to facilitate the
formation of Type III/IV microemulsions. For each series, sodium caprylate scans were
performed for phase behaviour studies. A lecithin concentration of 4% was used in Series A and
B, while different lecithin concentration from 0.4% to 4% were investigated in Series L.
A pentanol-based lecithin microemulsion was formulated using 4% lecithin, 12% sorbitan
monooleate, and 0.9% NaCl. The idea of keeping the base lecithin formulation the same as in
one of Series L, but replacing the hydrophilic linker mixture (sodium caprylate plus caprylic acid)
by pentanol was to evaluate the difference between a fully formulated linker system and a system
that resembles the more conventional formulation approach of using medium-chain alcohols as
cosurfactants. Unfortunately, this strategy did not yield a microemulsion phase transition (II-IV-I)
for the pentanol series. A value of 8% pentanol in the mixture (which produces a Type II
microemulsion) was fixed for comparative studies with linker-based lecithin microemulsions.
Lidocaine was introduced in the formulations by predissolving this drug in IPM to a
concentration of 10% (10% lido-IPM). In this study, all microemulsions were loaded with
lidocaine, unless otherwise stated. After the microemulsion formulated with the lidocaine-IPM
mixture reached equilibrium (for Type I and Type II systems), the lidocaine that partitioned into
the microemulsion and the excess phase was measured using high performance liquid
chromatography as explained below.
- 53 -
3.3.3 Physicochemical characterization
Dynamic light scattering measurements of the hydrodynamic radius and polydispersity of the
microemulsion droplets were performed at room temperature (23±1°C) using a BI-200SM
Brookhaven instrument equipped with a 35 mW green laser (wavelength ~514 nm) and a
photomultiplier detector located at a fixed angle of 90°. Microemulsion samples were poured
into standard glass cells that were placed in the BI-200SM sample holder at least 10 minutes
before measurement. Refractive indexes for the continuous phase were obtained from the
literature (CRC Handbook, 1988). The viscosity of the samples was measured (in triplicate) at
room temperature using a CV-2200 falling ball viscometer (Gilmont Instruments, Barrington, IL,
USA).
3.3.4 Lidocaine partitioning studies
After equilibration, the microemulsion and the excess phases in a test tube were sampled using a
gas-tight syringe. To collect the sample of the lower phase, a gap of air was left in the syringe as
the needle penetrated the upper phase. Once in the lower phase the air bubble was pushed out
and the sample was taken. The lidocaine concentration in each phase was measured using the
HPLC method described in section 3.3.7.
3.3.5 In vitro permeation studies
The transdermal flux and drug permeability from test formulations were measured in vitro using
reconstructed human skin EpiDermTM EPI-200 and pig ear skin. All permeation experiments
were performed according to the MatTek standard percutaneous absorption protocol. Briefly, the
- 54 -
model skin was placed in a MatTek Permeation Device (MPD), with the epidermis facing up.
The microemulsion formulation (0.4 ml) was applied in the donor compartment. The receptor
compartment was filled with 5 ml of PBS (0.01M phosphate, 0.137M NaCl, pH 7.4). At
predetermined times (0.5 h, 1.5 h, 2.5 h, 3.5 h, 4.5 h and 5.5 h), the receiver solution was
withdrawn completely from the receptor compartment and was immediately replaced by fresh
PBS solution. At 5.5 h, the experiment was terminated. All permeation experiments were
conducted in triplicate at room temperature. The MatTek human skin remaining after in vitro
permeation study was used for in vitro cytotoxicity study, while the pig skin remaining after the
permeation study was used to test the lidocaine absorbed into the skin.
Prior to measuring the absorbed lidocaine, the pig skin was rinsed with a PBS solution and
placed into 2 ml methanol for overnight extraction of lidocaine. The equivalent lidocaine
concentration absorbed in skin was calculated as the mass of lidocaine extracted from the skin
divided by the volume of the skin (exposed area×thickness), and is expressed in mg/ml. We have
determined, using a mass balance closure in selected samples, that the efficiency of this methanol
extraction procedure is more than 95%.
The cumulative mass of lidocaine (μg) permeated across the skin was plotted as a function of
time (h), and the average steady-state flux (J, μg/h/cm2) was calculated by dividing the slope of
the linear part of the curve (dm/dt) by the area of the exposed skin surface (A). The apparent
lidocaine permeability (kp,cm/h) is calculated as kp=J/ΔCv, where ΔCv is the lidocaine
concentration difference between the donor and receptor. While the concentration of lidocaine in
donor and receptor varies as a function of time, we calculated ΔCv as the difference between the
initial concentration of the drug in the donor minus the final concentration of the drug in the
receiver after each time interval. This approximation represents an error of less than 5% for most
cases. Equation 3.1 reflects the flux and permeability described above.
- 55 -
vp Ckdtdm
AJ Δ×=×=
1 (Equation 3.1)
3.3.6 In vitro cytotoxicity studies
The MTT cell viability assay was performed on the reconstructed human skin EpiDermTM EPI-
200 as described in the standard MTT-ET-50 protocol provided by MatTek (Faller et al., 2002).
In this method, the yellowish MTT indicator is transformed into an insoluble purple formazan by
mitochondrial dehydrogenases of living cells. At the end of the exposure period during the
permeation studies (5.5 h), the EpiDerm skin model was removed from the MPD, and incubated
with 1 mg/ml MTT for 3 h to form formazan. The water-insoluble formazan was then extracted
and analyzed spectrophotometrically. In this assay, 1% (w/v) Triton X-100 was used as the
positive control and PBS was used as a negative (non-toxic) control. The cell viability is
calculated as the ratio of optical density of the sample divided by the optical density of the
negative control.
3.3.7 Lidocaine quantification
The concentration of lidocaine in the microemulsion, the excess phase, donor solutions and skin
was quantified using high performance liquid chromatography (Shimadzu HPLC equipped with
a Perkin Elmer LC235C Diode Array Detector, SIL-10AP autosampler, a 20 μl loop, and a
200LC pump) with a reverse phase column (Genesis, C18, 4 μm, 150×4.6 mm). The mobile
phase consisted of acetonitrile-0.05 M NaH2PO4·H2O (pH 2.0) (30:70, v/v) and the measurement
was conducted under isocratic conditions (1.0 ml/min). The UV detector was set to 230 nm. The
retention time of lidocaine under these conditions was approximately 2.5 minutes. The peak area
- 56 -
correlated linearly with the concentration of lidocaine (R2=0.9998) in the range of 0.05-600
μg/ml. Limit of quantitation was 0.05 μg/ml; coefficient of variation (CV) was 1.0% at 2 μg/ml.
Lidocaine in receiver solutions was assayed by a UV spectrophotometer (Ultrospec Plus,
Amersham Pharmacia Biotech, USA). Receiver solutions were diluted with methanol and the
absorbance at 230 nm was measured. A linear calibration curve for lidocaine was obtained at 230
nm in the range of 0.01-100 μg/ml with a correlation (R2) of 0.999. Randomly selected samples
of the receiver were also measured using the HPLC method. The difference between these two
methods was <10%.
3.3.8 Statistical data analysis
All transdermal permeation values were calculated from three independent experiments, and data
are expressed as the mean value ± S.D. Statistical analysis of J and kp, as well as cytotoxicity
values, was performed using a one-way analysis of variance (ANOVA) to test the difference
between the means of two or more delivery systems. Data with P<0.05 are considered
statistically significant.
3.4 RESULTS AND DISCUSSION
3.4.1 Phase behaviour
3.4.1.1 Sodium caprylate scans
The composition of linker-based microemulsion systems is shown in Table 3.2. Series A and B
were formulated with 4% lecithin using a sorbitan monooleate to lecithin ratio of 2:1 and 3:1,
- 57 -
respectively. For Series A, the transition from Type II to Type I occurs when the sodium
caprylate concentration increases from 3.5% to 4%. For Series B, the Type II–I transition occurs
when the sodium caprylate concentration increases from 4% to 4.5%.
The observations discussed above lead us to infer that scanning the sodium caprylate
concentration is an effective method to formulate linker-based lecithin microemulsions. One
could fix the desired lecithin and lipophilic linker concentration, electrolyte composition, drug
and oil and simply adjust the sodium caprylate concentration to obtain the Type II-I transition.
However, the drawback of sodium caprylate formulations is that, when approaching the phase
inversion (II-I), stable gel-like emulsions were found and there were no Winsor Type III or IV
microemulsions formed. The appearance of these metastable gel phases was more severe for
systems enriched in lecithin (series A).
One of the roles of hydrophilic linkers is to prevent the formation of gel and liquid crystal phases.
These results suggest that sodium caprylate alone is not an effective hydrophilic linker. The
initial selection of sodium caprylate as an alternative to hexyl polyglucoside (Acosta et al., 2005)
was based on a previous study that suggested that sodium caprylate could be used as hydrophilic
linker (Acosta et al., 2002). However, the same study proposes that the effectiveness of a
hydrophilic linker depends on the degree to which this linker participates at the oil/water
interface. Unfortunately, sodium caprylate is highly hydrophilic and tends to be more water
soluble (i.e. higher critical micelle concentration, CMC) than other hydrophilic linkers,
suggesting that caprylate does not effectively coadsorb with lecithin at the oil/water interface.
The simplest way to reduce the hydrophilicity of sodium caprylate is by reducing its degree of
saponification. One way to simulate partially saponified caprylic acid is by using a mixture of
sodium caprylate and caprylic acid as hydrophilic linkers. This is evaluated in the next section.
- 58 -
3.4.1.2 Sodium caprylate plus caprylic acid
Series L (Table 3.2a) incorporates a mixture of caprylic acid and sodium caprylate as hydrophilic
linkers. With the addition of caprylic acid, the phase behaviour of the Series L formulations with
same lecithin concentration (i.e. 4%) was significantly improved when compared to Series A and
B. When conducting the sodium caprylate scan, a clear Type II – Type IV – Type I phase
transition was achieved in the L-Series with 4% lecithin. The presence of caprylic acid helps to
balance the hydrophilicity of the formulation. Figure 3.1 shows a hypothetical schematic of
surfactant and linker-self assembly at the oil/water interface. According to this schematic, the
surfactant molecules (lecithin, shown as phosphatidylcholine) are present at the interface with
the hydrophiphilic group (surfactant head) in the water and the hydrophobic group (surfactant
tail) in the oil. The lipophilic linker molecules (sorbitan monooleate) orientate along the
surfactant tail to increase oil solubilization. The hydrophilic linker molecules (the combination of
sodium caprylate and caprylic acid) coadsorb along with the surfactant head, increasing the
interfacial area. It should be noted, however, that this schematic proposed by Acosta et
al.(Acosta et al., 2002) has not been fully confirmed experimentally.
Figure 3.2b illustrates the phase behavior for the L-Series formulated with 4% lecithin. As the
concentration of sodium caprylate increases from 0.5% to 3%, the volume fraction of the excess
water reduces due to the increased solubilization of water in reverse micelles. At 3.5% and 4%
sodium caprylate, clear Type IV bicontinuous phases are formed with no excess phases. At
concentrations of sodium caprylate of 4.5% and higher, Type I microemulsions are produced.
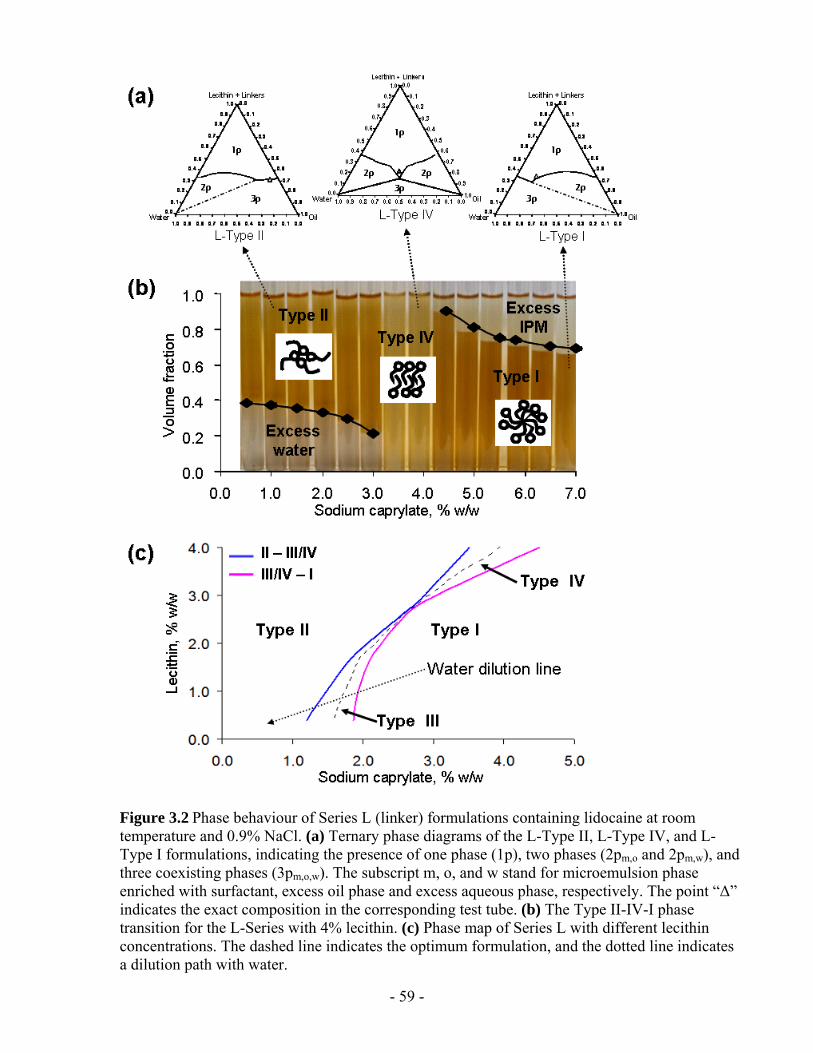
- 59 -
Figure 3.2 Phase behaviour of Series L (linker) formulations containing lidocaine at room temperature and 0.9% NaCl. (a) Ternary phase diagrams of the L-Type II, L-Type IV, and L-Type I formulations, indicating the presence of one phase (1p), two phases (2pm,o and 2pm,w), and three coexisting phases (3pm,o,w). The subscript m, o, and w stand for microemulsion phase enriched with surfactant, excess oil phase and excess aqueous phase, respectively. The point “Δ” indicates the exact composition in the corresponding test tube. (b) The Type II-IV-I phase transition for the L-Series with 4% lecithin. (c) Phase map of Series L with different lecithin concentrations. The dashed line indicates the optimum formulation, and the dotted line indicates a dilution path with water.
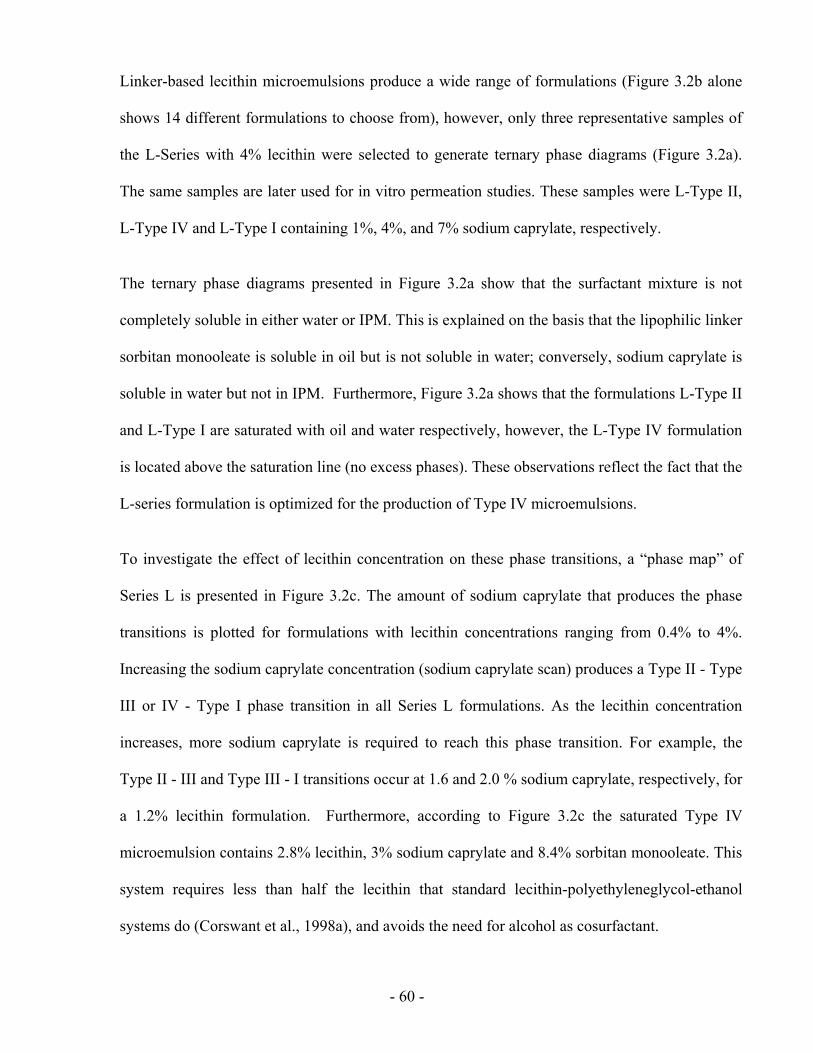
- 60 -
Linker-based lecithin microemulsions produce a wide range of formulations (Figure 3.2b alone
shows 14 different formulations to choose from), however, only three representative samples of
the L-Series with 4% lecithin were selected to generate ternary phase diagrams (Figure 3.2a).
The same samples are later used for in vitro permeation studies. These samples were L-Type II,
L-Type IV and L-Type I containing 1%, 4%, and 7% sodium caprylate, respectively.
The ternary phase diagrams presented in Figure 3.2a show that the surfactant mixture is not
completely soluble in either water or IPM. This is explained on the basis that the lipophilic linker
sorbitan monooleate is soluble in oil but is not soluble in water; conversely, sodium caprylate is
soluble in water but not in IPM. Furthermore, Figure 3.2a shows that the formulations L-Type II
and L-Type I are saturated with oil and water respectively, however, the L-Type IV formulation
is located above the saturation line (no excess phases). These observations reflect the fact that the
L-series formulation is optimized for the production of Type IV microemulsions.
To investigate the effect of lecithin concentration on these phase transitions, a “phase map” of
Series L is presented in Figure 3.2c. The amount of sodium caprylate that produces the phase
transitions is plotted for formulations with lecithin concentrations ranging from 0.4% to 4%.
Increasing the sodium caprylate concentration (sodium caprylate scan) produces a Type II - Type
III or IV - Type I phase transition in all Series L formulations. As the lecithin concentration
increases, more sodium caprylate is required to reach this phase transition. For example, the
Type II - III and Type III - I transitions occur at 1.6 and 2.0 % sodium caprylate, respectively, for
a 1.2% lecithin formulation. Furthermore, according to Figure 3.2c the saturated Type IV
microemulsion contains 2.8% lecithin, 3% sodium caprylate and 8.4% sorbitan monooleate. This
system requires less than half the lecithin that standard lecithin-polyethyleneglycol-ethanol
systems do (Corswant et al., 1998a), and avoids the need for alcohol as cosurfactant.
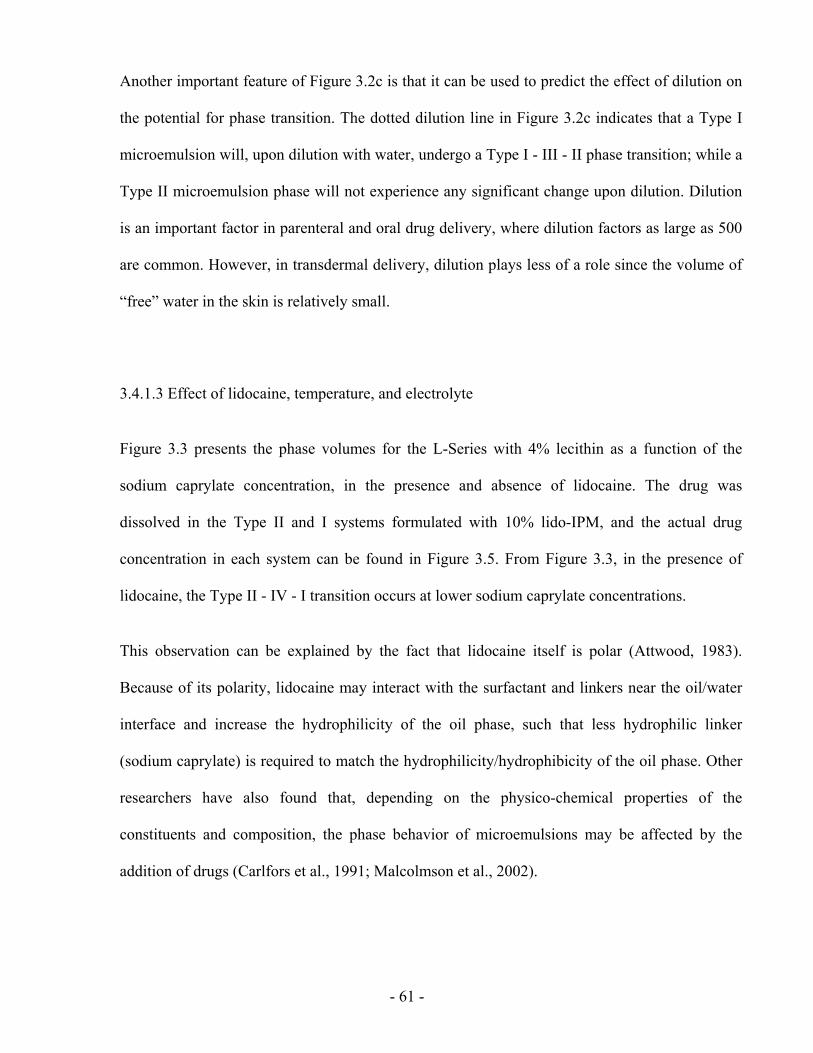
- 61 -
Another important feature of Figure 3.2c is that it can be used to predict the effect of dilution on
the potential for phase transition. The dotted dilution line in Figure 3.2c indicates that a Type I
microemulsion will, upon dilution with water, undergo a Type I - III - II phase transition; while a
Type II microemulsion phase will not experience any significant change upon dilution. Dilution
is an important factor in parenteral and oral drug delivery, where dilution factors as large as 500
are common. However, in transdermal delivery, dilution plays less of a role since the volume of
“free” water in the skin is relatively small.
3.4.1.3 Effect of lidocaine, temperature, and electrolyte
Figure 3.3 presents the phase volumes for the L-Series with 4% lecithin as a function of the
sodium caprylate concentration, in the presence and absence of lidocaine. The drug was
dissolved in the Type II and I systems formulated with 10% lido-IPM, and the actual drug
concentration in each system can be found in Figure 3.5. From Figure 3.3, in the presence of
lidocaine, the Type II - IV - I transition occurs at lower sodium caprylate concentrations.
This observation can be explained by the fact that lidocaine itself is polar (Attwood, 1983).
Because of its polarity, lidocaine may interact with the surfactant and linkers near the oil/water
interface and increase the hydrophilicity of the oil phase, such that less hydrophilic linker
(sodium caprylate) is required to match the hydrophilicity/hydrophibicity of the oil phase. Other
researchers have also found that, depending on the physico-chemical properties of the
constituents and composition, the phase behavior of microemulsions may be affected by the
addition of drugs (Carlfors et al., 1991; Malcolmson et al., 2002).
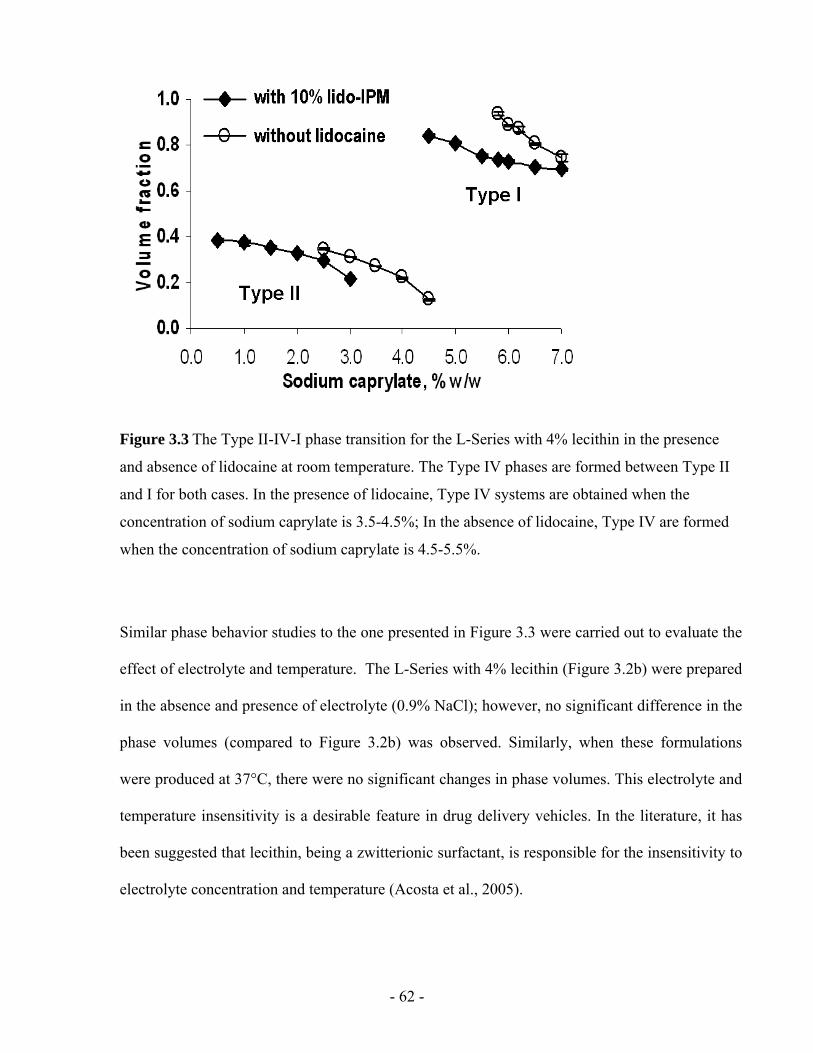
- 62 -
Figure 3.3 The Type II-IV-I phase transition for the L-Series with 4% lecithin in the presence
and absence of lidocaine at room temperature. The Type IV phases are formed between Type II
and I for both cases. In the presence of lidocaine, Type IV systems are obtained when the
concentration of sodium caprylate is 3.5-4.5%; In the absence of lidocaine, Type IV are formed
when the concentration of sodium caprylate is 4.5-5.5%.
Similar phase behavior studies to the one presented in Figure 3.3 were carried out to evaluate the
effect of electrolyte and temperature. The L-Series with 4% lecithin (Figure 3.2b) were prepared
in the absence and presence of electrolyte (0.9% NaCl); however, no significant difference in the
phase volumes (compared to Figure 3.2b) was observed. Similarly, when these formulations
were produced at 37°C, there were no significant changes in phase volumes. This electrolyte and
temperature insensitivity is a desirable feature in drug delivery vehicles. In the literature, it has
been suggested that lecithin, being a zwitterionic surfactant, is responsible for the insensitivity to
electrolyte concentration and temperature (Acosta et al., 2005).
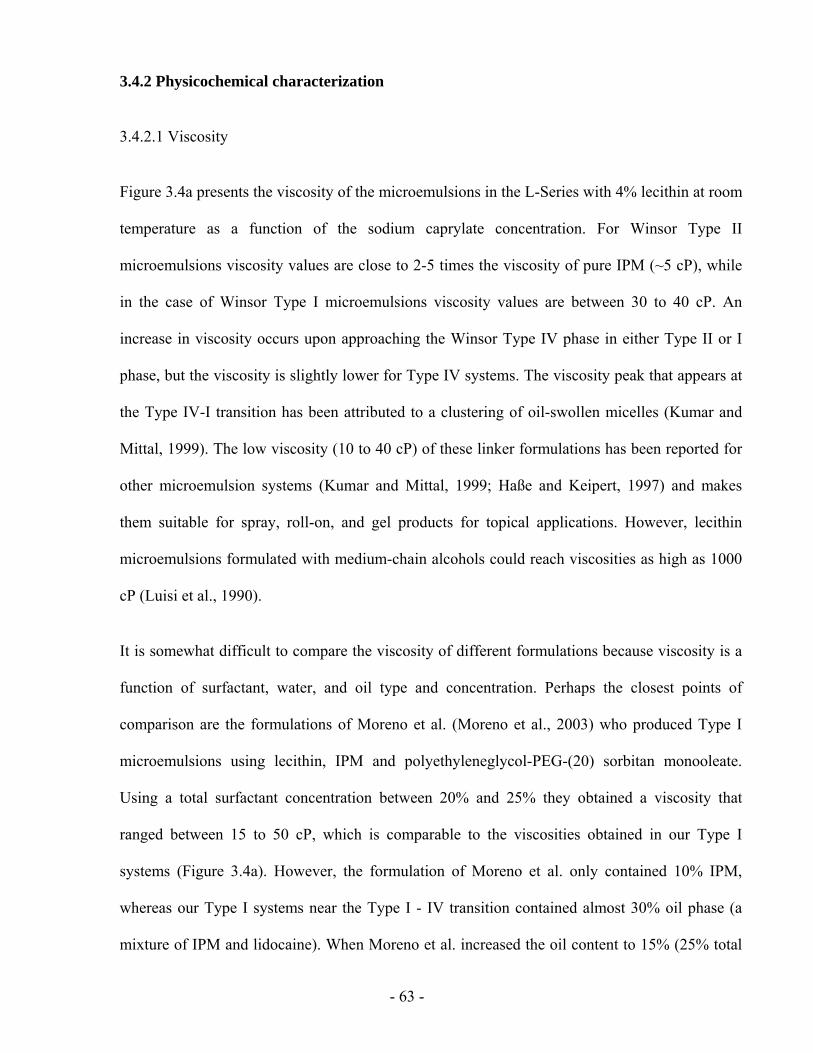
- 63 -
3.4.2 Physicochemical characterization
3.4.2.1 Viscosity
Figure 3.4a presents the viscosity of the microemulsions in the L-Series with 4% lecithin at room
temperature as a function of the sodium caprylate concentration. For Winsor Type II
microemulsions viscosity values are close to 2-5 times the viscosity of pure IPM (~5 cP), while
in the case of Winsor Type I microemulsions viscosity values are between 30 to 40 cP. An
increase in viscosity occurs upon approaching the Winsor Type IV phase in either Type II or I
phase, but the viscosity is slightly lower for Type IV systems. The viscosity peak that appears at
the Type IV-I transition has been attributed to a clustering of oil-swollen micelles (Kumar and
Mittal, 1999). The low viscosity (10 to 40 cP) of these linker formulations has been reported for
other microemulsion systems (Kumar and Mittal, 1999; Haße and Keipert, 1997) and makes
them suitable for spray, roll-on, and gel products for topical applications. However, lecithin
microemulsions formulated with medium-chain alcohols could reach viscosities as high as 1000
cP (Luisi et al., 1990).
It is somewhat difficult to compare the viscosity of different formulations because viscosity is a
function of surfactant, water, and oil type and concentration. Perhaps the closest points of
comparison are the formulations of Moreno et al. (Moreno et al., 2003) who produced Type I
microemulsions using lecithin, IPM and polyethyleneglycol-PEG-(20) sorbitan monooleate.
Using a total surfactant concentration between 20% and 25% they obtained a viscosity that
ranged between 15 to 50 cP, which is comparable to the viscosities obtained in our Type I
systems (Figure 3.4a). However, the formulation of Moreno et al. only contained 10% IPM,
whereas our Type I systems near the Type I - IV transition contained almost 30% oil phase (a
mixture of IPM and lidocaine). When Moreno et al. increased the oil content to 15% (25% total
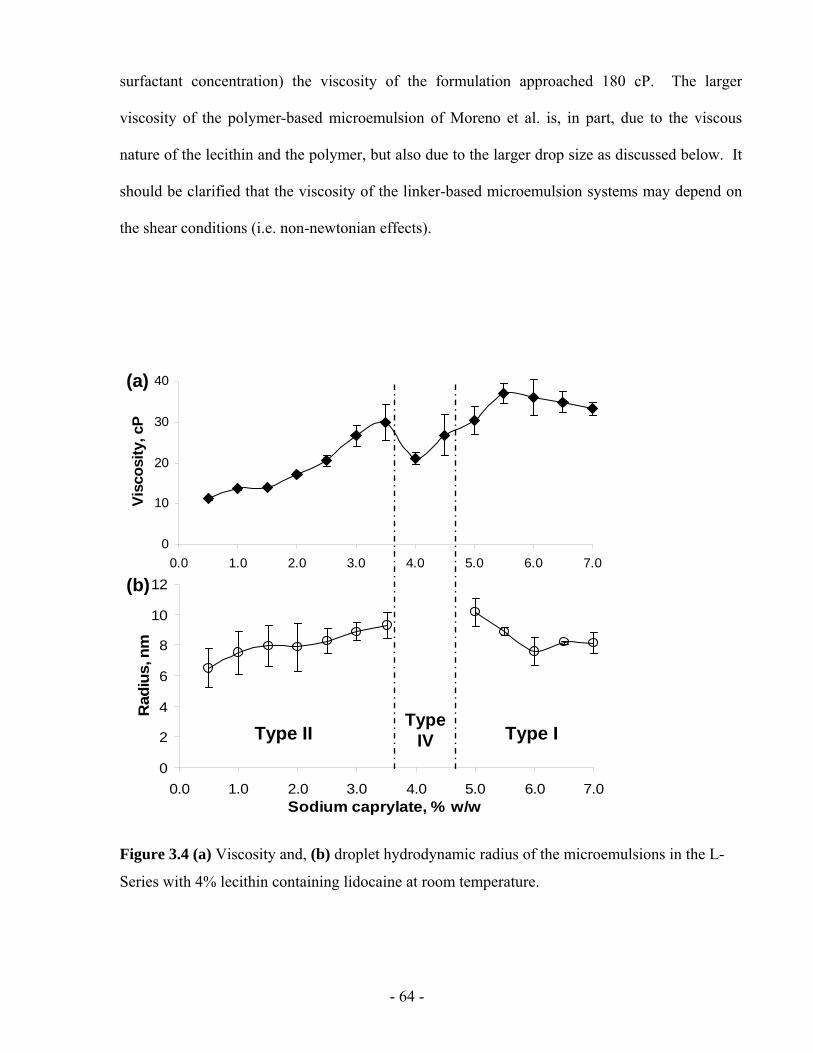
- 64 -
surfactant concentration) the viscosity of the formulation approached 180 cP. The larger
viscosity of the polymer-based microemulsion of Moreno et al. is, in part, due to the viscous
nature of the lecithin and the polymer, but also due to the larger drop size as discussed below. It
should be clarified that the viscosity of the linker-based microemulsion systems may depend on
the shear conditions (i.e. non-newtonian effects).
0
10
20
30
40
0.0 1.0 2.0 3.0 4.0 5.0 6.0 7.0Sodium octanoate, % w/w
Visc
osity
, cP
0
2
4
6
8
10
12
0.0 1.0 2.0 3.0 4.0 5.0 6.0 7.0Sodium caprylate, % w/w
Rad
ius,
nm
Type IIType
IV Type I
(a)
(b)
0
10
20
30
40
0.0 1.0 2.0 3.0 4.0 5.0 6.0 7.0Sodium octanoate, % w/w
Visc
osity
, cP
0
2
4
6
8
10
12
0.0 1.0 2.0 3.0 4.0 5.0 6.0 7.0Sodium caprylate, % w/w
Rad
ius,
nm
Type IIType
IV Type I
(a)
(b)
Figure 3.4 (a) Viscosity and, (b) droplet hydrodynamic radius of the microemulsions in the L-
Series with 4% lecithin containing lidocaine at room temperature.
- 65 -
3.4.2.2 Particle Size
Figure 3.4b shows the hydrodynamic radius of the microemulsions in the L-Series with 4%
lecithin obtained from dynamic light scattering measurements as a function of sodium caprylate
concentration. Microemulsion droplets increase in size as the formulation approaches the Winsor
Type IV bicontinuous system. This observation correlates with the viscosity measurements and
is consistent with existing microemulsion models (Acosta et al., 2003a). The droplet size (oil-
swollen micelles or water-swollen reverse micelles) of the systems is small with all
microemulsions having mean hydrodynamic radii between 6 and 11 nm, which makes these
systems optically transparent, and of high interfacial area. The droplet sizes of the linker-based
systems measured here are five times smaller than those of lecithin-IPM microemulsions
reported in the literature (Moreno et al., 2003; Saint Ruth et al., 1995).
The smaller drop size of linker-based microemulsions can be explained by the fact that, as the
hydrophilic linker (sodium caprylate+caprylic acid) adsorbs at the oil/water interface, the
interfacial area increases, thus reducing the sizes of oil-swollen micelles and/or water-swollen
reverse micelles (Acosta et al., 2002; Acosta et al., 2004).
In this study, the particle size was measured by DLS, which is a common method for
determining the size of sub-micron particles (Merkus, 2009). However, DLS has its limitations.
The measurement of hydrodynamic particle size by DLS is somewhat larger than the actual
particle size (Merkus, 2009; Acosta, 2004). There are other methods for dertermining particle
size, such as Transmission Electron Microscopy at cryogenic temperature (Cryo-TEM), or small-
angle X-ray scattering (SAXS) or small-angle neutrons scattering (SANS). Further work can be
done using other methods to double check the particle sizes of linker-based lecithin
microemulsions.
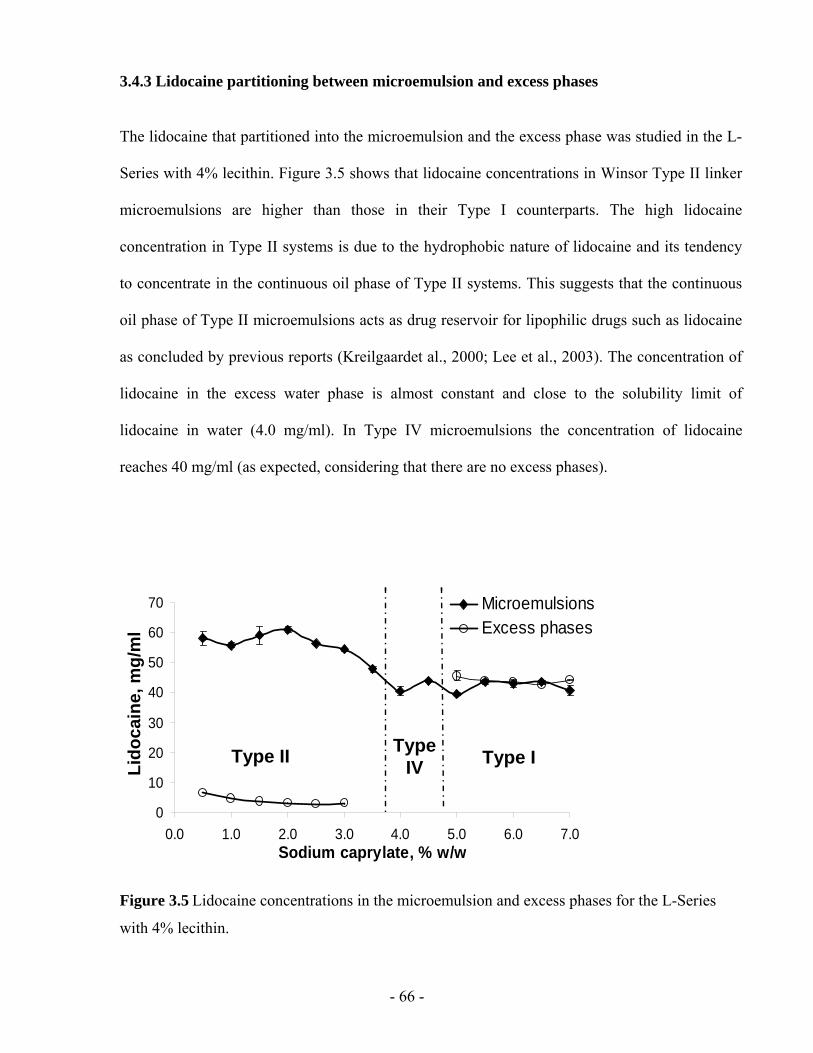
- 66 -
3.4.3 Lidocaine partitioning between microemulsion and excess phases
The lidocaine that partitioned into the microemulsion and the excess phase was studied in the L-
Series with 4% lecithin. Figure 3.5 shows that lidocaine concentrations in Winsor Type II linker
microemulsions are higher than those in their Type I counterparts. The high lidocaine
concentration in Type II systems is due to the hydrophobic nature of lidocaine and its tendency
to concentrate in the continuous oil phase of Type II systems. This suggests that the continuous
oil phase of Type II microemulsions acts as drug reservoir for lipophilic drugs such as lidocaine
as concluded by previous reports (Kreilgaardet al., 2000; Lee et al., 2003). The concentration of
lidocaine in the excess water phase is almost constant and close to the solubility limit of
lidocaine in water (4.0 mg/ml). In Type IV microemulsions the concentration of lidocaine
reaches 40 mg/ml (as expected, considering that there are no excess phases).
0
10
20
30
40
50
60
70
0.0 1.0 2.0 3.0 4.0 5.0 6.0 7.0Sodium caprylate, % w/w
MicroemulsionsExcess phases
Type IV Type IType II
Lido
cain
e, m
g/m
l
0
10
20
30
40
50
60
70
0.0 1.0 2.0 3.0 4.0 5.0 6.0 7.0Sodium caprylate, % w/w
MicroemulsionsExcess phases
Type IV Type IType II
Lido
cain
e, m
g/m
l
Figure 3.5 Lidocaine concentrations in the microemulsion and excess phases for the L-Series
with 4% lecithin.
- 67 -
It is interesting to note that the concentration of lidocaine in Type I microemulsions is almost
equal to the concentration of lidocaine in the excess oil phase (IPM). According to Figure 3.5,
the lidocaine concentration in the Type I microemulsions is close to 40 mg/ml which is 10 times
higher than the lidocaine solubility in water. This difference reveals that IPM-swollen micelles in
Type I microemulsions significantly improve lidocaine solubilization when compared to pure
water. However, this increase in solubilization cannot be explained by the solubilization of IPM
and lidocaine in the core of oil-swollen micelles. To understand the magnitude of this
solubilization enhancement, we need to remember that lidocaine is a hydrophobic but polar drug.
For this kind of molecule, the solubilization sites include the hydrophobic core of the micelle as
well as the palisade layer of the micelle (i.e. between the surfactant and linkers, on the oil side of
the interface) (Rosen, 1989). The large interfacial area exhibited by microemulsions leads to
additional solubilization sites (due to larger palisade layer) for lidocaine (Kreilgaard, 2002;
Lawrence and Rees, 2000). This finding is consistent with the previous discussion regarding the
changes in sodium caprylate concentration to produce II-IV-I transitions induced by lidocaine.
It should be clarified that the concentration of lidocaine in the microemulsions can be increased,
at least, by two fold in these linker formulations (this is limited by the saturation of lidocaine in
IPM which is approximately 20%). This is consistent with lidocaine solubilization capacity
reported for other lidocaine microemulsion systems (Sintov and Shapiro, 2004).
3.4.4 Permeation flux and permeability
The transdermal permeation profiles (Figure 3.6a and 3.6b) show the cumulative mass of
lidocaine permeated across the skin as a function of time. In general, lidocaine in the linker
microemulsions produced higher lidocaine permeation than the P-Type II microemulsion through
- 68 -
the reconstructed human skin and pig skin models. In particular, the Type II linker
microemulsion provided exceptionally higher lidocaine permeation through pig skin. Table 3.3
summarizes the transdermal flux calculated from the drug permeation profiles for the systems of
Figure 3.6. Among different types of linker microemulsions, L-Type II provides highest flux,
followed by L-Type IV and then L-Type I. One way ANOVA analysis provided P << 0.001 for
various delivery systems. The higher transdermal flux for L-Type II versus L-Type I maybe
related to the mechanisms of the drug penetrated into the skin. One mechanism is that the skin
barrier resembles a lipid layer along which individual molecules (free drug) migrate via diffusion
(Cussler, 1997). In this case, the Type II system should have higher permeability (i.e. higher
permeation and diffusion coefficients) than the Type I system. The other mechanism is that the
skin behaves as a mechanical nano-porous barrier for droplet transport (drug associated with
colloids) through the skin (Maghraby et al., 2008; Cevc, 2004). The Darcy or Washburn
penetration equations apply in this case, then the flux is proportional to 1/viscosity (Washburn,
1921). Therefore, the higher the viscosity, the lower the flux of the system.
These findings conflict with those of Lee et al. who reported that, in their formulations, Type I
microemulsions produce larger fluxes than Type II systems (Lee et al., 2003). Since the
concentrations of lidocaine used in our studies are similar to that used by Lee et al., the
difference could only be attributed to the differences in formulations. Lee et al. used polymer-
alcohol systems containing 40% PEG(20) sorbitan monooleate. As discussed above, the linker
microemulsions have higher oil solubilization capacity than polymer-based systems; additionally,
the lidocaine partition studies (Figure 3.5) show that lidocaine is highly soluble in Type I linker
microemulsions. The high solubility of lidocaine in Type I linker systems may represent a
problem in terms of improving the permeation of lidocaine through skin. It is well known that
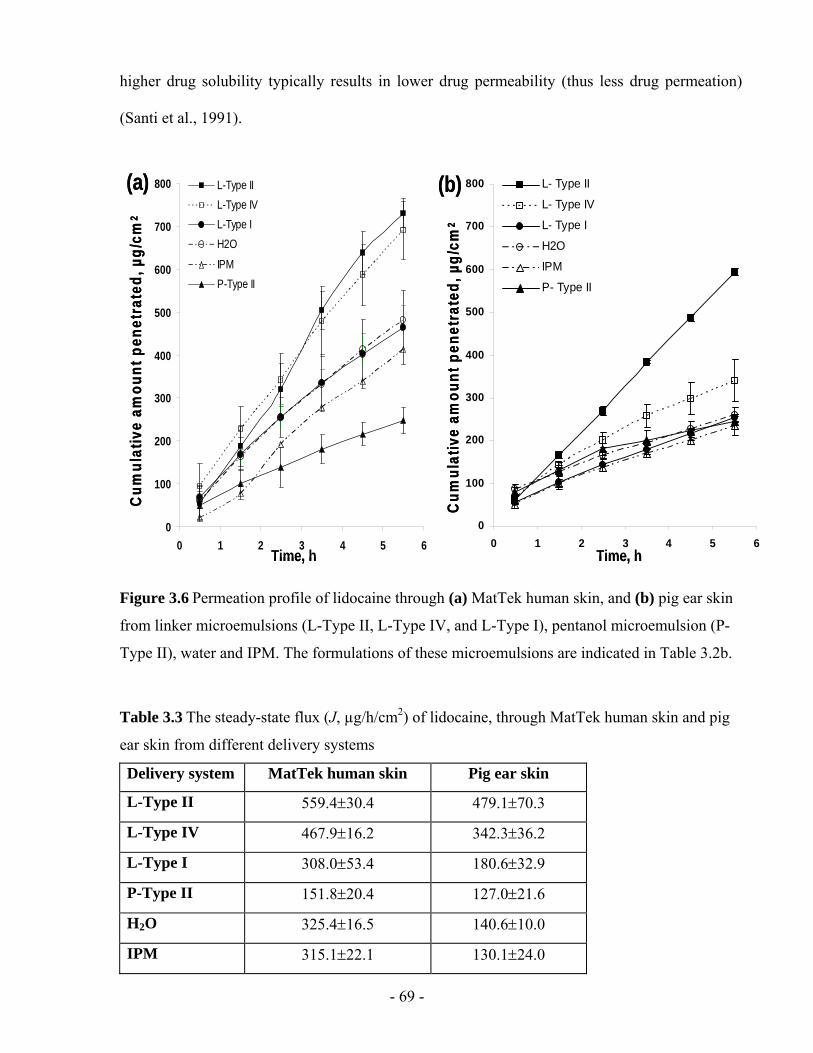
- 69 -
higher drug solubility typically results in lower drug permeability (thus less drug permeation)
(Santi et al., 1991).
0
100
200
300
400
500
600
700
800
0 1 2 3 4 5 6
L-Type IIL-Type IVL-Type IH2O
IPMP-Type II
Time, h
Cum
ulat
ive
amou
nt p
enet
rate
d, µ
g/cm
2
0
100
200
300
400
500
600
700
800
0 1 2 3 4 5 6
L- Type II
L- Type IV
L- Type I
H2O
IPM
P- Type II
Time, h
Cum
ulat
ive
amou
nt p
enet
rate
d, µ
g/cm
2
(a) (b)
0
100
200
300
400
500
600
700
800
0 1 2 3 4 5 6
L-Type IIL-Type IVL-Type IH2O
IPMP-Type II
Time, h
Cum
ulat
ive
amou
nt p
enet
rate
d, µ
g/cm
2
0
100
200
300
400
500
600
700
800
0 1 2 3 4 5 6
L- Type II
L- Type IV
L- Type I
H2O
IPM
P- Type II
Time, h
Cum
ulat
ive
amou
nt p
enet
rate
d, µ
g/cm
2
(a) (b)
Figure 3.6 Permeation profile of lidocaine through (a) MatTek human skin, and (b) pig ear skin
from linker microemulsions (L-Type II, L-Type IV, and L-Type I), pentanol microemulsion (P-
Type II), water and IPM. The formulations of these microemulsions are indicated in Table 3.2b.
Table 3.3 The steady-state flux (J, µg/h/cm2) of lidocaine, through MatTek human skin and pig
ear skin from different delivery systems
Delivery system MatTek human skin Pig ear skin
L-Type II 559.4±30.4 479.1±70.3
L-Type IV 467.9±16.2 342.3±36.2
L-Type I 308.0±53.4 180.6±32.9
P-Type II 151.8±20.4 127.0±21.6
H2O 325.4±16.5 140.6±10.0
IPM 315.1±22.1 130.1±24.0
- 70 -
The data in Figure 3.6 reveal that the L-Type II microemulsion produces a 4-fold (P=0.00004
and 0.003 for MatTek human skin and pig ear skin, respectively) increase in lidocaine
permeation compared to the P-Type II system. Considering that the only difference between the
two formulations is the substitution of the hydrophilic linkers by pentanol, one can attribute such
a significant difference to the role that hydrophilic linkers play in such systems. It has been
shown that the addition of hydrophilic linkers accelerates the rate of coalescence and
solubilization in microemulsions (Acosta et al., 2003b). It has been proposed that hydrophilic
linkers coadsorb between surfactants (Figure 3.1), increasing the surfactant-surfactant spacing,
weakening the surfactant-surfactant interactions, and producing a more fluid (less rigid) interface.
Our preliminary estimations of the interfacial rigidity of the L-Type II and P-Type II systems
(see Acosta et al., 2003a,b for details on interfacial rigidity calculations) indicate that interfacial
rigidity of the pentanol Type II microemulsion is twice that of the linker Type II system. The
interfacial rigidity has been found to be proportional to the activation energy of coalescence
(Acosta et al., 2003b), making the kinetic coalescence constant an exponential function of the
interfacial rigidity. We speculate that this interfacial rigidity may also be linked to the activation
energy for the lidocaine transfer from the oil continuous phase to the skin. This hypothesis is
supported by microemulsion mass transfer studies that show that the solute transfer flux is
proportional to the coalescence kinetic constant (Steytler et al., 2001). Therefore, the lower
rigidity of the L-Type II microemulsion could be responsible for the higher flux obtained with
this microemulsion.
Compared to the IPM-only vehicle, the L-Type II microemulsion yields twice (P=0.02) the
lidocaine flux through the reconstructed human skin and four (P=0.0005) times the flux through
pig skin. Considering that the IPM-only vehicle contains more lidocaine (10%) than the L-Type
II microemulsion (close to 6%), and that in both cases lidocaine is dissolved in an IPM-
- 71 -
continuous phase, one can conclude that the presence of the surfactant and linkers facilitates the
mass transfer of lidocaine as discussed above. Similar permeation enhancement of Type II
polymer-based formulations over IPM-only vehicles have been reported (Lee et al., 2003).
As indicated by Equation 3.1, the transdermal flux of lidocaine is associated with the difference
in concentration (ΔC) between the donor and the receiver solution. Certainly, higher lidocaine
concentration in the donor solution produces a larger concentration gradient across the skin that
should result in higher flux (Kreilgaard, 2002; Lawrence and Rees, 2000). The value of
permeability (kp) calculated by Equation 3.1 has been used to determined the effectiveness of
delivery systems. Table 3.4 summarizes the values of permeability for the delivery systems
considered in Figure 3.6. According to Table 3.4, water is, by far, the most effective vehicle for
lidocaine. The same observation has been made in the literature (Lee et al., 2003). This result can
be explained based on the principle of solubility versus permeability explained above: the lower
the solubility (such as the case of lidocaine in water), the larger the permeability. If we consider
this issue of solubility, then Equation 3.1 is not an appropriate expression to evaluate the
effectiveness of microemulsion-based drug delivery vehicles because it should be based on the
difference of chemical potential, and not on a simple difference of concentration. Equation 3.1 is
theoretically more suitable for a drug transfer in a simple solvent, but the mechanism of drug
release from microemulsions is more complex and not well established yet (Washington, 1990).
The only way to compare the permeability of the delivery systems considered here is if we
express the concentrations on the basis of a common phase, in this case the skin. We measured
the equivalent lidocaine concentration remaining in the skin after the permeation test to calculate
the lidocaine “skin” permeability (ksr, cm/h) for the vehicles considered in Figure 3.6. Figure 3.7
shows the equivalent lidocaine concentration remaining in the skin after treatment by these
vehicles. All the microemulsion systems significantly improved the absorption of lidocaine into
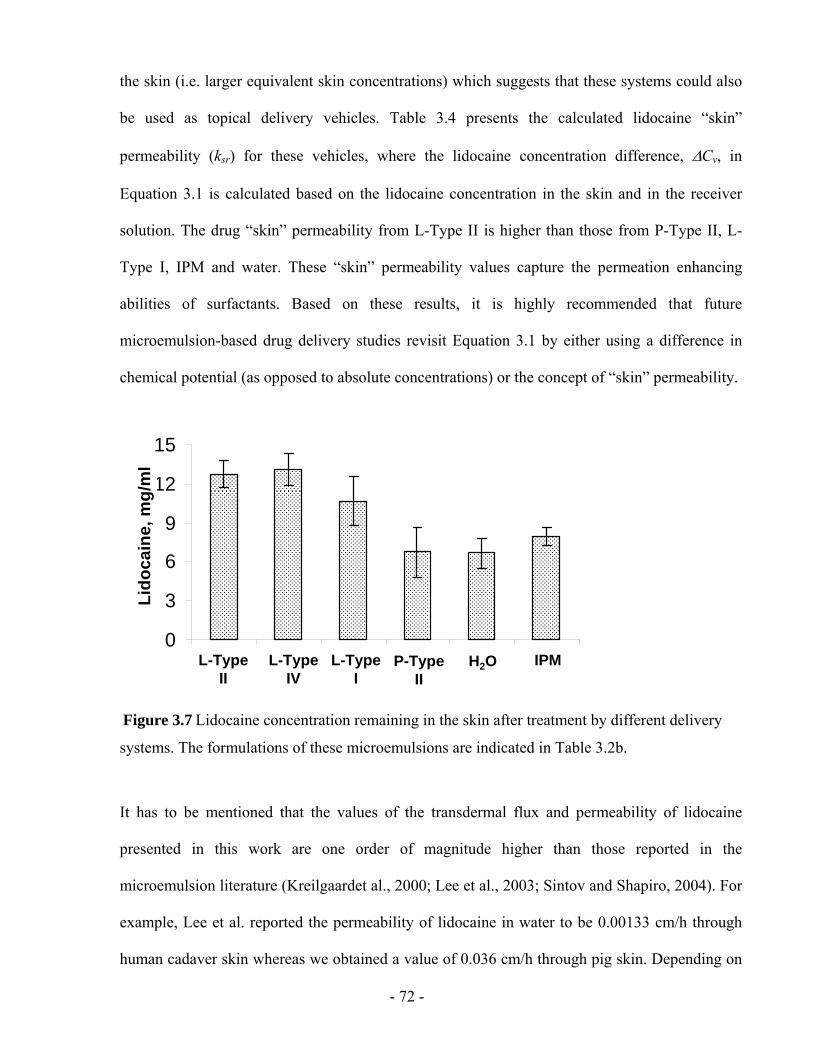
- 72 -
the skin (i.e. larger equivalent skin concentrations) which suggests that these systems could also
be used as topical delivery vehicles. Table 3.4 presents the calculated lidocaine “skin”
permeability (ksr) for these vehicles, where the lidocaine concentration difference, ΔCv, in
Equation 3.1 is calculated based on the lidocaine concentration in the skin and in the receiver
solution. The drug “skin” permeability from L-Type II is higher than those from P-Type II, L-
Type I, IPM and water. These “skin” permeability values capture the permeation enhancing
abilities of surfactants. Based on these results, it is highly recommended that future
microemulsion-based drug delivery studies revisit Equation 3.1 by either using a difference in
chemical potential (as opposed to absolute concentrations) or the concept of “skin” permeability.
0
3
6
9
12
15
1 2 3 4 5 6
Lido
cain
e, g
/lLi
doca
ine,
mg/
ml
L-TypeII
L-TypeIV
L-TypeI
P-TypeII
H2O IPM0
3
6
9
12
15
1 2 3 4 5 6
Lido
cain
e, g
/lLi
doca
ine,
mg/
ml
L-TypeII
L-TypeIV
L-TypeI
P-TypeII
H2O IPM
Figure 3.7 Lidocaine concentration remaining in the skin after treatment by different delivery
systems. The formulations of these microemulsions are indicated in Table 3.2b.
It has to be mentioned that the values of the transdermal flux and permeability of lidocaine
presented in this work are one order of magnitude higher than those reported in the
microemulsion literature (Kreilgaardet al., 2000; Lee et al., 2003; Sintov and Shapiro, 2004). For
example, Lee et al. reported the permeability of lidocaine in water to be 0.00133 cm/h through
human cadaver skin whereas we obtained a value of 0.036 cm/h through pig skin. Depending on
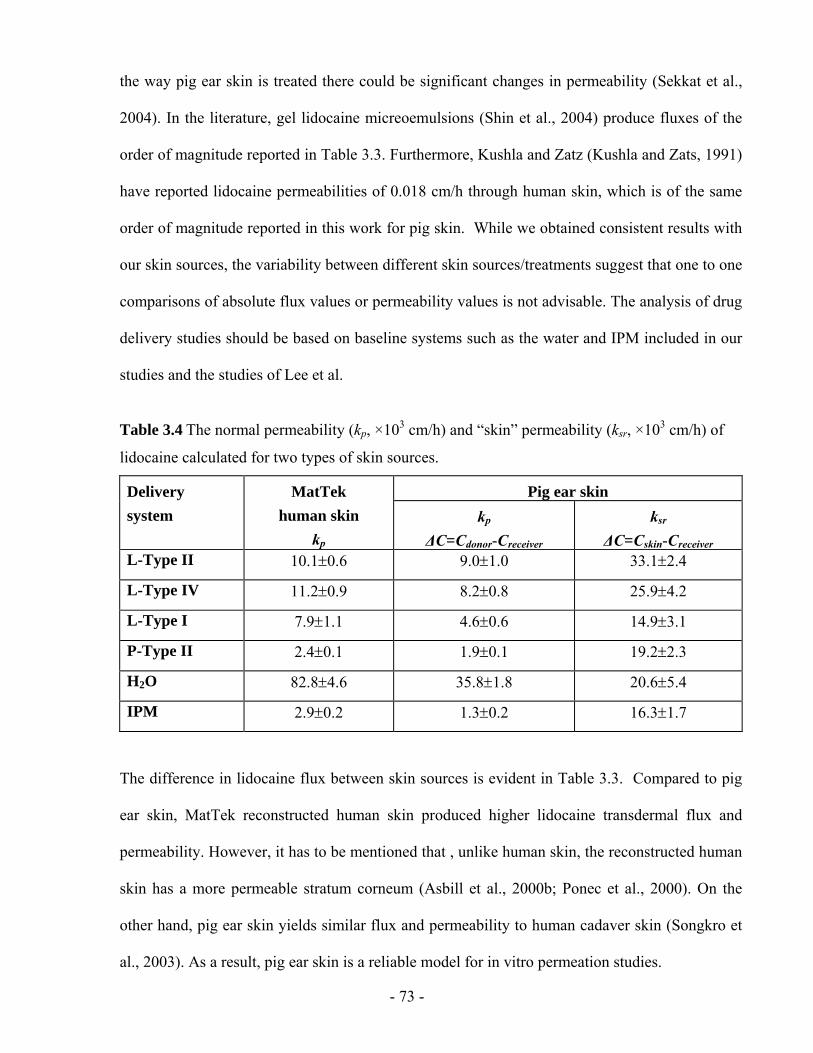
- 73 -
the way pig ear skin is treated there could be significant changes in permeability (Sekkat et al.,
2004). In the literature, gel lidocaine micreoemulsions (Shin et al., 2004) produce fluxes of the
order of magnitude reported in Table 3.3. Furthermore, Kushla and Zatz (Kushla and Zats, 1991)
have reported lidocaine permeabilities of 0.018 cm/h through human skin, which is of the same
order of magnitude reported in this work for pig skin. While we obtained consistent results with
our skin sources, the variability between different skin sources/treatments suggest that one to one
comparisons of absolute flux values or permeability values is not advisable. The analysis of drug
delivery studies should be based on baseline systems such as the water and IPM included in our
studies and the studies of Lee et al.
Table 3.4 The normal permeability (kp, ×103 cm/h) and “skin” permeability (ksr, ×103 cm/h) of
lidocaine calculated for two types of skin sources.
Pig ear skin Delivery system
MatTek human skin
kp kp
ΔC=Cdonor-Creceiver ksr
ΔC=Cskin-Creceiver L-Type II 10.1±0.6 9.0±1.0 33.1±2.4
L-Type IV 11.2±0.9 8.2±0.8 25.9±4.2
L-Type I 7.9±1.1 4.6±0.6 14.9±3.1
P-Type II 2.4±0.1 1.9±0.1 19.2±2.3
H2O 82.8±4.6 35.8±1.8 20.6±5.4
IPM 2.9±0.2 1.3±0.2 16.3±1.7
The difference in lidocaine flux between skin sources is evident in Table 3.3. Compared to pig
ear skin, MatTek reconstructed human skin produced higher lidocaine transdermal flux and
permeability. However, it has to be mentioned that , unlike human skin, the reconstructed human
skin has a more permeable stratum corneum (Asbill et al., 2000b; Ponec et al., 2000). On the
other hand, pig ear skin yields similar flux and permeability to human cadaver skin (Songkro et
al., 2003). As a result, pig ear skin is a reliable model for in vitro permeation studies.
- 74 -
3.4.5 Cytotoxicity
Figure 3.8 summarizes the cell (keratocyte) viability after 5.5 hours exposure of MatTek EPI-200
tissues to different lidocaine vehicles. In these viability tests, PBS and 1% Triton X-100 were
used as a negative (non-toxic) and positive control, respectively. A solution of 1% Triton X-100
is usually used as a reference for a mild formulation, and its cell viability is expected to represent
mild in vivo skin irritancy (Faller et al., 2002). According to recent European regulations, a test
vehicle should be considered to be corrosive to skin if the viability of keratocytes after 1 h of
exposure is less than 15% (Liebsch et al., 2000). The test conditions of Figure 3.8 are more
restrictive than such regulations (exposure time of 5.5 h versus 1 h for the European regulations),
yet all the delivery vehicles show viabilities larger than 15%, especially for the case of the water-
lidocaine system and L-Type II microemulsion. These results are in agreement with the low
toxicity of lecithin o/w microemulsion delivery systems evaluated using animal studies (Brime et
al., 2002; Moreno et al., 2003).
To interpret the results of Figure 3.8, it is necessary to clarify that the water only system contains
0.4% lidocaine and no surfactant, whereas the L-Type II formulation contains more than 20%
surfactant + linkers, and 6% lidocaine. Despite this large difference in composition the L-Type II
microemulsion has the second-best (P=0.01) viability of all these systems. This result confirms
our initial hypothesis that it is possible to produce mild microemulsions using lecithin and
avoiding the use of short or medium-chain alcohols (Kumar and Mittal, 1999). The low toxicity
of the linker formulation comes as a result of selecting formulation ingredients with chemical
structure similar to the lipid composition of the skin (lecithin, caprylic acid, and the oleic moiety
in sorbitan monooleate). It is quite possible that the lower viability of keratocytes exposed to the
L-Type II microemulsion, compared to water only, comes from the larger lidocaine skin
absorption, and the cytotoxicity of lidocaine itself (Table 3.1).
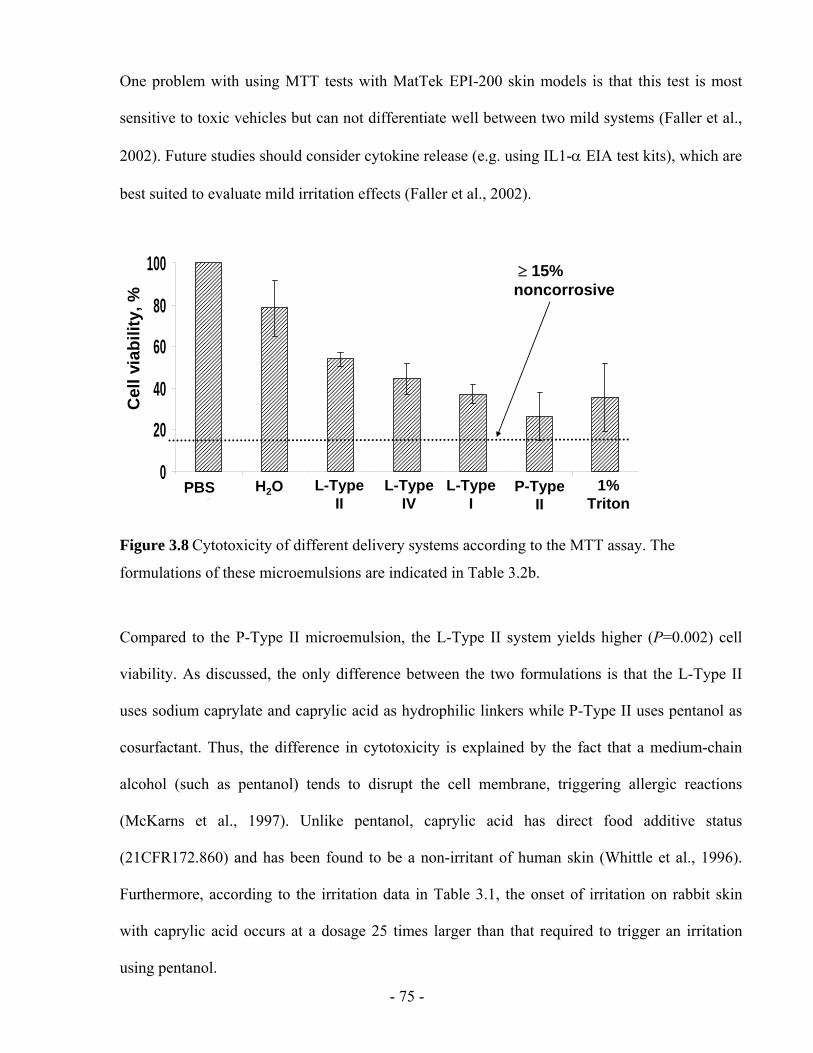
- 75 -
One problem with using MTT tests with MatTek EPI-200 skin models is that this test is most
sensitive to toxic vehicles but can not differentiate well between two mild systems (Faller et al.,
2002). Future studies should consider cytokine release (e.g. using IL1-α EIA test kits), which are
best suited to evaluate mild irritation effects (Faller et al., 2002).
0
20
40
60
80
100
1 2 3 4 5 6 7
≥ 15%noncorrosive
Cel
l via
bilit
y, %
L-TypeII
L-TypeIV
L-TypeI
P-TypeII
H2OPBS 1% Triton
0
20
40
60
80
100
1 2 3 4 5 6 7
≥ 15%noncorrosive
Cel
l via
bilit
y, %
L-TypeII
L-TypeIV
L-TypeI
P-TypeII
H2OPBS 1% Triton
Figure 3.8 Cytotoxicity of different delivery systems according to the MTT assay. The
formulations of these microemulsions are indicated in Table 3.2b.
Compared to the P-Type II microemulsion, the L-Type II system yields higher (P=0.002) cell
viability. As discussed, the only difference between the two formulations is that the L-Type II
uses sodium caprylate and caprylic acid as hydrophilic linkers while P-Type II uses pentanol as
cosurfactant. Thus, the difference in cytotoxicity is explained by the fact that a medium-chain
alcohol (such as pentanol) tends to disrupt the cell membrane, triggering allergic reactions
(McKarns et al., 1997). Unlike pentanol, caprylic acid has direct food additive status
(21CFR172.860) and has been found to be a non-irritant of human skin (Whittle et al., 1996).
Furthermore, according to the irritation data in Table 3.1, the onset of irritation on rabbit skin
with caprylic acid occurs at a dosage 25 times larger than that required to trigger an irritation
using pentanol.
- 76 -
It is still unclear why the L-Type II system generates a larger (P=0.0008) cell viability than L-
Type I and IPM-lidocaine systems. To our knowledge, this is the first time that the toxicity of
Type I and Type II microemulsions have been compared side by side.
3.5 CONCLUSIONS
In this study alcohol-free lecithin microemulsions have been formulated using sorbitan
monooleate as lipophilic linker and a combination of sodium caprylate and caprylic acid as
hydrophilic linkers. Increasing the concentration of sodium caprylate in the systems increases the
hydrophilicity of the formulations, and induces a Type II-IV-I phase transition. The presence of
lipophilic and hydrophilic linkers makes the surfactant+linker system partially insoluble in pure
oil or pure water, but is optimized for co-solubilizing oil and water in equal proportions using as
little as 2.8% lecithin. These linker microemulsions produced relatively small droplets (less than
10 nm in diameter) which suggest the existence of a large surface area for mass transfer and
explain the relatively low viscosity of these formulations.
Furthermore, the model drug studied in this work, lidocaine, was highly soluble in these linker
microemulsions. The lidocaine partition and phase behavior studies suggest that this hydrophobic
but polar drug solubilizes in the core and the palisade layer of the micelles.
It was also found that although Type I and IV microemulsions may experience a phase transition
upon dilution with water, Type II microemulsions will not undergo this transition. Other
formulation conditions such as temperature and electrolyte concentration do not affect the phase
behavior of these systems significantly due to the zwitterionic nature of lecithin, which is the
main surfactant used in the formulation.
- 77 -
Linker-based lecithin microemulsions were also examined as potential vehicles for TDD of
lidocaine. Type II and IV linker-based vehicles produce larger transdermal lidocaine flux, larger
lidocaine skin absorption and larger lidocaine “skin” permeability than water, pentanol-based
Type II microemulsion, linker Type I microemulsion, and IPM. The superior flux obtained with
linker microemulsions is due to the use of hydrophilic linkers that accelerate the interfacial mass
transfer. The concept of “skin” permeability was also introduced and recommended as a method
to compare the permeability obtained from different drug delivery vehicles.
Furthermore, the cytotoxicity studies indicate the linker-based Type II systems are mild, and
their cytotoxicity compares to that of dilute lidocaine solutions in water. These linker-based
systems are also less toxic than the alcohol-based lecithin microemulsion. The difference
between hydrophilic linkers and pentanol is that the former concentrates on fluidizing the
oil/water interface and probably the interstitial spaces between cells whereas the latter is more
efficient at fluidizing the membranes of living cells, inducing cell lysis.
3.6 REFERENCES
Aboofazeli, R. and Lawrence, M.J., 1993. Investigations into the formation and characterization of phospholipid microemulsions. I. Pseudo-ternary phase diagrams of systems containing water-lecithin-alcohol-isopropyl myristate. Int. J. Pharm., 93, 161-175.
Acosta, E.J., 2004. Linker-based non-toxic microemulsions. In: Linker-based non-toxic microemulsions. In: Modeling and formulation of microemulsions: the net-average curvature model and the combined linker effect. Department of Chemical Engineering and Material Science, University of Oklahoma.
Acosta, E., Uchiyama. H., Sabatini, D.A., Harwell, J.H., 2002. The role of hydrophilic linkers. J. Surfactants Deterg., 5, 151-157.
Acosta, E., Szekeres, E., Sabatini, D.A., Harwell, J.H., 2003a. Net-average curvature model for solubilization and supersolubilization in surfactant microemulsions. Langmuir, 19, 186-195.
- 78 -
Acosta, E.J., Le, M.A., Harwell, J.H., Sabatini, D.A., 2003b. Coalescence and Solubilization Kinetics in Linker-Modified Microemulsions and Related Systems. Langmuir, 19, 566-574.
Acosta E. J., Harwell J. H., Sabatini, D. A., 2004. Self-assembly in linker-modified microemulsions. J. Colloid Interface Sci., 274, 652-664.
Acosta, E.J., Nguyen, T., Witthayapanyanon, A., Harwell, J.H., Sabatini, D.A., 2005. Linker-based bio-compatible microemulsions. Environ. Sci. Technol., 39, 1275-1282.
Amann, A.H. and Osborne, D.W., 1990. Topical drug delivery formulations, Marcel Dekker, New York.
Asbill, C., 2000a. Enhancement of transdermal drug delivery: Chemical and physical approaches. Crit. Rev. Ther. Drug Carr. Syst., 17, 621-658.
Asbill, C., Kim, N., El-Kattan, A., Creek, K., Wertz, P., Michniak, B., 2000b. Evaluation of a human bio-engineered skin equivalent for drug permeation studies. Pharm. Res., 17, 1092-1097.
Attwood, D., 1983. Surfactant systems: their chemistry, pharmacy and biology, Chapman and Hall, London.
Bagwe, R.P., Kanicky, J.R., Palla, B.J., Patanjali, P.K., Shah, D.O., 2001. Improved drug delivery using microemulsions: rationale, recent progress, and new horizons. Crit. Rev. Ther. Drug Carr. Syst., 18, 77-140.
Bommannan, D., Potts, R.O., Guy, R.H., 1991. Examination of the effect of ethanol on human stratum corneum in vivo using infrared spectroscopy. J. Control. Release, 16, 299-304.
Brime, B.a., Moreno, M.A., Frutos, G., Ballesteros, M.P., Frutos, P., 2002. Amphotericin B in oil-water lecithin-based microemulsions: formulation and toxicity evaluation. J. Pharm. Sco., 91, 1178-1185.
Bronaugh, R.L. and Maibach, H.I., 1991. In vitro percutaneous absorption: principles, fundamentals, and applications, CRC Press, Boca Raton.
Bronaugh, R.L. and Maibach, H.I. 2002, Topical absorption of dermatological products, Marcel Dekker, New York.
Carlfors, J., Blute, I., Schmidt, V., 1991. Lidocaine in microemulsion - a dermal delivery system. J. Dispersion Sci. Technol., 12, 467-482.
Changez, M., Chander, J., Dinda A. K., 2006. Transdermal permeation of tetracaine hydrochloride by lecithin microemulsion: In vivo. Colloids and Surfaces B, 48, 58–66
Corswant, C.v. and Söderman, O., 1998a. Effect of adding isopropyl myristate to microemulsions based on soybean phosphatidylcholine and triglycerides. Langmuir, 14, 3506-3511.
- 79 -
Corswant, C.v., Thorén, P., Engström, S., 1998b. Triglyceride-based microemulsion for intravenous administration of sparingly soluble substances. J. Pharm. Sci., 87, 200-208.
CRC handbook, 1988. CRC handbook of chemistry and physics, Student Ed., CRC Press, Boca Raton.
Cevc, G., 2004. Lipid vesicles and other colloids as drug carriers on the skin. Adv. Drug Deliv. Rev., 56, 675-711.
Cussler, E.L., 1997. Chapter 18: Controlled release and related phenomena. In: Diffusion: mass transfer in fluid systems (2nd ed.), Cambridge University Press, Cambridge.
Dreher, F., Walde, P., Walther, P., Wehrli, E., 1997. Interaction of a lecithin microemulsion gel with human stratum corneum and its effect on transdermal transport. J. Control. Release, 45, 131-140.
Faller, C., Bracher, M., Dami, N., Roguet, R., 2002. Predictive ability of reconstructed human epidermis equivalents for the assessment of skin irritation of cosmetics. Toxicol. in vitr., 16, 557-572.
Friedman, P.M., Mafong, E.A., Friedman, E.S., Geronemus, R.G., 2001. Topical anesthetics update: EMLA and beyond Dermatologic Surgery, 27, 1019-1026.
Guy, R.H. and Hadgraft, J., 2003. Transdermal drug delivery, 2nd Ed., Marcel Dekker, New York.
Haße, A., Keipert, S., 1997. Development and characterization of microemulsions for ocular application. Eur. J. Pharm. Biopharm., 43, 179-183.
Jesitus, J. 2001. Newer anesthetics found effective after 30-minute application.. Cosmetic Surgery Times magazine, April issue. (http://www.topicaine.net/f/Topical_anesthetic_lidocaine_gel.pdf)
Kushla, G.P., Zatz, J.L.,1991. Influence of pH on lidocaine penetration through human and hairless mouse skin in vitro. Int. J. Pharm., 71, 167-173.
Kreilgaard, M., 2002. Influence of microemulsions on cutaneous drug delivery. Adv. Drug Deliv. Rev., 54, S77-S98.
Kumar, P. and Mittal, K.L., 1999. Handbook of microemulsion science and technology, Marcel Dekker, New York.
Lawrence, M.J. and Rees, G.D., 2000. Microemulsion-based media as novel drug delivery systems. Adv. Drug Deliv. Rev., 45, 89-121.
Lee, P.J., Langer, R., Shastri, V.P., 2003. Novel microemulsion enhancer formulation for simultaneous transdermal delivery of hydrophilic and hydrophobic Drugs. Pharm. Res., 20, 264-269.
- 80 -
Lee, M.-W.C., 2003. Topical triple-anesthetic gel compared with 3 topical anesthetics. Cosmetic Dermatology, 16(4), 35-38.
Liebsch, M., Traue, D., Barrabas, C., Spielmann, H., Uphill, P., Wilkins, S., McPherson, J.P., Wiemann, C., Kaufmann, T., Remmele, M., Holzhutter, H.G., 2000. The ECVAM prevalidation study on the use of EpiDerm for skin corrosivity testing. Altern. Lab. Anim, 28, 371-401.
Luisi, P.L., Scartazzini, R., Haering, G., Schurtenberger, P., 1990. Organogels from water-in-oil microemulsions. Colloid Polym. Sci., 268 (4), pp. 356-374.
Maghraby, G.M., Barry, B.W., Williams, A.C., 2008. Liposomes and skins: from drug delivery to model membranes. Eur. J. Phar. Sci., 34, 203-222.
Malcolmson, C., Barlow, D.J., Lawrence, M.J., 2002. Light-scattering studies of testosterone enanthate containing soybean oil/C18:1E10/water oil-in-water microemulsions. J. Pharm. Sci., 91, 2317- 2331.
Merkus, H. G., 2009. Particle Size Measurement. Springer Netherlands.
Michaels, A.S., Chandrasekaran, S.K., Shaw, J.E., 1975. Drug permeation through human skin: theory and in vitro experimental measurement. AICHE J., 21, 985-996.
McKarns, S.C., Hansch, C., Caldwell, W.S., Morgan, W.T., Moore, S.K., Doolittle, D.J., 1997. Correlation between hydrophobicity of short-chain aliphatic alcohols and their ability to alter plasma membrane integrity. Fund. App. Toxicol. 36, 62-70.
Moreno, M.A., Ballesteros, M.P., Frutos, P., 2003. Lecithin-based oil-in-water microemulsions for parenteral use: pseudoternary phase diagrams, characterization and toxicity studies. J. Pharm. Sci., 92, 1428-1437.
Paolino, D., Ventura, C.A., Nisticò, S., Puglisi, G., Fresta, M., 2002. Lecithin microemulsions for the topical administration of ketoprofen: percutaneous adsorption through human skin and in vivo human skin tolerability. Int. J. Pharm., 244, 21-31.
Peltola, S., Saarinen-Savolainen, P., Kiesvaara, J., Suhonen, T.M., Urtti, A., 2003. Microemulsions for topical delivery of estradiol. Int. J. Pharm., 254, 99-107.
Ponec, M., Boelsma, E., Weerheim, A., Mulder, A., Bouwstra, J., Mommaas, M., 2000. Lipid and ultrastructural characterization of reconstructed skin models. Int. J. Pharm., 203, 211 - 225.
Rosen, M. J, 1989. Surfactants and Interfacial Phenomena. 2nd Ed. John Wiley & Sons, New York,
Saint Ruth, H., Attwood, D., Ktistis, G., Taylor, C.J., 1995. Phase studies and particle size analysis of oil-in-water phospholipid microemulsions. Int. J. Pharm., 116, 253-261.
- 81 -
Santi, P., Catellani, P.L., Colombo, P., Ringard-Lefebvre, C., Barthelemy, C., Guyot-Hermann, A.-M., 1991. Partition and transport of verapamil and nicotine through artificial membranes. Int. J. Pharm., 68 (1-3), pp. 43-49.
Sekkat, N., Kalia, Y.N., Guy, R.H. (2004) Porcine ear skin as a model for the assessment of transdermal drug delivery to premature neonates. Pharmaceutical Research, 21 (8), pp. 1390-1397.
Shin, S.-C., Cho, C.-W., Yang, K.-H., 2004. Development of lidocaine gels for enhanced local anesthetic action. Int. J. Pharm., 287 (1-2), pp. 73-78.
Sintov, A.C. and Shapiro, L., 2004. New microemulsion vehicle facilitates percutaneous penetration in vitro and cutaneous drug bioavailability in vivo. J. Control. Release, 95, 173-183.
Solans, C. and Kunieda, H., 1997. Industrial applications of microemulsions, Marcel Dekker, New York.
Songkro, S., Purwo, Y., Becket, G., Rades, T., 2003. Investigation of newborn pig skin as an in vitro animal model for transdermal drug delivery. STP Pharma Sci., 13, 133-139.
Steytler, D.C., Towey, T.F., Robinson, B.H., 2001. Machanisms of solute interfacial transfer in Winsor-II systems. Langmuir, 17, 417-426.
Tenjarla, S., 1999. Microemulsions: an overview and pharmaceutical applications. Crit. Rev. Ther. Drug Carr. Syst., 16, 461-521.
Tetzlaff, J. E., 2000. Chapter 13: lidocaine, Clinical pharmacology of local anesthetics, Butterworth-Heinemann, Woburn, MA.
Thomas, B.J. and Finnin, B.C., 2004. The transdermal revolution. DDT, 9, 697-703
Walters, K.A., 2002. Dermatological and transdermal formulations, Marcel Dekker, New York.
Washburn, E.W., 1921. The dynamics of capillary flow. Phys. Rev., 17 (3), 273-283.
Washington, C., 1990. Drug release from microdisperse systems: a critical review. Int. J. Pharm., 58, 1-12.
Welss, T., Basketter, D.A., Schroder, K.R., 2004. In vitro skin irritation: facts and future. State of the art review of mechanisms and models. Toxicol. in vitr., 18, 231-243.
Whittle, E., Barratt, M.D., Carter, J.A., Basketter, D.A., Chamberlain, M., 1996. Skin corrosivity potential of fatty acids: in vitro rat and human skin testing and QSAR studies. Toxicol. in vitr., 10, 95-100.
- 82 -
CHAPTER 4
EXTENDED RELEASE OF LIDOCAINE
FROM LINKER-BASED LECITHIN MICROEMULSIONS
This chapter is derived from the following manuscript:
Yuan, J. S., Acosta, E., Extended release of lidocaine from linker-based lecithin microemulsions.
International Journal of Pharmaceutics. 2009, 368, 63-71.
- 83 -
4.1 ABSTRACT
In Chapter 3, we reported on the use of linker-based lecithin microemulsions as effective
transdermal delivery vehicles for lidocaine. It was determined at that time that the performance
of these vehicles was in part due to a permeability enhancement effect, but also due to the
amount of lidocaine absorbed in the skin. In this chapter, we take advantage of this drug
absorbed in the skin to produce an extended release profile where the lidocaine-loaded skin is
used as an in situ patch. The release of lidocaine from the skin is modeled using a differential
mass balance that yields a first order release profile. This profile depends on the mass of drug
initially loaded in the skin and a mass transfer coefficient. When the release profile of lidocaine
was evaluated as a function of the concentration of lidocaine in the microemulsion, application
time, and microemulsion dosage; we observed that all these different conditions only change the
mass of lidocaine initially loaded in the skin. However, these parameters do not change the mass
transfer coefficient. When the release profile of Type I and Type II microemulsions was
compared, it was determined that the mass transfer coefficient of Type II systems was larger than
that of Type I. This suggests that the morphology of the microemulsion plays an important role
on the release kinetics. These linker microemulsions are able to release 90% of their content over
a 24 h period which rivals the performance of some polymer-based patches. Fluorescence
micrographs of transversal cuts of skin loaded with Nile red are consistent with the observed
release profiles.
4.2 INTRODUCTION
The goal of transdermal drug delivery (TDD) is to achieve better percutaneous absorption and
permeation of active ingredients for local treatment (Bronaugh and Maibach, 2005).
- 84 -
Microemulsions have been reported to improve the absorption of drugs in the skin significantly
compared to aqueous solutions, gels, or cream formulations (Baroli et al., 2000; Delgado-Charro
et al., 1997; Williams and Barry, 1992). They provide many advantages as topical TDD systems,
including high solubilization for both oil-soluble and water-soluble drugs, being
thermodynamically stable, transparent, and spontaneous formation.The enhanced absorption is
typically associated with the high surface area of microemulsion droplets and the presence of
surfactant that act as permeation enhancers. However the use of microemulsions has been limited
by the toxicity of ionic surfactants and alcohols used in most formulations.
Mild alcohol-free lecithin microemulsions formulated with linker molecules with Generally
Recognized as Safe (GRAS) or food additive status were reported in Chapter 3. In this work, we
hypothesize that by topically administrating an active ingredient using the linker microemulsions
formulated in Chapter 3, the drug will be safely absorbed into the skin, thus producing an in situ
delivery patch. Potential advantages of this in situ patch include its application on uneven and
exposed parts, its low cost, and customizable dose.
The typical controlled-release form for topical treatment of skin diseases is drug-in-adhesive
patches. Since the transdermal absorption occurs through a slow process of diffusion, driven by a
concentration gradient, the patches must be kept in continuous contact with the skin for a
considerable time (hours and days) (Scheindlin, 2004). This often causes skin irritation at the site
of administration (Shah, 1987; Kurihara-Bergstrom et al., 1991). For extreme situations such as
patients with painful skin irritations, blisters, burns, or other skin wounds, the use of sprayable
therapeutic microemulsion formulations may represent a significant advance over the patches
that require direct contact with the skin. Since these microemulsions are transparent, the
formulation could be used to treat various skin conditions without affecting the appearance of the
patient.
- 85 -
Another advantage of in situ patches over conventional ones is that a large excess of drug has to
be placed in the conventional patches to maintain the concentration gradient. For example, the
label of lidocaine patch (Lidoderm®) states that only 3% of the applied dose is absorbed
(Scheindlin, 2004). The cost of excess drug in the patches may be significant for numerous drugs.
To evaluate the performance of the linker-based lecithin microemulsions as in situ patches, a
lipophilic drug, lidocaine, was chosen as a model drug in this work. Lidocaine is an anesthetic
that has been used in topical formulations as a pain reliever in the treatment of minor burns,
sunburn, insect bites and after various laser skin surgeries (Tetzlaff, 2000; Jesitus, 2001). The
problem with the existing lidocaine delivery systems on the market is the short half-life. For
instance, the pain relieving effects of EMLA cream (a commercial macroemulsion containing 1:1
eutectic mixture of 2.5 wt.% lidocaine and 2.5 wt.% prilocaine ; Astra, Lakemedel, Sweden) only
lasts between two to four hours after application (Pasero et al., 1995; Skaaret, 2006). In the case
of wound dressings, adequate pain relief results in better compliance with treatment and a better
quality of life (Heinen et al., 2004). Since these dressings are unlikely to be replaced as often as
every 2 to 4 hours, there is a need to find formulations for prolonged release of lidocaine.
The delivery of lidocaine by microemulsions has been compared to the currently available
lidocaine formulations (Sintov and Shapiro 2004; Kreilgaard et al., 2000). Kreilgaard et al.
compared the transdermal delivery of lidocaine from microemulsions and from conventional
formulations, such as 5% lidocaine cream (Xylocaine®, AstraZeneca), 2% lidocaine
hydrochloride gel (Xylocaine®gel, AstraZeneca) and EMLA cream (Kreilgaard et al., 2000). The
results show that the optimized microemulsions increased transdermal flux of lidocaine up to
four times compared to a conventional o/w emulsion, and approximately two times compared to
EMLA. Furthermore, Sintov and Shapiro demonstrated that microemulsions as transdermal
- 86 -
delivery vehicles showed a significant increase in the skin absorption of lidocaine compared to
application of EMLA cream (Sintov and Shapiro 2004).
However, there is no previous report that studied extended transdermal release of lidocaine from
microemulsions. In order to reduce patient discomfort, a long release time of 12- or 24-h would
be desirable when compared to the 3-5 h of existing formulations. In this work, the release of
more than 12 h is defined as extended release in this study. The aim of the study is to test the in
situ delivery patch hypothesis by evaluating the skin absorption and the release profile of
lidocaine via linker microemulsions. Lidocaine-laden linker microemulsions were applied on
pieces of excised pig ear skin and in vitro extended release studies were conducted. The release
profile from these studies were analyzed by a controlled-release model (described in the next
section) and compared to the release profile of traditional transdermal patches, gels and polymer
films reported in the literature. Furthermore, fluorescence microscopy was used to study the
permeation and location of a lipophilic fluorescent dye (Nile red) within the skin.
4.3 MATERIALS AND METHODS
4.3.1 Materials
4.3.1.1 Chemicals
The following chemicals were purchased from Sigma-Aldrich (St. Louis, MO, USA) at the
concentrations shown in parentheses, and were used as received: sorbitan monooleate (Span® 80,
99%+), sodium caprylate (99%+), caprylic acid (99%+), isopropyl myristate (IPM, 98%),
sodium chloride (99%+, Fluka brand), Dulbecco’s phosphate buffered saline (PBS), Nile red and
lidocaine powder (base form, 98%+). Laboratory grade soybean lecithin (99%+) was purchased
- 87 -
from Fisher Scientific (Fairlawn, NJ, USA). Soybean lecithin is a mixture of phospholipids
(mainly phosphatidyl cholines) produced by acetone purification of soybean gum residues.
Sodium phosphate monobasic, monohydrate (ACS grade) and acetonitrile (HPLC grade) were
purchased from EMD Chemicals Inc. (Darmstadt, Germany), and they were used as received.
Anhydrous ethyl alcohol and methanol were purchased from Commercial Alcohols Inc.
(Brampton, ON, Canada). Unless otherwise stated, the composition is expressed on weight basis
(i.e. wt. %) throughout this Chapter.
4.3.1.2 Skin
Pig ears were purchased from the local market and frozen overnight. Prior to use, they were
thawed by rinsing with running water for ten seconds at room temperature. The skin of the
external side of the ear was then dermatomed to a thickness that ranged from 700 to 900 μm
(Bronaugh and Maibach, 1991). After that, the thin skin layer was cut in circles of 11.4 mm
diameter ready for use.
4.3.2 Microemulsion preparation
Microemulsion formulations were prepared using equal volumes of aqueous solution and oil (5
ml of each) in flat bottom test tubes at constant temperature (25±1°C), electrolyte concentration
(0.9% NaCl in the aqueous solution), and pressure (1 atm) (Yuan et al., 2008). The oil used in
this study is IPM. Lidocaine was loaded in the microemulsion formulations by predissolving this
drug in IPM to a concentration of 10 % (10% lido-IPM) and 20% (20% lido-IPM, near the
solubility limit of lidocaine in IPM). After introducing all the ingredients, the test tubes were
thoroughly vortexed, then vortexed once a day for three days, and left to equilibrate for two
weeks. The composition of the linker-based lecithin microemulsions is shown in Table 4.1.
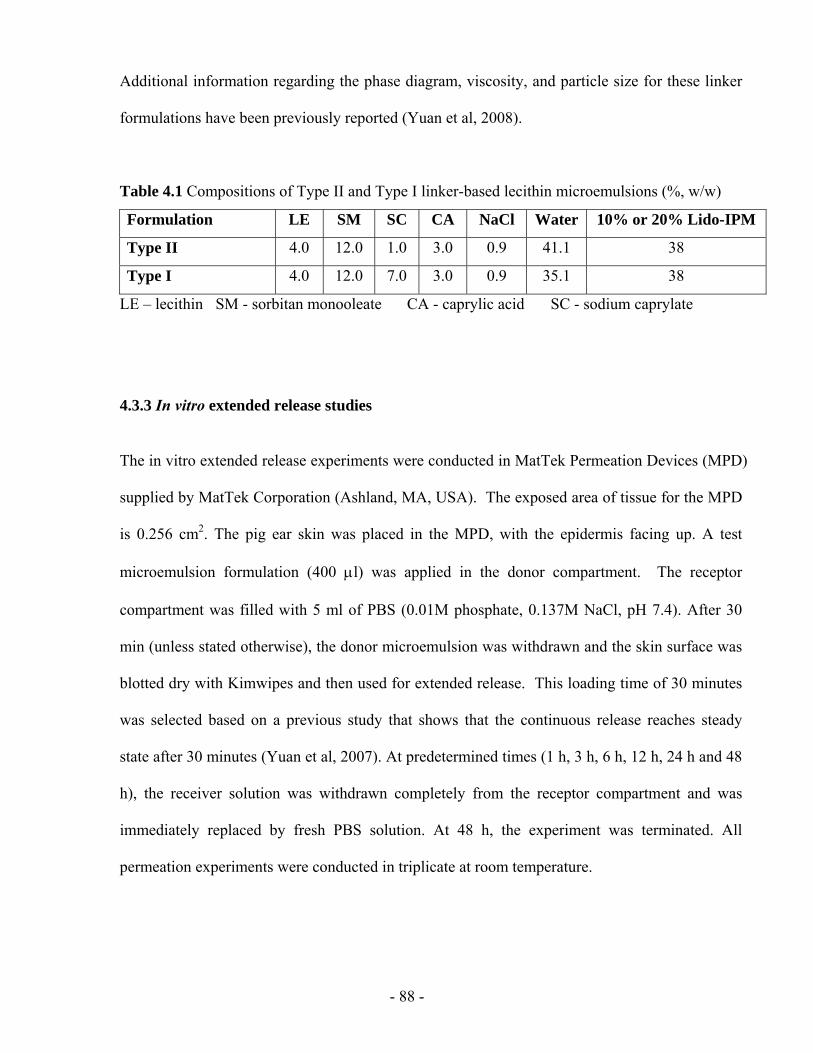
- 88 -
Additional information regarding the phase diagram, viscosity, and particle size for these linker
formulations have been previously reported (Yuan et al, 2008).
Table 4.1 Compositions of Type II and Type I linker-based lecithin microemulsions (%, w/w)
Formulation LE SM SC CA NaCl Water 10% or 20% Lido-IPM
Type II 4.0 12.0 1.0 3.0 0.9 41.1 38
Type I 4.0 12.0 7.0 3.0 0.9 35.1 38
LE – lecithin SM - sorbitan monooleate CA - caprylic acid SC - sodium caprylate
4.3.3 In vitro extended release studies
The in vitro extended release experiments were conducted in MatTek Permeation Devices (MPD)
supplied by MatTek Corporation (Ashland, MA, USA). The exposed area of tissue for the MPD
is 0.256 cm2. The pig ear skin was placed in the MPD, with the epidermis facing up. A test
microemulsion formulation (400 μl) was applied in the donor compartment. The receptor
compartment was filled with 5 ml of PBS (0.01M phosphate, 0.137M NaCl, pH 7.4). After 30
min (unless stated otherwise), the donor microemulsion was withdrawn and the skin surface was
blotted dry with Kimwipes and then used for extended release. This loading time of 30 minutes
was selected based on a previous study that shows that the continuous release reaches steady
state after 30 minutes (Yuan et al, 2007). At predetermined times (1 h, 3 h, 6 h, 12 h, 24 h and 48
h), the receiver solution was withdrawn completely from the receptor compartment and was
immediately replaced by fresh PBS solution. At 48 h, the experiment was terminated. All
permeation experiments were conducted in triplicate at room temperature.
- 89 -
4.3.3.1 In vitro skin absorption
The pig ear skin samples at the end of the in vitro extended release studies were used to test the
final concentration of the drug absorbed in the skin (Csf). Prior to measuring the absorbed
lidocaine, the pig skin was rinsed with a PBS solution and placed into 2 ml methanol for
overnight extraction of lidocaine (Yuan et al., 2008). The equivalent lidocaine concentration
absorbed in skin was calculated as the mass of lidocaine extracted from the skin divided by the
volume of the skin (exposed area ×thickness), and is expressed in mg/ml. We have determined,
using a mass balance closure in selected samples, that the efficiency of this methanol extraction
procedure is more than 95%. The initial lidocaine concentration (Cs0) absorbed into skin after 30
min application of a microemulsion was then calculated by adding the cumulative amount of
drug permeated to the receiver and the final amount of drug extracted from the skin and dividing
this value by the volume of the skin.
4.3.3.2 Lidocaine quantification
The concentration of lidocaine in the microemulsions, receiver solutions and skin was analyzed
using a Dionex ICS-3000 (Sunnyvale, CA, USA) liquid chromatography system consisting of
single pump, detector, AS40 automated sampler, AD25 absorbance detector and Chromeleon
chromatography software (Dionex). Lidocaine was separated by a reverse phase column
(Genesis, C18, 4 μm, 150×4.6 mm) and detected through its absorbance at 230 nm (AD25
detector). A mixture of acetonitrile and 0.05 M NaH2PO4·H2O (pH 2.0) solution (30:70, v/v) was
used as a mobile phase with a flow rate at 1.0 ml/min. The column temperature and the injection
volume were 25°C and 10µl, respectively.
- 90 -
4.3.3.3 Statistical data analysis
All extended release values were calculated from three independent experiments, and data are
expressed as the mean value ± S.D. The statistical analysis of ksr, and t50%, was performed using
a one-way analysis of variance (ANOVA) to test the difference between the means of two or
more delivery systems. Data with P<0.05 are considered statistically significant.
4.3.4 Fluorescence Microscopy
To visualize the permeation of the microemulsions into the skin tissues, the linker-based lecithin
microemulsions containing a fluorescent dye, Nile red (0.001%), were prepared. The dye was
simply dissolved into the Type II and I systems with 10% lido-IPM (Table 4.1). The systems
were vortexed and left to equilibrate overnight. The microemulsions containing Nile red were
then used to conduct in vitro extended release studies. After 1 hour, the skin samples were taken
off the permeation device, blotted dry with Kimwipes, and then rinsed twice with PBS. The clean
skin samples were snap frozen using dry ice and were cross sectioned to 30 µm thick slices by a
cryostat microtome (Leica Jung CM3000, Bensheim, Germany). The skin slices were observed
and photographed with a Leica MZFIII fluorescence stereomicroscope (Leica, Heerbrugg,
Switzerland) equipped with a Leica DFC 320 Digital Camera (Leica, Heerbrugg, Switzerland).
Sections were photographed using a red filter (λexc= 450-500 nm) to visualize Nile red. All
photographs were taken with 63x objectives and exposure time 2.0 sec. Solutions of 0.001% Nile
red in IPM was considered as the control.
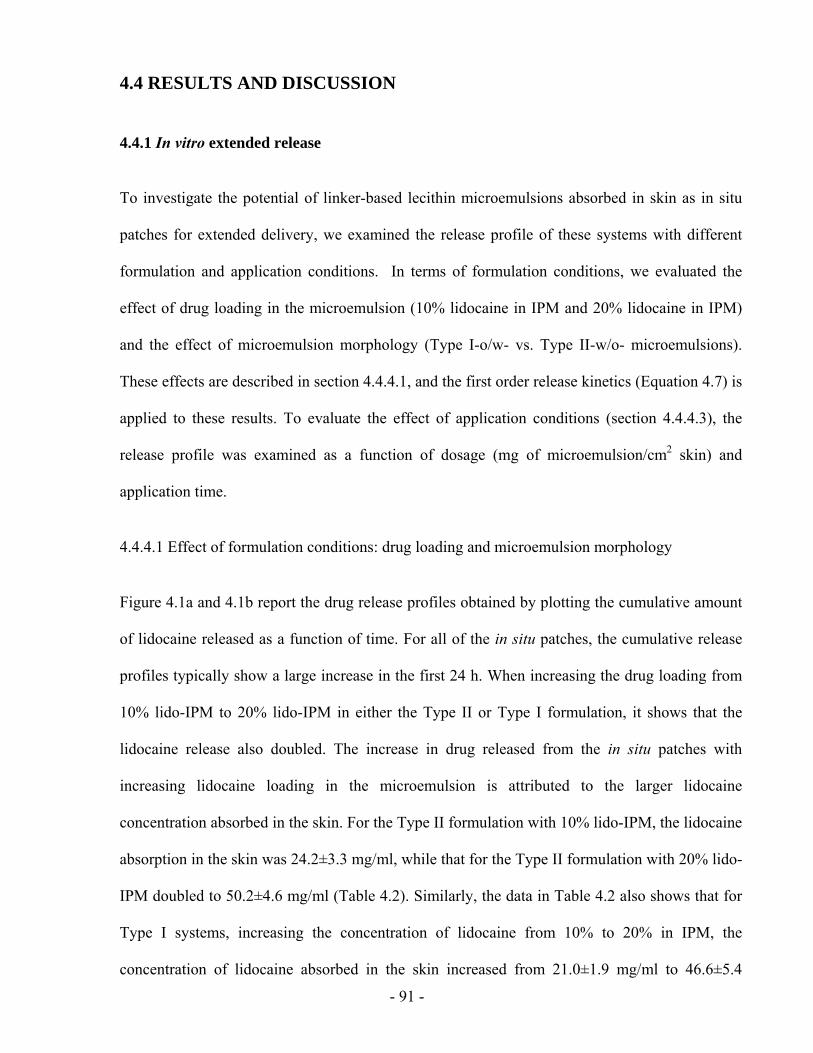
- 91 -
4.4 RESULTS AND DISCUSSION
4.4.1 In vitro extended release
To investigate the potential of linker-based lecithin microemulsions absorbed in skin as in situ
patches for extended delivery, we examined the release profile of these systems with different
formulation and application conditions. In terms of formulation conditions, we evaluated the
effect of drug loading in the microemulsion (10% lidocaine in IPM and 20% lidocaine in IPM)
and the effect of microemulsion morphology (Type I-o/w- vs. Type II-w/o- microemulsions).
These effects are described in section 4.4.4.1, and the first order release kinetics (Equation 4.7) is
applied to these results. To evaluate the effect of application conditions (section 4.4.4.3), the
release profile was examined as a function of dosage (mg of microemulsion/cm2 skin) and
application time.
4.4.4.1 Effect of formulation conditions: drug loading and microemulsion morphology
Figure 4.1a and 4.1b report the drug release profiles obtained by plotting the cumulative amount
of lidocaine released as a function of time. For all of the in situ patches, the cumulative release
profiles typically show a large increase in the first 24 h. When increasing the drug loading from
10% lido-IPM to 20% lido-IPM in either the Type II or Type I formulation, it shows that the
lidocaine release also doubled. The increase in drug released from the in situ patches with
increasing lidocaine loading in the microemulsion is attributed to the larger lidocaine
concentration absorbed in the skin. For the Type II formulation with 10% lido-IPM, the lidocaine
absorption in the skin was 24.2±3.3 mg/ml, while that for the Type II formulation with 20% lido-
IPM doubled to 50.2±4.6 mg/ml (Table 4.2). Similarly, the data in Table 4.2 also shows that for
Type I systems, increasing the concentration of lidocaine from 10% to 20% in IPM, the
concentration of lidocaine absorbed in the skin increased from 21.0±1.9 mg/ml to 46.6±5.4
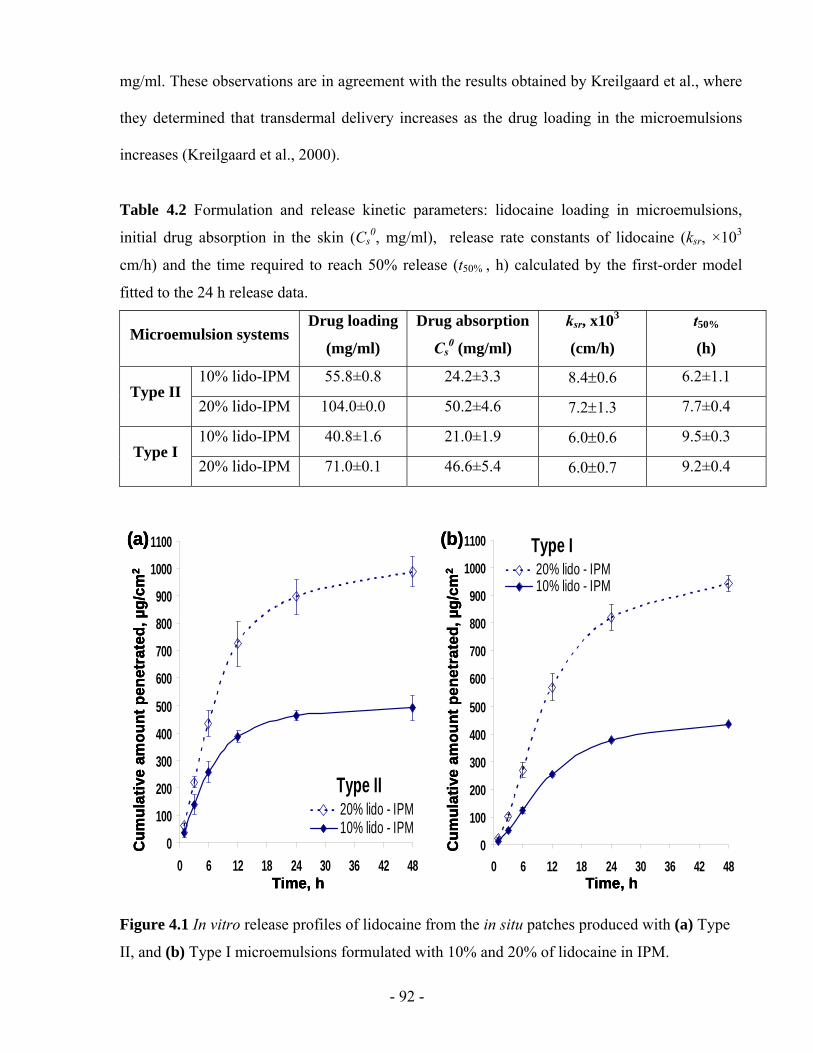
- 92 -
mg/ml. These observations are in agreement with the results obtained by Kreilgaard et al., where
they determined that transdermal delivery increases as the drug loading in the microemulsions
increases (Kreilgaard et al., 2000).
Table 4.2 Formulation and release kinetic parameters: lidocaine loading in microemulsions,
initial drug absorption in the skin (Cs0, mg/ml), release rate constants of lidocaine (ksr, ×103
cm/h) and the time required to reach 50% release (t50% , h) calculated by the first-order model
fitted to the 24 h release data.
Microemulsion systems Drug loading
(mg/ml)
Drug absorption
Cs0 (mg/ml)
ksr, x103
(cm/h)
t50%
(h)
10% lido-IPM 55.8±0.8 24.2±3.3 8.4±0.6 6.2±1.1 Type II
20% lido-IPM 104.0±0.0 50.2±4.6 7.2±1.3 7.7±0.4
10% lido-IPM 40.8±1.6 21.0±1.9 6.0±0.6 9.5±0.3 Type I
20% lido-IPM 71.0±0.1 46.6±5.4 6.0±0.7 9.2±0.4
Type II
0
100
200
300
400
500
600
700
800
900
1000
1100
0 6 12 18 24 30 36 42 48
20% lido - IPM10% lido - IPM
Time, h
Cum
ulat
ive
amou
nt p
enet
rate
d, µ
g/cm
2
(a) Type I
0
100
200
300
400
500
600
700
800
900
1000
1100
0 6 12 18 24 30 36 42 48
20% lido - IPM10% lido - IPM
Time, h
Cum
ulat
ive
amou
nt p
enet
rate
d, µ
g/cm
2
(b)
Type II
0
100
200
300
400
500
600
700
800
900
1000
1100
0 6 12 18 24 30 36 42 48
20% lido - IPM10% lido - IPM
Time, h
Cum
ulat
ive
amou
nt p
enet
rate
d, µ
g/cm
2
(a)
Type II
0
100
200
300
400
500
600
700
800
900
1000
1100
0 6 12 18 24 30 36 42 48
20% lido - IPM10% lido - IPM
Time, h
Cum
ulat
ive
amou
nt p
enet
rate
d, µ
g/cm
2
(a) Type I
0
100
200
300
400
500
600
700
800
900
1000
1100
0 6 12 18 24 30 36 42 48
20% lido - IPM10% lido - IPM
Time, h
Cum
ulat
ive
amou
nt p
enet
rate
d, µ
g/cm
2
(b) Type I
0
100
200
300
400
500
600
700
800
900
1000
1100
0 6 12 18 24 30 36 42 48
20% lido - IPM10% lido - IPM
Time, h
Cum
ulat
ive
amou
nt p
enet
rate
d, µ
g/cm
2
(b)
Figure 4.1 In vitro release profiles of lidocaine from the in situ patches produced with (a) Type
II, and (b) Type I microemulsions formulated with 10% and 20% of lidocaine in IPM.
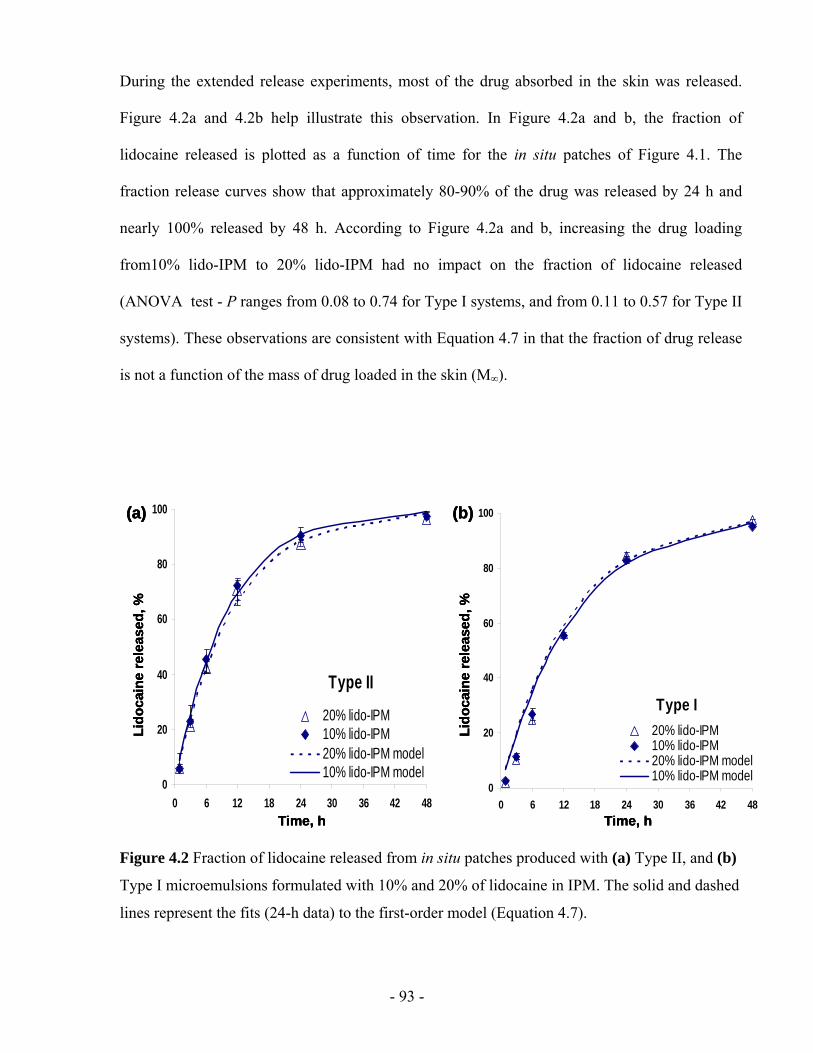
- 93 -
During the extended release experiments, most of the drug absorbed in the skin was released.
Figure 4.2a and 4.2b help illustrate this observation. In Figure 4.2a and b, the fraction of
lidocaine released is plotted as a function of time for the in situ patches of Figure 4.1. The
fraction release curves show that approximately 80-90% of the drug was released by 24 h and
nearly 100% released by 48 h. According to Figure 4.2a and b, increasing the drug loading
from10% lido-IPM to 20% lido-IPM had no impact on the fraction of lidocaine released
(ANOVA test - P ranges from 0.08 to 0.74 for Type I systems, and from 0.11 to 0.57 for Type II
systems). These observations are consistent with Equation 4.7 in that the fraction of drug release
is not a function of the mass of drug loaded in the skin (M∞).
Type II
0
20
40
60
80
100
0 6 12 18 24 30 36 42 48
20% lido-IPM10% lido-IPM20% lido-IPM model10% lido-IPM model
Time, h
Lido
cain
e re
leas
ed, %
(a)
Type I
0
20
40
60
80
100
0 6 12 18 24 30 36 42 48
20% lido-IPM10% lido-IPM20% lido-IPM model10% lido-IPM model
Time, h
Lido
cain
e re
leas
ed, %
(b)
Type II
0
20
40
60
80
100
0 6 12 18 24 30 36 42 48
20% lido-IPM10% lido-IPM20% lido-IPM model10% lido-IPM model
Time, h
Lido
cain
e re
leas
ed, %
(a)
Type II
0
20
40
60
80
100
0 6 12 18 24 30 36 42 48
20% lido-IPM10% lido-IPM20% lido-IPM model10% lido-IPM model
Time, h
Lido
cain
e re
leas
ed, %
(a)
Type I
0
20
40
60
80
100
0 6 12 18 24 30 36 42 48
20% lido-IPM10% lido-IPM20% lido-IPM model10% lido-IPM model
Time, h
Lido
cain
e re
leas
ed, %
(b)
Type I
0
20
40
60
80
100
0 6 12 18 24 30 36 42 48
20% lido-IPM10% lido-IPM20% lido-IPM model10% lido-IPM model
Time, h
Lido
cain
e re
leas
ed, %
(b)
Figure 4.2 Fraction of lidocaine released from in situ patches produced with (a) Type II, and (b)
Type I microemulsions formulated with 10% and 20% of lidocaine in IPM. The solid and dashed
lines represent the fits (24-h data) to the first-order model (Equation 4.7).
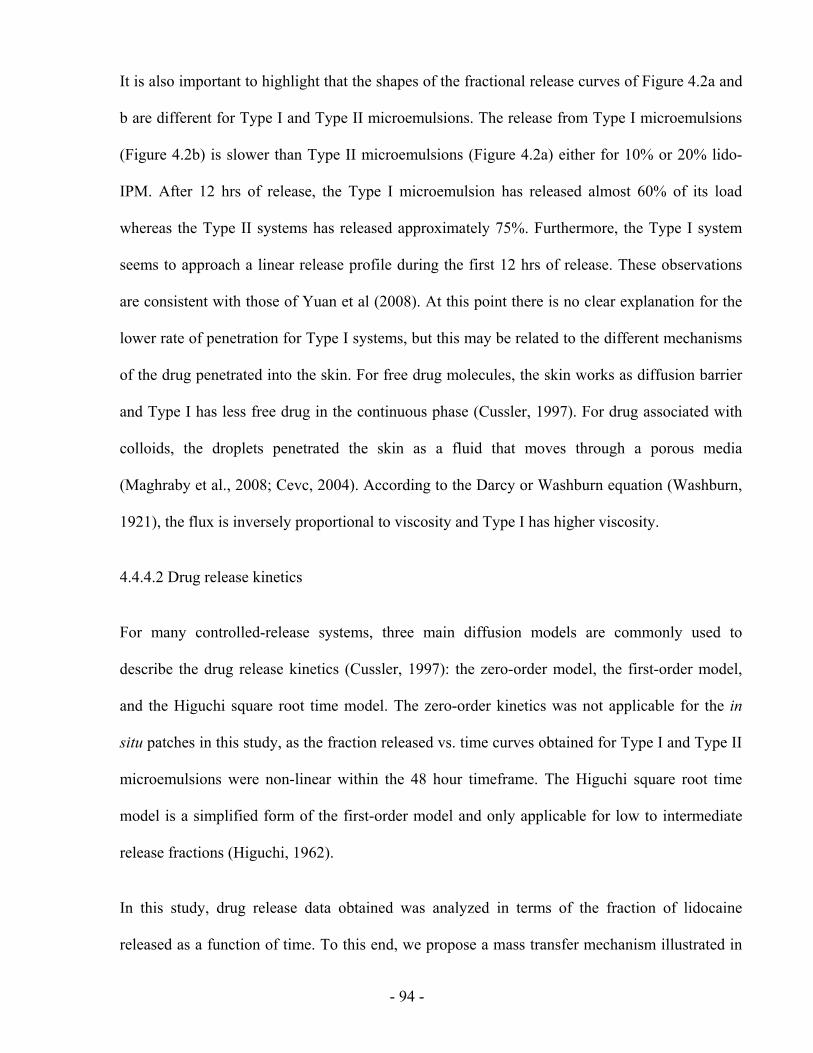
- 94 -
It is also important to highlight that the shapes of the fractional release curves of Figure 4.2a and
b are different for Type I and Type II microemulsions. The release from Type I microemulsions
(Figure 4.2b) is slower than Type II microemulsions (Figure 4.2a) either for 10% or 20% lido-
IPM. After 12 hrs of release, the Type I microemulsion has released almost 60% of its load
whereas the Type II systems has released approximately 75%. Furthermore, the Type I system
seems to approach a linear release profile during the first 12 hrs of release. These observations
are consistent with those of Yuan et al (2008). At this point there is no clear explanation for the
lower rate of penetration for Type I systems, but this may be related to the different mechanisms
of the drug penetrated into the skin. For free drug molecules, the skin works as diffusion barrier
and Type I has less free drug in the continuous phase (Cussler, 1997). For drug associated with
colloids, the droplets penetrated the skin as a fluid that moves through a porous media
(Maghraby et al., 2008; Cevc, 2004). According to the Darcy or Washburn equation (Washburn,
1921), the flux is inversely proportional to viscosity and Type I has higher viscosity.
4.4.4.2 Drug release kinetics
For many controlled-release systems, three main diffusion models are commonly used to
describe the drug release kinetics (Cussler, 1997): the zero-order model, the first-order model,
and the Higuchi square root time model. The zero-order kinetics was not applicable for the in
situ patches in this study, as the fraction released vs. time curves obtained for Type I and Type II
microemulsions were non-linear within the 48 hour timeframe. The Higuchi square root time
model is a simplified form of the first-order model and only applicable for low to intermediate
release fractions (Higuchi, 1962).
In this study, drug release data obtained was analyzed in terms of the fraction of lidocaine
released as a function of time. To this end, we propose a mass transfer mechanism illustrated in
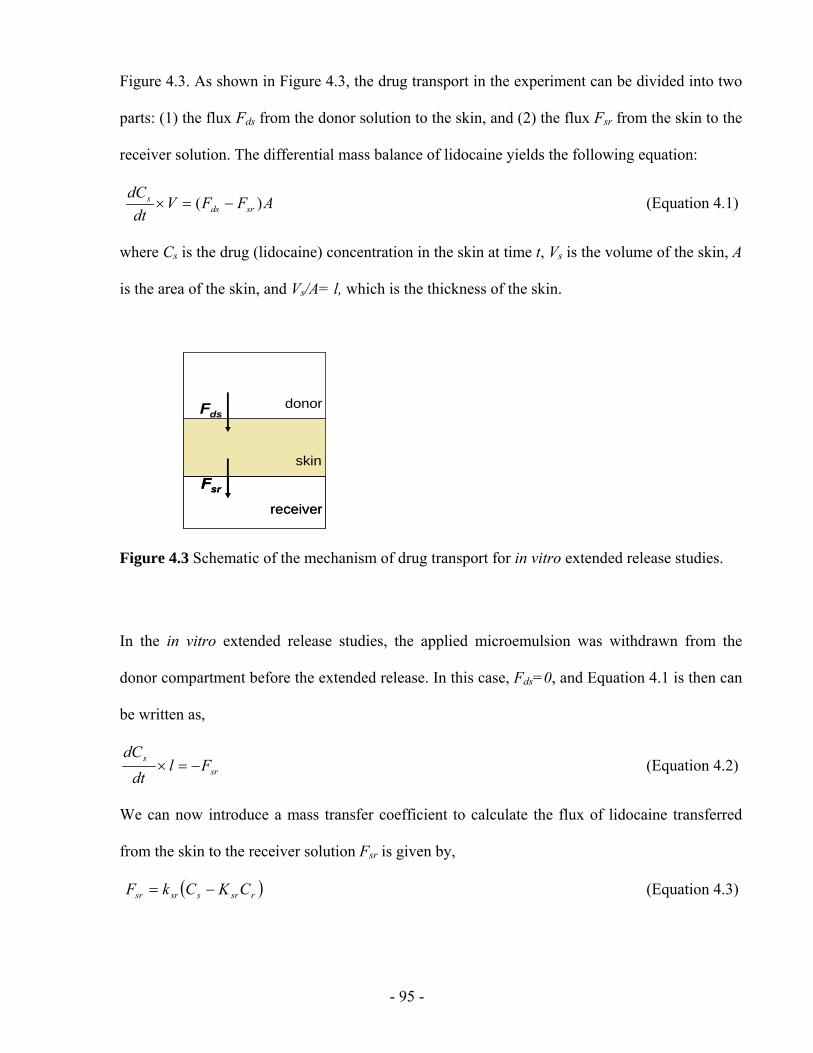
- 95 -
Figure 4.3. As shown in Figure 4.3, the drug transport in the experiment can be divided into two
parts: (1) the flux Fds from the donor solution to the skin, and (2) the flux Fsr from the skin to the
receiver solution. The differential mass balance of lidocaine yields the following equation:
AFFVdt
dCsrds
s )( −=× (Equation 4.1)
where Cs is the drug (lidocaine) concentration in the skin at time t, Vs is the volume of the skin, A
is the area of the skin, and Vs/A= l, which is the thickness of the skin.
donor
receiver
skin
Fds
Fsr
donor
receiver
skin
Fds
Fsr
Figure 4.3 Schematic of the mechanism of drug transport for in vitro extended release studies.
In the in vitro extended release studies, the applied microemulsion was withdrawn from the
donor compartment before the extended release. In this case, Fds=0, and Equation 4.1 is then can
be written as,
srs Fl
dtdC
−=× (Equation 4.2)
We can now introduce a mass transfer coefficient to calculate the flux of lidocaine transferred
from the skin to the receiver solution Fsr is given by,
( )rsrssrsr CKCkF −= (Equation 4.3)
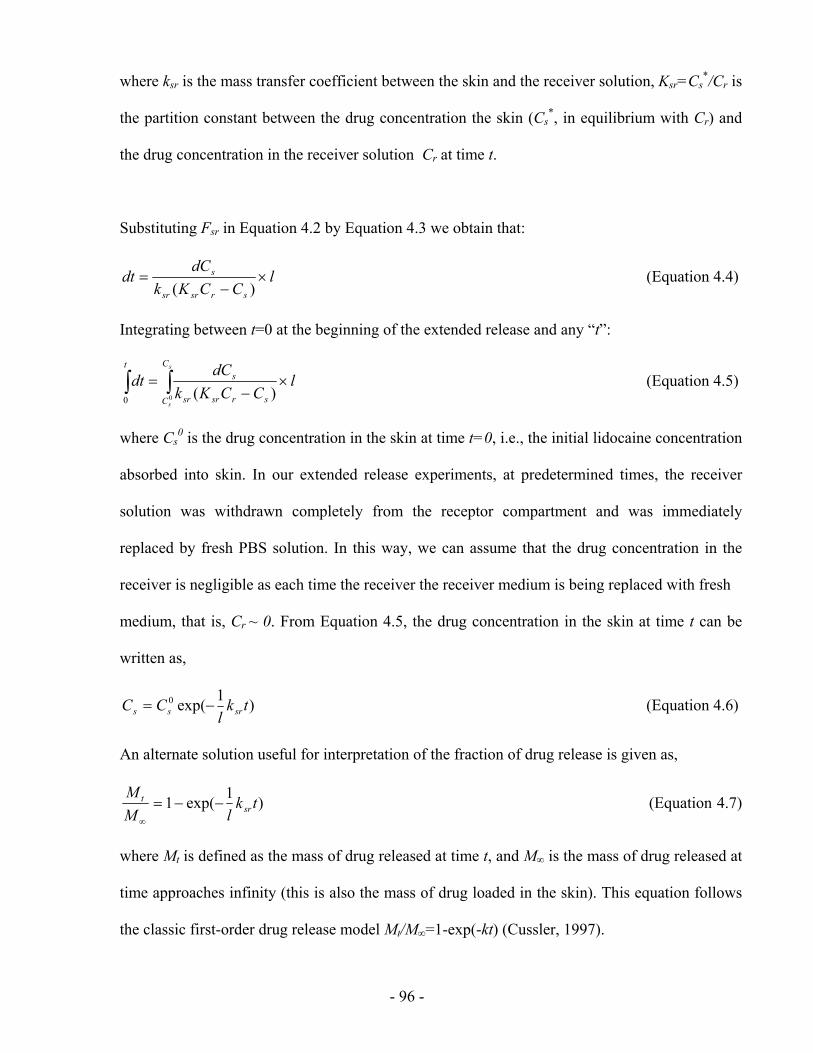
- 96 -
where ksr is the mass transfer coefficient between the skin and the receiver solution, Ksr=Cs*/Cr is
the partition constant between the drug concentration the skin (Cs*, in equilibrium with Cr) and
the drug concentration in the receiver solution Cr at time t.
Substituting Fsr in Equation 4.2 by Equation 4.3 we obtain that:
lCCKk
dCdt
srsrsr
s ×−
=)(
(Equation 4.4)
Integrating between t=0 at the beginning of the extended release and any “t”:
lCCKk
dCdt
t C
C srsrsr
ss
s
×−
=∫ ∫0 0 )(
(Equation 4.5)
where Cs0 is the drug concentration in the skin at time t=0, i.e., the initial lidocaine concentration
absorbed into skin. In our extended release experiments, at predetermined times, the receiver
solution was withdrawn completely from the receptor compartment and was immediately
replaced by fresh PBS solution. In this way, we can assume that the drug concentration in the
receiver is negligible as each time the receiver the receiver medium is being replaced with fresh
medium, that is, Cr ~ 0. From Equation 4.5, the drug concentration in the skin at time t can be
written as,
)1exp(0 tkl
CC srss −= (Equation 4.6)
An alternate solution useful for interpretation of the fraction of drug release is given as,
)1exp(1 tklM
Msr
t −−=∞
(Equation 4.7)
where Mt is defined as the mass of drug released at time t, and M∞ is the mass of drug released at
time approaches infinity (this is also the mass of drug loaded in the skin). This equation follows
the classic first-order drug release model Mt/M∞=1-exp(-kt) (Cussler, 1997).
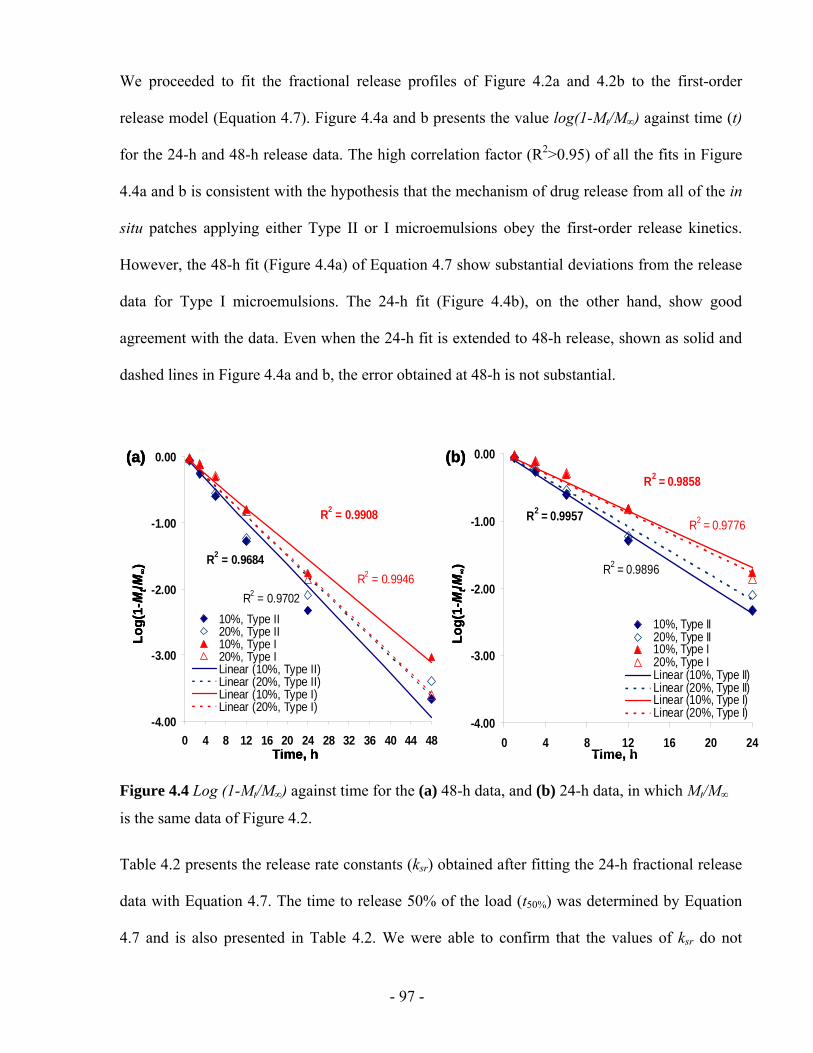
- 97 -
We proceeded to fit the fractional release profiles of Figure 4.2a and 4.2b to the first-order
release model (Equation 4.7). Figure 4.4a and b presents the value log(1-Mt/M∞) against time (t)
for the 24-h and 48-h release data. The high correlation factor (R2>0.95) of all the fits in Figure
4.4a and b is consistent with the hypothesis that the mechanism of drug release from all of the in
situ patches applying either Type II or I microemulsions obey the first-order release kinetics.
However, the 48-h fit (Figure 4.4a) of Equation 4.7 show substantial deviations from the release
data for Type I microemulsions. The 24-h fit (Figure 4.4b), on the other hand, show good
agreement with the data. Even when the 24-h fit is extended to 48-h release, shown as solid and
dashed lines in Figure 4.4a and b, the error obtained at 48-h is not substantial.
R2 = 0.9684
R2 = 0.9702
R2 = 0.9908
R2 = 0.9946
-4.00
-3.00
-2.00
-1.00
0.00
0 4 8 12 16 20 24 28 32 36 40 44 48
10%, Type II20%, Type II10%, Type I20%, Type ILinear (10%, Type II)Linear (20%, Type II)Linear (10%, Type I)Linear (20%, Type I)
Time, h
Log(
1-M
t/M∞)
(a)
R2 = 0.9957
R2 = 0.9896
R2 = 0.9858
R2 = 0.9776
-4.00
-3.00
-2.00
-1.00
0.00
0 4 8 12 16 20 24
10%, Type II20%, Type II10%, Type I20%, Type ILinear (10%, Type II)Linear (20%, Type II)Linear (10%, Type I)Linear (20%, Type I)
Time, h
Log(
1-M
t/M∞)
(b)
R2 = 0.9684
R2 = 0.9702
R2 = 0.9908
R2 = 0.9946
-4.00
-3.00
-2.00
-1.00
0.00
0 4 8 12 16 20 24 28 32 36 40 44 48
10%, Type II20%, Type II10%, Type I20%, Type ILinear (10%, Type II)Linear (20%, Type II)Linear (10%, Type I)Linear (20%, Type I)
Time, h
Log(
1-M
t/M∞)
(a)
R2 = 0.9684
R2 = 0.9702
R2 = 0.9908
R2 = 0.9946
-4.00
-3.00
-2.00
-1.00
0.00
0 4 8 12 16 20 24 28 32 36 40 44 48
10%, Type II20%, Type II10%, Type I20%, Type ILinear (10%, Type II)Linear (20%, Type II)Linear (10%, Type I)Linear (20%, Type I)
Time, h
Log(
1-M
t/M∞)
(a)
R2 = 0.9957
R2 = 0.9896
R2 = 0.9858
R2 = 0.9776
-4.00
-3.00
-2.00
-1.00
0.00
0 4 8 12 16 20 24
10%, Type II20%, Type II10%, Type I20%, Type ILinear (10%, Type II)Linear (20%, Type II)Linear (10%, Type I)Linear (20%, Type I)
Time, h
Log(
1-M
t/M∞)
(b)
R2 = 0.9957
R2 = 0.9896
R2 = 0.9858
R2 = 0.9776
-4.00
-3.00
-2.00
-1.00
0.00
0 4 8 12 16 20 24
10%, Type II20%, Type II10%, Type I20%, Type ILinear (10%, Type II)Linear (20%, Type II)Linear (10%, Type I)Linear (20%, Type I)
Time, h
Log(
1-M
t/M∞)
(b)
Figure 4.4 Log (1-Mt/M∞) against time for the (a) 48-h data, and (b) 24-h data, in which Mt/M∞
is the same data of Figure 4.2.
Table 4.2 presents the release rate constants (ksr) obtained after fitting the 24-h fractional release
data with Equation 4.7. The time to release 50% of the load (t50%) was determined by Equation
4.7 and is also presented in Table 4.2. We were able to confirm that the values of ksr do not
- 98 -
depend on the loading of lidocaine in Type I (P=0.98) or Type II (P=0.31) microemulsions.
Furthermore, we were able to determine that the value of ksr was different for Type I and Type II
microemulsions formulated with 10% lidocaine in IPM (P=0.045), but not distinctly different for
formulations produced with 20% lidocaine in IPM (P=0.21). The analysis of these fits suggests
that, consistent with the earlier observations, the loading of lidocaine in the microemulsion does
not affect the fractional release. However, the morphology of the microemulsion (Type I vs.
Type II) does have an impact on the release kinetics. The slower lidocaine release from Type I
microemulsion is consistent with previous observations in continuous delivery studies (Yuan et
al, 2008). In that work, it was shown that the “skin” permeability of Type II microemulsions
loaded with lidocaine was almost twice that of Type I microemulsions. This “skin” permeability
can be interpreted as a mass transfer coefficient for continuous delivery when the donor is not
removed from the permeation device. The ratio between ksr for Type II and ksr for Type I systems
formulated with 10% of lidocaine in IPM (Table 4.2) is close to 1.4, which approaches the ratio
observed for the “skin” permeability by Yuan et al (2008). Using the argument of viscosity (35cP
for Type I and 15cP for Type II), and Darcy’s law or Washburn equation (flux~1/viscosity) then
the ratio of “skin” permeabilities should be close to 2. Further studies to explore this
phenomenon and to explain the effect of microemulsion morphology are still needed.
In order to compare the extended release performance of Type I and II formulations with other
systems, we plotted the release profile of the microemulsions, and the release profile of other
lidocaine patches reported in the literature (Repeka et al., 2005; Glasvas-Dodov et al., 2002;
Burgalassi et al., 1996; Gref et al., 1994). These release profiles are presented in Figure 4.5 for
Type I and Type II microemulsions formulated with 10% lido-IPM. The lidocaine release from
the in situ patch is slower than that from lidocaine embedded in a polymer (HPC:HPMC) film
(Repeka et al., 2005) and in polymeric nanospheres (Gref et al., 1994), however, it has similar
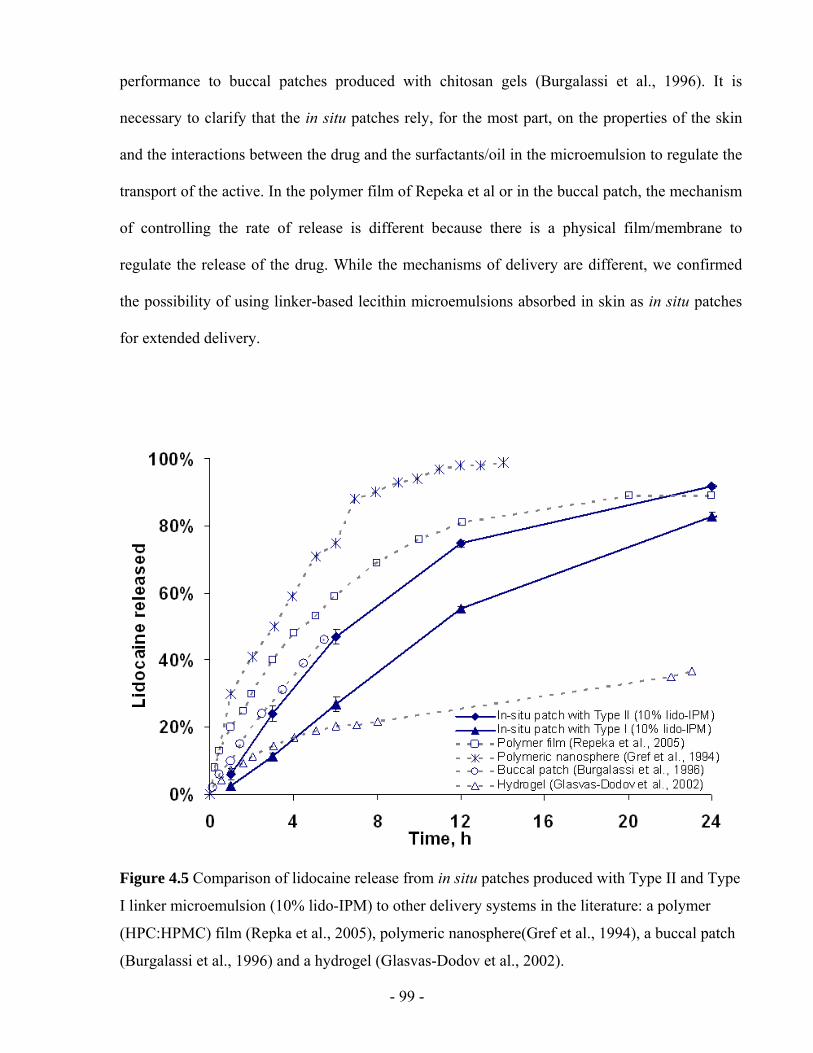
- 99 -
performance to buccal patches produced with chitosan gels (Burgalassi et al., 1996). It is
necessary to clarify that the in situ patches rely, for the most part, on the properties of the skin
and the interactions between the drug and the surfactants/oil in the microemulsion to regulate the
transport of the active. In the polymer film of Repeka et al or in the buccal patch, the mechanism
of controlling the rate of release is different because there is a physical film/membrane to
regulate the release of the drug. While the mechanisms of delivery are different, we confirmed
the possibility of using linker-based lecithin microemulsions absorbed in skin as in situ patches
for extended delivery.
Figure 4.5 Comparison of lidocaine release from in situ patches produced with Type II and Type
I linker microemulsion (10% lido-IPM) to other delivery systems in the literature: a polymer
(HPC:HPMC) film (Repka et al., 2005), polymeric nanosphere(Gref et al., 1994), a buccal patch
(Burgalassi et al., 1996) and a hydrogel (Glasvas-Dodov et al., 2002).
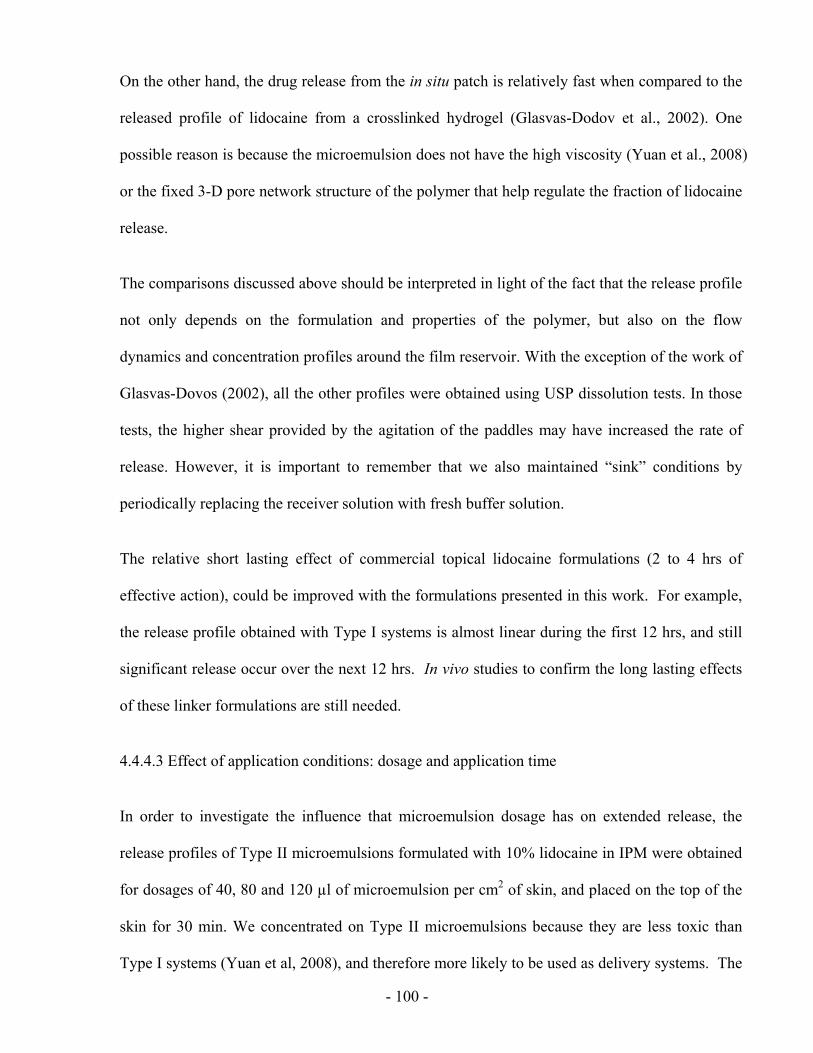
- 100 -
On the other hand, the drug release from the in situ patch is relatively fast when compared to the
released profile of lidocaine from a crosslinked hydrogel (Glasvas-Dodov et al., 2002). One
possible reason is because the microemulsion does not have the high viscosity (Yuan et al., 2008)
or the fixed 3-D pore network structure of the polymer that help regulate the fraction of lidocaine
release.
The comparisons discussed above should be interpreted in light of the fact that the release profile
not only depends on the formulation and properties of the polymer, but also on the flow
dynamics and concentration profiles around the film reservoir. With the exception of the work of
Glasvas-Dovos (2002), all the other profiles were obtained using USP dissolution tests. In those
tests, the higher shear provided by the agitation of the paddles may have increased the rate of
release. However, it is important to remember that we also maintained “sink” conditions by
periodically replacing the receiver solution with fresh buffer solution.
The relative short lasting effect of commercial topical lidocaine formulations (2 to 4 hrs of
effective action), could be improved with the formulations presented in this work. For example,
the release profile obtained with Type I systems is almost linear during the first 12 hrs, and still
significant release occur over the next 12 hrs. In vivo studies to confirm the long lasting effects
of these linker formulations are still needed.
4.4.4.3 Effect of application conditions: dosage and application time
In order to investigate the influence that microemulsion dosage has on extended release, the
release profiles of Type II microemulsions formulated with 10% lidocaine in IPM were obtained
for dosages of 40, 80 and 120 µl of microemulsion per cm2 of skin, and placed on the top of the
skin for 30 min. We concentrated on Type II microemulsions because they are less toxic than
Type I systems (Yuan et al, 2008), and therefore more likely to be used as delivery systems. The
- 101 -
results were compared with that for a dosage of 1600 µl/cm2 (400 µl applied on the MPD
mentioned in Section 4.3.3). The release profiles for different dosages are given in Figure 4.6a
According to these cumulative release profiles, the larger the microemulsion dosage, the larger
the amount of lidocaine released.
0
100
200
300
400
500
600
0 6 12 18 24 30 36 42 48
40 µl/cm280 µl/cm2120 µl/cm21600 µl/cm2
Time, h
Cum
ulat
ive
amou
nt p
enet
rate
d, µ
g/cm
2
(a)
Time, h
Log(
1-M
t/M∞)
(b) y = -0.0926xR2 = 0.9659
y = -0.0892xR2 = 0.9874
y = -0.0948xR2 = 0.9881
y = -0.1069xR2 = 0.9871
-3.00
-2.50
-2.00
-1.50
-1.00
-0.50
0.00
0 4 8 12 16 20 24
40 µl/cm280 µl/cm2120 µl/cm21600 µl/cm2Linear (40 µl/cm2)Linear (80 µl/cm2)Linear (120 µl/cm2)Linear (1600 µl/cm2)
0
100
200
300
400
500
600
0 6 12 18 24 30 36 42 48
40 µl/cm280 µl/cm2120 µl/cm21600 µl/cm2
Time, h
Cum
ulat
ive
amou
nt p
enet
rate
d, µ
g/cm
2
(a)
0
100
200
300
400
500
600
0 6 12 18 24 30 36 42 48
40 µl/cm280 µl/cm2120 µl/cm21600 µl/cm2
Time, h
Cum
ulat
ive
amou
nt p
enet
rate
d, µ
g/cm
2
(a)
Time, h
Log(
1-M
t/M∞)
(b) y = -0.0926xR2 = 0.9659
y = -0.0892xR2 = 0.9874
y = -0.0948xR2 = 0.9881
y = -0.1069xR2 = 0.9871
-3.00
-2.50
-2.00
-1.50
-1.00
-0.50
0.00
0 4 8 12 16 20 24
40 µl/cm280 µl/cm2120 µl/cm21600 µl/cm2Linear (40 µl/cm2)Linear (80 µl/cm2)Linear (120 µl/cm2)Linear (1600 µl/cm2)
Time, h
Log(
1-M
t/M∞)
(b) y = -0.0926xR2 = 0.9659
y = -0.0892xR2 = 0.9874
y = -0.0948xR2 = 0.9881
y = -0.1069xR2 = 0.9871
-3.00
-2.50
-2.00
-1.50
-1.00
-0.50
0.00
0 4 8 12 16 20 24
40 µl/cm280 µl/cm2120 µl/cm21600 µl/cm2Linear (40 µl/cm2)Linear (80 µl/cm2)Linear (120 µl/cm2)Linear (1600 µl/cm2)
Figure 4.6 (a) In vitro release profiles of lidocaine and (b) Log (1-Mt/M∞) against time for the
24-h data from the Type II microemulsion formulated with 10% lido-IPM. Different curves
present different dosages.
To understand the data in Figure 4.6a, it is important to consider the initial lidocaine
concentration absorbed in the skin after different dosages. The initial lidocaine concentration in
the skin was 11.1±3.2, 16.0±4.0, and 21.4±6.5 mg/ml for the dosage of 40, 80 and 120 µl/cm2
respectively. Based on this information, the larger the microemulsion dosage, the larger the
initial lidocaine concentration in the skin, and the larger the cumulative amount of drug released.
Figure 4.6b presents the value log(1-Mt/M∞) against time (t) for the 24-h data of different dosage.
- 102 -
The variation of the slopes (-ksr/l) for different curves is small, which indicates that the change of
application dosage do not change the mass transfer coefficient (ksr).
To explain the effect of microemulsion dosage, one can consider that transdermal delivery with
microemulsions resembles the general phenomena of imbibition of liquids into porous media,
which is explained by the Washburn equation (Washburn, 1921). According to this equation, a
wetting fluid (such as microemulsions) will penetrate a capillary tube as long as there is liquid in
the mouth of the tube. Larger doses provide a larger reservoir of fluid on the mouth of the pores,
thus imbibing more microemulsion into the skin. In reality, dosages of 10 - 40 µl/cm2 can be
used for topical applications. However, a dosage of 1600 µl/cm2 is unrealistic because the
microemulsion, having the relatively low viscosity of 15 cP and a wetting contact angle on the
skin (less than 10°), would quickly spread over the skin. In this work most of the studies were
conducted at 1600 µl/cm2 for the purpose of evaluating effects other than dosage in order to
ensure that the pores are filled during the time that the microemulsion is in contact with the skin.
Besides dosage, application time is also a factor that may affect the extended release of lidocaine.
To evaluate this effect, the released profile was obtained for skins dosed with 1600 µl/cm2 of
Type II systems (10% lidocaine in IPM) and exposed for 5 min and 15 min. Figure 4.7a shows
the cumulative lidocaine release profiles for 5, 15 and 30 minutes of application time. As
expected, longer application times resulted in more drug permeated through the skin. The drug
initially absorbed in the skin also increases from 21.2±4.2 to 24.2±3.3 mg/ml as the application
time increases from 5 to 30 minutes. This observation is consistent with the full differential mass
balance equation (Equation 4.1), where the concentration in skin is expected to increase from
zero, when the donor is placed on top of the skin, to a steady state value when the flux of
lidocaine received from the donor equals the flux of lidocaine released from the skin. In Chapter
3, it was found that the time for linker-based lecithin microemulsions to reach steady state during
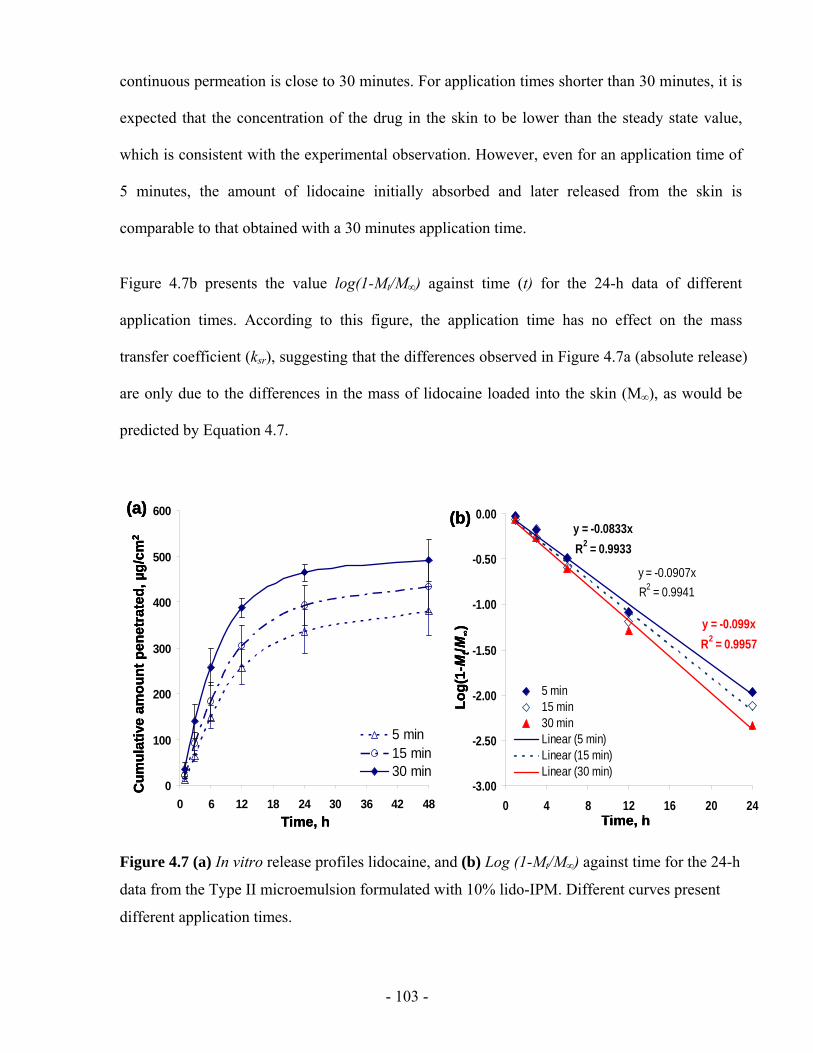
- 103 -
continuous permeation is close to 30 minutes. For application times shorter than 30 minutes, it is
expected that the concentration of the drug in the skin to be lower than the steady state value,
which is consistent with the experimental observation. However, even for an application time of
5 minutes, the amount of lidocaine initially absorbed and later released from the skin is
comparable to that obtained with a 30 minutes application time.
Figure 4.7b presents the value log(1-Mt/M∞) against time (t) for the 24-h data of different
application times. According to this figure, the application time has no effect on the mass
transfer coefficient (ksr), suggesting that the differences observed in Figure 4.7a (absolute release)
are only due to the differences in the mass of lidocaine loaded into the skin (M∞), as would be
predicted by Equation 4.7.
0
100
200
300
400
500
600
0 6 12 18 24 30 36 42 48
5 min15 min30 min
Time, h
Cum
ulat
ive
amou
nt p
enet
rate
d, µ
g/cm
2
(a)y = -0.0833xR2 = 0.9933
y = -0.0907xR2 = 0.9941
y = -0.099xR2 = 0.9957
-3.00
-2.50
-2.00
-1.50
-1.00
-0.50
0.00
0 4 8 12 16 20 24
5 min15 min30 minLinear (5 min)Linear (15 min)Linear (30 min)
Time, h
Log(
1-M
t/M∞)
(b)
0
100
200
300
400
500
600
0 6 12 18 24 30 36 42 48
5 min15 min30 min
Time, h
Cum
ulat
ive
amou
nt p
enet
rate
d, µ
g/cm
2
(a)
0
100
200
300
400
500
600
0 6 12 18 24 30 36 42 48
5 min15 min30 min
Time, h
Cum
ulat
ive
amou
nt p
enet
rate
d, µ
g/cm
2
(a)y = -0.0833xR2 = 0.9933
y = -0.0907xR2 = 0.9941
y = -0.099xR2 = 0.9957
-3.00
-2.50
-2.00
-1.50
-1.00
-0.50
0.00
0 4 8 12 16 20 24
5 min15 min30 minLinear (5 min)Linear (15 min)Linear (30 min)
Time, h
Log(
1-M
t/M∞)
(b)y = -0.0833xR2 = 0.9933
y = -0.0907xR2 = 0.9941
y = -0.099xR2 = 0.9957
-3.00
-2.50
-2.00
-1.50
-1.00
-0.50
0.00
0 4 8 12 16 20 24
5 min15 min30 minLinear (5 min)Linear (15 min)Linear (30 min)
Time, h
Log(
1-M
t/M∞)
(b)
Figure 4.7 (a) In vitro release profiles lidocaine, and (b) Log (1-Mt/M∞) against time for the 24-h
data from the Type II microemulsion formulated with 10% lido-IPM. Different curves present
different application times.
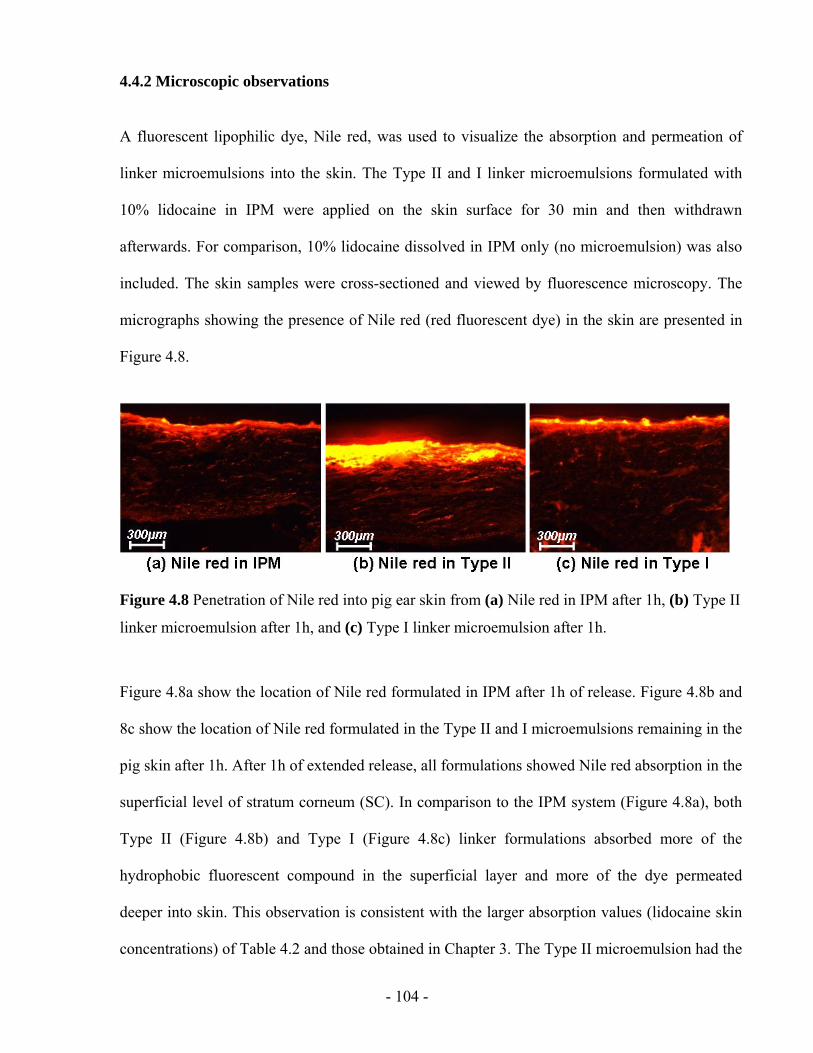
- 104 -
4.4.2 Microscopic observations
A fluorescent lipophilic dye, Nile red, was used to visualize the absorption and permeation of
linker microemulsions into the skin. The Type II and I linker microemulsions formulated with
10% lidocaine in IPM were applied on the skin surface for 30 min and then withdrawn
afterwards. For comparison, 10% lidocaine dissolved in IPM only (no microemulsion) was also
included. The skin samples were cross-sectioned and viewed by fluorescence microscopy. The
micrographs showing the presence of Nile red (red fluorescent dye) in the skin are presented in
Figure 4.8.
Figure 4.8 Penetration of Nile red into pig ear skin from (a) Nile red in IPM after 1h, (b) Type II
linker microemulsion after 1h, and (c) Type I linker microemulsion after 1h.
Figure 4.8a show the location of Nile red formulated in IPM after 1h of release. Figure 4.8b and
8c show the location of Nile red formulated in the Type II and I microemulsions remaining in the
pig skin after 1h. After 1h of extended release, all formulations showed Nile red absorption in the
superficial level of stratum corneum (SC). In comparison to the IPM system (Figure 4.8a), both
Type II (Figure 4.8b) and Type I (Figure 4.8c) linker formulations absorbed more of the
hydrophobic fluorescent compound in the superficial layer and more of the dye permeated
deeper into skin. This observation is consistent with the larger absorption values (lidocaine skin
concentrations) of Table 4.2 and those obtained in Chapter 3. The Type II microemulsion had the
- 105 -
highest deposition of Nile red on the uppermost skin layer because its external phase is oil which
contains more hydrophobic Nile red.
These fluorescence microscopy studies are consistent with the hypothesis that the active
ingredient (the hydrophobic fluorescence dye Nile red, in this case) is carried by the linker
microemulsions to the deeper layers of the skin.
4.5 CONCLUSIONS
We observed the extended release of lidocaine from the in situ skin patches produced with
linker-based lecithin microemulsions. After applying the microemulsions for a period of time,
lidocaine was absorbed in the skin. The microemulsion imbibed in the skin acted as drug
reservoir and provided extended release for over 24 hours. The lidocaine release from the
microemulsions in situ patches follows a first-order kinetics. Increasing the drug loading in the
microemulsion, the microemulsion dosage, and the application time increases the drug uptake in
the skin, and the cumulative amount of drug release. However, the mass transfer constant (ksr) is
not affected by these formulation/application conditions, and depends on the morphology of the
microemulsion, and quite likely on the properties of the skin. Microscopic observations
illustrated the uptake of a lipophilic dye by the upper layers of the skin.
In conclusion, linker microemulsions can act as in situ delivery patches for extended release of
active ingredients. Potential advantages of this in situ patch include its application on uneven and
exposed parts, its low cost, customizable dose and flexibility to formulate for a wide range of
drugs.
- 106 -
4.6 REFERENCES
Acosta, E.J., Nguyen, T., Witthayapanyanon, A., Harwell, J.H., Sabatini, D.A., 2005. Linker-based bio-compatible microemulsions. Environ. Sci. Technol. 39, 1275–1282.
Baroli, B., López-Quintela, M.A., Delgado-Charro, M.B., Fadda, A. M., Blanco-Méndez, J., 2000. Microemulsions for topical delivery of 8-methoxsalen. J. Controlled Release 69, 209-218.
Bronaugh, R.L., Maibach, H.I., 2005. Percutaneous absorption: drugs, cosmetics, mechanisms, methodology, fourth ed. Taylor & Francis, Boca Raton.
Burgalassi, S., Panichi, L., Saettone, M.F., Jacobsen, J., Rassing, M.R., 1996. Development and in vitro/in vivo testing of mucoadhesive buccal patches releasing benzydamine and lidocaine. Int. J. Pharm. 133, 1-7.
Cevc, G., 2004. Lipid vesicles and other colloids as drug carriers on the skin. Adv. Drug Deliv. Rev., 56, 675-711.
Cussler, E.L., 1997. Chapter 18: Controlled release and related phenomena. In: Diffusion: mass transfer in fluid systems (2nd ed.), Cambridge University Press, Cambridge.
Delgado-Charro, M.B., Iglesias-Vilas, G., Blanco-Méndez, J., López-Quintela, M.A., Marty, J., Guy, R. H., 1997. Delivery of a hydrophilic solute through the skin from novel microemulsion systems. Eur. J. Pharm. Biopharm. 43, 37-42.
Escribano, E., Obach, M., Arévalo, M. I., Calpena, A. C., Domenech, J., Queralt, J. 2005. Rapid human skin permeation and topical anaesthetic activity of a new amethocaine microemulsion. Skin Pharmacol. Physicol. 18, 294-300.
Glavas-Dodov, M., Goracinova, K., Mladenovska, K., Fredro-Kumbaradzi, E., 2002. Release profile of lidocaine HCl from topical liposomal gel formulation. Int. J. Pharm. 242, 381-384.
Gref, R., Minamitake, Y., Peracchia, M.T., Trubetskoy, V., Torchilin, V., Langer, R. 1994. Biodegradable long-circulating polymeric nanospheres. Science, 263, 1600-1603.
Heinen, M., Achterberg, T., Reimer, W., Kerkhof, P.M., Laat, E. 2004. Venous leg ulcer patients: a review of the literature on lifestyle and pain-related interventions. J. Clin. Nurs. 13, 355-366.
Higuchi, W.I., 1962. Analysis of data on the medicament release from ointments. J. Pharm. Sci., 51, 802-804.
Jesitus, J. 2001. Newer anesthetics found effective after 30-minute application. Cosmetic Surgery Times magazine (http://www.topicaine.net/f/Topical_anesthetic_lidocaine_gel.pdf).
Kreilgaard, M., Pedersen, E.J., Jaroszewski, J.W., 2000. NMR characterisation and transdermal drug delivery potential of microemulsion systems. J. Control. Release, 69, 421-433.
- 107 -
Kurihara-Bergstrom, T., Good, W.R., Feisullin, S., Signor, C., 1991. Skin compatibility of transdermal drug delivery systems. J. Controlled Release 15, 271-277.
Lee, P.J., Langer, R., Shastri, V.P., 2003. Novel microemulsion enhancer formulation for simultaneous transdermal delivery of hydrophilic and hydrophobic Drugs. Pharm. Res., 20, 264-269.
Maghraby, G.M., Barry, B.W., Williams, A.C., 2008. Liposomes and skins: from drug delivery to model membranes. Eur. J. Phar. Sci., 34, 203-222.
Pasero, C. L., Davies, P., Faucett, J. Wong, D. L., 1995. Pain control. Am. J. Nurs. 95, 22-24.
Repka, M.A., Gutta, K., Prodduturi, S., Munjal, M., Stodghill, S.P., 2005. Characterization of cellulosic hot-melt extruded films containing lidocaine. Eur. J. Pharm. Biopharm. 59, 189-196.
Scheindlin, S., 2004, Transdermal drug delivery: Past, present, future. Molecular interventions. 4, 308-312.
Sintov, A.C. and Shapiro, L., 2004. New microemulsion vehicle facilitates percutaneous penetration in vitro and cutaneous drug bioavailability in vivo. J. Control. Release 95, 173-183.
Skaaret, I., 2006. Extended release of lidocaine hydrochloride from a new formulation, Department of Pharmacy, Uppsala University (http://www.farmfak.uu.se/farm/galfarm-web/DiplomaWork/Ingrid_Skaaret.pdf)
Shah, V. P. and Skelly, J. P., 1987. Regulatory considerations in transdermal drug delivery systems in the United States. In: Chien, Y.W. (ed.), Transdermal controlled systemic medications. Dekker, New York.
Tetzlaff, J. E., 2000. Chapter 13: lidocaine, Clinical pharmacology of local anesthetics, Butterworth-Heinemann, Woburn, MA.
Williams, A.C., Barry, B.W., 1992. Skin absorption enhancers. Crit. Rev. Ther. Drug Carrier Syst. 9, 305–353.
Washburn, E.W., 1921. The dynamics of capillary flow. Phys. Rev., 17 (3), 273-283.
Yuan, J. S., Yip, A., Acosta, E., 2007. Optimization of surfactant concentration in topical microemulsion formulations. J. Cosmetic Sci. 58, 554-555.
Yuan, J. S., Ansari, M., Samaan, M., Acosta, E., 2008. Linker-based lecithin microemulsions for transdermal delivery of lidocaine. Int. J. Pharm. 349, 130-143.
- 108 -
CHAPTER 5
EFFECT OF SURFACTANT CONCENTRATION
ON TRANSDERMAL DELIVERY OF LIDOCAINE
WITH LINKER-BASED LECITHIN MICROEMULSIONS
This chapter is derived from the following manuscript:
Yuan, J. S., Yip, A., Nguyen, N., Chu, J., Wen, X.Y., Acosta, E., Effect of surfactant
concentration on transdermal delivery of lidocaine with linker-based microemulsions. Journal of
Controlled Release. 2009, Submitted.
- 109 -
5.1 ABSTRACT
In Chapter 3 and 4, linker-based lecithin microemulsions have been shown to produce substantial
transdermal flux and skin absorption of lidocaine. From a practical prospective, it is desirable to
reduce the surfactant and additive content while maintaining a desirable flux and absorption of
the active. In this chapter, we investigate the effect of surfactant and additive (linker) content on
transdermal fux and absorption of lidocaine. The literature on this issue suggests that high
surfactant concentrations reduce the partition of the active into the skin, which is undesirable.
However, other literature on microemulsions transport suggests that increasing surfactant
concentration improve the mass transport by increasing the number of micelle or reverse micelle
“carriers”. To resolve these issues, a differential mass balance model was introduced to analyze
the lidocaine permeation profiles. The model contains three basic parameters, the skin-donor
partition (Ksd), the donor mass transfer coefficient (kds) and the skin mass transfer coefficient
(skin permeability, ksr). For Type I (oil-swollen micelles) microemulsions, increasing surfactant
concentration reduces Ksd up to a point, but this was not observed for Type II (water-swollen
reverse micelles) microemulsions. Increasing surfactant concentration also increases kds, but in
most cases the permeability of the skin (ksr) limits the overall transport. The “skin” permeability
slightly increased with surfactant concentration up to a certain maximum. A surfactant-mediated
absorption/permeation mechanism is proposed to explain the drug transport through the skin.
Fluorescence studies for the permeation of hydrophilic, hydrophobic and amphiphilic probes are
consistent with the proposed mechanism of transport.
- 110 -
5.2 INTRODUCTION
Over the last few decades, microemulsions have gained considerable interest as potential drug
delivery systems (Bagwe et al., 2001; Lawrence and Rees, 2000; Tenjarla, 1999).
Microemulsions offer many advantages for pharmaceutical use, such as ease of preparation,
thermodynamic stability, and high solubilization capacity for both lipophilic and hydrophilic
drugs. However, the main limitation in microemulsion formulations is that they typically require
large amount of surfactants and cosurfactants (>20 wt.%) in formulations. For example,
Delgado-Charro et al. formed microemulsion systems with about 25-44% surfactant mixture
(caprylocaproyl polyoxylglycerides and polyglyceryl fatty acid ester) to delivery drugs through
the skin (Delgado-charro et al., 1997). The surfactant concentration can be as extremely high as
70% in similar microemulsion systems (Kreilgaard et al., 2002). High surfactant concentrations
may cause skin irritation (McKarns et al, 1997; Attwood, 1994). In addition, the cosurfactants
employed in microemulsions are usually medium-chain alcohols which are potentially irritating
the skin (Attwood, 1994). Therefore, for a TDD formulation, the surfactant/cosurfactant
concentration should be as low as possible for a given drug delivery goal. The use of
microemulsions as drug carriers in the future depends on the choice of well-tolerated surfactants
and the optimization of their concentration and dosage.
The influence of surfactant concentration on the transdermal potential of microemulsions has not
been studied thoroughly. In the literature, there are only fewer papers (Chen, et al., 2006; Sintov
and Shapiro, 2004; Rhee et al., 2001) that have discussed the influence of surfactant
concentration on the transdermal flux of drugs in microemulsion systems, but none of them has
systematically investigated this effect thus far. In those articles, the authors observed that an
increase in surfactant concentration reduces the flux of drugs delivered through the skin. It was
suggested that the increase in the surfactant concentration lowers the thermodynamic activity of
- 111 -
the drug in the delivery vehicle, which ultimately leads to a decrease of the partition into the skin
and a decrease in drug permeation (Heuschkel et al., 2007; Date and Patravale, 2007).
In contrast, a kinetic study of ion transport across the water-oil interface in microemulsions
showed that the flux increases with increasing surfactant concentration (Steytler et al., 2001).
The author observed that the solute flux increased with increasing the surfactant concentration in
the microemulsion phase, up to a certain point where the flux reaches a plateau value. These
researchers propose that micelles or reverse micelles act as carriers of the solute from the bulk to
the interface, and that the more micelles the more carriers are available, but that there is a point
where the interfacial area for mass transfer is saturated by carriers (a phenomenon that can be
modeled using a Langmuir adsorption isotherm). Such dynamic model has been supported by the
results of Nitsch et al. (Nitsch et al., 1990).
The objective of this work is to investigate the relevance of surfactant concentration on the
transdermal flux and absorption in linker-based lecithin microemulsions, and elucidate the
apparently contradictory observations introduced above. These linker-based lecithin
microemulsions have been proven to be effective vehicles for transdermal delivery, featuring
high drug permeation, high skin absorption, and minimal cytotoxicity in Chapter 3 and 4. The
drug absorption/permeation parameters of interest in this Chapter include: drug solubilization
capacity, drug absorption in the skin, partition of the drug between skin and the microemulsions,
“skin” permeability, mass transfer constant between skin and the microemulsion, and overall
transdermal flux. The value of these parameters will be evaluated as a function of surfactant
concentration in Type I and Type II microemulsions.
Lidocaine, a lipophilic drug, was used as a model drug in this work. It is a common anesthetic
used in topical formulations and has been used as drug models by many groups (Sintov and
- 112 -
Shapiro 2004; Kreilgaard et al., 2000). The transdermal delivery of lidocaine is significantly
limited by its poor water solubility (4 mg/ml). Most of the existing lidocaine delivery systems in
the market place are emulsion-based, such as EMLA® cream. It has been shown that
microemulsion-based gels for lidocaine delivery tend to have a slightly longer lasting effect than
emulsion-based systems (Lee, 2003), and produce nearly 50% -100% larger fluxes of lidocaine
compared to EMLA® cream (Kreilgaard, 2002; Sintov and Shapiro, 2004). However the benefits
of potentially larger fluxes obtained with microemulsions do not compensate for the increase in
cytotoxic side effects related to the use of alcohols as cosurfactants (Changez et al, 2006;
Kreilgaard, 2002). Our developed lecithin-linker systems minimize these cytotoxic side effects
and yield higher lidocaine transdermal flux than a conventional alcohol-based microemulsion as
discussed in Chapter 3.
5.3 MATERIALS AND METHODS
5.3.1 Materials
5.3.1.1 Chemicals
The following chemicals were purchased from Sigma-Aldrich (St. Louis, MO, USA) at the
concentrations shown in parentheses, and were used as received: sorbitan monooleate (Span® 80,
99%+), sodium caprylate (99%+), caprylic acid (99%+), isopropyl myristate (IPM, 98%), Nile
Red (98%+), sodium chloride (99%+, Fluka brand), Dulbecco’s phosphate buffered saline (PBS),
lidocaine powder (base form, 98%+). Laboratory grade soybean lecithin (99%+) was purchased
from Fisher Scientific (Fairlawn, NJ, USA). Soybean lecithin is a mixture of phospholipids
(mainly phosphatidyl cholines) produced by acetone purification of soybean gum residues. The
fluorescent lecithin, 2-(12-(7-nitrobenz-2-oxa-1,3-diazol-4-yl)amino)dodecanoyl-1-
- 113 -
hexadecanoyl-sn-glycero-3-phosphocholine (NBD C12-C16-PC) was purchase from Invitrogen
(Carlsbad, California). Sodium phosphate monobasic, monohydrate (ACS grade) and acetonitrile
(HPLC grade) were purchased from EMD Chemicals Inc. (Darmstadt, Germany), and they were
used as received. Anhydrous ethyl alcohol and methanol were purchased from Commercial
Alcohols Inc. (Brampton, ON, Canada). Unless otherwise stated, the composition is expressed on
weight basis (i.e. wt. %) throughout this Chapter.
5.3.1.2 Skin
Pig ears were obtained from the local market and frozen overnight. Prior to use, they were
thawed by rinsing with running water for ten seconds at room temperature. The skin of the
external side of the ear was then dermatomed to a thickness that ranged from 700 to 900 μm
(Yuan et al., 2008; Bronaugh and Maibach, 1991). After that, the thin skin layer was cut in
circles of 11.4 mm diameter ready for use.
5.3.2 Microemulsion preparation and selection
5.3.2.1 Preparation
Different series of linker-based lecithin microemulsions from A to L with increasing lecithin
concentrations from 0% to 4% at intervals of 0.4%. Sorbitan monooleate to lecithin weight ratio
was kept 3:1, consistent with Chapter 3 and 4. For a given lecithin concentration (and therefore
sorbitan monooleate concentration), sodium caprylate scan was gradually increased from 0.5% to
7.0% to achieve a Type II-Type III/IV-Type I transition at constant temperature (22°C) and
electrolyte concentration (0.9% w/w NaCl) (Acosta et al., 2005). Details of this procedure are
described in Chapter 4. Lidocaine was loaded in the microemulsion formulations by
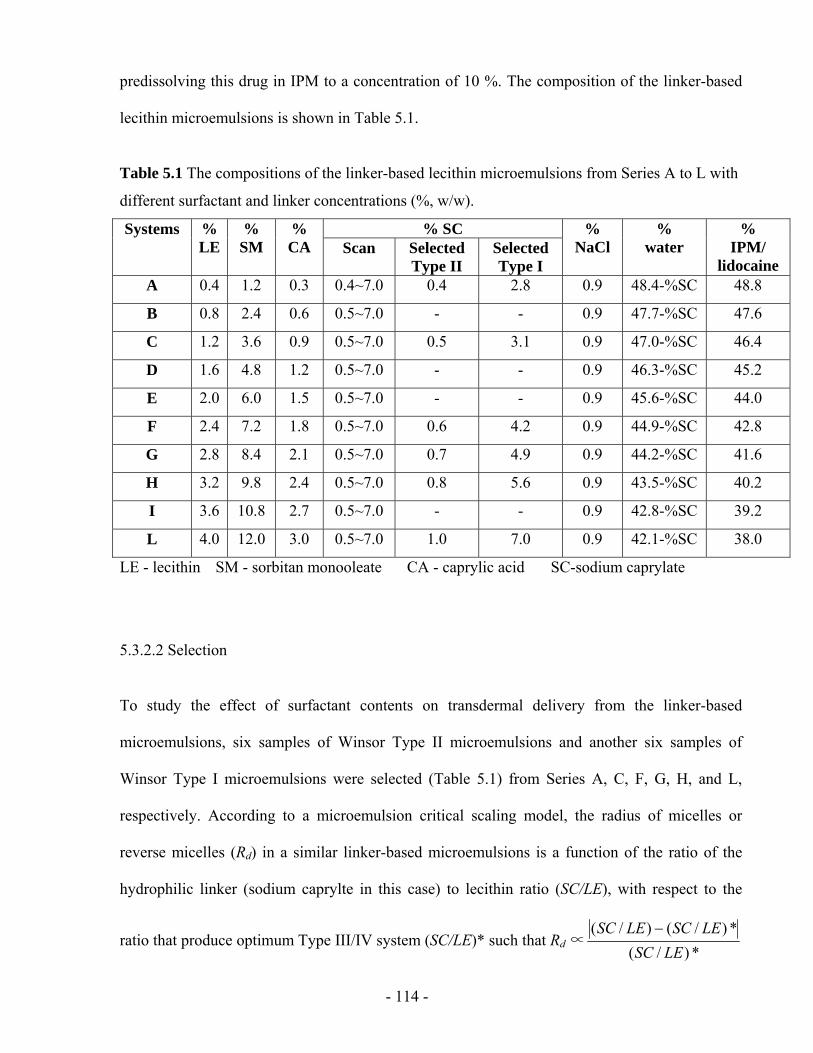
- 114 -
predissolving this drug in IPM to a concentration of 10 %. The composition of the linker-based
lecithin microemulsions is shown in Table 5.1.
Table 5.1 The compositions of the linker-based lecithin microemulsions from Series A to L with
different surfactant and linker concentrations (%, w/w).
% SC Systems % LE
% SM
% CA Scan Selected
Type II Selected Type I
% NaCl
% water
% IPM/
lidocaine A 0.4 1.2 0.3 0.4~7.0 0.4 2.8 0.9 48.4-%SC 48.8
B 0.8 2.4 0.6 0.5~7.0 - - 0.9 47.7-%SC 47.6
C 1.2 3.6 0.9 0.5~7.0 0.5 3.1 0.9 47.0-%SC 46.4
D 1.6 4.8 1.2 0.5~7.0 - - 0.9 46.3-%SC 45.2
E 2.0 6.0 1.5 0.5~7.0 - - 0.9 45.6-%SC 44.0
F 2.4 7.2 1.8 0.5~7.0 0.6 4.2 0.9 44.9-%SC 42.8
G 2.8 8.4 2.1 0.5~7.0 0.7 4.9 0.9 44.2-%SC 41.6
H 3.2 9.8 2.4 0.5~7.0 0.8 5.6 0.9 43.5-%SC 40.2
I 3.6 10.8 2.7 0.5~7.0 - - 0.9 42.8-%SC 39.2
L 4.0 12.0 3.0 0.5~7.0 1.0 7.0 0.9 42.1-%SC 38.0
LE - lecithin SM - sorbitan monooleate CA - caprylic acid SC-sodium caprylate
5.3.2.2 Selection
To study the effect of surfactant contents on transdermal delivery from the linker-based
microemulsions, six samples of Winsor Type II microemulsions and another six samples of
Winsor Type I microemulsions were selected (Table 5.1) from Series A, C, F, G, H, and L,
respectively. According to a microemulsion critical scaling model, the radius of micelles or
reverse micelles (Rd) in a similar linker-based microemulsions is a function of the ratio of the
hydrophilic linker (sodium caprylte in this case) to lecithin ratio (SC/LE), with respect to the
ratio that produce optimum Type III/IV system (SC/LE)* such that Rd ∝ *)/(*)/()/(
LESCLESCLESC −
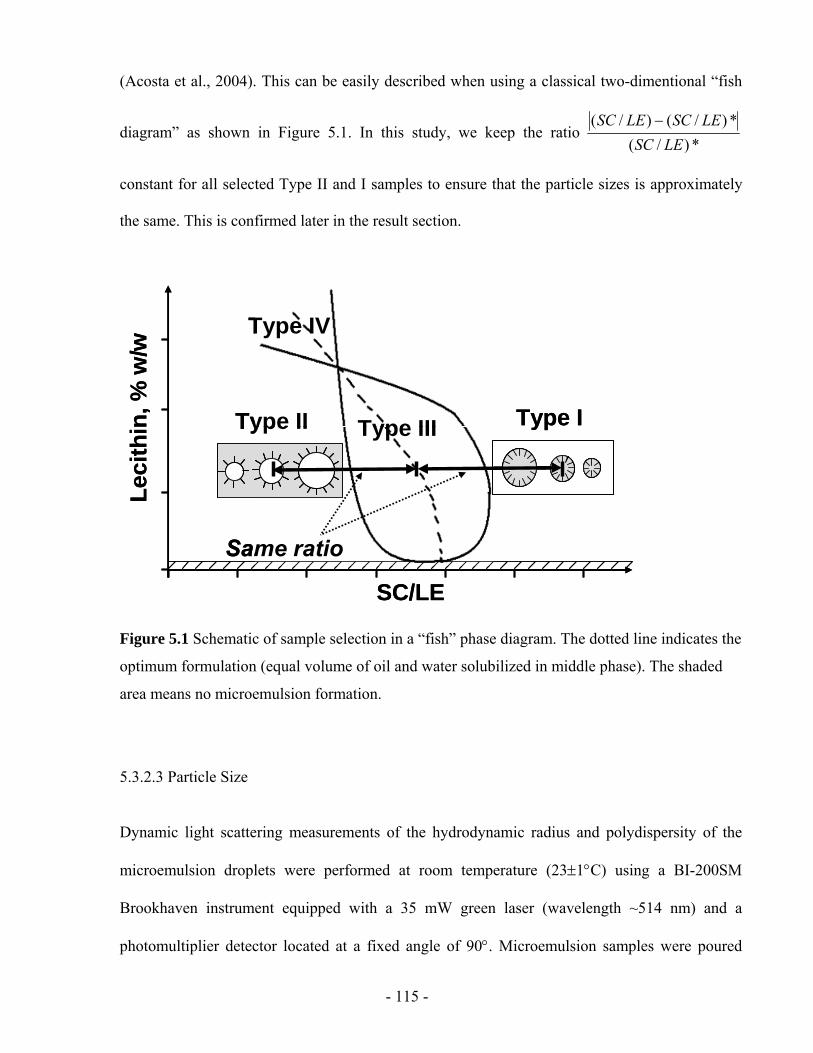
- 115 -
(Acosta et al., 2004). This can be easily described when using a classical two-dimentional “fish
diagram” as shown in Figure 5.1. In this study, we keep the ratio *)/(
*)/()/(LESC
LESCLESC −
constant for all selected Type II and I samples to ensure that the particle sizes is approximately
the same. This is confirmed later in the result section.
Type II Type IType III
Type IV
SC/LE
Leci
thin
, % w
/w
Same ratio
Type II Type IType III
Type IV
SC/LE
Leci
thin
, % w
/w
Same ratio
Figure 5.1 Schematic of sample selection in a “fish” phase diagram. The dotted line indicates the
optimum formulation (equal volume of oil and water solubilized in middle phase). The shaded
area means no microemulsion formation.
5.3.2.3 Particle Size
Dynamic light scattering measurements of the hydrodynamic radius and polydispersity of the
microemulsion droplets were performed at room temperature (23±1°C) using a BI-200SM
Brookhaven instrument equipped with a 35 mW green laser (wavelength ~514 nm) and a
photomultiplier detector located at a fixed angle of 90°. Microemulsion samples were poured
- 116 -
into standard glass curettes that were placed in the BI-200SM sample holder at least 10 minutes
before measurement. Refractive indexes for the continuous phase were obtained from the
literature (Lide, 2006).
5.3.3 In vitro permeation studies
The transdermal flux and “skin” permeability of the drug from test formulations were measured
in vitro using pig ear skin (Yuan et al., 2008). All permeation experiments were performed
according to the MatTek standard percutaneous absorption protocol. Briefly, the skin piece was
placed in a MatTek Permeation Device (MPD), with the epidermis facing up. The microemulsion
formulation (0.4 ml) was applied in the donor compartment. The receptor compartment was
filled with 5 ml of PBS (0.01M phosphate, 0.137M NaCl, pH 7.4). At predetermined times (0.5 h,
1.5 h, 2.5 h, 3.5 h, 4.5 h and 5.5 h), the receiver solution was withdrawn completely and
immediately replaced by fresh PBS solution. At 5.5 h, the experiment was terminated. All
permeation experiments were conducted in triplicate at room temperature. The pig skin
remaining after the permeation study was used to test the lidocaine absorbed into the skin.
The cumulative mass of lidocaine (μg) permeated across the skin was plotted as a function of
time (h), and the average steady-state flux (Fss, μg/h/cm2) was calculated by dividing the slope of
the linear part of the curve (dm/dt) by the area of the exposed skin surface (A).
dtdm
AFss ×=
1 (Equation 5.1)
- 117 -
5.3.3.1 Determination of skin absorption
The amount of lidocaine retained in the skin was determined at the end of the in vitro permeation
studies (5.5 h). Prior to measuring the absorbed lidocaine, the pig skin was rinsed with PBS
solution and placed into 2 ml methanol for overnight extraction of lidocaine (Yuan and Acosta,
2009). The resulting solution was analyzed by HPLC. The equivalent lidocaine concentration
absorbed in skin (Cs_ss) was calculated as the mass of lidocaine extracted from the skin divided
by the volume of the skin (exposed area×thickness), and is expressed in mg/ml. We have
determined, using a mass balance closure in selected samples, that the efficiency of this methanol
extraction procedure is more than 95%.
5.3.3.2 Lidocaine quantification
The concentration of lidocaine in the microemulsions, receiver solutions and skin was analyzed
using a Dionex ICS-3000 (Sunnyvale, CA, USA) liquid chromatography system consisting of
single pump, detector, AS40 automated sampler, AD25 absorbance detector and Chromeleon
chromatography software (Dionex) (Yuan and Acosta, 2009). Lidocaine was separated by a
reverse phase column (Genesis, C18, 4 μm, 150×4.6 mm) and detected through its absorbance at
230 nm (AD25 detector). A mixture of acetonitrile and 0.05 M NaH2PO4·H2O (pH 2.0) solution
(30:70, v/v) was used as the mobile phase with a flow rate at 1.0 ml/min. The column
temperature and the injection volume were 25°C and 10µl, respectively.
- 118 -
5.3.3.3 Statistical data analysis
All permeation values were calculated from three independent experiments, and data are
expressed as the mean value ± S.D. The statistical analysis of Cd, Cs, Kds, ksr, kds and J was
performed using a one-way analysis of variance (ANOVA) to test the difference between the
means of two or more delivery systems. Data with P<0.05 are considered statistically significant.
5.3.4 Fluorescence Microscopy
To visualize the penetration of hydrophobic and hydrophilic solutes as well as the penetration of
lecithin into the skin in microemulsions, various fluorescence probes were dissolved in the Type
II formulation of system L of Table 5.1 (4%LE, 1% SC). A red-fluorescing probe, Nile Red
(0.001%) was used as a surrogate for hydrophobic actives. A green-fluorescing probe, NBD C12-
C16-PC (0.01%) was used as a surrogate to trace the penetration of lecithin. The systems were
vortexed and left to equilibrate overnight. The microemulsions containing each fluorescence
probe were used to conduct in vitro extended release studies. After 1 hour, the skin samples were
taken off the permeation device, blotted dry with Kimwipes, and then rinsed twice with PBS.
The clean skin samples were snap frozen using dry ice and were cross sectioned to 30 μm thick
slices by a cryostat microtome (Leica Jung CM3000, Bensheim, Germany). The skin slices were
observed and photographed with a Leica MZFIII fluorescence stereomicroscope (Leica,
Heerbrugg, Switzerland) equipped with a Leica DFC 320 Digital Camera (Leica, Heerbrugg,
Switzerland). Sections were photographed using a red filter (λexc= 450-500 nm) suitable for
these fluorescence probes. All photographs were taken with 63x objectives and exposure time
2.0 sec. Solutions of 0.001% Nile red in IPM was considered as the “hydrophobic” control. The
penetration of each dye into the skin was assessed using image analysis (histogram tool of Corel
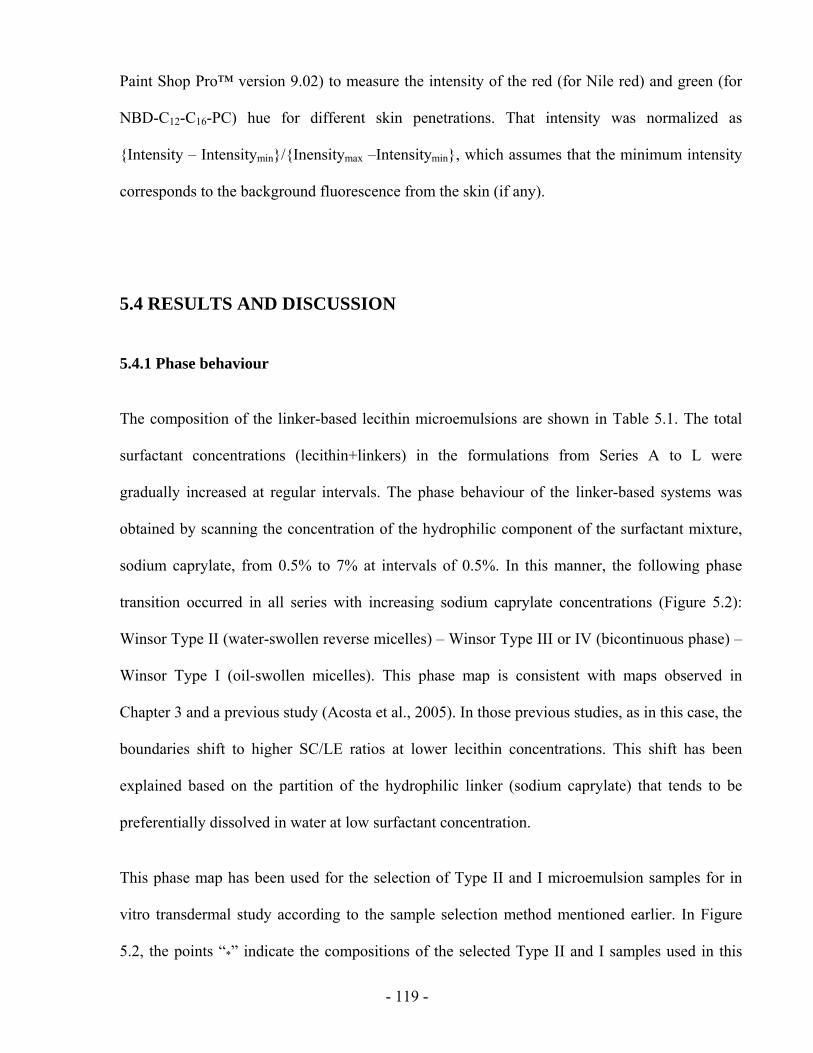
- 119 -
Paint Shop Pro™ version 9.02) to measure the intensity of the red (for Nile red) and green (for
NBD-C12-C16-PC) hue for different skin penetrations. That intensity was normalized as
{Intensity – Intensitymin}/{Inensitymax –Intensitymin}, which assumes that the minimum intensity
corresponds to the background fluorescence from the skin (if any).
5.4 RESULTS AND DISCUSSION
5.4.1 Phase behaviour
The composition of the linker-based lecithin microemulsions are shown in Table 5.1. The total
surfactant concentrations (lecithin+linkers) in the formulations from Series A to L were
gradually increased at regular intervals. The phase behaviour of the linker-based systems was
obtained by scanning the concentration of the hydrophilic component of the surfactant mixture,
sodium caprylate, from 0.5% to 7% at intervals of 0.5%. In this manner, the following phase
transition occurred in all series with increasing sodium caprylate concentrations (Figure 5.2):
Winsor Type II (water-swollen reverse micelles) – Winsor Type III or IV (bicontinuous phase) –
Winsor Type I (oil-swollen micelles). This phase map is consistent with maps observed in
Chapter 3 and a previous study (Acosta et al., 2005). In those previous studies, as in this case, the
boundaries shift to higher SC/LE ratios at lower lecithin concentrations. This shift has been
explained based on the partition of the hydrophilic linker (sodium caprylate) that tends to be
preferentially dissolved in water at low surfactant concentration.
This phase map has been used for the selection of Type II and I microemulsion samples for in
vitro transdermal study according to the sample selection method mentioned earlier. In Figure
5.2, the points “*” indicate the compositions of the selected Type II and I samples used in this
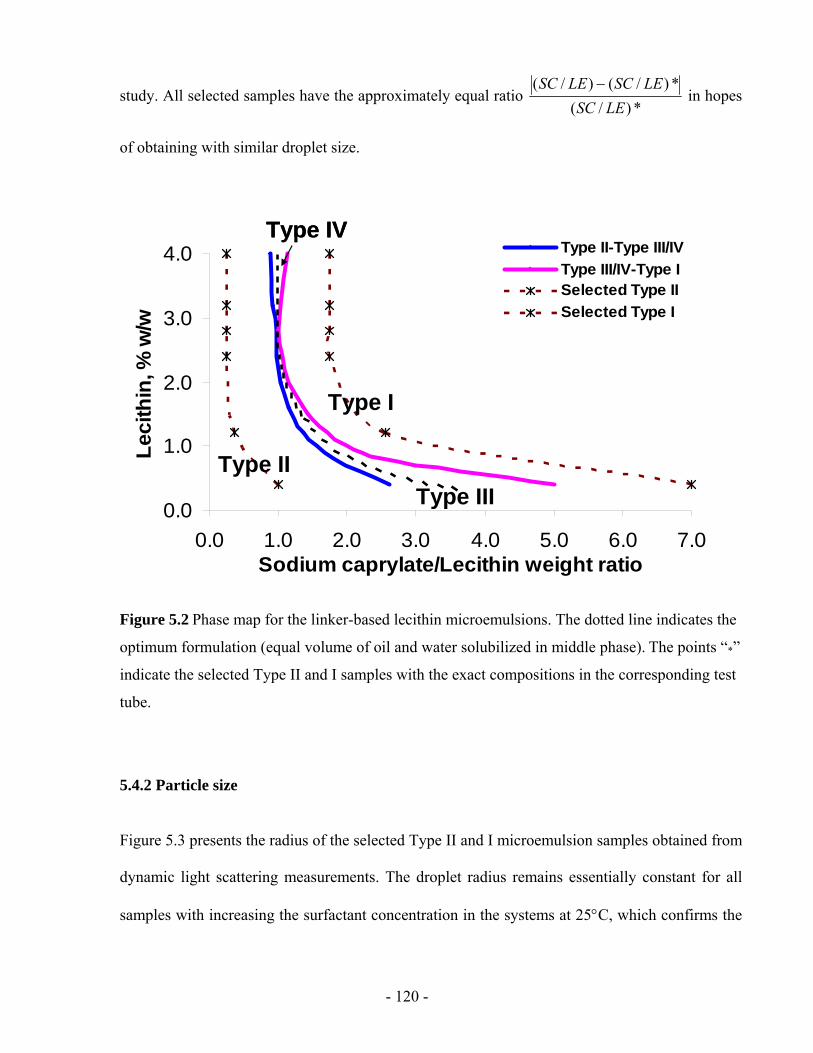
- 120 -
study. All selected samples have the approximately equal ratio *)/(
*)/()/(LESC
LESCLESC − in hopes
of obtaining with similar droplet size.
0.0
1.0
2.0
3.0
4.0
0.0 1.0 2.0 3.0 4.0 5.0 6.0 7.0Sodium caprylate/Lecithin weight ratio
Leci
thin
, % w
/w
Type II-Type III/IVType III/IV-Type ISelected Type IISelected Type I
Type II
Type I
Type III
Type IV
0.0
1.0
2.0
3.0
4.0
0.0 1.0 2.0 3.0 4.0 5.0 6.0 7.0Sodium caprylate/Lecithin weight ratio
Leci
thin
, % w
/w
Type II-Type III/IVType III/IV-Type ISelected Type IISelected Type I
Type II
Type I
Type III
Type IV
Figure 5.2 Phase map for the linker-based lecithin microemulsions. The dotted line indicates the
optimum formulation (equal volume of oil and water solubilized in middle phase). The points “*”
indicate the selected Type II and I samples with the exact compositions in the corresponding test
tube.
5.4.2 Particle size
Figure 5.3 presents the radius of the selected Type II and I microemulsion samples obtained from
dynamic light scattering measurements. The droplet radius remains essentially constant for all
samples with increasing the surfactant concentration in the systems at 25°C, which confirms the
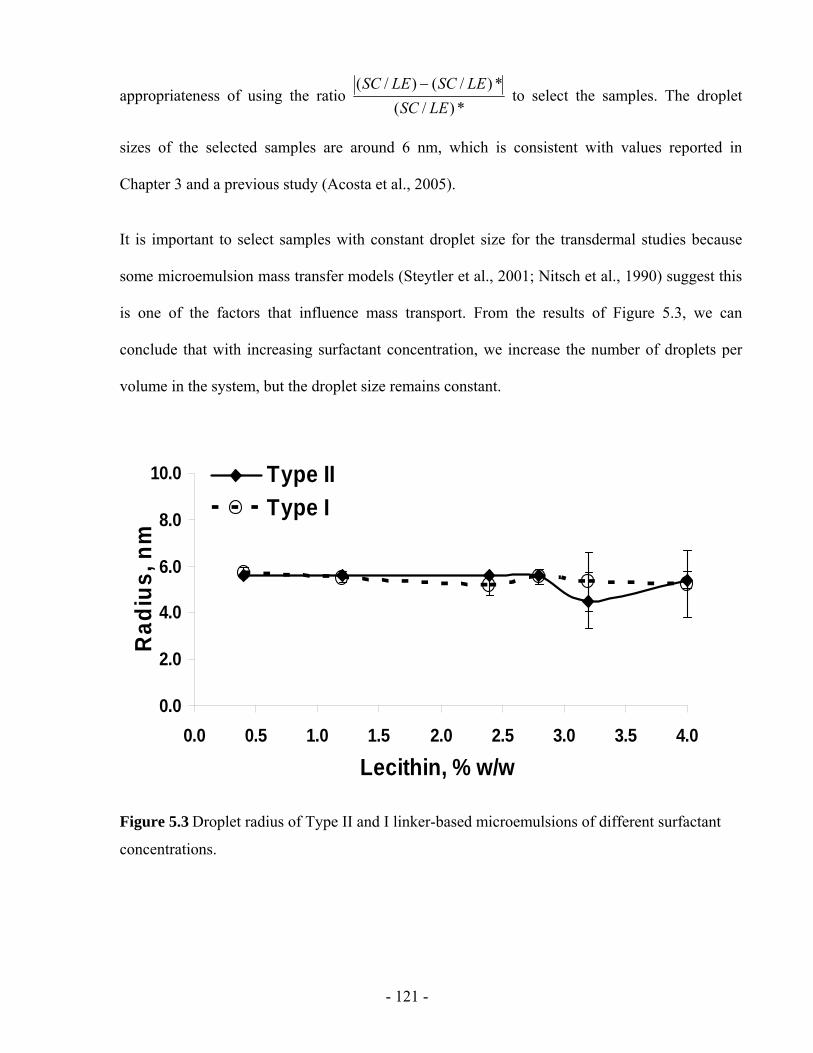
- 121 -
appropriateness of using the ratio *)/(
*)/()/(LESC
LESCLESC − to select the samples. The droplet
sizes of the selected samples are around 6 nm, which is consistent with values reported in
Chapter 3 and a previous study (Acosta et al., 2005).
It is important to select samples with constant droplet size for the transdermal studies because
some microemulsion mass transfer models (Steytler et al., 2001; Nitsch et al., 1990) suggest this
is one of the factors that influence mass transport. From the results of Figure 5.3, we can
conclude that with increasing surfactant concentration, we increase the number of droplets per
volume in the system, but the droplet size remains constant.
0.0
2.0
4.0
6.0
8.0
10.0
0.0 0.5 1.0 1.5 2.0 2.5 3.0 3.5 4.0
Lecithin, % w/w
Rad
ius,
nm
Type IIType I
Figure 5.3 Droplet radius of Type II and I linker-based microemulsions of different surfactant
concentrations.
- 122 -
5.4.3 Effect of surfactant on drug partitioning into microemulsions
After the studied microemulsions were prepared and reached equilibrium, the drug, lidocaine,
partitioned into the microemulsion and the excess phases. The lidocaine concentration in the
microemulsion samples (Cd, these samples are used as donor solutions) is shown in Figure 5.4.
Saturated lidocaine in water (4.0 mg/ml lidocaine) and 10% lidocaine in IPM (80.1 mg/ml
lidocaine) were used as controls of surfactant-free formulations (0% lecithin) for the Type I and
II samples, respectively. In general, the increasing surfactant concentration in microemulsions
increases the load capacity of the dispersed phase in both Type II and I systems.
0102030405060708090
0.0 0.5 1.0 1.5 2.0 2.5 3.0 3.5 4.0Lecithin, % w/w
Lido
cain
e, m
g/m
l
Type IIType IIPMH2O
Figure 5.4 Lidocaine concentration in Type II and I linker-based microemulsions of different
surfactant concentrations.
For Type I systems, the concentration of lidocaine in the microemulsion increases with
increasing surfactant concentration. Type I systems consist of oil-swollen micelles in a
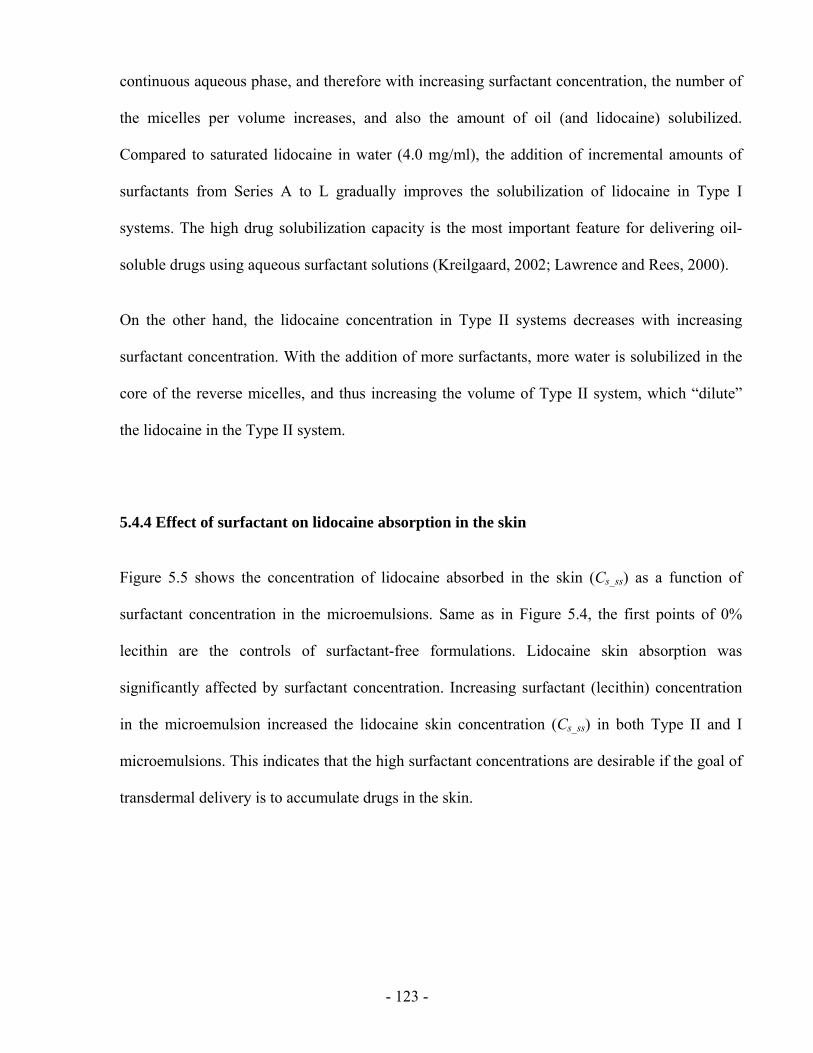
- 123 -
continuous aqueous phase, and therefore with increasing surfactant concentration, the number of
the micelles per volume increases, and also the amount of oil (and lidocaine) solubilized.
Compared to saturated lidocaine in water (4.0 mg/ml), the addition of incremental amounts of
surfactants from Series A to L gradually improves the solubilization of lidocaine in Type I
systems. The high drug solubilization capacity is the most important feature for delivering oil-
soluble drugs using aqueous surfactant solutions (Kreilgaard, 2002; Lawrence and Rees, 2000).
On the other hand, the lidocaine concentration in Type II systems decreases with increasing
surfactant concentration. With the addition of more surfactants, more water is solubilized in the
core of the reverse micelles, and thus increasing the volume of Type II system, which “dilute”
the lidocaine in the Type II system.
5.4.4 Effect of surfactant on lidocaine absorption in the skin
Figure 5.5 shows the concentration of lidocaine absorbed in the skin (Cs_ss) as a function of
surfactant concentration in the microemulsions. Same as in Figure 5.4, the first points of 0%
lecithin are the controls of surfactant-free formulations. Lidocaine skin absorption was
significantly affected by surfactant concentration. Increasing surfactant (lecithin) concentration
in the microemulsion increased the lidocaine skin concentration (Cs_ss) in both Type II and I
microemulsions. This indicates that the high surfactant concentrations are desirable if the goal of
transdermal delivery is to accumulate drugs in the skin.
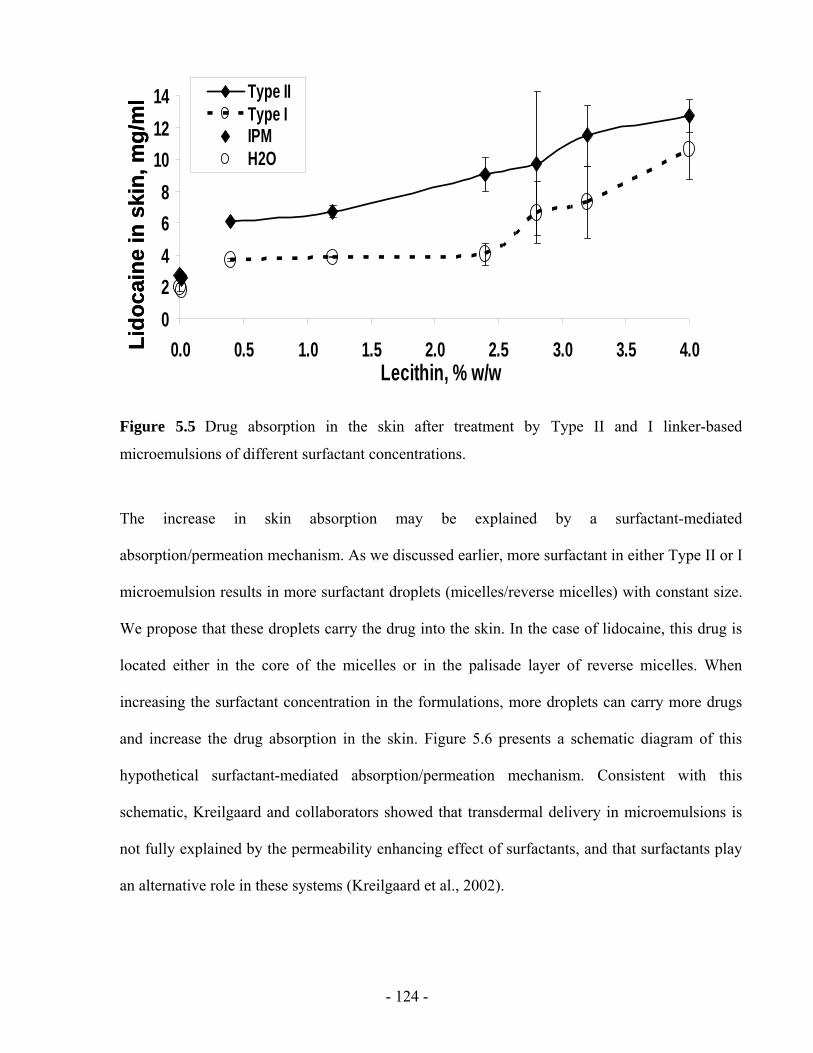
- 124 -
02468
101214
0.0 0.5 1.0 1.5 2.0 2.5 3.0 3.5 4.0Lecithin, % w/w
Type IIType IIPMH2O
Lido
cain
e in
ski
n, m
g/m
l
02468
101214
0.0 0.5 1.0 1.5 2.0 2.5 3.0 3.5 4.0Lecithin, % w/w
Type IIType IIPMH2O
Lido
cain
e in
ski
n, m
g/m
l
Figure 5.5 Drug absorption in the skin after treatment by Type II and I linker-based
microemulsions of different surfactant concentrations.
The increase in skin absorption may be explained by a surfactant-mediated
absorption/permeation mechanism. As we discussed earlier, more surfactant in either Type II or I
microemulsion results in more surfactant droplets (micelles/reverse micelles) with constant size.
We propose that these droplets carry the drug into the skin. In the case of lidocaine, this drug is
located either in the core of the micelles or in the palisade layer of reverse micelles. When
increasing the surfactant concentration in the formulations, more droplets can carry more drugs
and increase the drug absorption in the skin. Figure 5.6 presents a schematic diagram of this
hypothetical surfactant-mediated absorption/permeation mechanism. Consistent with this
schematic, Kreilgaard and collaborators showed that transdermal delivery in microemulsions is
not fully explained by the permeability enhancing effect of surfactants, and that surfactants play
an alternative role in these systems (Kreilgaard et al., 2002).
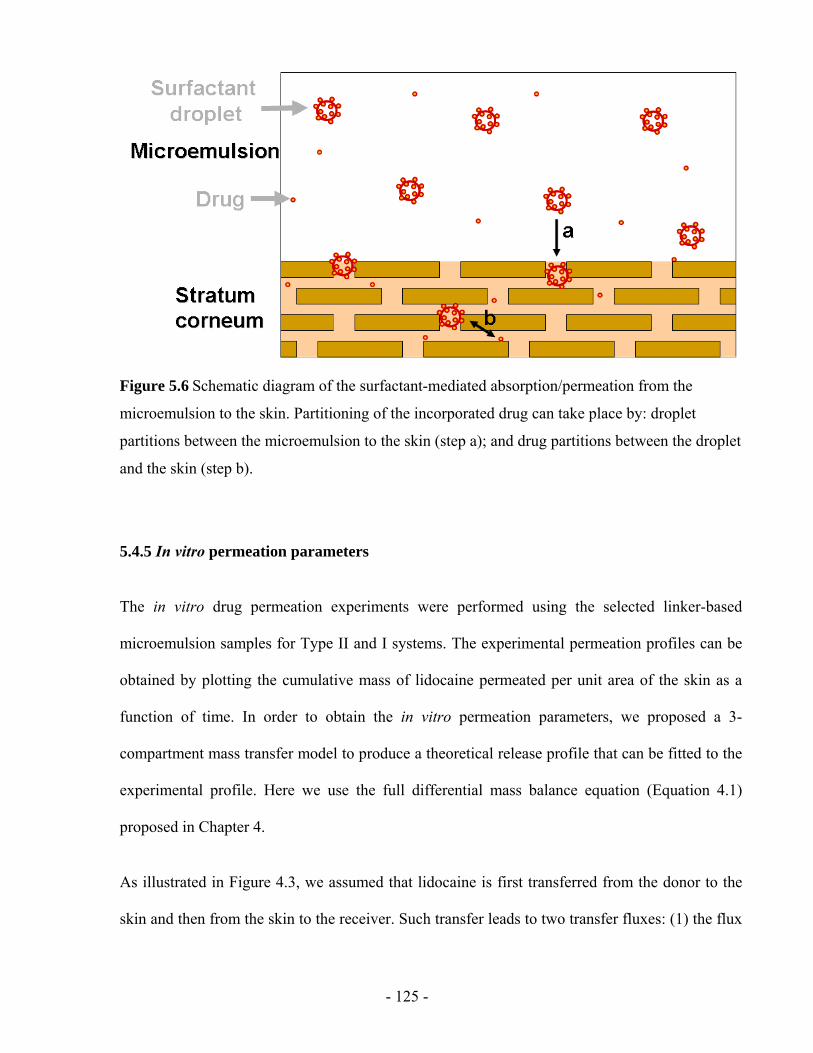
- 125 -
Figure 5.6 Schematic diagram of the surfactant-mediated absorption/permeation from the
microemulsion to the skin. Partitioning of the incorporated drug can take place by: droplet
partitions between the microemulsion to the skin (step a); and drug partitions between the droplet
and the skin (step b).
5.4.5 In vitro permeation parameters
The in vitro drug permeation experiments were performed using the selected linker-based
microemulsion samples for Type II and I systems. The experimental permeation profiles can be
obtained by plotting the cumulative mass of lidocaine permeated per unit area of the skin as a
function of time. In order to obtain the in vitro permeation parameters, we proposed a 3-
compartment mass transfer model to produce a theoretical release profile that can be fitted to the
experimental profile. Here we use the full differential mass balance equation (Equation 4.1)
proposed in Chapter 4.
As illustrated in Figure 4.3, we assumed that lidocaine is first transferred from the donor to the
skin and then from the skin to the receiver. Such transfer leads to two transfer fluxes: (1) the flux
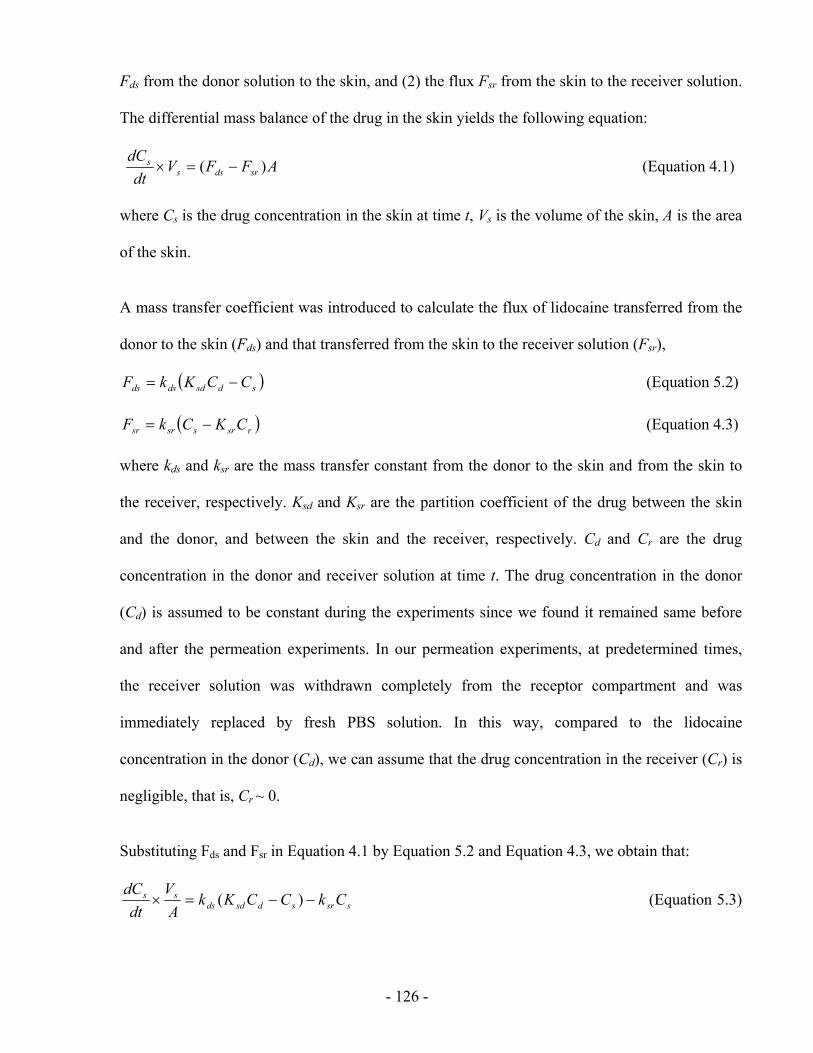
- 126 -
Fds from the donor solution to the skin, and (2) the flux Fsr from the skin to the receiver solution.
The differential mass balance of the drug in the skin yields the following equation:
AFFVdt
dCsrdss
s )( −=× (Equation 4.1)
where Cs is the drug concentration in the skin at time t, Vs is the volume of the skin, A is the area
of the skin.
A mass transfer coefficient was introduced to calculate the flux of lidocaine transferred from the
donor to the skin (Fds) and that transferred from the skin to the receiver solution (Fsr),
( )sdsddsds CCKkF −= (Equation 5.2)
( )rsrssrsr CKCkF −= (Equation 4.3)
where kds and ksr are the mass transfer constant from the donor to the skin and from the skin to
the receiver, respectively. Ksd and Ksr are the partition coefficient of the drug between the skin
and the donor, and between the skin and the receiver, respectively. Cd and Cr are the drug
concentration in the donor and receiver solution at time t. The drug concentration in the donor
(Cd) is assumed to be constant during the experiments since we found it remained same before
and after the permeation experiments. In our permeation experiments, at predetermined times,
the receiver solution was withdrawn completely from the receptor compartment and was
immediately replaced by fresh PBS solution. In this way, compared to the lidocaine
concentration in the donor (Cd), we can assume that the drug concentration in the receiver (Cr) is
negligible, that is, Cr ~ 0.
Substituting Fds and Fsr in Equation 4.1 by Equation 5.2 and Equation 4.3, we obtain that:
ssrsdsddsss CkCCKk
AV
dtdC
−−=× )( (Equation 5.3)
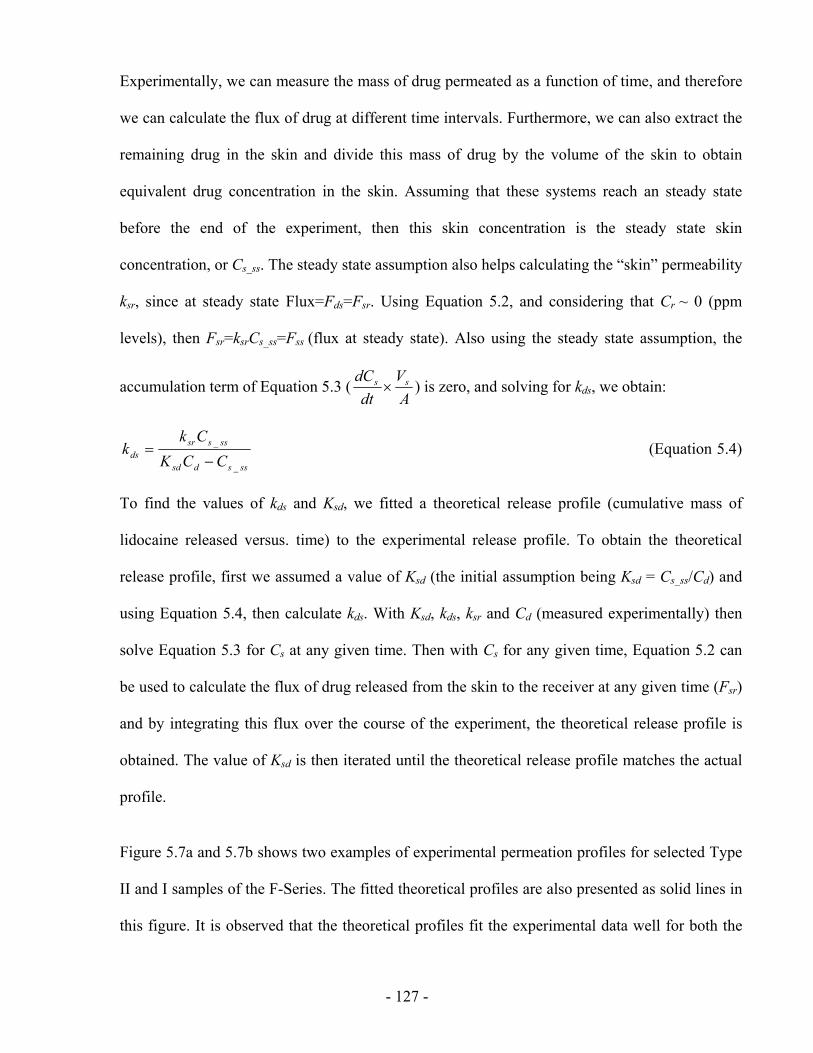
- 127 -
Experimentally, we can measure the mass of drug permeated as a function of time, and therefore
we can calculate the flux of drug at different time intervals. Furthermore, we can also extract the
remaining drug in the skin and divide this mass of drug by the volume of the skin to obtain
equivalent drug concentration in the skin. Assuming that these systems reach an steady state
before the end of the experiment, then this skin concentration is the steady state skin
concentration, or Cs_ss. The steady state assumption also helps calculating the “skin” permeability
ksr, since at steady state Flux=Fds=Fsr. Using Equation 5.2, and considering that Cr ~ 0 (ppm
levels), then Fsr=ksrCs_ss=Fss (flux at steady state). Also using the steady state assumption, the
accumulation term of Equation 5.3 (A
Vdt
dC ss × ) is zero, and solving for kds, we obtain:
sssdsd
ssssrds CCK
Ckk
_
_
−= (Equation 5.4)
To find the values of kds and Ksd, we fitted a theoretical release profile (cumulative mass of
lidocaine released versus. time) to the experimental release profile. To obtain the theoretical
release profile, first we assumed a value of Ksd (the initial assumption being Ksd = Cs_ss/Cd) and
using Equation 5.4, then calculate kds. With Ksd, kds, ksr and Cd (measured experimentally) then
solve Equation 5.3 for Cs at any given time. Then with Cs for any given time, Equation 5.2 can
be used to calculate the flux of drug released from the skin to the receiver at any given time (Fsr)
and by integrating this flux over the course of the experiment, the theoretical release profile is
obtained. The value of Ksd is then iterated until the theoretical release profile matches the actual
profile.
Figure 5.7a and 5.7b shows two examples of experimental permeation profiles for selected Type
II and I samples of the F-Series. The fitted theoretical profiles are also presented as solid lines in
this figure. It is observed that the theoretical profiles fit the experimental data well for both the
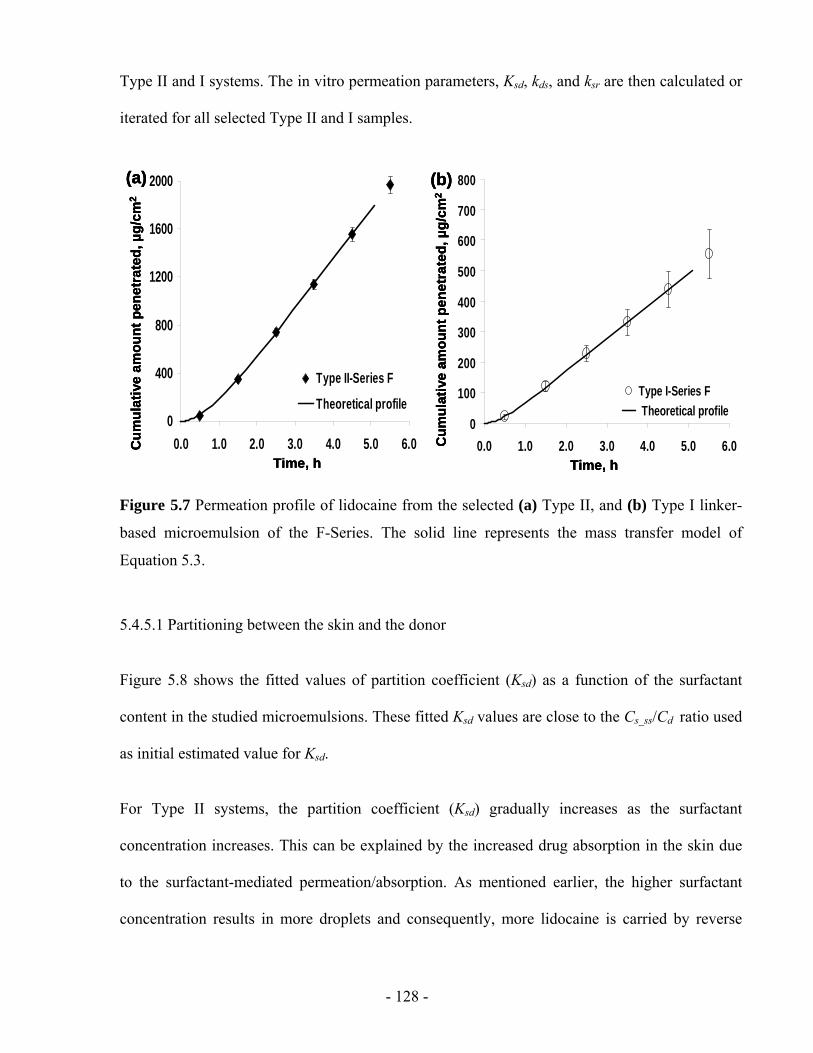
- 128 -
Type II and I systems. The in vitro permeation parameters, Ksd, kds, and ksr are then calculated or
iterated for all selected Type II and I samples.
0
400
800
1200
1600
2000
0.0 1.0 2.0 3.0 4.0 5.0 6.0
Type II-Series F
Theoretical profile
Time, h
Cum
ulat
ive
amou
nt p
enet
rate
d, µ
g/cm
2
(a)
Time, h
Cum
ulat
ive
amou
nt p
enet
rate
d, µ
g/cm
2
(b)
0
100
200
300
400
500
600
700
800
0.0 1.0 2.0 3.0 4.0 5.0 6.0
Type I-Series F Theoretical profile
0
400
800
1200
1600
2000
0.0 1.0 2.0 3.0 4.0 5.0 6.0
Type II-Series F
Theoretical profile
Time, h
Cum
ulat
ive
amou
nt p
enet
rate
d, µ
g/cm
2
(a)
0
400
800
1200
1600
2000
0.0 1.0 2.0 3.0 4.0 5.0 6.0
Type II-Series F
Theoretical profile
Time, h
Cum
ulat
ive
amou
nt p
enet
rate
d, µ
g/cm
2
(a)
Time, h
Cum
ulat
ive
amou
nt p
enet
rate
d, µ
g/cm
2
(b)
0
100
200
300
400
500
600
700
800
0.0 1.0 2.0 3.0 4.0 5.0 6.0
Type I-Series F Theoretical profile
Time, h
Cum
ulat
ive
amou
nt p
enet
rate
d, µ
g/cm
2
(b)
0
100
200
300
400
500
600
700
800
0.0 1.0 2.0 3.0 4.0 5.0 6.0
Type I-Series F Theoretical profile
Figure 5.7 Permeation profile of lidocaine from the selected (a) Type II, and (b) Type I linker-
based microemulsion of the F-Series. The solid line represents the mass transfer model of
Equation 5.3.
5.4.5.1 Partitioning between the skin and the donor
Figure 5.8 shows the fitted values of partition coefficient (Ksd) as a function of the surfactant
content in the studied microemulsions. These fitted Ksd values are close to the Cs_ss/Cd ratio used
as initial estimated value for Ksd.
For Type II systems, the partition coefficient (Ksd) gradually increases as the surfactant
concentration increases. This can be explained by the increased drug absorption in the skin due
to the surfactant-mediated permeation/absorption. As mentioned earlier, the higher surfactant
concentration results in more droplets and consequently, more lidocaine is carried by reverse
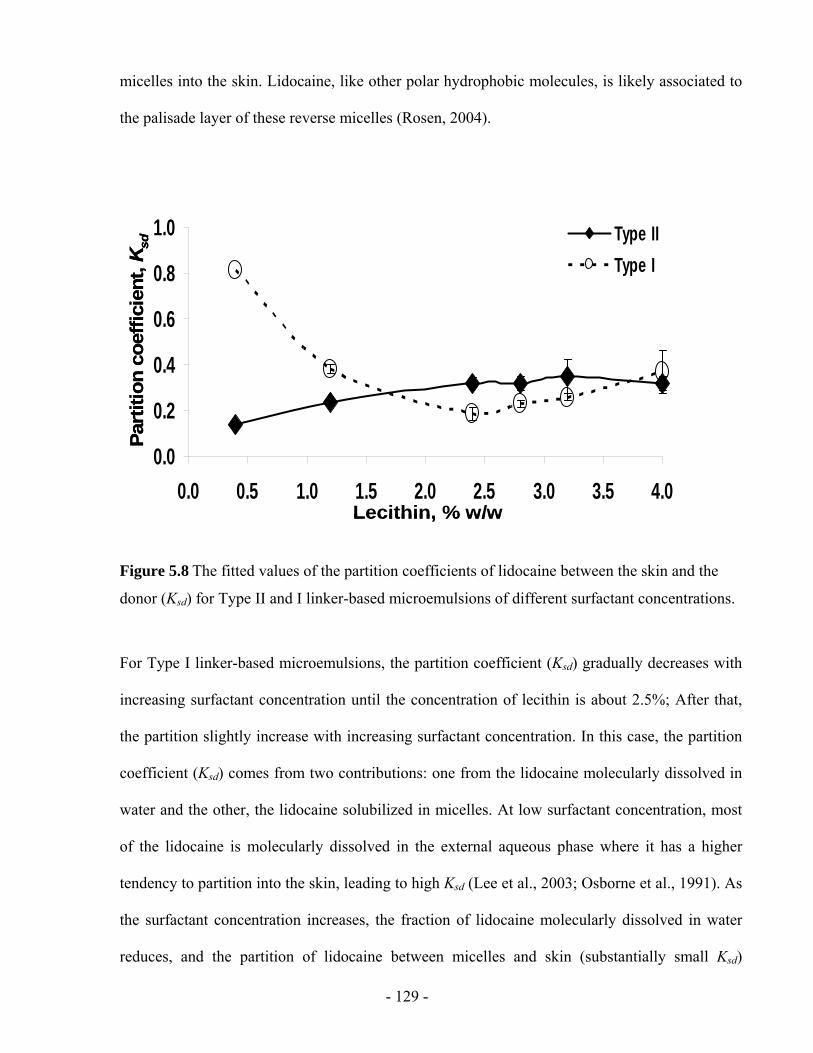
- 129 -
micelles into the skin. Lidocaine, like other polar hydrophobic molecules, is likely associated to
the palisade layer of these reverse micelles (Rosen, 2004).
0.0
0.2
0.4
0.6
0.8
1.0
0.0 0.5 1.0 1.5 2.0 2.5 3.0 3.5 4.0
Type IIType I
Part
ition
coe
ffici
ent,
Ksd
Lecithin, % w/w
0.0
0.2
0.4
0.6
0.8
1.0
0.0 0.5 1.0 1.5 2.0 2.5 3.0 3.5 4.0
Type IIType I
Part
ition
coe
ffici
ent,
Ksd
Lecithin, % w/w
Figure 5.8 The fitted values of the partition coefficients of lidocaine between the skin and the
donor (Ksd) for Type II and I linker-based microemulsions of different surfactant concentrations.
For Type I linker-based microemulsions, the partition coefficient (Ksd) gradually decreases with
increasing surfactant concentration until the concentration of lecithin is about 2.5%; After that,
the partition slightly increase with increasing surfactant concentration. In this case, the partition
coefficient (Ksd) comes from two contributions: one from the lidocaine molecularly dissolved in
water and the other, the lidocaine solubilized in micelles. At low surfactant concentration, most
of the lidocaine is molecularly dissolved in the external aqueous phase where it has a higher
tendency to partition into the skin, leading to high Ksd (Lee et al., 2003; Osborne et al., 1991). As
the surfactant concentration increases, the fraction of lidocaine molecularly dissolved in water
reduces, and the partition of lidocaine between micelles and skin (substantially small Ksd)
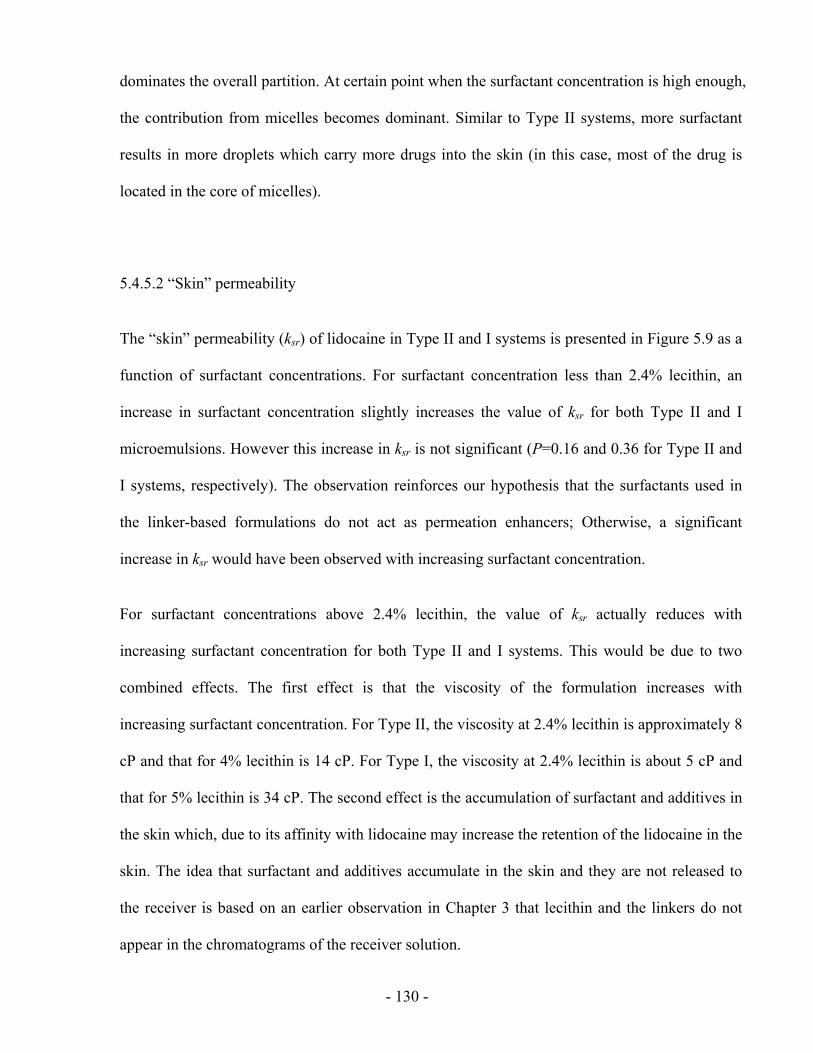
- 130 -
dominates the overall partition. At certain point when the surfactant concentration is high enough,
the contribution from micelles becomes dominant. Similar to Type II systems, more surfactant
results in more droplets which carry more drugs into the skin (in this case, most of the drug is
located in the core of micelles).
5.4.5.2 “Skin” permeability
The “skin” permeability (ksr) of lidocaine in Type II and I systems is presented in Figure 5.9 as a
function of surfactant concentrations. For surfactant concentration less than 2.4% lecithin, an
increase in surfactant concentration slightly increases the value of ksr for both Type II and I
microemulsions. However this increase in ksr is not significant (P=0.16 and 0.36 for Type II and
I systems, respectively). The observation reinforces our hypothesis that the surfactants used in
the linker-based formulations do not act as permeation enhancers; Otherwise, a significant
increase in ksr would have been observed with increasing surfactant concentration.
For surfactant concentrations above 2.4% lecithin, the value of ksr actually reduces with
increasing surfactant concentration for both Type II and I systems. This would be due to two
combined effects. The first effect is that the viscosity of the formulation increases with
increasing surfactant concentration. For Type II, the viscosity at 2.4% lecithin is approximately 8
cP and that for 4% lecithin is 14 cP. For Type I, the viscosity at 2.4% lecithin is about 5 cP and
that for 5% lecithin is 34 cP. The second effect is the accumulation of surfactant and additives in
the skin which, due to its affinity with lidocaine may increase the retention of the lidocaine in the
skin. The idea that surfactant and additives accumulate in the skin and they are not released to
the receiver is based on an earlier observation in Chapter 3 that lecithin and the linkers do not
appear in the chromatograms of the receiver solution.
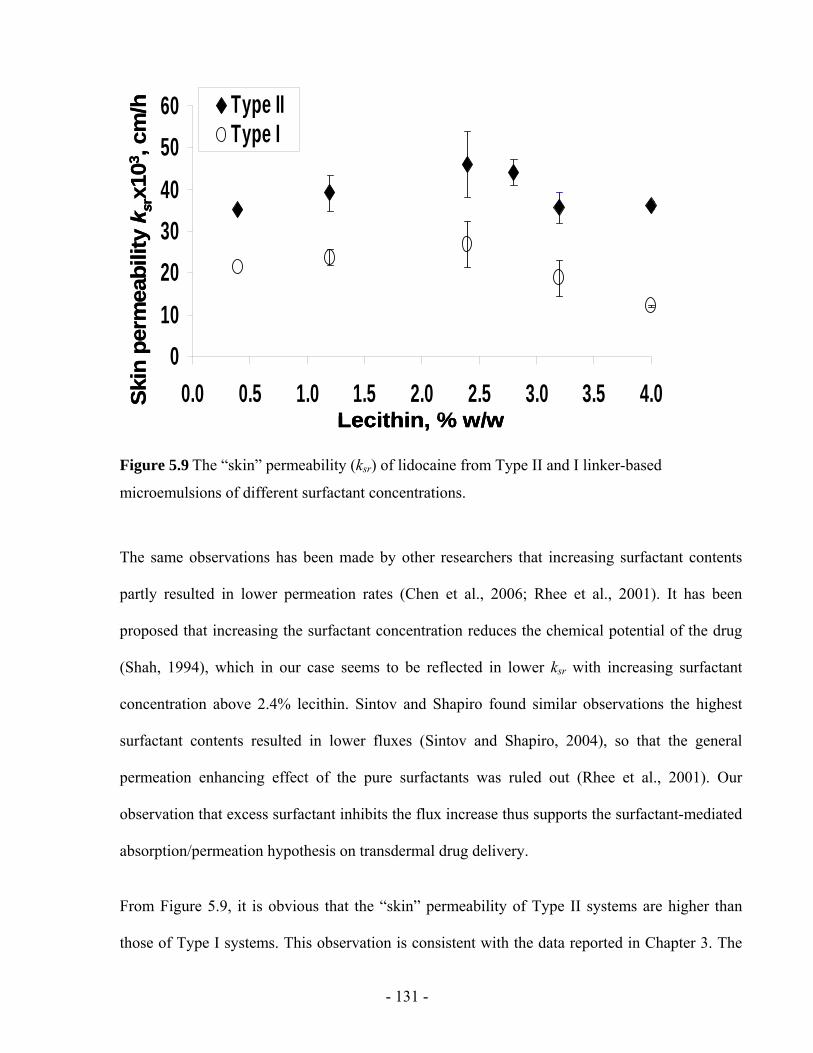
- 131 -
0102030405060
0.0 0.5 1.0 1.5 2.0 2.5 3.0 3.5 4.0
Type IIType I
Lecithin, % w/w
Skin
per
mea
bilit
y k s
rx10
3 , cm
/h
0102030405060
0.0 0.5 1.0 1.5 2.0 2.5 3.0 3.5 4.0
Type IIType I
Lecithin, % w/w
0102030405060
0.0 0.5 1.0 1.5 2.0 2.5 3.0 3.5 4.0
Type IIType I
Lecithin, % w/w
Skin
per
mea
bilit
y k s
rx10
3 , cm
/h
Figure 5.9 The “skin” permeability (ksr) of lidocaine from Type II and I linker-based
microemulsions of different surfactant concentrations.
The same observations has been made by other researchers that increasing surfactant contents
partly resulted in lower permeation rates (Chen et al., 2006; Rhee et al., 2001). It has been
proposed that increasing the surfactant concentration reduces the chemical potential of the drug
(Shah, 1994), which in our case seems to be reflected in lower ksr with increasing surfactant
concentration above 2.4% lecithin. Sintov and Shapiro found similar observations the highest
surfactant contents resulted in lower fluxes (Sintov and Shapiro, 2004), so that the general
permeation enhancing effect of the pure surfactants was ruled out (Rhee et al., 2001). Our
observation that excess surfactant inhibits the flux increase thus supports the surfactant-mediated
absorption/permeation hypothesis on transdermal drug delivery.
From Figure 5.9, it is obvious that the “skin” permeability of Type II systems are higher than
those of Type I systems. This observation is consistent with the data reported in Chapter 3. The
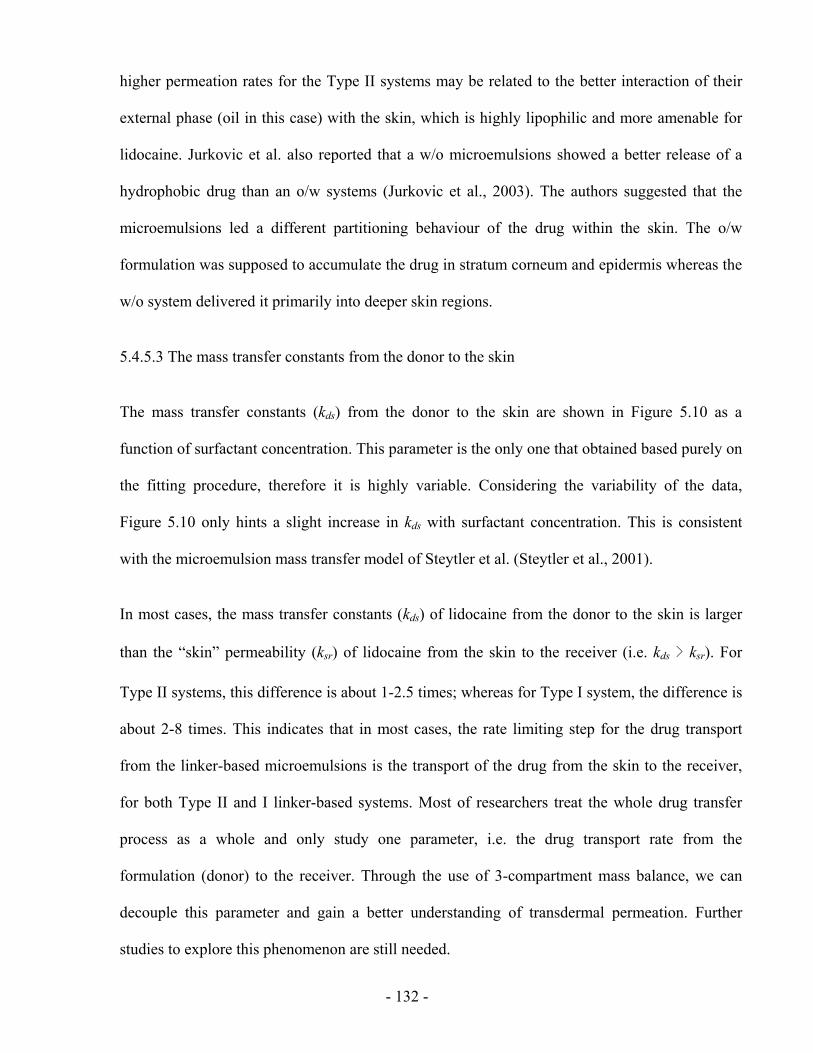
- 132 -
higher permeation rates for the Type II systems may be related to the better interaction of their
external phase (oil in this case) with the skin, which is highly lipophilic and more amenable for
lidocaine. Jurkovic et al. also reported that a w/o microemulsions showed a better release of a
hydrophobic drug than an o/w systems (Jurkovic et al., 2003). The authors suggested that the
microemulsions led a different partitioning behaviour of the drug within the skin. The o/w
formulation was supposed to accumulate the drug in stratum corneum and epidermis whereas the
w/o system delivered it primarily into deeper skin regions.
5.4.5.3 The mass transfer constants from the donor to the skin
The mass transfer constants (kds) from the donor to the skin are shown in Figure 5.10 as a
function of surfactant concentration. This parameter is the only one that obtained based purely on
the fitting procedure, therefore it is highly variable. Considering the variability of the data,
Figure 5.10 only hints a slight increase in kds with surfactant concentration. This is consistent
with the microemulsion mass transfer model of Steytler et al. (Steytler et al., 2001).
In most cases, the mass transfer constants (kds) of lidocaine from the donor to the skin is larger
than the “skin” permeability (ksr) of lidocaine from the skin to the receiver (i.e. kds > ksr). For
Type II systems, this difference is about 1-2.5 times; whereas for Type I system, the difference is
about 2-8 times. This indicates that in most cases, the rate limiting step for the drug transport
from the linker-based microemulsions is the transport of the drug from the skin to the receiver,
for both Type II and I linker-based systems. Most of researchers treat the whole drug transfer
process as a whole and only study one parameter, i.e. the drug transport rate from the
formulation (donor) to the receiver. Through the use of 3-compartment mass balance, we can
decouple this parameter and gain a better understanding of transdermal permeation. Further
studies to explore this phenomenon are still needed.
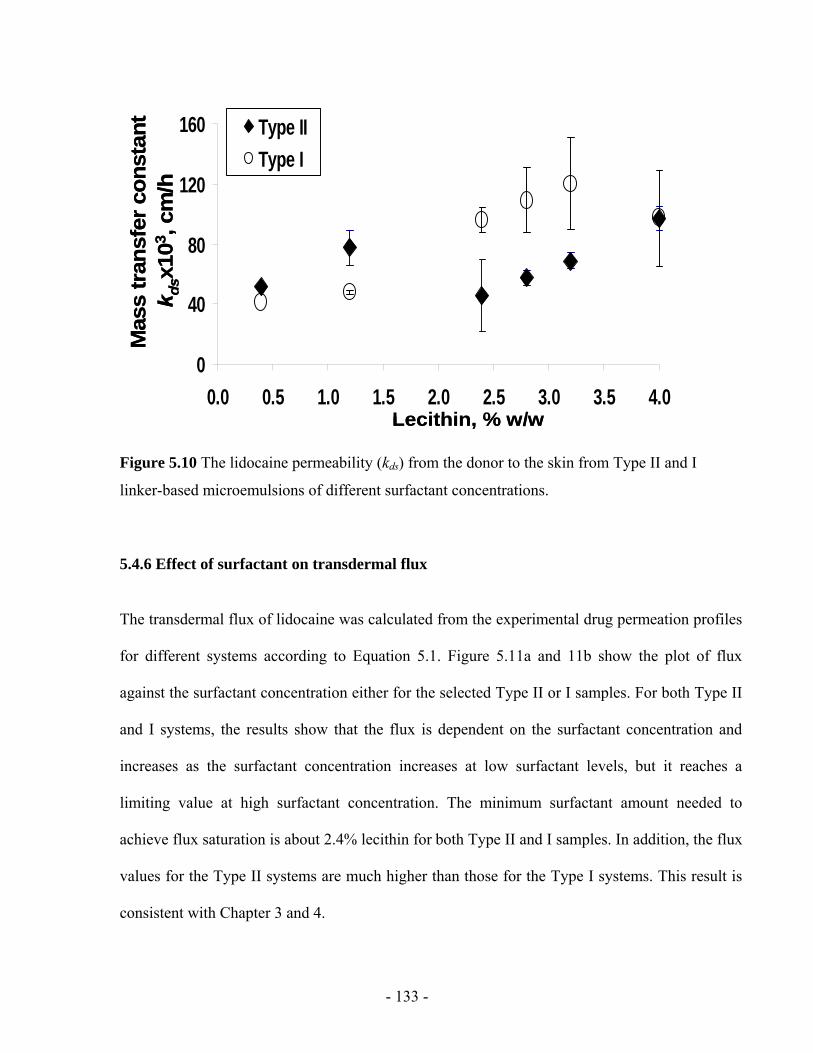
- 133 -
0
40
80
120
160
0.0 0.5 1.0 1.5 2.0 2.5 3.0 3.5 4.0
Type IIType I
Lecithin, % w/w
Mas
s tr
ansf
er c
onst
ant
k d
sx10
3 , cm
/h
0
40
80
120
160
0.0 0.5 1.0 1.5 2.0 2.5 3.0 3.5 4.0
Type IIType I
Lecithin, % w/w
Mas
s tr
ansf
er c
onst
ant
k d
sx10
3 , cm
/h
Figure 5.10 The lidocaine permeability (kds) from the donor to the skin from Type II and I
linker-based microemulsions of different surfactant concentrations.
5.4.6 Effect of surfactant on transdermal flux
The transdermal flux of lidocaine was calculated from the experimental drug permeation profiles
for different systems according to Equation 5.1. Figure 5.11a and 11b show the plot of flux
against the surfactant concentration either for the selected Type II or I samples. For both Type II
and I systems, the results show that the flux is dependent on the surfactant concentration and
increases as the surfactant concentration increases at low surfactant levels, but it reaches a
limiting value at high surfactant concentration. The minimum surfactant amount needed to
achieve flux saturation is about 2.4% lecithin for both Type II and I samples. In addition, the flux
values for the Type II systems are much higher than those for the Type I systems. This result is
consistent with Chapter 3 and 4.
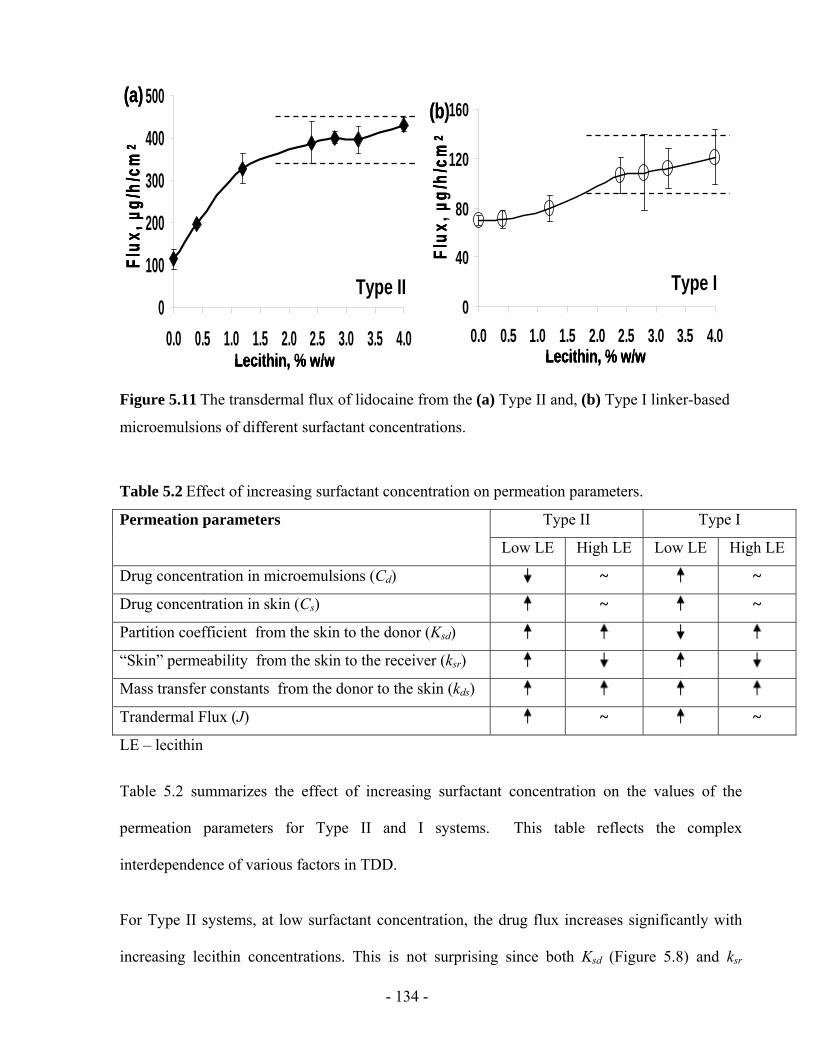
- 134 -
0
100
200
300
400
500
0.0 0.5 1.0 1.5 2.0 2.5 3.0 3.5 4.0Lecithin, % w/w
Flux
, µg/
h/cm
2
Type II0
40
80
120
160
0.0 0.5 1.0 1.5 2.0 2.5 3.0 3.5 4.0Lecithin, % w/w
Flux
, µg/
h/cm
2
Type I
(b)(a)
0
100
200
300
400
500
0.0 0.5 1.0 1.5 2.0 2.5 3.0 3.5 4.0Lecithin, % w/w
Flux
, µg/
h/cm
2
Type II0
100
200
300
400
500
0.0 0.5 1.0 1.5 2.0 2.5 3.0 3.5 4.0Lecithin, % w/w
Flux
, µg/
h/cm
2
Type II0
40
80
120
160
0.0 0.5 1.0 1.5 2.0 2.5 3.0 3.5 4.0Lecithin, % w/w
Flux
, µg/
h/cm
2
Type I0
40
80
120
160
0.0 0.5 1.0 1.5 2.0 2.5 3.0 3.5 4.0Lecithin, % w/w
Flux
, µg/
h/cm
2
Type I
(b)(a)
Figure 5.11 The transdermal flux of lidocaine from the (a) Type II and, (b) Type I linker-based
microemulsions of different surfactant concentrations.
Table 5.2 Effect of increasing surfactant concentration on permeation parameters.
Type II Type I Permeation parameters
Low LE High LE Low LE High LE
Drug concentration in microemulsions (Cd) ~ ~
Drug concentration in skin (Cs) ~ ~
Partition coefficient from the skin to the donor (Ksd) “Skin” permeability from the skin to the receiver (ksr) Mass transfer constants from the donor to the skin (kds) Trandermal Flux (J) ~ ~
LE – lecithin
Table 5.2 summarizes the effect of increasing surfactant concentration on the values of the
permeation parameters for Type II and I systems. This table reflects the complex
interdependence of various factors in TDD.
For Type II systems, at low surfactant concentration, the drug flux increases significantly with
increasing lecithin concentrations. This is not surprising since both Ksd (Figure 5.8) and ksr
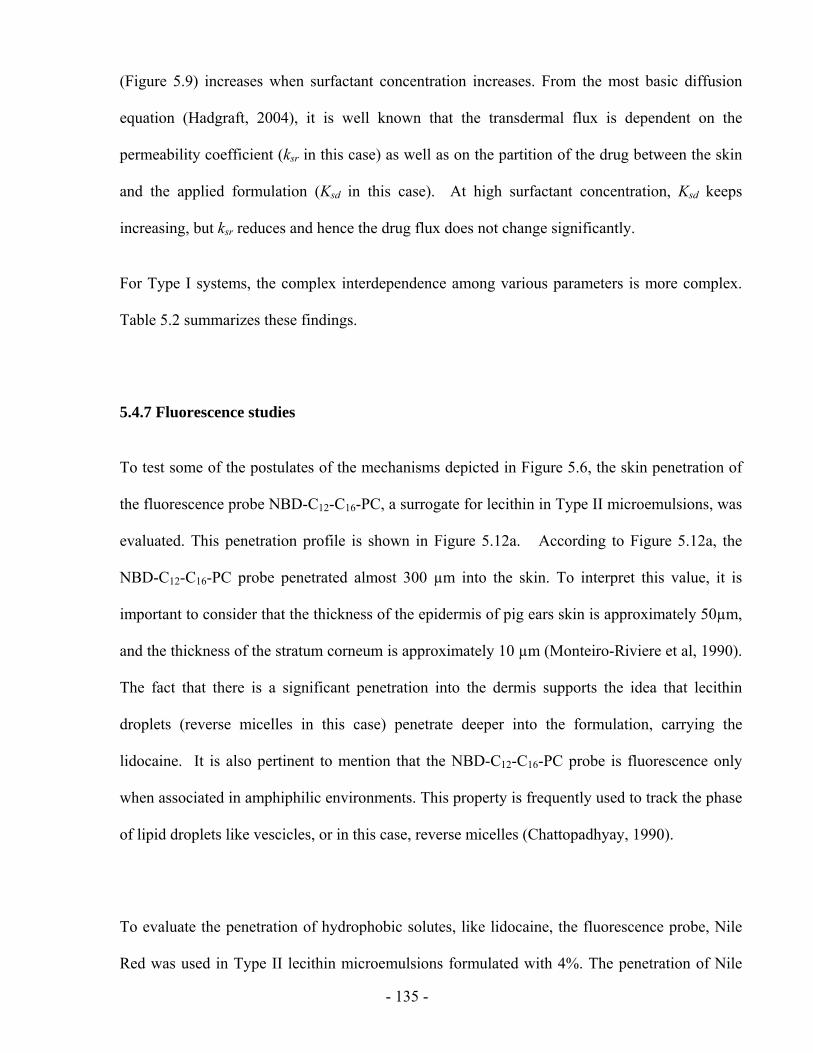
- 135 -
(Figure 5.9) increases when surfactant concentration increases. From the most basic diffusion
equation (Hadgraft, 2004), it is well known that the transdermal flux is dependent on the
permeability coefficient (ksr in this case) as well as on the partition of the drug between the skin
and the applied formulation (Ksd in this case). At high surfactant concentration, Ksd keeps
increasing, but ksr reduces and hence the drug flux does not change significantly.
For Type I systems, the complex interdependence among various parameters is more complex.
Table 5.2 summarizes these findings.
5.4.7 Fluorescence studies
To test some of the postulates of the mechanisms depicted in Figure 5.6, the skin penetration of
the fluorescence probe NBD-C12-C16-PC, a surrogate for lecithin in Type II microemulsions, was
evaluated. This penetration profile is shown in Figure 5.12a. According to Figure 5.12a, the
NBD-C12-C16-PC probe penetrated almost 300 µm into the skin. To interpret this value, it is
important to consider that the thickness of the epidermis of pig ears skin is approximately 50µm,
and the thickness of the stratum corneum is approximately 10 µm (Monteiro-Riviere et al, 1990).
The fact that there is a significant penetration into the dermis supports the idea that lecithin
droplets (reverse micelles in this case) penetrate deeper into the formulation, carrying the
lidocaine. It is also pertinent to mention that the NBD-C12-C16-PC probe is fluorescence only
when associated in amphiphilic environments. This property is frequently used to track the phase
of lipid droplets like vescicles, or in this case, reverse micelles (Chattopadhyay, 1990).
To evaluate the penetration of hydrophobic solutes, like lidocaine, the fluorescence probe, Nile
Red was used in Type II lecithin microemulsions formulated with 4%. The penetration of Nile
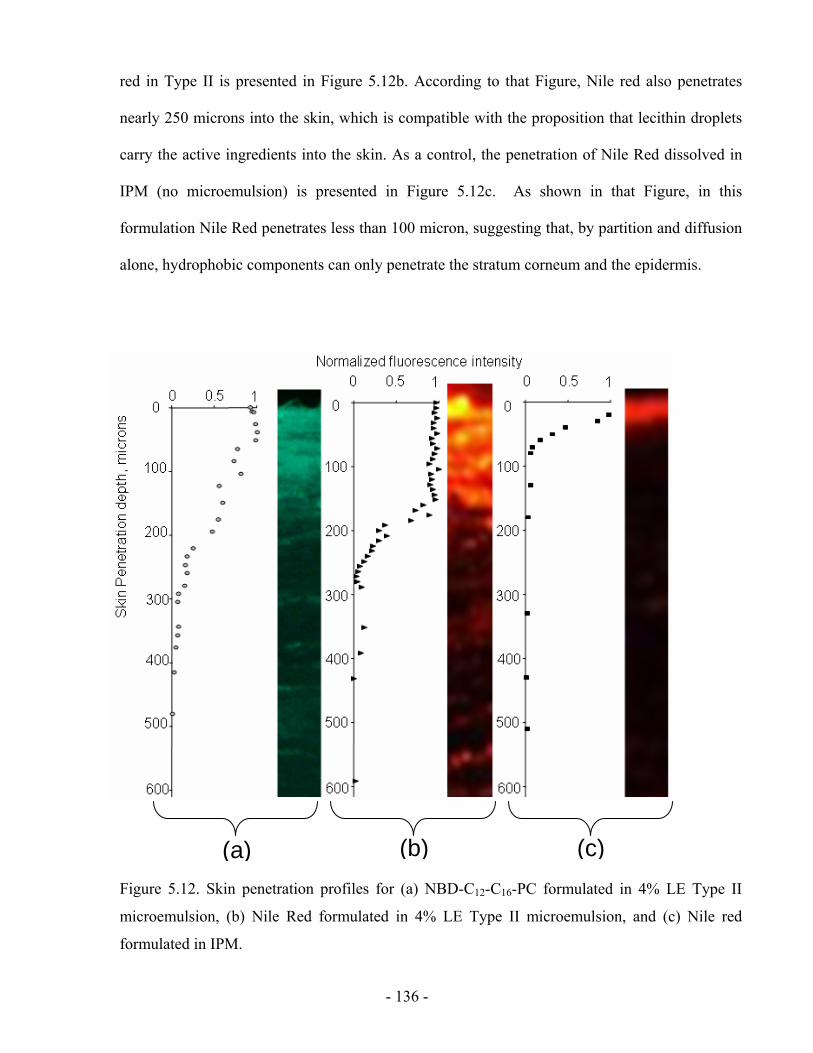
- 136 -
red in Type II is presented in Figure 5.12b. According to that Figure, Nile red also penetrates
nearly 250 microns into the skin, which is compatible with the proposition that lecithin droplets
carry the active ingredients into the skin. As a control, the penetration of Nile Red dissolved in
IPM (no microemulsion) is presented in Figure 5.12c. As shown in that Figure, in this
formulation Nile Red penetrates less than 100 micron, suggesting that, by partition and diffusion
alone, hydrophobic components can only penetrate the stratum corneum and the epidermis.
Figure 5.12. Skin penetration profiles for (a) NBD-C12-C16-PC formulated in 4% LE Type II
microemulsion, (b) Nile Red formulated in 4% LE Type II microemulsion, and (c) Nile red
formulated in IPM.
(a) (b) (c)
- 137 -
While these findings are not complete proof of the mechanism of Figure 5.6, they are consistent
with that schematic. Furthermore, there is increasing evidence that small (< 100 nm) and “soft”
lipid-base carriers penetrate into skin by a network of pores, similar to that depicted in Figure 5.6
(Maghraby et al, 2008; Cevc, 2004).
5.5 CONCLUSIONS
Based on above results and discussions, it is evident that increasing surfactant concentration in
the linker-based lecithin microemulsions improves the drug absorption into the skin. However,
the increase in surfactant concentration also affects the partition of the drug and the mass transfer
coefficients. As indicated by previous studies, increasing the surfactant concentration does
reduce the activity of the drug in the continuous solvent, but at the same time it seems to opens a
secondary mechanism of mass transfer than involves the penetration of the carrier into the skin.
Similar to the findings in other microemulsion-based mass transport, the increase of surfactant
concentration seem to increase the mass transfer coefficient in the microemulsion phase.
However, the effect of surfactant concentration on the “skin” permeability is more complex.
Certainly the modest increase in skin permeability supports the idea that increase permeability is
not the main mechanism of transport enhancement when using linker-based lecithin
microemulsions. Overall the transdermal flux seems to plateau at approximately 2.5% of lecithin.
This lecithin concentration also corresponds to the point where the “skin” permeability reaches a
maximum value. The proposed mathematical model to describe the release curves only use one
fitting parameter, and it provides a frame work that can be used for other microemulsion systems.
The fluorescence microscopy studies support the idea of a surfactant-mediated adsorption-
permeation mechanism for linker-based lecithin microemulsions.
- 138 -
5.6 REFERENCES
Acosta, E.J., 2004. Linker-based non-toxic microemulsions. In: Linker-based non-toxic microemulsions. In: Modeling and formulation of microemulsions: the net-average curvature model and the combined linker effect. Department of Chemical Engineering and Material Science, University of Oklahoma.
Acosta, E.J., Nguyen, T., Witthayapanyanon, A., Harwell, J.H., Sabatini, D.A., 2005. Linker-based bio-compatible microemulsions. Environ. Sci. Technol., 39, 1275-1282.
Attwood, D., 1994. Microemulsions. In: Colloidal drug delivery systems, Kreuter, H. (ed.), Marcel Dekker, New York.
Bagwe, R.P., Kanicky, J.R., Palla, B.J., Patanjali, P.K., Shah, D.O., 2001. Improved drug delivery using microemulsions: rationale, recent progress, and new horizons. Crit. Rev. Ther. Drug Carr. Syst., 18, 77-140.
Baroli, B., López-Quintela, M.A., Delgado-Charro, M.B., Fadda, A. M., Blanco-Méndez, J., 2000. Microemulsions for topical delivery of 8-methoxsalen. J. Controlled Release 69, 209-218.
Bronaugh, R.L. and Maibach, H.I. 2002, Topical absorption of dermatological products, Marcel Dekker, New York.
Changez, M., Chander, J., Dinda A. K., 2006. Transdermal permeation of tetracaine hydrochloride by lecithin microemulsion: In vivo. Colloids and Surfaces B, 48, 58–66
Cevc, G., 2004. Lipid vesicles and other colloids as drug carriers on the skin. Adv. Drug Deliv. Rev., 56, 675-711.
Chattopadhyay, A. 1990. Chemistry and biology of N-(7-nitrobenz-2-oxa-1,3-diazol-4-yl)-labeled lipids: Fluorescent probes of biological and model membranes. Chem. Phys. Lipids, 53, 1-15.
Corswant Cv, Olsson C, Söderman O. Microemulsions based on soybean phosphatidylcholine and isopropylmyristate-effect of addition of hydrophilic surfactants. Langmuir 1998; 14:6864-6870.
Date, A. A. and Patravale, V. B., 2007. Microemulsions: applications in transdermal and dermal delivery. Crit. Rev. Ther. Drug Carrier Syst. 24(6), 547-596.
Delgado-Charro, M.B., Iglesias-Vilas, G., Blanco-Méndez, J., López-Quintela, M.A., Marty, J., Guy, R. H., 1997. Delivery of a hydrophilic solute through the skin from novel microemulsion systems. Eur. J. Pharm. Biopharm. 43, 37-42.
Hadgraft, J., 2004. Skin deep, Eur. J. Pharm. Biopharm. 58, 291-299.
Heuschkel. S., Goebel, A., Neubert, H. H., 2007. Microemulsions-modern colloidal carrier for dermal and transdermal drug delivery. J. Pharm. Sci., 97(2), 603-631.
- 139 -
Jurkovic, P., Sentjurc, M., Gas perlin, M., Kristl, J., Pec ar, S. 2003. Skin protection against ultraviolet induced free radicals with ascorbyl palmitate in microemulsions. Eur. J. Pharm. Biopharm.56,59-66
Kreilgaard, M., Pedersen, E.J., Jaroszewski, J.W., 2000. NMR characterisation and transdermal drug delivery potential of microemulsion systems. J. Control. Release, 69, 421-433.
Kreilgaard, M., 2002. Influence of microemulsions on cutaneous drug delivery. Adv. Drug Deliv. Rev., 54, S77-S98.
Lawrence, M.J. and Rees, G.D., 2000. Microemulsion-based media as novel drug delivery systems. Adv. Drug Deliv. Rev., 45, 89-121
Lee, P.J., Langer, R., Shastri, V.P., 2003. Novel microemulsion enhancer formulation for simultaneous transdermal delivery of hydrophilic and hydrophobic Drugs. Pharm. Res., 20, 264-269.
Lee, M.-W.C., 2003. Topical triple-anesthetic gel compared with 3 topical anesthetics. Cosmetic Dermatology, 16(4), 35-38.
Lide, D. L., CRC handbook, 2006. CRC Handbook of Chemistry and Physics, 87th ed. CRC Press, Boca Raton.
Maghraby, G.M., Barry, B.W., Williams, A.C., 2008. Liposomes and skins: from drug delivery to model membranes. Eur. J. Phar. Sci., 34, 203-222.
McKarns, S.C., Hansch, C., Caldwell, W.S., Morgan, W.T., Moore, S.K., Doolittle, D.J., 1997. Correlation between hydrophobicity of short-chain aliphatic alcohols and their ability to alter plasma membrane integrity. Fund. App. Toxicol. 36, 62-70.
Monteiro-Riviere, N.A., Bristol, D.G., Manning, T.O., Rogers, R.A., Riviere, J.E. 1990. Interspecies and interregional analysis of the comparative histologic thickness and laser Doppler blood flow measurements at five cutaneous sites in nine species. J. Investigative Dermatol., 95, 582-586.
Nitsch, W., Plucinski, P., Ehrlenspiel, J., 1997. Connection of ion and water exchange between an aqueous and a microemulsion phase. J. Phys. Chem. B. 101, 4024-4029.
Osborne, D. W., Ward, A. J., O’Neill, K. J., 1991. Microemulsions as topical drug delivery vehicles: in vitro transdermal studies of a model hydrophilic drug. J. Pharm. Pharmacol, 43, 450-454.
Rhee, Y. S., Choi, J. G., Park, E. S., Chi, S. C., 2001. Transdermal delivery of ketoprofen using microemulsions. Int. J. Pharm, 315, 52-58.
Rosen, M. J, 2004. Surfactants and Interfacial Phenomena. In: Hoboken, N.J. (3rd ed.), Wiley-Interscience, New York.
- 140 -
Sintov, A.C. and Shapiro, L., 2004. New microemulsion vehicle facilitates percutaneous penetration in vitro and cutaneous drug bioavailability in vivo. J. Control. Release, 95, 173-183.
Shah, V. P., 1994. Skin penetration enhancers: Scientific perspectives. In: Heieh, D. S. (ed.), Drug permeation enhancement: theory and applications, Marcel Dekker, New York, pp 19-24.
Steytler, D. C., Towey, T. F., Robinson, B. H., Atay, N. Z. 2001. Mechanisms of solute interfacial transfer in winsor-II systems. Langmuir, 17, 417-426.
Tenjarla, S., 1999. Microemulsions: an overview and pharmaceutical applications. Crit. Rev. Ther. Drug Carr. Syst., 16, 461-521.
Williams, A.C., Barry, B.W., 1992. Skin absorption enhancers. Crit. Rev. Ther. Drug Carrier Syst. 9, 305–353.
Yuan, J. S., Acosta, E., 2009. Extended release of lidocaine from linker-based lecithin microemulsions. Int. J. Pharm. 368, 63-71.
Yuan, J. S., Ansari, M., Samaan, M., Acosta, E., 2008. Linker-based lecithin microemulsions for transdermal delivery of lidocaine. Int. J. Pharm. 349, 130-143.

- 141 -
CHAPTER 6
CONCLUSIONS AND FUTURE RECOMMENDATIONS
- 142 -
6.1 CONCLUSIONS
In conclusion, linker-based lecithin microemulsions have been formulated with food-grade
additives, and are shown be safe and effective TDD vehicles in vitro. When compared to a
conventional alcohol-based lecithin system, the new lecithin-linker systems not only produce
higher transdermal flux and larger drug absorption in the skin, but are also less toxic. After
applying the linker microemulsions on the skin, in situ delivery patches are formed and provide
extended release of active ingredients up to 24 h. The mass of drug initially absorbed in the skin
has a significant impact on drug release profiles. It is found that increasing surfactant
concentration in the linker-based lecithin microemulsions improves the drug absorption in the
skin, but only increases drug flux up to a plateau value. These conclusions rely on the following
results:
1. Alcohol-free lecithin microemulsions can be formulated using the combination of sodium
caprylate and caprylic acid as hydrophilic linkers. From this, different types of
microemulsions can be obtained including Type II (w/o), Type III or IV (bicontinuous),
Type I (o/w). These linker microemulsions produced relatively small droplets (less than
10 nm in diameter) which suggest the existence of a large surface area for mass transfer
and explain the relatively low viscosity of these formulations. The formulation conditions
such as temperature and electrolyte concentration do not affect the phase behaviour of
these systems.
2. The superior transdermal flux obtained with the linker microemulsions is likely to be due
to the presence of sodium caprylate and caprylic acid, which accelerate the
microemulsion-skin mass transfer by reducing the interfacial rigidity of the systems. It is
difficult to formulate alcohol-free lecithin microemulsions since there is only a small pool
- 143 -
of molecules with six to nine carbons that can be considered as hydrophilic linkers. The
approach of using the combination of sodium caprylate and caprylic acid as hydrophilic
linkers in lecithin microemulsions offers many exciting opportunities in the broad field of
drug delivery.
3. The concept of “skin” permeability, for the first time, is introduced and used to determine
the effectiveness of microemulsions as transdermal vehicles, especially useful when
comparing different delivery systems. We express the “skin” permeability using the
concentration difference between a common phase (the skin) and the receiver. The
permeability commonly used in the literature (Equation 2.2 in Chapter 2) simply
considers the concentration difference between the donor and the receiver. It ignores the
solubility and chemical potential of the drug in the vehicles. Hence, the concept of
permeability is suitable for simple solutions, but is not appropriate to evaluate
microemulsion-based drug delivery vehicles. The new concept of “skin” permeability
captures the permeation enhancing abilities of surfactants, and allows one to compare the
permeability obtained from different delivery systems.
4. For the first time, in situ patches are produced with the developed linker-based lecithin
systems loaded with drugs. After applying the microemulsions for a short period of time,
the drug can be absorbed in the skin and the drug-loaded skin can act as in situ patches
for extended drug release. The in situ patches are able to release 90% of their drug
content over a 24 h period which rivals the performance of some polymer-based patches.
Indeed, we observed the in situ patches under the fluorescent microscopy.
5. The increase of surfactant concentration in the developed microemulsions is found to
increase the drug absorption in the skin, but only increase the transdermal flux of
lidocaine up to a point where a plateau value of transdermal flux is reached. Hence, an
- 144 -
optimal surfactant concentration exists in the linker-based lecithin systems to provide
high enough transdermal flux with minimal side effects.
6. The mass balance model proposed in this work can be applied to the drug transport
mechanism from microemulsions (the donors) to deep skin layers (the receivers). The
underlying mechanisms of the drug release from microemulsions are complex and less
understood. Before this project, there was only one attempt to establish a mathematical
model for describing drug release kinetics from microemulsions (Grassi et al., 2000). The
authors considered microemulsions as emulsions with extremely small drops and adopted
a drug release model of emulsions for microemulsions. As discussed in Chapter 2,
microemulsions are distinctly different from emulsions in that the former are
thermodynamically stable single-phase systems whereas the latter are thermodynamically
unstable two-phase dispersions. These differences make the model for emulsions
inappropriate for microemulsions. Hence, we developed a mathematical model based on
a mass transfer balance along three drug compartments (Figure 4.3). The model shows
the interdependence among a number of permeation parameters, but only uses one fitting
parameter and has a perfect match with the experimental data. The drug loading in the
skin is found to be the key factor for TDD, which is easy to be obtained by experimental
measurements. The model provides a frame work that can be used for other
microemulsion systems.
- 145 -
6.2 RECOMMENDATIONS FOR FUTURE WORK
In this dissertation, we have demonstrated the formulation and characterization of the linker-
based lecithin microemulsions, their phase behaviour, drug solubilization capacity, the
transdermal performance of delivery lidocaine in vitro, the formation of in situ patches and the
effect of surfactant concentration. Although these promising results demonstrated that these
newly formulated lecithin-linker microemulsions are efficient drug carriers in vitro, there are
important questions that arise from these studies and need to be addressed in future studies. For
example, how well the linker-based systems will performance transdermally under in vivo
circulation? Is there more evidence to prove the proposed surfactant-mediated
absorption/permeation mechanism for drug transport from microemulsions to the skin? Can the
linker-based systems deliver other drugs in spite of lidocaine? In addition, given the low
viscosity of the linker-based systems, is it possible to increase the viscosity for ease of
application? Based on the present work, recommendations for future research needs are put
forward, including:
1. Investigating the effect of oils on the linker-based delivery systems
One of important issue of microemulsions is the selection of oils. The oil currently used
in the studied linker-based lecithin microemulsions is isopropyl myristate (IPM), which
has a relatively large molecular weight and requires high surfactant concentration to be
solubilized. Appendix 1 compares IPM and another oil (ethyl caprate) with a smaller
molecular weight in the systems to delivery lidocaine. The results show that the
hydrophobicity of the oil is not the only factor to be considered. It would be of interest to
explore the effect of other oils on the linker-based lecithin microemulsions for
- 146 -
transdermal delivery, and to find out which factors related to oils have the greatest
influence on drug delivery.
2. Investigating the effect of drugs on the linker-based delivery systems
The delivery of a lipophilic drug, lidocaine, has been demonstrated using the developed
linker-based lecithin systems. As discussed in Chapter 2, the major advantage of
microemulsions is that microemulsions are able to entrap both hydrophobic and
hydrophilic active ingredients. It is necessary to investigate the effect of drugs on the
linker-based lecithin microemulsions for transdermal delivery. Appendix 2 reports the
incorporation of an extremely hydrophobic drug (α-tocopherol acetate) and a hydrophilic
drug (sodium salicylate) in the developed microemulsion formulations. The results of
phase behaviour of the systems are promising. Future work can continue in this direction,
to examine the in vitro transdermal flux and “skin” permeability.
3. Further prove of the proposed surfactant-mediated absorption/permeation
mechanism
This dissertation proposes that the drug transfer from the microemulsions to the skin rely
on the surfactant absorption/permeation mechanism, in which surfactant droplets are
considered as vehicles to carry drugs into the skin. Although the fluorescence studies
were used to visualize the penetration of lecithin and drug into the skin, it’s better to find
other methods (i.e. mass transfer) to further prove this mechanism.
In addition, Eq. 5.3 in Chapter 5 only looks for overall mass transfer of the drug. In
reality, there are two kinds of mass transfer mechanisms that occur simultaneously. In
one of them the drug is carried directly by droplets, and in the other the drug is
- 147 -
transffered from droplet to the continous phase first, and then from the continuous phase
diffusing into the skin (Grassi et al., 2000). Therefore, the new version of Eq.5.3 should
account for both of them: surfactant-mediated mechanism and the indirect mass transfer
from droplet-continuous phase-skin.
4. Improving the techniques of in vitro permeation studies and fluorescence
microscopy
There are two experimental details needed to be improved in future. First, the receiver
solution used for the in vitro permeation studies is pure PBS, which has a (very) low
solubility towards extremely hydrophobic drugs (e.g. α-tocopherol acetate). The drug
transported across the skin may not be able to dissolve completely in the receiver.
Current research is underway by adding 1% albumin bovine serum in PBS in order to
better dissolve the permeants. Secondly, water loss occurred during the freeze drying step
for the fluorescence microscopy studies. There is a need for proper preparation of the
skin before the freeze dry process to improve the effectiveness of fluorescence technique.
5. Studying the effect of viscosity
In terms of the low viscosity of the studied lecithin-linker systems, there are two sides to
the coin. On one hand, the low viscosity is good for the dosage form of spray for topical
use, and may be suitable for oral, parenteral, pulmonary or even ocular delivery. On the
other side, for practical reasons, the systems need to be thickened for the topical form of
creams or gels. The question remaining is whether the viscosity will affect the drug
permeability. Current research is underway to study this phenomenon using xanthan gum
or gelatin.
- 148 -
6. Evaluation of in vivo efficacy of the linker-based systems
In this work, we have demonstrated the capacity of the linker-based lecithin
microemulsions as efficient TDD vehicles in vitro. Currently we are cooperating with a
Canadian company and using a modified version of the developed lecithin-linker
microemulsions for anti-cellulites delivery. In vivo Safety tests, such as Ames test for
mutagenic potential and human repeat insult patch test (HRIPT), have been done on the
modified formulations. The result show no carcinogenic, irritation or allergenic potential
caused by the lecithin-linker microemulsions systems. Future in vivo studies are
necessary to further prove the efficacy of the developed systems as transdermal drug
carrier. For example, in vivo percutaneous absorption studies can be performed through
topical applications on animal models. This will directly improve the possibility of the
developed microemulsions to be a pharmaceutical product.
7. Evaluating the phase transition of the linker-based systems in the skin
When microemulsion droplets penetrate into the skin, they may change their shape or size
or even microemulsion type due to temperature changes, dilution effects or the change in
electrolyte concentration. In Section 3.4.1.2 and Section 3.4.1.3, these factors have been
studied briefly, but not directly in the skin.
8. Studying the effect of skin variability on the effectiveness of microemulsion systems
When using pig skin for the in vitro permeation studies and in vitro cytotoxicity studies,
we found that the results were variable and in most cases, the experiments had to be
repeated more than three times to obtain reasonable statistics. The reason is because the
skin properties are not consistent from different batches. Hence, a protocol should be
- 149 -
established to prescreen the skin can be used for transdermal studies. Otherwise, the
impact of skin variability on the effectiveness of microemulsion systems should be
investigated.
6.3 REFERENCES
Grassi, M., Coceani, N., Magarotto, L., 2000, Mathematical modeling of drug release from microemulsions: Theory in comparison with experiments. Journal of Colloid and Interface Science, 228,141-150.
- 150 -
APPENDIX 1
EFFECT OF OILS
ON LINKER-BASED LECITHIN MICROEMULSIONS
FOR TRANSDERMAL DELIVERY OF LIDOCAINE
Co-authors for this portion of the work include Micheline Samaan and Edgar Acosta.
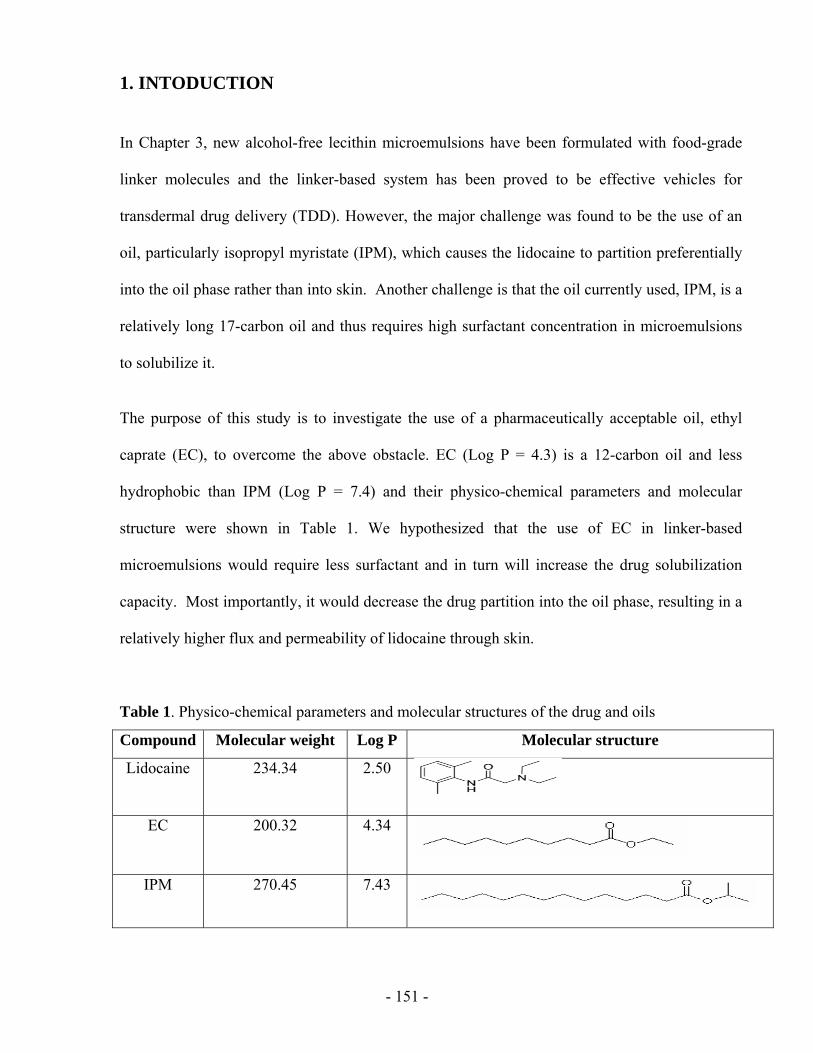
- 151 -
1. INTODUCTION
In Chapter 3, new alcohol-free lecithin microemulsions have been formulated with food-grade
linker molecules and the linker-based system has been proved to be effective vehicles for
transdermal drug delivery (TDD). However, the major challenge was found to be the use of an
oil, particularly isopropyl myristate (IPM), which causes the lidocaine to partition preferentially
into the oil phase rather than into skin. Another challenge is that the oil currently used, IPM, is a
relatively long 17-carbon oil and thus requires high surfactant concentration in microemulsions
to solubilize it.
The purpose of this study is to investigate the use of a pharmaceutically acceptable oil, ethyl
caprate (EC), to overcome the above obstacle. EC (Log P = 4.3) is a 12-carbon oil and less
hydrophobic than IPM (Log P = 7.4) and their physico-chemical parameters and molecular
structure were shown in Table 1. We hypothesized that the use of EC in linker-based
microemulsions would require less surfactant and in turn will increase the drug solubilization
capacity. Most importantly, it would decrease the drug partition into the oil phase, resulting in a
relatively higher flux and permeability of lidocaine through skin.
Table 1. Physico-chemical parameters and molecular structures of the drug and oils
Compound Molecular weight Log P Molecular structure
Lidocaine 234.34 2.50
EC 200.32 4.34
IPM 270.45 7.43
- 152 -
In order to test this hypothesis, microemulsion formulations of Series L with 4% lecithin in
Chapter 3 were prepared using EC as the carrier oil instead of IPM in this study. Sorbitan
monooleate is still used as hydrophobic linker, a mixture of sodium caprylate and caprylic acid
serves as hydrophilic linkers. Lidocaine is the active drug ingredient. The microemulsions with
EC oil were then used to test in vitro drug permeability and partitioning of drug in the different
microemulsions (Types I, II, and IV) and skin remaining to examine the effect of using EC oil, as
opposed to a supposedly more hydrophobic oil such as IPM.
As will be shown in the results, using EC indeed enhances the drug solubilization capacity in
microemulsions and has proved one component of the hypothesis correct. On the other hand,
lidocaine was shown to have a stronger affinity to EC than IPM due to an increased drug
solubility, Therefore, the use of EC oil instead of IPM as reflected by the differences in through
the skin, rather than improves it.
1.1 Effect of oil on microemulsions
The type of oil used in microemulsion formulations is very important because it must be
solubilized by the surfactant in order to form microemulsions. The selected oil affects not only
the phase structures and stability of microemulsions, but also the level of drug solubilization.
Malcolmson et al. examined the solubility of testosterone propionate (hydrophobic) in
microemulsions with regards to different oil constituents (Malcolmson et al. 1998). The
solubilization of the lipophilic drug depends on the solubility of the drug in the bulk oil and the
influence of the oil on the nature of the microemulsion droplet. Warisnoicharoen et al.
investigated the effect of oil type on phase behaviour of microemulsions using different nonionic
surfactants (Warisnoicharoen et al., 2000). They found depending on types of surfactant used, in
- 153 -
some cases short single-chained oils were easier to solubilize than triglycerides, and vice versa.
Another important finding was that within the same series of oil, the shortest alkyl chain was
solubilized more than the longer chain oils. Kantaria et al. also studied the effect of the oil’s
chain length on solubilization and found that optimal solubilization was obtained using oils of
approximately 6-8 carbon chain length (Kantaria et al., 2003). Lawrence and Rees also claimed
that small molecular volume oils penetrated the hydrophobic chain region of the surfactant and
aided microemulsion formation (Lawrence and Rees, 2000).
Using an extended surfactant, which is a surfactant combined with a lipophilic or hydrophilic
linker, improves the surfactant-oil or surfactant-water interactions. Miñana-Perez et al. have
shown that at optimum formulation, a Type III formulation can be obtained with a variety of
long-chained oils, particularly mono, and triglyceride esters, but solubilization is much higher for
long single-chain polar oils, such as ethyl oleate (Miñana-Perez et al., 1995).
Therefore, using single-chain oils or triglycerides depends on the surfactant used along with the
presence of cosurfactants and linkers. If the latter two molecules are present, microemulsion
formation becomes easier because of the decrease in interfacial tension and rigidity. The
different oil experiments performed by Warisnoicharoen and Miñana-Perez et al. did not use
lecithin, but rather, they used nonionic surfactants such as polyoxyethylene, which have different
structures and properties; and therefore, will exhibit different physicochemical characteristics
when mixed with different oils. Thus, since no experiments have been performed using lecithin
as surfactant in contact with a variety of oils, no solid conclusions can be made on the
solubilization of the different types of oils in lecithin surfactant.
- 154 -
1.2 Effect of oil on drug release from microemulsions
Several studies have pointed out the influence of the oil phase composition used in
microemulsions on transdermal administration of drugs (Montenegro et al., 2006; Trotta 1997).
The drug release rate from microemulsions was found to be dependent on oil phase lipophilicity,
drug partition coefficient, and type of surfactant used. Trotta et al. studied o/w microemulsions
containing benzyl alcohol or different ratios of benzyl alcohol and IPM as oil phase for
transdermal absorption of felodipine. They found the highest drug flux was from the
microemulsion with the highest drug solubility. Montenegro et al. also investigated effect of oil
on drug release from o/w microemulsions formulated with different oils IPM, isopropyl
palmitate, and isopropyl stearate. They observed that the vehicles containing IPM as oil phase
produced the highest release rate for a hydrophobic drug naproxen (Log P = 2.9). The authors
concluded that the microemulsions containing the most lipophilic oil increase the drug solubility
and reduce the drug thermodynamics activity, which lead to an unfavorable drug partition from
the oil phase.
The drug release from microemulsions also dependent on the active compound incorporated and
type of surfactant used. According to Montenegro’s study, the drug release rate was inversely
related to drug lipophilicity. Previous studies on effect of oil drug release from microemulsions
did not use lecithin as surfactant and lidocaine as model drug. Consequently, the effect of oil on
drug release from linker-based lecithin microemulsions had to been found out.
- 155 -
2. MATERIAL AND METHODS
The materials and methodology used in this study are same as those described in Chapter 3.
Ethyl caprate (99%+) was purchased from Sigma (St Louis, MO, USA) at the concentrations
shown and were used as received. Only pig ear skin was used for in vitro permeation studies.
The saturation solubility of lidocaine was determined in EC and IPM. Excess drug was added to
known volumes of the solvent, vortexed for 2 min, followed by hot water bathing to dissolve the
drug and then equilibrated at room temperature (approximately 22ºC) overnight. The contents
were then centrifuged at 3,000 rps/min for 20 min (Beckman AvantiTM 30 centrifuge) and the
aliquots of supernatant saturated solvent were diluted appropriately and analyzed by HPLC.
Partition coefficient studies between oil and water were done using different oils: EC and IPM.
First, 10% lidocaine in oil was diluted to 5%, 2%, 1%, 0.2%, and 0.1% lidocaine in oil. Second,
5 ml of water was added into 5 ml of the oil with different drug concentration. The mixture was
shaken, vortexed, and centrifuged consecutively several times per day. After equilibrium, the
drug partitioning in the water and oil phases were analyzed by HPLC.
3. RESULTS AND DISCUSSION
3.1 Phase behaviour of linker-based EC microemulsions
The linker-based EC microemulsions were formulated with 4% w/w (unless stated otherwise)
lecithin, 12% sorbitan monooleate, 1.5-7% sodium caprylate, 3% caprylic acid, 0.9% sodium
chloride, and 38% lidocaine-EC solution (10% lidocaine in EC). With increasing sodium
caprylate (hydrophilic linker) concentrations, the system becomes more hydrophilic and the
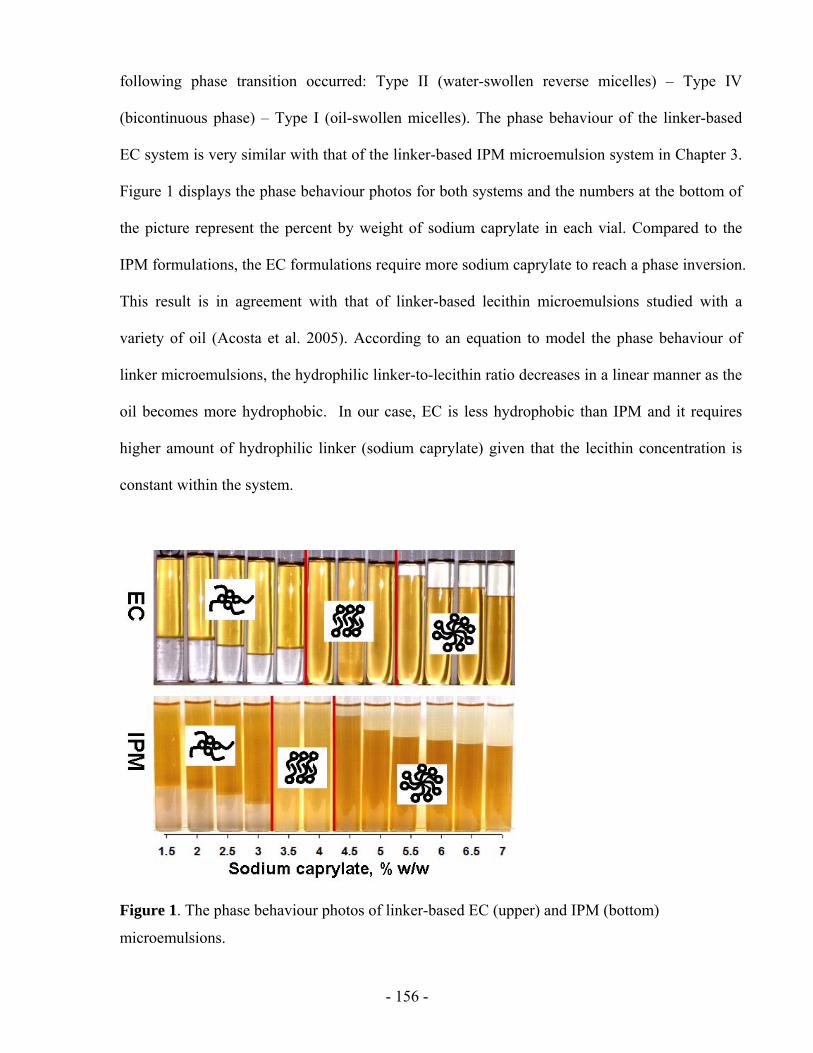
- 156 -
following phase transition occurred: Type II (water-swollen reverse micelles) – Type IV
(bicontinuous phase) – Type I (oil-swollen micelles). The phase behaviour of the linker-based
EC system is very similar with that of the linker-based IPM microemulsion system in Chapter 3.
Figure 1 displays the phase behaviour photos for both systems and the numbers at the bottom of
the picture represent the percent by weight of sodium caprylate in each vial. Compared to the
IPM formulations, the EC formulations require more sodium caprylate to reach a phase inversion.
This result is in agreement with that of linker-based lecithin microemulsions studied with a
variety of oil (Acosta et al. 2005). According to an equation to model the phase behaviour of
linker microemulsions, the hydrophilic linker-to-lecithin ratio decreases in a linear manner as the
oil becomes more hydrophobic. In our case, EC is less hydrophobic than IPM and it requires
higher amount of hydrophilic linker (sodium caprylate) given that the lecithin concentration is
constant within the system.
Figure 1. The phase behaviour photos of linker-based EC (upper) and IPM (bottom)
microemulsions.
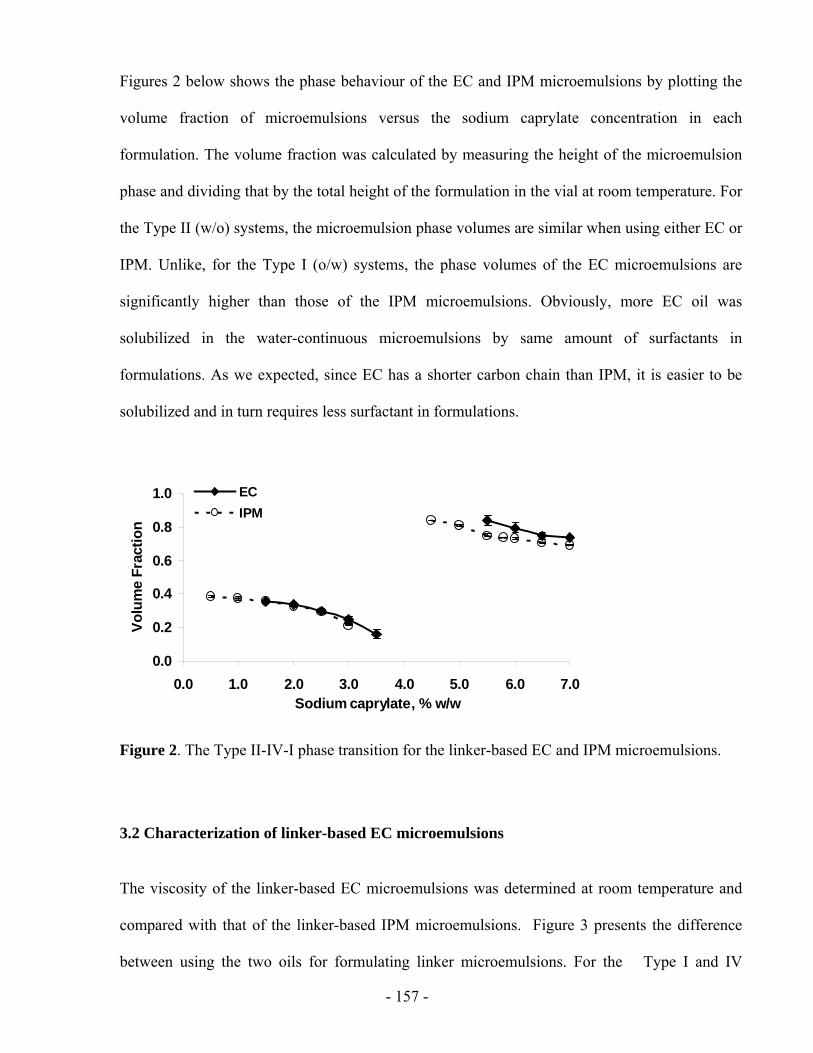
- 157 -
Figures 2 below shows the phase behaviour of the EC and IPM microemulsions by plotting the
volume fraction of microemulsions versus the sodium caprylate concentration in each
formulation. The volume fraction was calculated by measuring the height of the microemulsion
phase and dividing that by the total height of the formulation in the vial at room temperature. For
the Type II (w/o) systems, the microemulsion phase volumes are similar when using either EC or
IPM. Unlike, for the Type I (o/w) systems, the phase volumes of the EC microemulsions are
significantly higher than those of the IPM microemulsions. Obviously, more EC oil was
solubilized in the water-continuous microemulsions by same amount of surfactants in
formulations. As we expected, since EC has a shorter carbon chain than IPM, it is easier to be
solubilized and in turn requires less surfactant in formulations.
0.0
0.2
0.4
0.6
0.8
1.0
0.0 1.0 2.0 3.0 4.0 5.0 6.0 7.0Sodium caprylate, % w/w
Volu
me
Frac
tion
ECIPM
Figure 2. The Type II-IV-I phase transition for the linker-based EC and IPM microemulsions.
3.2 Characterization of linker-based EC microemulsions
The viscosity of the linker-based EC microemulsions was determined at room temperature and
compared with that of the linker-based IPM microemulsions. Figure 3 presents the difference
between using the two oils for formulating linker microemulsions. For the Type I and IV
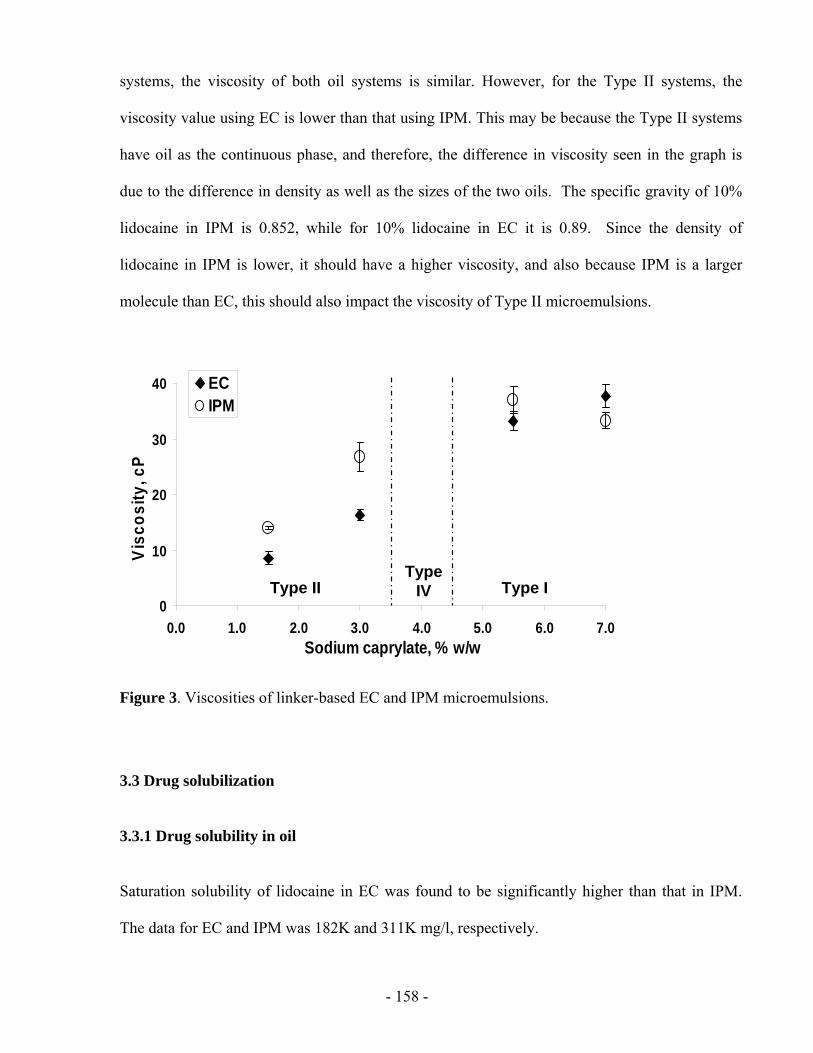
- 158 -
systems, the viscosity of both oil systems is similar. However, for the Type II systems, the
viscosity value using EC is lower than that using IPM. This may be because the Type II systems
have oil as the continuous phase, and therefore, the difference in viscosity seen in the graph is
due to the difference in density as well as the sizes of the two oils. The specific gravity of 10%
lidocaine in IPM is 0.852, while for 10% lidocaine in EC it is 0.89. Since the density of
lidocaine in IPM is lower, it should have a higher viscosity, and also because IPM is a larger
molecule than EC, this should also impact the viscosity of Type II microemulsions.
0
10
20
30
40
0.0 1.0 2.0 3.0 4.0 5.0 6.0 7.0Sodium caprylate, % w/w
Visc
osity
, cP
ECIPM
Type IIType
IV Type I0
10
20
30
40
0.0 1.0 2.0 3.0 4.0 5.0 6.0 7.0Sodium caprylate, % w/w
Visc
osity
, cP
ECIPM
Type IIType
IV Type I
Figure 3. Viscosities of linker-based EC and IPM microemulsions.
3.3 Drug solubilization
3.3.1 Drug solubility in oil
Saturation solubility of lidocaine in EC was found to be significantly higher than that in IPM.
The data for EC and IPM was 182K and 311K mg/l, respectively.
- 159 -
3.3.2 Drug partitioning between microemulsions and excess phases
The solubilization capacity of the linker-based EC microemulsions for a poorly water-soluble
drug, lidocaine, was measured and compared to that of the linker-based IPM microemulsions.
The initial lidocaine concentration dosed in all formulations was the same. The drug
concentration in microemulsions and excess phases was measured after the samples were
equilibrated. Figure 4(a) and 4(b) below displays the plot of lidocaine concentration in
microemulsions and excess phases versus the amount of sodium caprylate. The trend is similar
for the EC and IPM systems: Type II > excess oil > Type I > excess water.
At low quantities of sodium caprylate, the systems are Type II and lidocaine is solubilized
mostly in the microemulsion phase. This is because the oil phase is continuous in this system and
lidocaine, being slightly hydrophobic, preferentially remains in the oil continuous phase. This
inevitably leads to a high partition coefficient of lidocaine (KII/H2O) between the Type II
microemulsions and their excess aqueous phases.
At high quantities of sodium caprylate, Type I exists where the aqueous phase is continuous. The
partition coefficient (KI/oil) between the Type I microemulsions and their excess oil phases is
relatively low and constant. For these systems, lidocaine is still solubilized more in the excess
oil phase, but is also solubilized in the aqueous microemulsion phase. This indicates an important
effect that microemulsions enhance the solubilization capacity of the drug; and this is very
apparent from the fact that the Type I microemulsions have a much higher concentration of
lidocaine in comparison with that in water.
It is interesting to note that lidocaine in the Type II EC microemulsions and the excess EC
phases are significantly higher than those in the IPM case. Also, lidocaine concentration in the
Type I EC microemulsions is also higher. The reveals that EC has a greater affinity for lidocaine
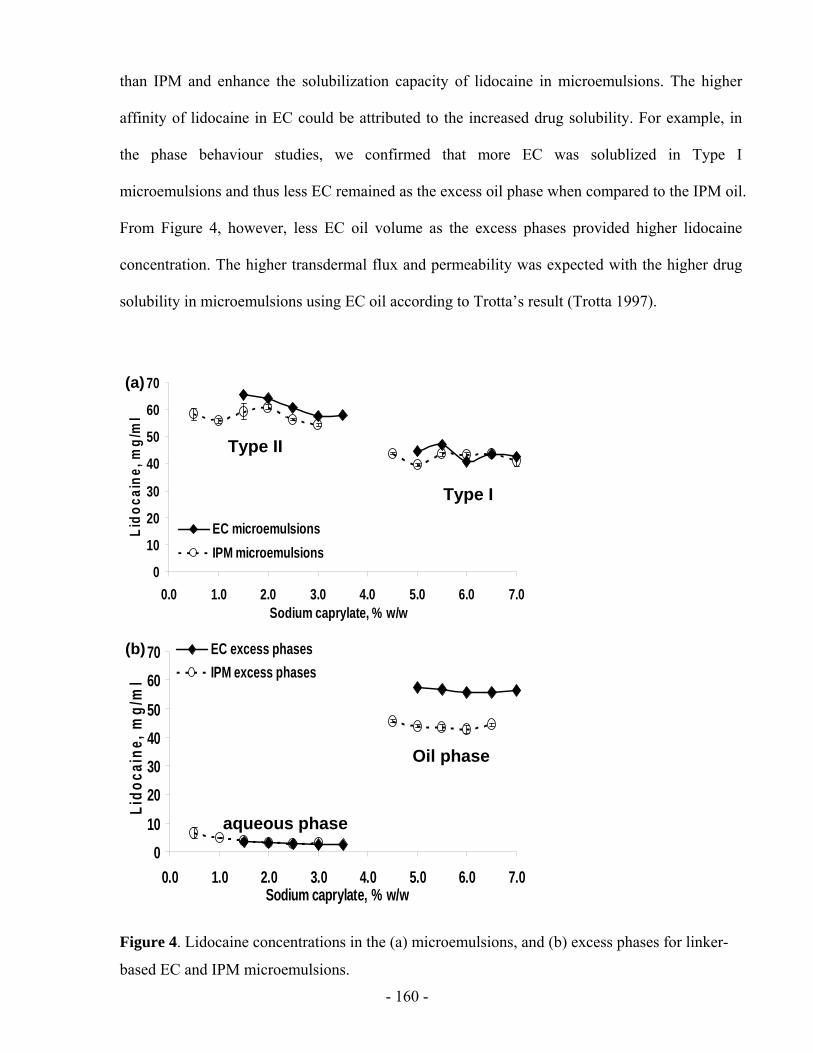
- 160 -
than IPM and enhance the solubilization capacity of lidocaine in microemulsions. The higher
affinity of lidocaine in EC could be attributed to the increased drug solubility. For example, in
the phase behaviour studies, we confirmed that more EC was solublized in Type I
microemulsions and thus less EC remained as the excess oil phase when compared to the IPM oil.
From Figure 4, however, less EC oil volume as the excess phases provided higher lidocaine
concentration. The higher transdermal flux and permeability was expected with the higher drug
solubility in microemulsions using EC oil according to Trotta’s result (Trotta 1997).
0
10
20
30
40
50
60
70
0.0 1.0 2.0 3.0 4.0 5.0 6.0 7.0Sodium caprylate, % w/w
Lido
cain
e, m
g/m
l
EC microemulsionsIPM microemulsions
Type II
Type I
(a)
0
10
20
30
40
50
60
70
0.0 1.0 2.0 3.0 4.0 5.0 6.0 7.0Sodium caprylate, % w/w
Lido
cain
e, m
g/m
l
EC microemulsionsIPM microemulsions
Type II
Type I
(a)
010
20304050
6070
0.0 1.0 2.0 3.0 4.0 5.0 6.0 7.0Sodium caprylate, % w/w
Lido
cain
e, m
g/m
l
EC excess phasesIPM excess phases
aqueous phase
Oil phase
(b)
010
20304050
6070
0.0 1.0 2.0 3.0 4.0 5.0 6.0 7.0Sodium caprylate, % w/w
Lido
cain
e, m
g/m
l
EC excess phasesIPM excess phases
aqueous phase
Oil phase
010
20304050
6070
0.0 1.0 2.0 3.0 4.0 5.0 6.0 7.0Sodium caprylate, % w/w
Lido
cain
e, m
g/m
l
EC excess phasesIPM excess phases
aqueous phase
Oil phase
(b)
Figure 4. Lidocaine concentrations in the (a) microemulsions, and (b) excess phases for linker-
based EC and IPM microemulsions.
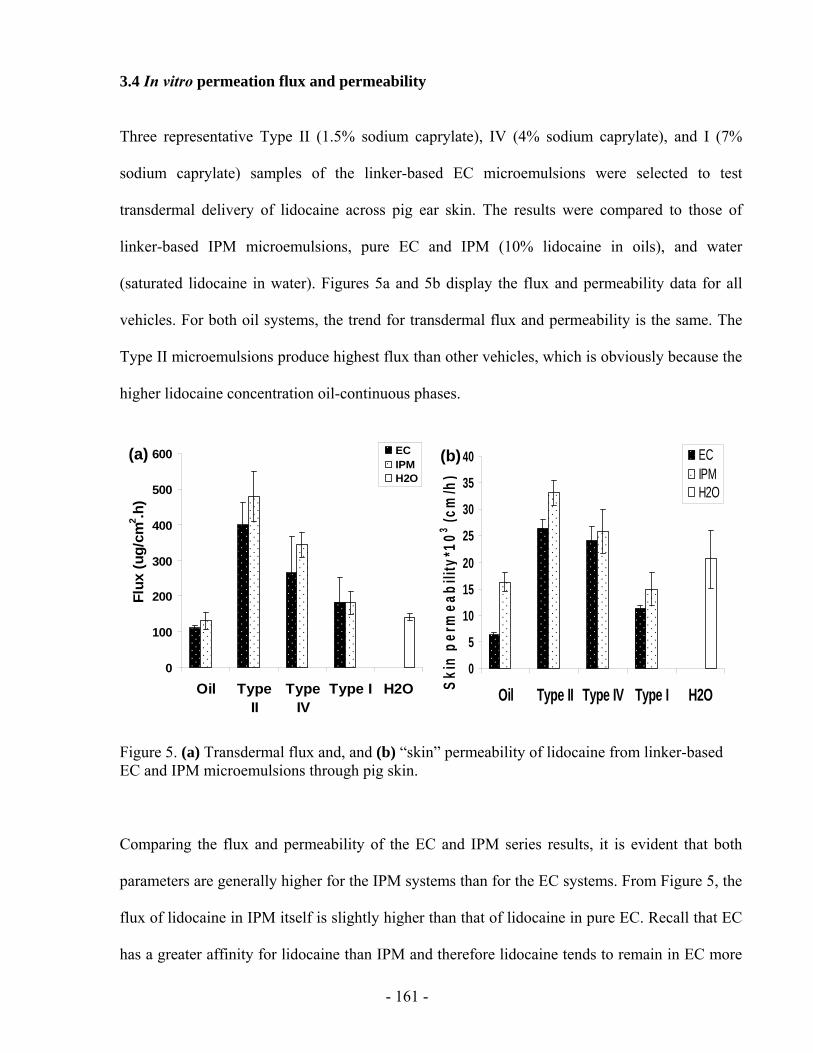
- 161 -
3.4 In vitro permeation flux and permeability
Three representative Type II (1.5% sodium caprylate), IV (4% sodium caprylate), and I (7%
sodium caprylate) samples of the linker-based EC microemulsions were selected to test
transdermal delivery of lidocaine across pig ear skin. The results were compared to those of
linker-based IPM microemulsions, pure EC and IPM (10% lidocaine in oils), and water
(saturated lidocaine in water). Figures 5a and 5b display the flux and permeability data for all
vehicles. For both oil systems, the trend for transdermal flux and permeability is the same. The
Type II microemulsions produce highest flux than other vehicles, which is obviously because the
higher lidocaine concentration oil-continuous phases.
0
100
200
300
400
500
600
Oil TypeII
TypeIV
Type I H2O
Flux
(ug/
cm2 .h
)
ECIPMH2O
(a)
0
5
10
15
20
25
30
35
40
Oil Type II Type IV Type I H2OSkin
per
mea
bilit
y*10
3 (cm
/h)
ECIPMH2O
(b)
0
100
200
300
400
500
600
Oil TypeII
TypeIV
Type I H2O
Flux
(ug/
cm2 .h
)
ECIPMH2O
(a)
0
100
200
300
400
500
600
Oil TypeII
TypeIV
Type I H2O
Flux
(ug/
cm2 .h
)
ECIPMH2O
(a)
0
5
10
15
20
25
30
35
40
Oil Type II Type IV Type I H2OSkin
per
mea
bilit
y*10
3 (cm
/h)
ECIPMH2O
(b)
0
5
10
15
20
25
30
35
40
Oil Type II Type IV Type I H2OSkin
per
mea
bilit
y*10
3 (cm
/h)
ECIPMH2O
(b)
Figure 5. (a) Transdermal flux and, and (b) “skin” permeability of lidocaine from linker-based EC and IPM microemulsions through pig skin.
Comparing the flux and permeability of the EC and IPM series results, it is evident that both
parameters are generally higher for the IPM systems than for the EC systems. From Figure 5, the
flux of lidocaine in IPM itself is slightly higher than that of lidocaine in pure EC. Recall that EC
has a greater affinity for lidocaine than IPM and therefore lidocaine tends to remain in EC more
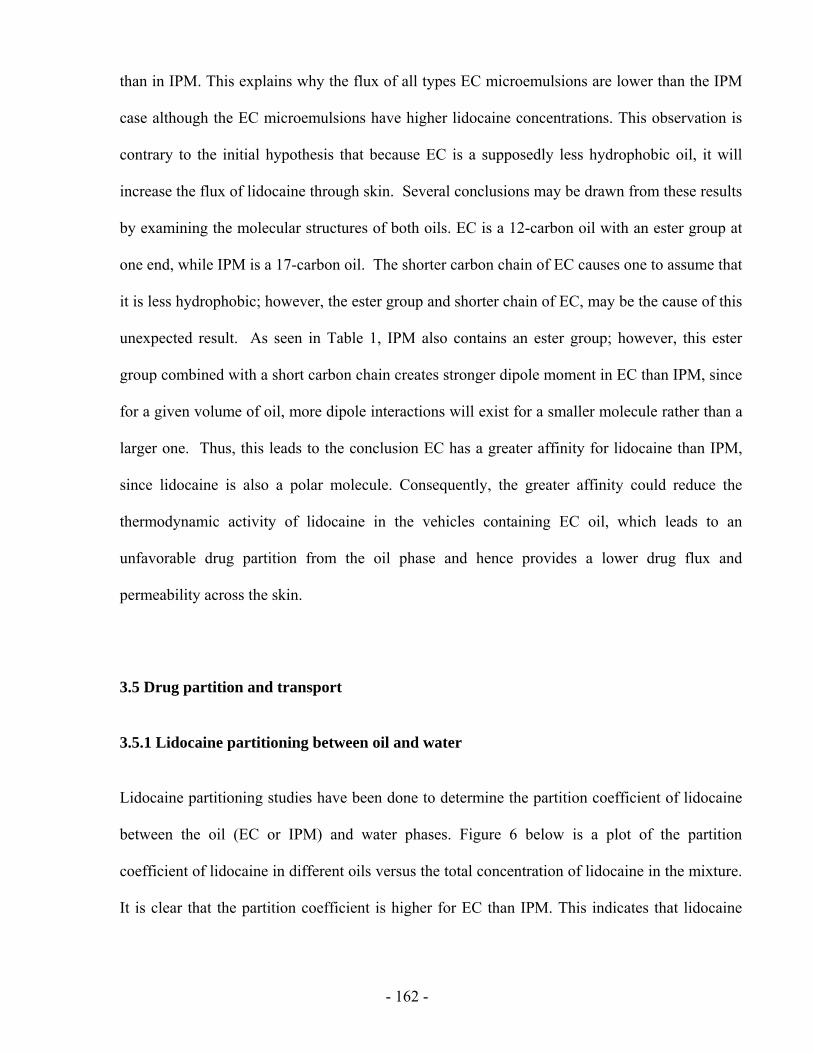
- 162 -
than in IPM. This explains why the flux of all types EC microemulsions are lower than the IPM
case although the EC microemulsions have higher lidocaine concentrations. This observation is
contrary to the initial hypothesis that because EC is a supposedly less hydrophobic oil, it will
increase the flux of lidocaine through skin. Several conclusions may be drawn from these results
by examining the molecular structures of both oils. EC is a 12-carbon oil with an ester group at
one end, while IPM is a 17-carbon oil. The shorter carbon chain of EC causes one to assume that
it is less hydrophobic; however, the ester group and shorter chain of EC, may be the cause of this
unexpected result. As seen in Table 1, IPM also contains an ester group; however, this ester
group combined with a short carbon chain creates stronger dipole moment in EC than IPM, since
for a given volume of oil, more dipole interactions will exist for a smaller molecule rather than a
larger one. Thus, this leads to the conclusion EC has a greater affinity for lidocaine than IPM,
since lidocaine is also a polar molecule. Consequently, the greater affinity could reduce the
thermodynamic activity of lidocaine in the vehicles containing EC oil, which leads to an
unfavorable drug partition from the oil phase and hence provides a lower drug flux and
permeability across the skin.
3.5 Drug partition and transport
3.5.1 Lidocaine partitioning between oil and water
Lidocaine partitioning studies have been done to determine the partition coefficient of lidocaine
between the oil (EC or IPM) and water phases. Figure 6 below is a plot of the partition
coefficient of lidocaine in different oils versus the total concentration of lidocaine in the mixture.
It is clear that the partition coefficient is higher for EC than IPM. This indicates that lidocaine
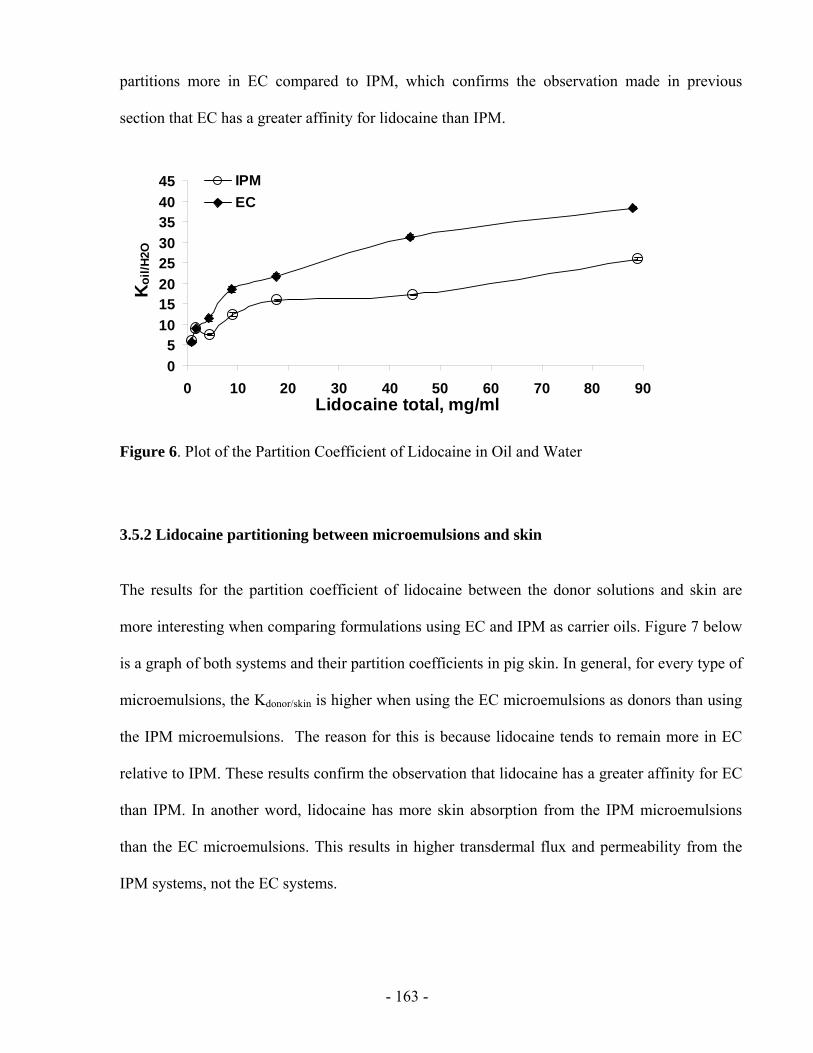
- 163 -
partitions more in EC compared to IPM, which confirms the observation made in previous
section that EC has a greater affinity for lidocaine than IPM.
05
1015202530354045
0 10 20 30 40 50 60 70 80 90Lidocaine total, mg/ml
Koi
l/H2O
IPMEC
Figure 6. Plot of the Partition Coefficient of Lidocaine in Oil and Water
3.5.2 Lidocaine partitioning between microemulsions and skin
The results for the partition coefficient of lidocaine between the donor solutions and skin are
more interesting when comparing formulations using EC and IPM as carrier oils. Figure 7 below
is a graph of both systems and their partition coefficients in pig skin. In general, for every type of
microemulsions, the Kdonor/skin is higher when using the EC microemulsions as donors than using
the IPM microemulsions. The reason for this is because lidocaine tends to remain more in EC
relative to IPM. These results confirm the observation that lidocaine has a greater affinity for EC
than IPM. In another word, lidocaine has more skin absorption from the IPM microemulsions
than the EC microemulsions. This results in higher transdermal flux and permeability from the
IPM systems, not the EC systems.
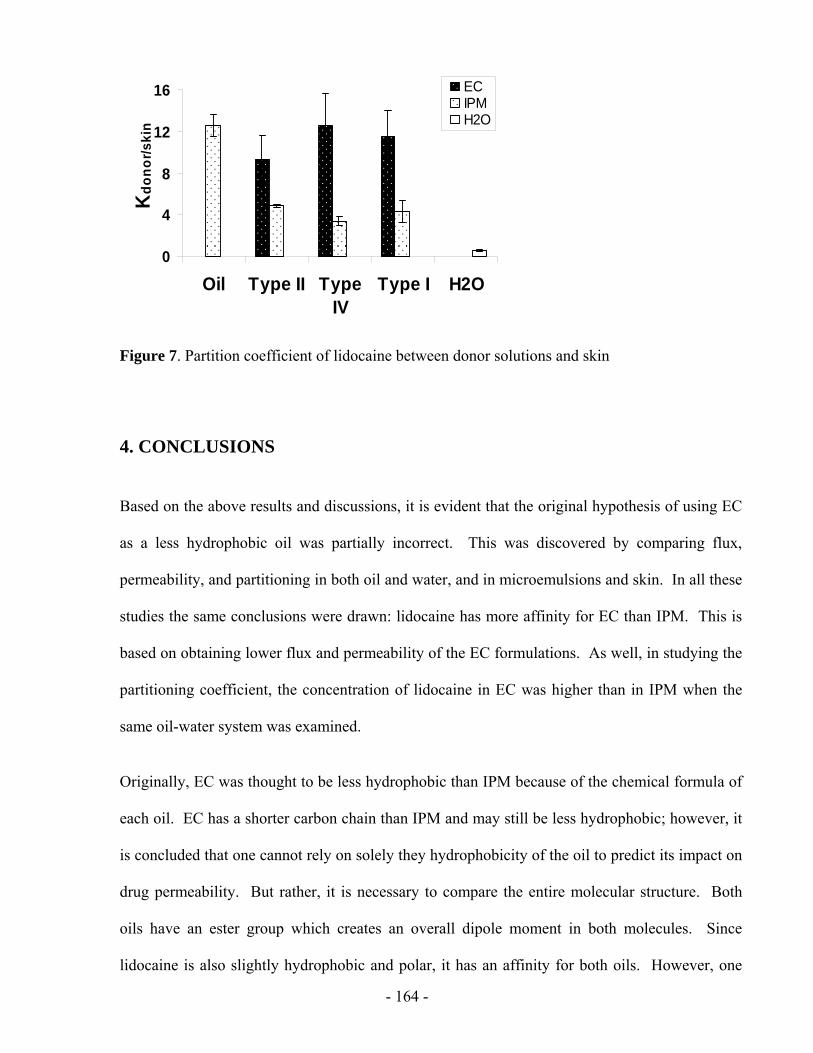
- 164 -
0
4
8
12
16
Oil Type II TypeIV
Type I H2O
Kdo
nor/s
kin
ECIPMH2O
Figure 7. Partition coefficient of lidocaine between donor solutions and skin
4. CONCLUSIONS
Based on the above results and discussions, it is evident that the original hypothesis of using EC
as a less hydrophobic oil was partially incorrect. This was discovered by comparing flux,
permeability, and partitioning in both oil and water, and in microemulsions and skin. In all these
studies the same conclusions were drawn: lidocaine has more affinity for EC than IPM. This is
based on obtaining lower flux and permeability of the EC formulations. As well, in studying the
partitioning coefficient, the concentration of lidocaine in EC was higher than in IPM when the
same oil-water system was examined.
Originally, EC was thought to be less hydrophobic than IPM because of the chemical formula of
each oil. EC has a shorter carbon chain than IPM and may still be less hydrophobic; however, it
is concluded that one cannot rely on solely they hydrophobicity of the oil to predict its impact on
drug permeability. But rather, it is necessary to compare the entire molecular structure. Both
oils have an ester group which creates an overall dipole moment in both molecules. Since
lidocaine is also slightly hydrophobic and polar, it has an affinity for both oils. However, one
- 165 -
can now presume that would have a stronger affinity for EC due to the very fact that it is the
smaller molecule of the two oils. This resulted in lower flux of lidocaine because it had a
tendency to remain in EC more than in IPM. As a result, the hydrophobicity of the oil is not
necessarily the only factor to be considered for drug delivery through the skin.
On the other hand, part of the hypothesis was found to be correct, because EC is easier to be
solubilized in microemulsions and the drug solubility in EC is high, therefore enhance the drug
solubilization capacity in linker-based microemulsions. In another words, lower surfactant
concentration can be used to create microemulsions using EC. This will ensure to reduce the
formulation cost and further reduce the surfactant toxicity probably for delivering another drug,
not lidocaine.
Overall, this project is successful in further proving that microemulsions are excellent drug
delivery vehicles, and that in choosing an oil in formulations, one must consider all of its
chemical and physical properties rather than only its hydrophobicity; as this does not prove to be
the main factor in affecting the permeability of the drug.
5. RECOMMENDATIONS
To further investigate the effect of oil on linker-based microemulsions as TDD vehicles, we need
to select study more oils and select one which is less hydrophobic than IPM but with lower
affinity for lidocaine.
- 166 -
6. REFERENCES
Acosta, E.J., Nguyen, T., Witthayapanyanon, A., Harwell, J.H., Sabatini, D.A., 2005. Linker-based bio-compatible microemulsions. Environ. Sci. Technol., 39, 1275-1282.
Kantaria, S., Rees, G.D., Lawrence, M.J., 2003. Formulation of electrically conducting microemulsion-based organogels. Int. J. Pharm. 250, 65-83.
Lawrence, M.J., Rees, G.D., 2000. Microemulsion-based media as novel drug delivery systems. Adv. Drug Deliv. Rev., 45, 89-121.
Malcolmson, C., Satra, C., Kantaria, S., Sidhu, A., Lawrence, M.J. 1998, Effect of oil on the level of solubilization of testosterone propionate into nonionic oil‐in‐water microemulsions, J. Pharma. Sci. 87,109-116.
Miñana-Perez, M., Graciaa, A., Lachaise, J., Salager, J. 1995, "Solubilization of polar oils with extended surfactants", Colloids and Surfaces A: Physicochemical and Engineering Aspects, vol. 100, pp. 217-224.
Montenegro, L., Carbone, C., Condorelli, G., Drago, R., Puglisi, G., 2006. Effect of oil phase lipopjilicity on in vitro drug release from o/w microemulsions with low surfactant content. Drug Devel. and Ind. Pharma. 32, 539-548.
Trotta, M., 1997. Effect of oil phase composition on the skin permeation of felodipine from o/w microemulsions. Die Pharmazie. 52, 50.
Warisnoicharoen, W., Lansley, A.B., Lawrence, M.J. 2000, Nonionic oil-in-water microemulsions: the effect of oil type on phase behaviour, Int. J. Pharm.198, 7-27.
Yuan, J. S., Ansari, M., Samaan, M., Acosta, E., 2008. Linker-based lecithin microemulsions for transdermal delivery of lidocaine. Int. J. Pharm. 349, 130-143.
- 167 -
APPENDIX 2
EFFECT OF DRUGS
ON LINKER-BASED LECITHIN MICROEMULSIONS
FOR TRANSDERMAL DELIVERY
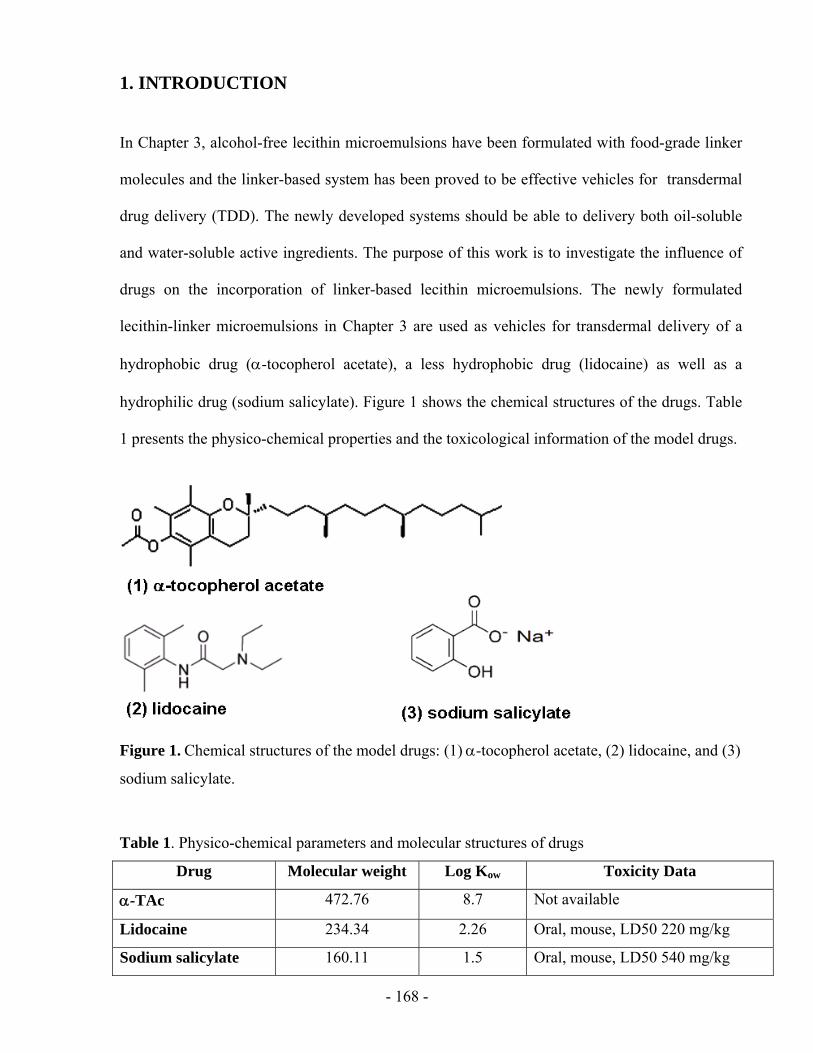
- 168 -
1. INTRODUCTION
In Chapter 3, alcohol-free lecithin microemulsions have been formulated with food-grade linker
molecules and the linker-based system has been proved to be effective vehicles for transdermal
drug delivery (TDD). The newly developed systems should be able to delivery both oil-soluble
and water-soluble active ingredients. The purpose of this work is to investigate the influence of
drugs on the incorporation of linker-based lecithin microemulsions. The newly formulated
lecithin-linker microemulsions in Chapter 3 are used as vehicles for transdermal delivery of a
hydrophobic drug (α-tocopherol acetate), a less hydrophobic drug (lidocaine) as well as a
hydrophilic drug (sodium salicylate). Figure 1 shows the chemical structures of the drugs. Table
1 presents the physico-chemical properties and the toxicological information of the model drugs.
Figure 1. Chemical structures of the model drugs: (1) α-tocopherol acetate, (2) lidocaine, and (3)
sodium salicylate.
Table 1. Physico-chemical parameters and molecular structures of drugs
Drug Molecular weight Log Kow Toxicity Data
α-TAc 472.76 8.7 Not available
Lidocaine 234.34 2.26 Oral, mouse, LD50 220 mg/kg
Sodium salicylate 160.11 1.5 Oral, mouse, LD50 540 mg/kg
- 169 -
DL-α-tocopherol acetate (α-TAc) is a typical hydrophobic component (its partition coefficient
between octanol and water log Kow=8.7) because of its longer carbon tail. It is a lipid-soluble
version of vitamin E and usually used in skin care products as emollient. It accumulates in the
epidermis and forms a barrier against moisture evaporation from the skin. α-TAc is also used as
a powerful antioxidant and free radical scavenger and helps prevent free radical damage in the
skin tissues. This drug has been incorporated in microemulsions containing mixed
phophatidylcholines (similar to phospholipids) (Darfler, 1990). A recent publication also
mentions microemulsion systems containing α-TAc (Kogan et al., 2008).
Sodium salicylate is a hydrophilic solute (log Kow=1.5). It is salt form of salicylic acid (BHA)
and is usually used for anti-aging purpose in skin care products. The phase behaviour of
microemulsions containing isopropyl myristate (IPM), lecithin, medium-chain alcohols and
sodium salicylate solution was reported by Aboofazeli et al. (2000). The authors only obtained
microemulsion systems in the oil rich part of the phase diagram, i.e. w/o microemulsions.
Lidocaine is less hydrophobic than α-TAc (log Kow=2.26), but it is still considered a
hydrophobic drug. The details of lidocaine incorporated in microemulsions have been discussed
in the dissertation.
2. MATERIAL AND METHODS
2.1 Chemicals
The materials and methodology used in this study are the same as those described in Chapter 3.
DL-α-Tocopherol acetate (97%+, Fluka brand) and sodium salicylate (99.5%+, Fluka brand)
- 170 -
were purchased from Sigma (St Louis, MO, USA) at the concentrations shown and were used as
received. Only pig ear skin was used for in vitro permeation studies.
2.2 Microemulsion preparation
The preparation of microemulsions was described in Chapter 4. Lidocaine or α-TAc was loaded
in the microemulsions by predissolving the drug in IPM to a concentration of 10%. Sodium
salicylate was loaded in the microemulsions by predissolving the drug in certain amount of water
to a concentration of 38%.
2.3 Drug quantification
Lidocaine quantification is described in Chapter 4. The concentration of α-TAc in the
microemulsions and excess phases was analyzed using a Dionex ICS-3000 (Sunnyvale, CA,
USA) liquid chromatography system consisting of single pump, detector, AS40 automated
sampler, AD25 absorbance detector and Chromeleon chromatography software (Dionex). α-TAc
was separated by a reverse phase column (Genesis, C18, 4 μm, 150×4.6 mm) and detected
through its absorbance at 284 nm (AD25 detector). A mixture of methanol and water (98:2, v/v)
was used as a mobile phase with a flow rate at 1.0 ml/min. The column temperature and the
injection volume were 25°C and 25µl, respectively.
- 171 -
3. RESULTS AND DISCUSIION
3.1 Phase behaviour of linker-based EC microemulsions
The linker-based microemulsions were formulated with 4% w/w (unless stated otherwise)
lecithin, 12% sorbitan monooleate, 1.5-7% sodium octanoate, 3% octanoic acid, 0.9% sodium
chloride, and 38% IPM solution. Individual drug was incorporated into the formulation by pre
dissolving the drug into oil (for lidocaine or α-TAc) or water (for sodium salicylate). With
increasing sodium caprylate (hydrophilic linker) concentrations, the system becomes more
hydrophilic and the following phase transition occurred: Type II (water-swollen reverse micelles)
– phase transition – Type I (oil-swollen micelles). Figure 2 displays the phase behaviour photos
for both systems and the numbers at the bottom of the picture represent the percent by weight of
sodium caprylate in each vial. From Figure 2, we can see that the phase behaviour of the linker-
based systems loaded with either α-TAc or sodium salicylate is very similar with that of the
systems loaded with lidocaine. Compared to the lidocaine-loaded formulations, the α-TAc-
loaded formulations require more sodium caprylate to reach a phase inversion. This may because
α-TAc is more hydrophobic and thus more hydrophilic linkers are needed to balance the
hydrophobicity of the systems. On the other hand, similar percentages of hydrophilic linker were
used for sodium salicylate-loaded formulations to reach the phase transition when compared to
lidocaine-loaded formulations. This fact is rather surprising because sodium salicylate is much
hydrophilic than lidocaine. In addition, there is no bicontinuous microemulsion formed in
sodium salicylate-loaded formulations.
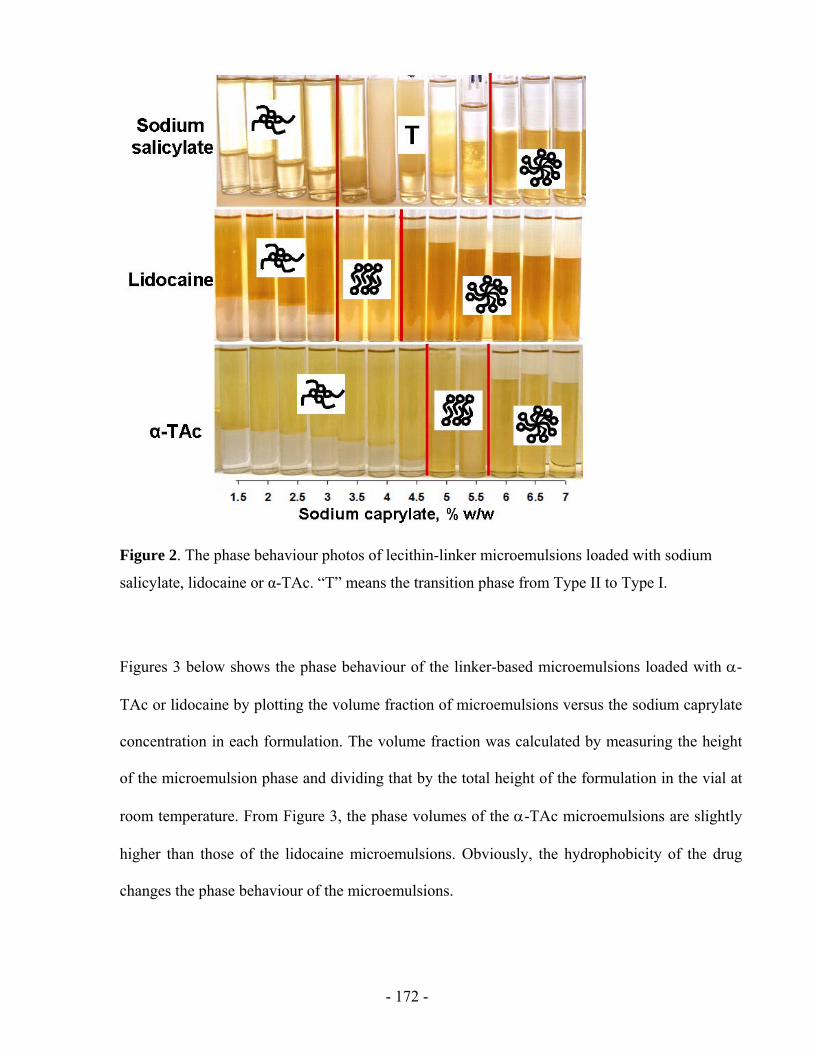
- 172 -
Figure 2. The phase behaviour photos of lecithin-linker microemulsions loaded with sodium
salicylate, lidocaine or α-TAc. “T” means the transition phase from Type II to Type I.
Figures 3 below shows the phase behaviour of the linker-based microemulsions loaded with α-
TAc or lidocaine by plotting the volume fraction of microemulsions versus the sodium caprylate
concentration in each formulation. The volume fraction was calculated by measuring the height
of the microemulsion phase and dividing that by the total height of the formulation in the vial at
room temperature. From Figure 3, the phase volumes of the α-TAc microemulsions are slightly
higher than those of the lidocaine microemulsions. Obviously, the hydrophobicity of the drug
changes the phase behaviour of the microemulsions.
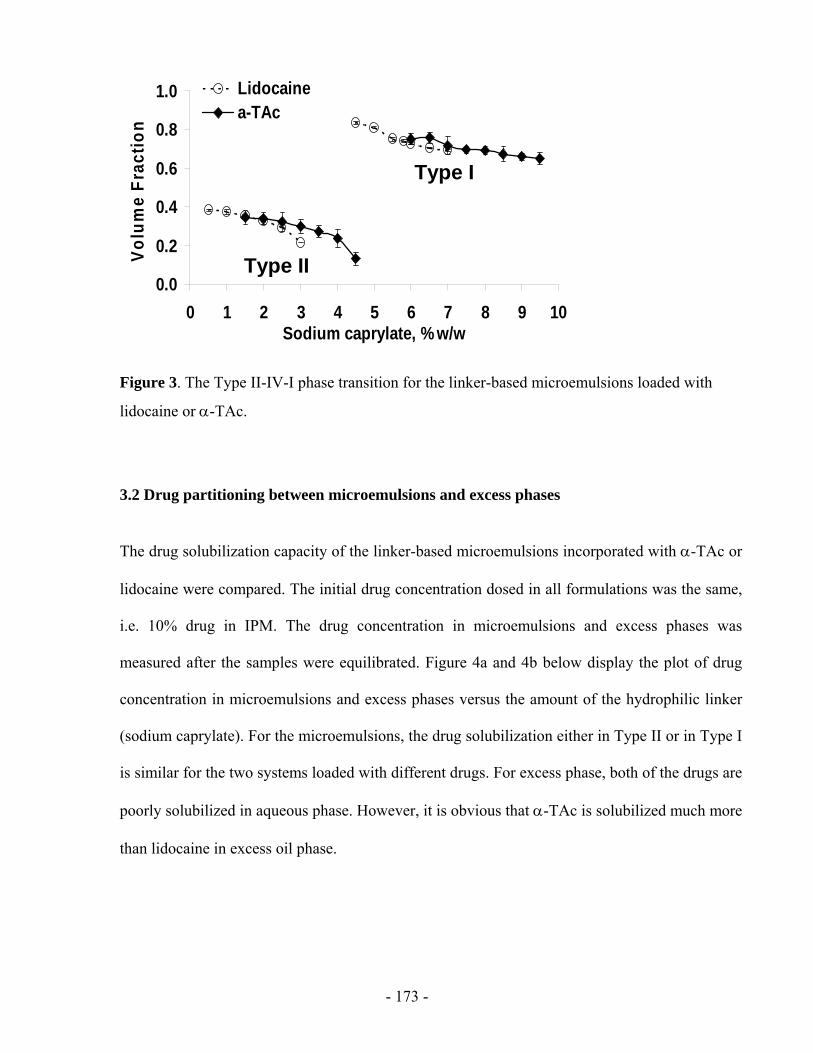
- 173 -
0.0
0.2
0.4
0.6
0.8
1.0
0 1 2 3 4 5 6 7 8 9 10Sodium caprylate, % w/w
Volu
me
Frac
tion
Lidocainea-TAc
Type II
Type I
0.0
0.2
0.4
0.6
0.8
1.0
0 1 2 3 4 5 6 7 8 9 10Sodium caprylate, % w/w
Volu
me
Frac
tion
Lidocainea-TAc
Type II
Type I
Figure 3. The Type II-IV-I phase transition for the linker-based microemulsions loaded with
lidocaine or α-TAc.
3.2 Drug partitioning between microemulsions and excess phases
The drug solubilization capacity of the linker-based microemulsions incorporated with α-TAc or
lidocaine were compared. The initial drug concentration dosed in all formulations was the same,
i.e. 10% drug in IPM. The drug concentration in microemulsions and excess phases was
measured after the samples were equilibrated. Figure 4a and 4b below display the plot of drug
concentration in microemulsions and excess phases versus the amount of the hydrophilic linker
(sodium caprylate). For the microemulsions, the drug solubilization either in Type II or in Type I
is similar for the two systems loaded with different drugs. For excess phase, both of the drugs are
poorly solubilized in aqueous phase. However, it is obvious that α-TAc is solubilized much more
than lidocaine in excess oil phase.
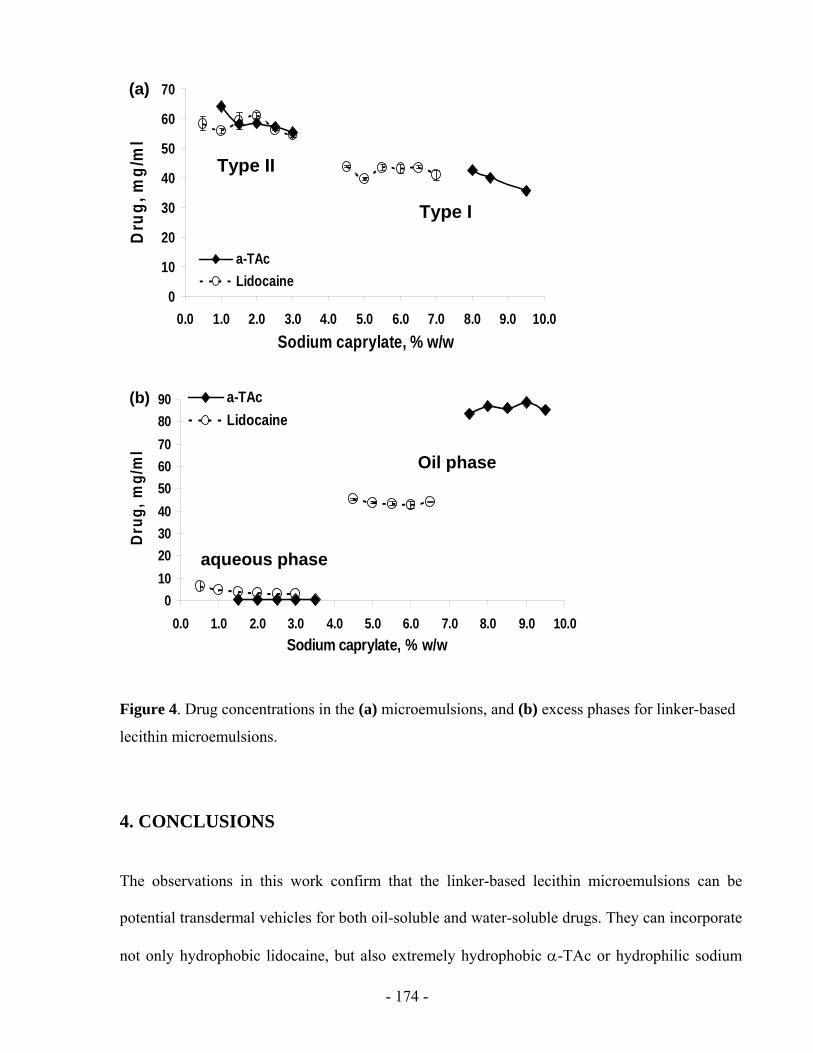
- 174 -
0
10
20
30
40
50
60
70
0.0 1.0 2.0 3.0 4.0 5.0 6.0 7.0 8.0 9.0 10.0Sodium caprylate, % w/w
Dru
g, m
g/m
l
a-TAcLidocaine
Type II
Type I
(a)
0
10
20
30
40
50
60
70
0.0 1.0 2.0 3.0 4.0 5.0 6.0 7.0 8.0 9.0 10.0Sodium caprylate, % w/w
Dru
g, m
g/m
l
a-TAcLidocaine
Type II
Type I
(a)
0102030405060708090
0.0 1.0 2.0 3.0 4.0 5.0 6.0 7.0 8.0 9.0 10.0Sodium caprylate, % w/w
Dru
g, m
g/m
l
a-TAcLidocaine
aqueous phase
Oil phase
(b)
0102030405060708090
0.0 1.0 2.0 3.0 4.0 5.0 6.0 7.0 8.0 9.0 10.0Sodium caprylate, % w/w
Dru
g, m
g/m
l
a-TAcLidocaine
aqueous phase
Oil phase
(b)
Figure 4. Drug concentrations in the (a) microemulsions, and (b) excess phases for linker-based
lecithin microemulsions.
4. CONCLUSIONS
The observations in this work confirm that the linker-based lecithin microemulsions can be
potential transdermal vehicles for both oil-soluble and water-soluble drugs. They can incorporate
not only hydrophobic lidocaine, but also extremely hydrophobic α-TAc or hydrophilic sodium

- 175 -
salicylate. Different types of microemulsions can be formed included Type II, bicontinuous
phases, and Type I.
5. RECOMMENDATIONS
To further investigate the effect of drugs, the in vitro permeation studies should be conducted to
test the drug release from the studied linker-based lecithin microemulsions.
6. REFERENCES
Aboofazeli, R., Mortazavi., S.A., Khoshnevis., P., 2003. In vitro release study of sodium salicylate from lecithin based phospholipid microemulsions. Iranian J. Pharm. Res. 95-101.
Aboofazeli, R., Mortazavi, S.A., Khoshnevis, P., 2000. Phase diagrams of lecithin-based microemulsions containing sodium salicylate. Daru 8 (3-4), pp. 1-7
Darfler, F.J., 1990. Preparation and use of lipid microemulsions as nutritional supplements for culturing mammalian cells. In Vitro Cellular and Developmental Biology – Animal. 26 (8),779-783. Kogan, A., Kesselman, E., Danino, D., Aserin, A., Garti, N., 2008. Viability and permeability across Caco-2 cells of CBZ solubilized in fully dilutable microemulsions. Colloids and Surfaces B: Biointerfaces. Article in Press
Yuan, J. S., Ansari, M., Samaan, M., Acosta, E., 2008. Linker-based lecithin microemulsions for transdermal delivery of lidocaine. Int. J. Pharm. 349, 130-143.
oil H2O H2O oil


