Light Emitting Diodes and the Lighting Revolution: The Emergence of a Solid-State Lighting Industry
Susan Walsh Sanderson Lally School of Management
Rensselaer Polytechnic Institute 110 8th Street
Troy, NY 12180-3590 USA
Tel: (518) 276-2933 Fax: (518) 276-8661
Email: [email protected]
Kenneth L. Simons* Department of Economics
Rensselaer Polytechnic Institute 110 8th Street
Troy, NY 12180-3590 USA
Tel: (518) 276-3296 Fax: (518) 276-2235
Email: [email protected]
Forthcoming in Research Policy
Second (Final) Revision, October 2013
First version May 2012
* Corresponding author.
Light Emitting Diodes and the Lighting Revolution: The Emergence of a Solid-State Lighting Industry
Abstract
Emergence of new industries from evolving technologies is critical to the global
economy, yet has been relatively understudied due to the paucity of available data. This study
draws lessons on industry emergence, by analyzing how a solid-state lighting (SSL) industry
grew out of light emitting diode (LED) technologies that evolved for half a century, with
participation by tens of thousands of researchers in universities, national laboratories, and firms.
Using data on publications, patents, and firms combined with business history we trace the
evolution of SSL through a succession of market niches. At times a few researchers with
unorthodox research approaches made breakthroughs that greatly advanced particular technology
trajectories and pushed LED research in unexpected directions. A succession of LED market
niches advanced the technology and provided profits to incentivize continuing research.
Innovating firms developed a thicket of patents and captured substantial profit, but were
embroiled in extensive litigation that was ultimately resolved through cross-licensing. A major
new generation of lighting products is now disrupting the traditional lighting industry. Although
the leading incumbent lighting firms all invested early and heavily in SSL, the industry’s future
leadership is uncertain.
Keywords: industry emergence, technology evolution, technological trajectories, market niches,
patent litigation, disruptive technology
1
Light Emitting Diodes and the Lighting Revolution: The Emergence of a Solid-State Lighting Industry
1. Introduction The light emitting diode (LED), first commercialized in the 1960s, is now poised to
replace most light bulbs with a high-tech alternative known as solid-state lighting (SSL). If SSL
achieves even a little of its expected potential, it will save energy and money compared to
existing light bulbs (incandescent and fluorescent), spur radical approaches to lighting design
and products, and integrate with electronic circuitry to facilitate surprising applications. By
2013, SSL replacement bulbs are common in stores and have reached a cost low enough to be
attractive to many consumers. Firms with SSL products have been flooding the lighting
industry: light emitting diode producers like Cree making solid-state replacement lights;
entrepreneurial startups like Soraa and BridgeLux creating new solid-state lighting devices; and
firms like Samsung and Sharp with experience in related technologies, now competing directly
with incumbent light bulb makers Philips, Osram-Sylvania, and GE in the newly emerged solid-
state lighting industry.
This study draws lessons from the co-evolution of basic science, industrial technology,
and niche applications that are stepping-stones to a mass market application. Development of
today’s SSL products required a maze of technology evolution, with false starts and unexpected
turns. The many thousands of researchers and organizations who developed these technologies
experimented with poorly understood materials, pioneered manufacturing methods, and
redesigned complementary technologies such as encapsulants, phosphors, driver electronics, heat
sinks, and fixtures to create light-emitting properties they needed. As these players interacted
and competed, they created new uses and markets for their technologies, from the initial red
indicator lights to calculator and watch displays, signs, flashlights, brake lights, traffic lights,
architectural lights, and backlights for mobile devices and televisions. Myriad characteristics
and colors that were developed along the way combine to make today’s efficient white light.
Solid-state lighting development was by no means a discrete event, but grew out of
multiple generations of technology, innovation, and niche applications. Once mere indicator
lights, LEDs made steady inroads into niche markets that provided stepping-stone profit
2
opportunities to help propel LED science and technology, not only affecting efficiency and cost
but also creating white-light emission techniques crucial for general illumination. Costs are
plummeting through ongoing improvement of upstream component manufacturing technology,
including for the semiconductor devices inside LEDs. Today’s solid-state lighting products are
opening an era of product experimentation and competition that promises new features and
architectures that are difficult to predict. Not only may solid-state lighting lead to different
wiring and fixture systems, but solid-state lights of the future may incorporate capabilities of
LEDs that seem totally foreign to existing light fixtures – for example, data communication
devices that extend (and exceed) the bandwidth of wireless routers; disease-causing organism
detection and eradication; automatic adjustment of color, intensity, and direction for users’
needs; and circadian rhythm regulation.
This case is doubly interesting because, like most emergent industries, the new SSL
industry is developing in competition with incumbent lighting technologies. By the early 2000s,
the dominant light bulb manufacturers in North America and Europe were Philips, Osram-
Sylvania, and GE, with other companies such as Toshiba predominant elsewhere. All suffered
low profitability given demand for cheap commodity lamps increasingly supplied from Chinese
and other less-developed country manufactories. Despite efforts at improvement, conventional
light bulb efficiency appears to be reaching fundamental physical limits. In contrast, research
from 1970 to 2000 was driving LEDs’ light output upward about 30% per year, with costs falling
about 20% per year, suggesting convergence with traditional lighting by about 2010 to 2015.
The leading lighting firms all foresaw the move toward solid-state lighting. The three Western
firms combined with semiconductor firms to create joint ventures that they would eventually
acquire, while Toshiba developed internal LED capabilities for displays and backlights, with all
firms apparently attempting to retain leadership in lighting products.
The findings provide an overview of key processes involved in the evolution of
technology and products as a new industry is created. This yields a stylized portrait that
coincides with findings reported by previous researchers for other industries. LED technology
(including a still nascent organic LED technology) went through a series of developmental
stages, each leading to development of products suitable for particular market niches. In many
cases firms entering LED-related niche markets developed technology and niche products in
ways that drew on their expertise in related industries, and profits from these stepping-stone
3
products spurred further technology development. Driving the drawn-out and punctuated
technology evolution were large numbers of scientists, including key individuals who developed
major technological breakthroughs. Successful commercial development and national research
expenditures enhanced the base of technology in ways that spurred succeeding technology
generations and, despite considerable patent litigation, led to the recent emergence of the general
illumination solid-state lighting industry.
2. The Process of Technology Development Although under-researched compared to periods after industry creation, technology
development preceding a new industry has been studied particularly by economists of industry
evolution and technological change and by historians of business and technology. These
researchers’ findings, and related work throughout economics, sociology, and management,
provide context to understand what is learned from solid-state lighting relative to previously
studied technologies.
2.1. Unpredictable Paths of Technology Evolution Research on technology evolution suggests, in contrast to simplistic models of
technology, that there are many paths to discovery and it is hard to predict which path will
succeed (Nelson and Winter, 1982). Many researchers work on similar topics simultaneously, to
the point that two or more scientists usually arrive at the same (broadly-defined) major scientific
invention (Merton, 1963). Although most studies of innovation and technology focus on
successful innovations, technology development includes many more unsuccessful attempts
(Pinch and Bijker, 1984, p.405; Basalla, 1988). Chance helps shape technology development
and may yield outcomes different from, and potentially inferior to, what could have been (David,
1985; Arthur 1988a, 1988b). For the safety bicycle, for example, many participants working
from 1879 to 1898 drove the gradual emergence of characteristics and features of the final
artifact (Pinch and Bijker, 1984, p.416).
Firms, and institutions such as universities, play a critical role in the development and
evolution of technology. New products and services, Nelson and Winter (1982) suggest, are the
basis on which firms compete, and the market is a ‘selection’ mechanism that determines which
products succeed or fail. While new products and services result from trial and error search,
4
firms are strongly influenced by ‘routines’ that they developed previously. These routines
provide a ‘self-replication’ mechanism somewhat akin to genes in biological competition.
Gradual technological advances may reach thresholds or combine in ways that have radical
market effects (Mokyr, 1990; Antonelli, 2008, pp.264-8).
Uncertainty, a hallmark of evolutionary theories, is thought by Nelson (1995, p.63) to be
resolved only through ex-post competition. Engineers with different ideas compete to solve
problems such as those described in Vincenti’s (1994) study of 1920s-1930s aircraft designers.
Engineers knew that the landing gear systems that attach wheels to a fuselage or wings could be
improved, but it was unclear which of different possibilities would prove best, and they
disagreed on where to place bets. New technologies progress from a crude form initially to
something more worthwhile economically, with capabilities unforeseen at the outset and only
discovered along the way (Nelson, 2005, p.30; Maggitti et al., 2013). Moreover, different new
technologies may interact in surprising ways making it very difficult to predict their future value
and use (Sahal, 1981, pp.71-4; Nelson, 2005, p.30). Technologies accumulate in particular
trajectories, such as separate military versus commercial aircraft trajectories (Nelson, 1995,
p.64), as knowledge builds up and developers seek to match market needs (Dosi, 1982).
2.2. Supply Push and Demand Pull As Schmookler (1966) concludes, technological progress depends on both blades of the
Marshallian scissors, supply and demand. Supply of science and technology, as measured
through amounts and timing of activity by technical field and industry, enhances businesses’
technology development and product creation (Adams, 1990; Adams et al., 2006). Technology
development increases the pool of skilled labor on which it depends (Nelson, 2005, p.107). If
the technology in which an industry is based has novel characteristics, new technical societies
and new technical journals tend to spring up. Further, technology-oriented sciences provide a
market-like environment that stimulates research and ties industries to universities through the
market of people with skills and research findings that enable a technology to advance.
Demand arises in alternative market niches. Market niches provide an opportunity for
firms to develop specialized products and learn by doing, typically advancing both product and
process technologies (Schot and Geels, 2007). Specialized niches with distinct needs trigger the
first application of the new technology and provide the impetus for further development
(Levinthal, 1998). Levinthal suggests that new technological forms emerge as a result of the
5
distinct selection criteria and the degree of resource abundance in each new domain, and a new
technological form may be able to penetrate other niches and even out-compete prior
technologies. For Levinthal, technological discontinuities are generally not the product of
singular events but the application of existing technological know-how to a new domain
(Levinthal, 1998, p.218). Creative destruction may occur when a technology that emerges from
one speciation event or niche is successfully able to invade another niche. In some cases, the
niches can coexist whereas in others, the technology may ultimately become viable in a
mainstream market. Smith and Raven (2012) study the role of niches as protective spaces for
path-breaking innovations, and identify three key properties of niches, shielding, nurturing, and
empowerment. A succession of niches, or ‘niche-cumulation,’ may help advance a technology
through a trajectory of changes (Geels, 2002). Rogers’ (2003) S-curve of growing sales over
time might be expected to apply within each of a series of successive niche markets, leading
eventually to a possible takeover of a mainstream market.
2.3. Patents and the Appropriation of Returns to Invention and Innovation Prospective profit encourages technology development, so long as firms’ technologies are
protected from excessive competition by mechanisms such as patents. Patent competition
models commonly involve patent races, in which two or more competitors race to develop a
technology and whoever develops the technology first captures all profits. Patent race models
however fail to reflect some key features of technology competition.
First, patents are not the primary means by which successful businesses protect their
profits. Surveys of managers have found that the mechanisms most useful in practice to protect
profits from new technologies are not patents but lead time; learning curves; complementary
manufacturing, marketing, and service efforts; and keeping process innovations secret (Levin et
al., 1987; Cohen et al., 2000). Similarly, managers use mechanisms beyond just patents to deter
competitive entry (Smiley, 1988). Successful technological pioneers, both individuals and firms,
rarely capture anything near the full financial returns of their inventions even if they obtain
patents on their technologies – for example, the difficulties of Charles Goodyear and Philo T.
Farnsworth in capitalizing on their inventions in, respectively, rubber vulcanization and
television have been documented extensively (Wolf and Wolf, 1936, p.309-33; Udelson, 1982;
Fisher and Fisher, 1996). Patents have limited protective ability partly because firms often
invent around a patent by using alternative technologies to accomplish the same goals, and also
6
because it can be difficult to develop a patent without (often unintentionally) overlapping with
another firm’s patents.
Second, many patents typically pertain to a product, and firms negotiate to license use of
each other’s portfolios of relevant patents. Ownership of parts of the thicket of relevant patents
gives firms leverage to license other firms’ patents on amenable terms (Hagiu and Yoffie, 2013).
Cross-licensing agreements can limit firms making high-technology products to a modest
number of players, with smaller firms possessing few relevant patents finding it more difficult to
participate in production of these products (Cockburn, MacGarvie, and Müller, 2010).
Businesses with especially important patents should do better in this process, although costs of
negotiation, lawsuits, and the large number of businesses involved may reduce the
disproportionate benefits of especially important patents. Rogers (1980, p.7) argues that the
uncertainty caused by patent fragmentation was a major reason for consolidation of lighting
firms in the late 1800s.
Third, incentives for R&D may remain strong despite an absence or limitation of patent
rights (Moser, 2013; Boldrin and Levine, 2013). Within an industry with ample opportunities for
product or process improvement, firms must race to keep up technologically lest they lose their
sales to faster-improving competitors. Such technological racing was crucial to firm survival in
industries like automobiles, tires, television receivers, and penicillin, and occurred despite patent
pools in which most firms were subject to advance agreements to license freely in three of these
four industries (Klepper and Simons, 1997). One might expect such technological racing to
occur also in the stepping-stone markets that lead up to development of a major product.
2.4. Invading Mainstream Markets Despite the difficulties inherent in invading an established market, occasionally radical
new technologies aid invading firms to outcompete incumbents (Cooper and Schendel, 1976;
Foster, 1986). This is usually expected to result in Schumpeter’s (1942) creative destruction,
with innovative market entrants replacing established producers of a product. Established firms
may find it most profitable to deliberately allow entrants to capture market leadership in a
technological transition, and to reap profit from the existing product while it lasts (Arrow, 1962;
Reinganum, 1983). Alternatively, established firms may fail to transition successfully to the new
product because it involves a very different technology (Majumdar, 1982; Tushman and
Anderson, 1986), because organizational structure and researchers’ mindsets prevent them from
7
understanding a different architecture in which component technologies are assembled
(Henderson and Clark, 1990), because the technological trajectory of a market niche outside
incumbents’ scope unexpectedly surpasses prior technologies’ trajectories (Christensen and
Rosenbloom, 1995; Levinthal, 1998), or because the new product is best produced using a
production philosophy unfamiliar to incumbents (Churella, 1998). Such technological transitions
do not necessarily displace incumbents. Incumbents with general dynamic capability to adapt
(Tripsas, 1997a), or with specialized complementary assets (Tripsas, 1997b; Rothaermel and
Hill, 2005), may be particularly able to transition to the new technology. A mix of entrants and
incumbents made the transition to previous disruptive technologies such as semiconductors
(Tilton, 1971).
Once a new product industry emerges from the technology development stage, fierce
competition usually follows as firms enter and seek to earn a share of the resultant profit. Most
industries eventually undergo a contraction in the number of producers, or “shakeout” (Gort and
Klepper, 1982, Klepper and Graddy, 1990). Substantial shakeouts are usually driven by a
process of technological competition in which firms sustain their advantage and large market
shares through continual innovation (Klepper and Simons, 1997, 2005). This process hints at the
fierce technological competition likely to follow in technology-intensive parts of the SSL
industry.
3. The Technology Light emitting diodes are semiconductor devices that emit light. They emerged from
discoveries and explorations in basic materials science and engineering. Their researchers
initially had little more than pure curiosity and wild ideas about the potential for what these
materials could become. To understand their story, a brief technical background will suffice.
Semiconductors are half way in between materials that conduct electricity and insulate
against flow of electricity. Semiconductors of different types are composed of atoms with
distinct properties that determine crystal structure and potential light emitting properties. For
example silicon and carbon appear in the fourth column of the second and third rows of the
periodic table of the elements, implying specific numbers of electrons in those atoms’ outer
orbits, so that silicon is called a group IV semiconductor and silicon carbide, which combines
two fourth-column elements, is called a group IV semiconductor compound. Group IV
8
semiconductors and compounds generally are not able to generate light. Particularly important
in the development of LEDs have been group III-V semiconductors, materials like gallium
nitride that combine atoms in the third and fifth columns of the periodic table of the elements.
LED light emission from ultraviolet through the visible colors and infrared can be attained with
different mixtures of various group III and V atoms.
The electrical properties of semiconductors change radically when tiny quantities of other
atoms are mixed into them. When a layer of semiconductor includes a few atoms that are
positive in the sense that they tend to capture free electrons, it is called a p-type semiconductor.
When it includes a few atoms that are negative in that they easily give up extra electrons, it is
called an n-type semiconductor. Adding these atoms to the semiconductor is called doping.
Early experiments with semiconductors baffled scientists at Bell Labs with strange and amazing
behaviors, which turned out to be driven by adjacent sections of semiconductor that accidentally
had p- and n-type impurities respectively (Gertner, 2012). Two layers of p- and n-semiconductor
together create a diode, which allows electricity to flow in only one direction. With the right
elements, electricity flow through the diode will cause it to emit light, in which case it is a light-
emitting diode. Light emitting diodes can be fabricated into laser diodes, by incorporating
materials that reflect light internally within a section and thereby stimulate further light emission;
laser diodes are used for example in laser pointers and optical fiber communications.
To build light emitting diodes, one needs a substrate on which layers of p- and n-type
semiconductor can be deposited. The semiconductor layers must be deposited on top so that the
substrate’s and layers’ atoms line up or match well with each other; poor alignment can cause
strain and defects in the semiconductor’s crystal structure and inhibit desired electronic and
optical properties. Depositing the layers on top is called epitaxy. Among several means to
perform epitaxy, a mass manufacturing approach is to surround the substrate with a hot gas, also
known as a vapor, whose molecules contain atoms to be deposited in a p- or n-type layer. This
approach is therefore termed vapor-phase epitaxy or chemical vapor deposition. When the
vapors contain special organic chemicals carrying group III elements, the process is called metal
organic chemical vapor deposition (MOCVD). Complex manufacturing machines that contain
the substrate and control the flow of vapor over it are called MOCVD reactors.
Much recent work has sought to replace the inorganic III-V LED materials with complex
electrically-conductive organic chemicals. If these materials can be manufactured and formed
9
into reliable light-emitters inexpensively, sheets of organic LEDs (OLEDs) might, in the future,
be printed continuously in roll-to-roll manufacturing processes at relatively low cost. OLEDs are
now used in more expensive forms for certain color displays and niche lighting applications.
4. Technology Push and Market Pull: Niche Stepping Stones1 LED development has been characterized by slow and incremental improvements and the
creation of new materials by multiple contributors over decades, many building on each other’s
findings. Some researchers discontinued avenues that did not seem fruitful, yet later some of
these were picked up by other researchers, in the same country or continents away. Technology
trajectories were not straight pathways but more like meandering paths that switched back and
forth, visible only in hindsight by picking out innovations that have proved to be important.
Researchers had to choose in real-time their research paths based on imperfect knowledge and a
desire to advance scientific knowledge or to produce products. “Trajectories” were punctuated
by many stops and starts, with initially promising technologies that led nowhere, and
technologies that at first seem unpromising that led to breakthroughs. Gallium nitride (GaN) was
just such an underdog technology—under-researched from 1974 until after p-doping difficulties
were resolved in 1989-1991—that enabled important products such as blue LEDs, blue lasers,
and white backlighting for mobile devices and televisions.
4.1. Red and Orange LEDs Work on bulk growth of III-V semiconductor compounds began in the early 1950s, and
these materials proved to be efficient light emitters and became the first foundation for the
development of LEDs. Heinrich Welker, a German materials scientist who made important early
contributions to the field, worked at a Westinghouse subsidiary in Paris where he developed a
transistor around the same time parallel work was going on at Bell Labs. Transistors mattered,
because theoretical understanding of transistors gave just the right insight to foresee the
possibility of LEDs (Holonyak, 2013). From 1951 to 1961, Welker headed the solid-state
1 Sections 4 and 5 draw primarily from Schubert (2006) and Johnstone (2007), and also from
Fasol (1996) and Riordan (2005), with other sources cited in the text except where information is
widely available from trade sources.
10
physics department of Siemens-Schuckerwerke, where he developed III-V compounds to replace
silicon semiconductors. By the 1960s infrared LEDs and lasers based on gallium arsenide
(GaAs) were being worked on by groups at RCA, GE, IBM, and MIT. IBM’s Thomas J. Watson
Research Center in Yorktown Heights, NY included many active researchers working on GaAs
and combined aluminum gallium arsenide (AlGaAs) plus GaAs devices.
Researchers at these major industrial labs were motivated by scientific curiosity and by
applications these new materials might enable. GE employees Nick Holonyak Jr. and Sam F.
Bevacqua reported the emission of visible light in 1962 using gallium arsenide phosphide
(GaAsP) LEDs. Holonyak envisioned applications for the devices including indicator lights and
numeric and alphanumeric displays. The group deposited GaAsP from gaseous source chemicals
on top of GaAs substrates, in a technique known as vapor-phase epitaxy, successfully creating
LEDs. However these early devices had several problems including rapid degradation of the
light output.
GE was first to sell small commercial quantities of GaAsP LEDs in the early 1960s for a
price of $260, but it was Monsanto Corporation that developed mass production processes for
LEDs. In 1968, it set up a factory that produced low-cost GaAsP. Monsanto’s LEDs were based
on GaAsP p-n junctions grown on GaAs substrates, and they emitted light in the visible red
range. At the time, Monsanto was collaborating with Hewlett-Packard (HP) with the idea that
Monsanto would provide the raw material for HP-made LEDs. However, HP worried about a
single source for its raw material and started growing its own GaAsP.
Among the first applications of GaAsP LEDs was indicator lights on circuit boards, for
example a status indicator for data processing on IBM System 360 mainframe computers. Texas
Instruments was also active in developing LEDs for commercial use during the 1960s, but sales
were low as prices for the LEDs were about $130 for a single LED. As these materials improved
and dropped in price, they were used in video and audio remote controls and as sources for local
area communications.
Calculators and wristwatches were important emerging markets for these early LEDs
from the late 1960s to the mid-1970s, and several U.S. and Japanese firms were very active in
developing LEDs and the products that used them. The first digital wristwatch with an LED
display was developed by Hamilton Watch Company. Numeric displays in pocket calculators
11
were another important early application of LEDs. However LEDs were too dim to read easily
in daylight and were displaced by liquid crystal displays in watches and calculators in the 1980s.
In 1979, Monsanto, which since 1968 had made LED calculator and watch displays, sold
its optoelectronics business which eventually became part of Taiwanese LED manufacturer
Everlight Electronics.2 M. George Craford, one of Monsanto’s leading LED researchers, moved
to HP where he became the central developer of their LED technology and business. HP was to
continue to play an important role in the development of LEDs until 1999, when HP spun off its
LED and scientific instrument businesses into Agilent Corporation. Agilent co-founded
Lumileds Lighting Corporation in 1999 as a joint venture with Philips Corporation, and in 2005
Agilent sold its share of Lumileds to Philips. While GaAsP materials played an important role in
the early LED industry, technical limitations of these material emerged and today they are used
primarily for low-cost, low-brightness red LEDs for indicator lights.
Another major advance in LEDs was the development of GaP and GaAsP LEDs doped
with optically active impurities. This work was pioneered at AT&T Bell Labs by a research
group developing manufacturing processes for GaP-based red and green LEDs. While GaP does
not emit light on its own, because of properties (indirect band gaps) similar to group IV
elements, it strongly emits light when doped with certain impurities (optically active
isoelectronic impurities) such as nitrogen. A group at AT&T reported the first demonstration of
reproducible growth of efficient LEDs and through a series of technical advances was able to
improve efficiencies by an order of magnitude over previous materials. The approach was aided
by materials manufacturing innovations; by the end of the 1960s, ingots of GaP grown from
2 The Monsanto optoelectronics business was initially sold to General Instrument, then was
temporarily in the hands of private investors who named it Quality Technology, then was
combined with Philips Optoelectronics and Harris Optoelectronics (formerly GE
Optoelectronics) and renamed QT Optoelectronics (Rostky, 1997), and then in 2000 QT
Optoelectronics was sold to Fairchild Semiconductor, which in 2006 sold its LED business to
Everlight Electronics, a leading Taiwanese LED manufacturer. Although this chain of
acquisitions is unusually complex, it is indicative of how companies shifted strategic investments
in major optoelectronics developers as the technology’s uncertain trajectories played out.
12
melts at high temperature and pressure were becoming available and were suitable for being cut
into substrates.
Nonetheless GaP and GaAsP would not remain dominant indefinitely. In 1992, spurred
(industry experts tell us) by GaAsP work and development of MOCVD reactors, aluminum
gallium indium phosphide (AlInGaP) created many markets impossible with the previous GaAsP
and GaP materials, as it increased light output from 1-2 to 10-20 lumens per watt of electricity.
These developments opened the market for automobile taillights and later traffic lights. Bright
red LEDs were briefly made with AlGaAs in the early 1990s, but today bright red and orange
LEDs both are made with AlInGaP. GaP diodes are still used for many LED indicator lights.
4.2. Early Work on Green and Blue LEDs Green LEDs were also developed, and in particular green LEDs using nitrogen-doped
GaP (GaP:N) became widely used for low-brightness green indicator lights. In an early
application, AT&T used green LEDs in its Trimline telephone. These green LEDs were not very
bright but nonetheless began to fill out the color spectrum available from LEDs, spurring
consideration of applications that spanned a greater range of colors.
RCA, one of the early radio and TV pioneers, envisioned that televisions would one day
be thin enough to hang on a wall. RCA’s vision for a flat panel display required the
development of new light emitters that could replace cathode ray tubes that used three electron
guns to display color images. A chief proponent of RCA’s vision was James Tietjen, Director of
RCA’s Materials Research Division. Tietjen realized that red LEDs using GaAsP and green
LEDs using GaP:N technology were already available, but what was needed to complete the
display was a bright blue LED.
Tietjen challenged Paul Maruska, one of his young employees who had been growing
GaAsP red LEDs in the lab, to find a method for growing single-crystal films of GaN using the
metal-halide vapor-phase epitaxy method that Tietjen felt would yield blue LEDs.3 The work
went on at the RCA lab and at Stanford where Maruska was working on his PhD. While the
RCA-Stanford team did achieve light emitting devices, these operated through a different
physical mechanism than conventional LEDs and were never very efficient, yielding no
3 Maruska’s experience is documented in his unpublished recollection “A brief history of GaN
blue light-emitting diodes” (obtained from sslighting.net).
13
commercial product. Another RCA researcher, Jacques Pankove, and his coworkers made in
1971 the first GaN metal-insulator-semiconductor (MIS) diodes that emitted green and blue
light, but these devices also were inefficient. By 1974, RCA was suffering major losses in its
business lines, and its work on blue LEDs was stopped. Elsewhere work on GaN also stopped
until the late 1980s, when researchers in Japan began work on this III-V semiconductor material.
4.3. Search for a Viable Blue LED For over 25 years before the development of methods to use GaN to make superior blue
and green light emitters, most commercial and university laboratories had worked on II-VI
compound semiconductors such as ZnS, ZnSe, and ZnMgS. Although large sums of money
were spent on these efforts they did not yield viable commercial products, largely because of
short operational lifetimes.
As we saw earlier, GaN electroluminescence diodes had been demonstrated at RCA
Laboratories in the 1970s but the company dropped its research in this area as a result of
competitive problems in its key businesses. Only a few groups, mostly in Japan, were trying to
solve the three major problems that had stymied earlier researchers: a lack of suitable lattice-
matched epitaxial substrates, thermal convection problems due to very high growth temperatures,
and inability to achieve p-type doping. The most important of these researchers were Isamu
Akasaki of Nagoya University (partially funded by Matsushita Electric Industrial Company) and
Shuji Nakamura at Nichia.
Shuji Nakamura, a product development engineer at Nichia Chemical Industries, a small
company in Anan on Japan’s southern island of Shikoku, was working with GaN and indium
gallium nitride (InGaN), a compound-semiconductor alloy most other researchers had dismissed
as useless for LED manufacturing because of its many defects.
Akasaki and Nakamura, working separately, each developed similar technologies to
achieve lower-defect GaN epitaxial growth using MOCVD methods (Amano et al., 1986;
Nakamura, 1991). Akasaki chanced upon a partial solution to the long-standing failure to
achieve p-type doping in GaN materials, by using a low-power beam of electrons in an electron
microscope to activate magnesium, long thought to be the best impurity for making p-type GaN.
Nakamura, however, solved the problem another way (Fasol, 1996). He knew that all previous
GaN researchers had annealed their samples in ammonia (which is also used to grow GaN) as the
samples cooled to room temperature following epitaxial growth. During that cooling process,
14
ammonia decomposes to generate atomic hydrogen, which deactivates the p-type doping. This
hydrogen passivation problem was well-known to III-V semiconductor researchers, and with
their knowledge, industry experts suggested to us, the problem might have been solved ten years
earlier, but the GaN LED researchers lacked their knowledge. Nakamura developed a post
growth annealing process in a pure nitrogen atmosphere, driving out the hydrogen and yielding a
reliable method to achieve high-quality p-type GaN materials. The result was the development
of commercial GaN LEDs that were about 200 times as bright as previous blue and green LEDs.
This invention also initiated a race to develop the first commercial GaN-based blue laser diodes.
In 1992, Nichia’s first visible blue and green InGaN triple-layer (“double
heterostructure”) LED achieved efficiencies of 10%. Nakamura continued to modify industry-
standard chemical vapor-deposition equipment to achieve the uniform, nanometers-thin layers
needed to emit copious blue light. Later Nakamura used InGaN to produce the first pulsed and
continuous blue lasers operating at room temperature, something others had thought impossible.
Nichia’s InGaN blue laser quickly led to commercial applications including for DVD-ROMs and
Blu-ray discs, because data density could be about four times higher using the shorter
wavelength of blue laser light.
The InGaN LED was a watershed for the lighting industry as it was a key enabler for
white LED lighting. In addition to red, green, and blue facilitating color displays, the three
colors can be mixed to create a combination perceived as white. The red and green parts of the
spectrum can also be created by shining blue light onto phosphors, chemicals that convert part of
the higher-energy blue light to lower-energy light of other colors including red, green, and
yellow. Phosphors (primarily for early color TVs and fluorescent lighting) had been Nichia’s
core business, so the firm was well placed to produce white light from LEDs by combining blue
LEDs with yellow phosphors – a combination of colors that is seen as white.
In 1996, Nichia introduced the first white LED, by covering a blue LED with yellow
yttrium aluminum garnet (YAG) phosphor. White LEDs based on phosphors have a color
distribution fixed by the phosphor thickness, eliminating the necessity for electronic controls to
balance outputs of red, green, and blue LEDs. Thus, bright blue LEDs made it possible to
develop a simple white LED light and take on more traditional lighting technologies that had
been developed over the previous 100 years. This development triggered a series of patent
15
disputes, described in section 5, that ultimately would end in cross-licensing agreements but only
after years of bitter lawsuits.
4.4. Green Efficiency: An Ongoing Challenge
Nakamura’s InGaN LEDs also demonstrated the means to produce green light much
brighter than from previous GaP:N LEDs, without having to resort to phosphors. Phosphors
work well to produce green and lower-frequency colors from blue or ultraviolet, but this exacts a
price in terms of reduced energy efficiency. Also, one must search for a phosphor or
combination of phosphors that yield a desired mixture of shades of green and nearby colors.
Therefore, ideally green light would be emitted directly from LEDs, and fortunately InGaN and
GaN LEDs can be tailored to cover the entire range of green. An ongoing challenge however is
the so-called “green gap,” in which green light output efficiency falls especially rapidly with
electrical current. The green gap is an active focus of research today. Nonetheless, the red,
green, and blue LEDs now available can be used either with or without phosphors for both color
displays and general illumination white-light applications.
4.5. Stepping Stones: LED Product Niches LEDs have now effectively substituted earlier lighting technologies in a successive list of
product categories. Many of these product categories are documented in Table 1. LEDs found
application as indicator lights, calculator displays, signage, flashlights, headlamps, traffic lights,
and emergency lights, and they are increasingly being used in streetlights, outdoor lights,
architectural lighting, and backlighting for mobile devices and TVs. Traffic signals were an
early LED application as LED traffic lights promised an extended lifetime, reducing the
frequency of difficult bulb changes, and would not burn out suddenly. Other hostile outdoor
environments such as architectural lighting have also been early adopters of LEDs.
Today, LED lighting systems are, at least technically, capable of replacing just about
every conventional (incandescent and fluorescent) lighting source in use. Estimates for 2010
market penetration of LEDs as the type of lighting appear in Figure 1, for market niches broken
out by Strategies Unlimited.4 In exit signs, LEDs were well along the S-curve of product
4 Market penetration differs by geographic region and application, and is affected by government
policies, energy prices, and events such as the 2011 tsunami in Japan.
16
diffusion, with over 90% of sales, and in flashlights LEDs were nearing 90% diffusion. In
entertainment (particularly liquid crystal televisions), architectural lighting, and retail refrigerator
displays, LEDs were well into the middle of the diffusion curve. White LED lights were gaining
sales in more standard lighting applications, with around 5% of outdoor area lighting and
commercial and industrial lighting sales, but in some applications such as solar-powered street
lighting and, most notably, residential lighting, LED sales were just beginning as of 2010.
Diffusion has been especially rapid in China, with national subsidies to purchase SSL
streetlights, and Japan, which after the March 2011 tsunami experienced electricity shortages.
5. Patent Wars and Nitride LED Competition Once the creation of commercially viable blue LEDs became known, many companies
contacted Nichia to license this important new technology. In the past, Nichia had developed
novel technologies only to have larger companies take most of the market. To protect itself from
competition from larger companies with greater access to resources and market experience,
Nichia refused to license its LED innovations to other companies. Based on the work of
Nakamura and his associates, Nichia took the lead in commercializing nitride-based LEDs,
introducing its first devices in 1993.
Nichia had a first-mover advantage as a result of Nakamura’s important inventions, and
the firm decided to invest in MOCVD reactors to produce the LEDs in-house. Their decision to
go it alone coincided with the explosive popularity of mobile phones with color liquid crystal
displays, which required white backlights, and the subsequent demand for the inclusion of white
LEDs in mobile phones created high sales and profits (Kishi and Takahashi, 2010). Using their
experience in producing phosphors to complement their work in LEDs, Nichia had a virtual
monopoly on white LED demand and an overwhelming share of the white LED market, at least
initially. But their refusal to license their blue LEDs led to a backlash among firms that thought
they had a right to produce blue LEDs based on their own research.
Toyoda Gosei started developing GaN LEDs in 1986, working in part with Nagoya
University and its fellow Toyota group companies. The company developed methods similar to
Nichia’s at almost the same time. Toyoda Gosei applied its LEDs quickly to automobile
applications, with blue (in 1991), green, purple, and high-brightness white LEDs (Stettier and
Leslie, 2010). Its blue LEDs were developed in 1991 after five years of effort, and reached mass
17
production in 1995. This triggered, in August 1996, a legal response by Nichia.
Nichia filed with the Tokyo District Court a series of patent infringement lawsuits, the
1996 suit plus five more in 1998, alleging that Toyoda Gosei violated its blue LED patents. The
Court found Toyoda Gosei in violation and ordered it to stop manufacture and sale of its LED
products and provide compensation of 104.86 million yen to Nichia. However, countersuits and
appeals by Toyoda Gosei prevented a simple win for Nichia.
Other cases followed, including Nichia’s 1999 patent infringement suit against Cree, and
Nichia suits against Epistar, Everlight, and Seoul Semiconductor. However, some judgments
significantly weakened Nichia’s legal position, and lawsuits often led to countersuits, deterring
the incentive to sue. Countersuits were aided by the fact that more than one LED technology
might be relevant to a product, and this increased the potential for countersuits, whether
obviously relevant or not. Cree countersued forcefully on the basis of an earlier GaN patent
licensed from Boston University. Patent-related lawsuits were common among developers of the
technology, and while Nichia’s case stands out, other major firms also filed against each other.
Many such cases eventually resulted in settlements with agreements to cross-license most
of the relevant patents. Nichia and Toyoda Gosei’s September 2002 settlement effectively
permitted use of each other’s patents, but with Toyoda Gosei paying royalties to Nichia for
production of white LEDs using YAG phosphor. Nichia and Cree’s November 2002 settlement
allowed use of all GaN patents, including high-brightness LED and blue laser technologies, but
excluded other technologies including Cree’s silicon carbide LED patents, which are relevant to
different LED types. Nichia signed a broad cross-licensing agreement with (Philips) Lumileds in
October 2002, and a more narrow agreement for InGaN patents and related packaging
technology with Osram in June 2002. Osram and Nichia had cross-licensed many core LED
technologies earlier, after Osram obtained rights in 1996-7 to a Fraunhofer Institute patent with a
priority date near Nichia’s covering the same white light LED technology that Nichia patented.5
5 Prior patents also used phosphors for visible-light LEDs, starting with a patent filed in 1969 by
Bell Labs.
18
6. Institutions Leading in LED Technology Development The meandering paths of technology development coincided with a shifting group of
universities, firms, and government laboratories carrying out LED research. Organizational
rankings by citations of inorganic LED-related papers are shown in Table 2 (see Appendix A for
methodology). Organizations’ activity sometimes resulted because of interests or chance
discoveries of their researchers, but usually the organizations had made strategic decisions about
their research areas. Bell Labs, for example, had long sought solid-state devices to replace
vacuum tubes as amplifiers for telephone signals, and considered new materials as means to
create and improve the many components of telephone systems. This led directly to its work on
semiconductors, diodes including light emitting diodes, the transistor, and solar cells (Gertner,
2012). Hence Bell Labs appears at the top of Table 2 as the most-cited institution for work done
during 1945-1981. RCA’s role has been mentioned earlier, driven by the dream of thin
televisions that could hang on a wall, and RCA appears second in the list for 1945-1981. Other
institutions highly active during 1945-1981 include firms active in telephony, computing,
electronics, semiconductors, and chemicals, as well as universities.
During later periods, shifts in the most-cited organizations show that work later perceived
as particularly important occurred in different institutions. Firms soon showed less frequent
journal publication, not because they ceased research on LEDs but because they increasingly
relied not on journal publications but on patents. A few firms are exceptions, with Nichia
propelled into the ranking in 1982-1991 by Nakamura’s groundbreaking 1991 paper, and
continuing to appear in 1992-2001 and 2002-2006 with his continuing work, and Samsung
appearing in 2007-2012. University work on LEDs has been most prominent at strong
technological universities, among them the Massachusetts Institute of Technology (MIT), the
University of Illinois at Urbana-Champaign, North Carolina State University, Rensselaer
Polytechnic Institute, and – most prominently in recent years – the University of California at
Santa Barbara. At North Carolina State University, Robert Davis was the most-cited inorganic
LED researcher during 1982-1991, and three students and a research assistant from Davis’s lab
started the leading U.S. LED chip manufacturer, Cree. The University of California at Santa
Barbara’s faculty includes Nakamura, who moved away from Nichia (Johnstone, 2007), and
several other well-known LED researchers including Steven DenBaars. These highly respected
researchers recently established a startup firm, Soraa, which achieved strong sales of a common
19
light bulb type, the MR-16, through an unconventional approach: GaN substrates at the base of
its LEDs enhance crystalline quality and hence light output at high electric current, allowing the
high expense of GaN substrates to be offset by carving wafers into many small high-current LED
chips. Activity leading to publications also grew more international over time, and in the most
recent decade, entrants in Taiwan, China, and Korea became especially prominent in LED
science.
As time went on, the annual number of LED-related publications grew exponentially.
From about 25 publications per year in the mid-1950s, the publication rate grew to about 125 per
year in the mid-1970s, 614 in 1992, and 4,181 in 2011. This growth in publications is apparent
in Figure 2, for which the vertical axis is logarithmic. Growth in publications reflected a
spiraling of the number of researchers involved as increasingly many scientists, engineers, and
businesses grew interested in the technology. A similar exponential growth is apparent in
patents, for which the growth rate from the mid-1950s to the late 1980s was about 10% annually,
similar to the growth rate in publications. Growth in publications and especially patents
accelerated in the 1990s and 2000s as commercial applications intensified.
Publications indicate where basic science initially developed, but product development
innovation is measured better through patents. Patents are filed by all businesses that need to
defend intellectual property rights to their technologies, whereas articles are published only by
some firms. Leading patenting institutions are listed in Table 3 (see Appendix A for
methodology), for the same time periods as Table 2 by date of application, except that the latter
two periods are combined (otherwise international differences in delays between patent
application and granting would bias results in the most recent period which would have small
numbers). Patent quality is measured by multinational patent filing and patent grants, since firms
rarely pay the expense of filing for a patent in multiple nations unless that patent is likely to have
commercial value. The table is ordered, therefore, by the number of patents granted in multiple
nations. To show when firms’ recent technological strength built up, older organizations are
reported under the names of their current parent firms, so figures for Philips include Color
Kinetics, and figures for Siemens include Osram and Sylvania.
The major four traditional lighting firms’ pursuit of LED technologies is apparent since
Philips, Siemens, GE, and Toshiba are prominent in Table 3. During the earliest period, 1945 to
1981, many of the same early technology developers who published frequently, IBM, AT&T,
20
RCA, and Westinghouse, also received patents for their LED technologies. Several Japanese
electronics and lighting firms also played a prominent role during that early period. The role of
the Japanese firms grew in the 1980s and 1990s as Japanese firms became dominant producers of
LEDs. The three traditional lighting firms remained important, although GE quickly slipped
below the top ten ranking. Two Korean firms, Samsung and LG, invested heavily in LED
technology in 2002-2010, with Samsung catapulting to the top of the patent ranking, as firms
prepared for rapid SSL commercialization.
7. SSL Technology Trends, Potential, and Market Emergence The decades-long aim of a solid-state replacement for white light has been a long time
coming. In an assessment of the possible future rate of progress of SSL technology, Haitz and
Tsao (2011, p.19) write,
… SSL application needs are currently met by existing lighting technologies, but at a
high level of energy consumption. SSL has only a chance to disrupt the entrenched
technologies by supplying the same flux and quality of light as currently used at a
significantly lower energy consumption.
However, there is also much reason for optimism. Not only are LED replacement bulbs already
selling in stores at prices attractive to some buyers, but also the technology behind those
replacement bulbs is improving rapidly.
7.1. Technology Trends Haitz et al. (1999) document graphically a gradual but quite steady advance from 1968 to
1999 in light output and cost-per-lumen of LEDs. For red LEDs, their figure suggests a thirty-
fold (later adjusted to twenty-fold) increase in light output per LED lamp per decade, and a ten-
fold reduction in cost per decade. This trend has become widely known as Haitz’s law. Haitz
and Tsao (2011, p.19) update this figure to include white LED lights in 2000-2010, and for white
LED lamps the corresponding improvements in light output and cost have been slightly faster
than was observed for red LEDs. The data imply a mean 35% annual increase in LED light
output and 20% annual decrease in LED lamp cost per lumen. Light output stems from both
electrical current and efficiency, and at least for red LEDs efficiency improvements occurred
steadily, albeit at a gradually decreasing growth rate as efficiency headed toward 100%, during
21
1968-2003 (Haitz, 2003, p.43). (White LEDs may have had a more discontinuous jump
following Nakamura’s work.) Given that energy savings and quality already make some LED
lights attractive replacements for many buyers, the potential for LED lighting to replace existing
forms of lighting, including fluorescent and incandescent, is apparent.
Haitz and Tsao reflect on this ongoing development of LED technology. They observe an
“underlying see-saw dynamic between technological advance pulled by the promise of new
markets, and the opening of new markets pushed by technological advance.” In other words, not
only does market potential pull technological advance, but also technological advance spurs new
demand, particularly to the extent the technology creates new uses. These pull and push effects
are expected by Haitz and Tsao to occur for perhaps a decade, but to slow as SSL efficiency
approaches theoretical limits.6 It might be added, however, that cost improvement may prove
slower to reach diminishing returns and could intensify use and spur novel uses of lighting.
7.2. Competition with Conventional Lighting Conventional light bulb technologies have had poor conversion efficiency from electric
energy to visible light, ranging from 5% for incandescent light bulbs to 28% for fluorescent tubes
(Haitz and Tsao, 1999, 2011). Given limits in the capabilities of conventional lighting
technologies, these technologies seem unable to make any significant jump in conversion
efficiency in the foreseeable future. Thus the traditional lighting industry might face a “sitting-
duck scenario similar to that of the horse carriage and the vacuum tube” (Haitz and Tsao, 2011,
p.21). In contrast, by 1999 LEDs had established a spectacular improvement in efficacy for red
lamps, and LEDs and lasers had conversion efficiencies of 50-60% in the infrared and red parts
of the spectrum. Hence “if SSL could achieve such a performance over the entire visible
spectrum, then light sources with conversion efficiencies of >50% looked plausible” from the
vantage of 1999 (Haitz and Tsao, 2011, p.21). The ongoing improvement since then has indeed
realized large gains and has made SSL competitive for many applications.
The cost-efficiency tradeoff between SSL and conventional light bulbs depends on
purchase cost, electricity cost, and replacement cost. For light bulbs in use three hours per day at
average electricity prices in the U.S. (and allowing 3% annual discounting), the up-front costs of
6 Another limit Haitz and Tsao identify, LED chips becoming too bright to look at, has already
been mitigated by optical technologies that spread out light.
22
choosing SSL instead of incandescent bulbs are paid back in 1.8 years if SSL bulbs cost $12 (as
available now), and from fluorescent to SSL in 17.0 years if the SSL bulb cost falls to $6 (see
Appendix B). In areas with higher electricity prices, as in New York City or Japan, and for bulbs
used eight hours per day, the higher SSL bulb price of $12 is paid for in 4 months versus
incandescent or at $6 in 2.4 years versus compact fluorescent. Prices for LED bulbs are
declining rapidly, and well-rated SSL replacements for standard 60-watt incandescent bulbs sold
as of March 2013 on Amazon’s website for $10.99. Data on bulb price trends are unavailable,
but for packaged LED chips (before assembly into bulbs), prices fell from $32 per kilolumen in
2007 to $3.45 in 2012, while light output rose from 70 to 139 lumens per watt (using Strategies
Unlimited data for one-watt cool white LED packages). The established conventional lighting
industry thus seems very unlikely to crush the emerging SSL technology, and it is no surprise
that the incumbent major lighting firms of the Western hemisphere each established an SSL joint
venture in 1999 and then acquired the joint venture during 2001 to 2006 (Sanderson et al., 2008).
8. Growth of the SSL Industry Starting about 2005, large numbers of firms began to enter the SSL industry, creating
myriad new products. Entry was limited by patents only in selected supply chain segments.
North America’s major lighting trade show, LightFair, in 2010 and 2011 went from very few
SSL products shown previously to SSL being the dominant type of lighting exhibited by firms,
as all sorts of lighting firms developed plans to enter this new market. In the United States, LED
bulbs began appearing in most home supply stores in 2012, and by late January 2013 Amazon’s
internet store advertised for sale nearly 15,000 different LED bulb products. Another indicator
of the industry’s growth is a trade directory published by LEDs Magazine, catering to the needs
of the industry by listing large numbers of firms that could assist in SSL product and
manufacturing development as well as firms making SSL products. Tables 4 and 5 document the
number of firms listed in the magazine’s directory at the time information was collected, around
the latter part of each year 2005 through 2011, for publication early in the subsequent year.
Firms are categorized in Table 4 by country, and in Table 5 by industry segment.
Worldwide, the number of firms listed grew from 127 in 2005 to 891 in 2011. Actual numbers
are much higher, since many relevant firms were not recorded in the directory. In North
America, where the data are more representative than in most other parts of the world, the
23
number of firms grew from 60 in 2005 to 455 in 2011. In the U.K., also an English-speaking
nation and with fairly systematic data, the number of firms grew from 23 in 2005 to 110 in 2007.
Numbers of U.K. firms listed in the directory fell subsequently, but as many of the firms deleted
continued to advertise their services on internet websites, this decrease seems a limitation of the
directory rather than a true characteristic of the U.K. industry. Despite the English-language
nature of the directory, many firms appear from other European nations and from Asian nations.
Here the numbers that appear are definitely undercounts, judging from data we have obtained
about firms and trade organizations in various nations, but nonetheless they are indicative of the
worldwide scope of the industry and of the burgeoning activity in Asian rim nations including
Japan, Taiwan, and China.
The data by industry segment in Table 5 illustrates the supply chain and applications for
this emerging industry. The number of firms in each industry segment (firms often appear in
multiple segments) is given for the years 2005 through 2011, whenever the directory included a
section for the relevant segment. Supply chain components include LED chips and the packages
that encapsulate those chips; arrays of LEDs and electrical modules incorporating LEDs to
produce light; light-management optics; heat sinks to remove excess heat from LEDs; test and
measurement devices and services; electronics to drive, connect, and control LED lighting; and
services to design and manufacture LED chips. Each of these exhibits a rapid growth in number
of firms through at least 2009; after that date the directory has a drop in the number of firms
included but as mentioned above it is not clear this apparent drop is realistic. The key
applications are lighting plus large displays and signs, but in some years other applications are
also listed including some of the stepping-stone applications of LEDs mentioned earlier: medical
and industrial lights, backlights for mobile appliances, signal lights, and vehicle lights. Separate
sections were included in some years for sales and distribution networks and for industry
services. While it should be emphasized that the precise numbers given here, and particularly
decreases in numbers in some years, are not necessarily meaningful, nevertheless the data give a
sense of the broad scope of the market, its worldwide nature, and its rapid growth.
National policy has played an important role in the development of the industry in several
nations, including the U.S., Japan, and Taiwan, but particularly in China. As was revealed to us
in many expert interviews, the Chinese government has invested billions of dollars to support the
growth of an indigenous manufacturing capability for SSL. These vast sums have been used to
24
pay for manufacturing facilities, subsidize by half the cost of the MOCVD reactors used to
manufacture LED chips, and subsidize the purchase by provinces and localities of enormous
numbers of SSL fixtures and lamps (which had to be at least 70%, by value added, made in
China to be eligible for subsidies) for street lighting and other uses. Whether this strategy will
allow Chinese manufacturers to become permanently competitive with leading international
producers remains unclear. Quality concerns arose from initial provincial and local SSL
purchases, but these concerns have been addressed by restricting subsidies to about 6-7 large
SSL manufacturers (a consolidation consistent with China’s Twelfth Five-Year Plan) and by
requiring that quality and performance tests be passed before payment to manufacturers.7 The
government has also heavily invested in SSL research by the Chinese Academy of Sciences, a
fact indicated in Table 2 by the Academy’s leading ranking in publications in 2007-2012. The
enormous investment by the Chinese government is apparent, as they seek to develop an industry
that is a national priority to help solve the country’s energy problems and build a much-needed
lighting infrastructure, and that might incidentally be a valuable investment for future export
reasons.
With the SSL industry in its infancy, its future is difficult to foresee, and many SSL
firms’ managers are struggling to make appropriate decisions in this highly competitive and
complex industry. Some of the many uncertainties include which firms will be able to remain
leading players in the industry, how the competition will vary by industry segment, potential
market saturation exacerbated by long product lifetimes, the development and effects of
standards, and future applications of SSL including with integrated controls and
communications. The industry faces an exciting and challenging evolution to come, just as the
automobile and mobile phone industries went from early years with much design
experimentation before gradually developing characteristics and features that have come to be
accepted as commonplace.
7 China’s subsidies, an industry expert explained to us, take the form of national green-energy
tax breaks to localities, which otherwise must submit taxes to the national government. Local
governments therefore are incentivized to help cover costs to develop local LED manufacturing
and to purchase SSL streetlights.
25
9. Discussion and Synthesis The findings reported above suggest a series of lessons that can be compared to the
evidence from other emerging technologies and industries. Several stylized facts or patterns
seem to constitute a prototypical process by which evolving technologies spawn or contribute to
the development of products and industries. The technology evolution process is influenced by
scientists and engineers, firms, and national policies, as well as markets that serve as stepping
stones to finance development and provide avenues for learning. This is particularly important
in helping to improve product performance and bring down manufacturing costs. Improved
performance and reduced costs support a proliferation of market applications and niches, and
strengthen firms that successfully participate in niche markets, preparing them for a
confrontation with incumbents whose product is displaced by the new technology.
How does the emergence of SSL fit with stylized facts of prototypical product emergence
from evolving technologies? Most of our findings below confirm ideas from prior work,
although some departures from common views occur in findings 9, 10, and 13 below.
9.1. Unpredictable Paths of Technology Evolution Technological advance is gradual (1). SSL development took a half-century from the
1950s at least until the availability of white light from blue LEDs with phosphors in 1997, with
continued development of more advanced LED lamps thereafter.8 Work on LED technologies
with commercial promise occurred for over three and one half decades, including Holonyak’s
success in 1962. Outstanding breakthroughs built on prior developments that had proceeded
over decades. Efficiency improved gradually toward 100% from 1968 through 2003, and cost
per lumen improved steadily from 1968 through 2010.
Technological advance takes many paths and is difficult to predict (2). In SSL, one
example is GaN’s intermittent development: GaN LED R&D occurred early at RCA, but GaN
was subsequently abandoned by almost all researchers and other, seemingly more promising,
materials were pursued, until the 1980s and 1990s when the underdog material GaN finally
achieved spectacular success. Similar branching of activity and difficulty of prediction occurred
at a smaller scale within individual research projects. 8 Chance discoveries came earlier, with electroluminescence seen in 1907 by Henry Round
(1907), and light emission from crystal diodes in 1927 by Oleg Losev.
26
Duplication of inventive activity is common, but the multiple activities may differ in their
specifics and each may have limited chance of success (3). For SSL, even unpopular approaches
(such as GaN) tended to have multiple researchers, so that if one researcher did not work on a
general topic, another would. This duplication of inventive activity can be helpful: each
researcher has only a probability of success, the results of the research usually differ in important
ways such as methods and tools, and skills acquired through the research aid the researchers’
future work (Schmookler, 1966, pp.189-95).
Key individuals succeed through perseverance, combined with skill, method, and luck (4).
In SSL, major successes required many steps, each a mini-invention or discovery of its own.
These steps were frequently difficult to attain, nonobvious, even surprising. They often required
learning new skills such as how to build and modify an MOCVD reactor or how to work with
particular materials. Method involved, for example, using science and intuition to generate new
ideas, and systematically experimenting with new variations, approaches and chance trials until
one proved successful. Maintaining willpower to keep working despite many setbacks was
crucial.
Technologies are often developed by a mix of firms and institutions including universities
and public laboratories (5). In SSL, firms, universities, and government laboratories all
contributed to basic research, while applied product and process development occurred primarily
in firms. Researchers sometimes moved between firms and universities, as with Holonyak and
Akasaki, and universities sometimes supported continuing work when business projects closed,
as with Pankove.
Persistence of corporate R&D was necessary to achieve commercially viable invention
success (6). In contrast, companies sometimes shut down research programs part way through
because of financial pressures, even if technological potential seemed strong. This was more
likely when short- or moderate-term market prospects for a technology were unclear. RCA shut
down its early work on GaN LEDs in 1974, just after building an MOCVD reactor and weak
blue and violet LEDs, after the company experienced corporate-wide financial losses. Texas
Instruments abandoned LED work under market pressure.
9.2. Supply Push and Demand Pull Technological knowledge spread, pushed by the efforts of scientists and engineers,
facilitates the creation of products (7). In SSL, which required lengthy development of a major
27
technology, the number of researchers involved in developing the technology and its initial
commercial applications was considerable. Close to 100,000 publication authors and a similar
number of patent inventors, all creators of publications and patents analyzed in Tables 2 and 3,
participated in development of the technology.9 Without these researchers, LEDs and SSL could
not have advanced.
The supply of scientists and engineers working on a topic tends to increase as knowledge
spreads and commercial potential becomes apparent (8). In SSL, the number of publications per
annum grew exponentially, as was seen in Figure 2, and the number of researchers authoring
these publications grew similarly.
Technologies are usually applied first in market niches, and a succession of niche
markets may commonly support any major application (9). In SSL, the first application of
indicator lights preceded a succession of other applications such as traffic lights, exit signs,
outdoor video displays, architectural lighting, backlights for flat panel (television and computer)
displays, flashlights, and refrigerator lights, leading up to the recent application of indoor and
outdoor white lights. Although prior researchers have indicated that a market niche may spawn
firms capable with a new technology, the large number of successive niches leading up to SSL
for general illumination is remarkable. In light of this pattern, it would be useful to reevaluate
past industry cases to examine the extent to which there were large numbers of market niches,
each with distinct demand characteristics that drove product needs. While SSL may be
exceptional, perhaps due to the broad scope of applicability of the technology, we suspect that
very many new technologies have large numbers of distinctive market niches and that these
niches typically provide stepping stones to more general commercialization.
Niches support the development of the technology but not necessarily specific companies,
as few companies may participate in many niches (10). Prior studies have not carefully
examined the phenomenon of many market niches leading to product development, so the
9 Numbers of authors and inventors reported here are approximate because of difficulties
matching names across publications and across patents. Using last names and first initials to
distinguish authors, 78,242 authors appear (20% with at least 3 articles and 11% with at least 5
articles), but there might have been up to 111,226 authors judging from full names (which yield
16% and 7% with at least 3 and 5 articles respectively).
28
number of niches in which companies participate remains a topic for future study. In SSL,
Osram and Sharp persisted over most of the history of SSL’s commercial development and
spanned several niches, but their experience was very unusual. More commonly, firms spanned
up to two niches, rarely progressing from one niche to another. However, experience in a niche
market often helped in developing products suitable for the emerging market in SSL, as LED
backlights helped Samsung develop into SSL and colored LED Christmas lights helped Neo-
Neon enter SSL.
9.3. Patents and the Appropriation of Returns to Invention and Innovation In typical products with substantial potential for patented technology, firms develop
thickets of many patents related to a product, and negotiate cross-licensing agreements (11). In
SSL, major producers of LED chips and integrated SSL manufacturers held portfolios of
hundreds or even thousands of relevant patents, and conflict and eventual cross-licensing within
this group of producers was the norm. Licensing also occurred to other makers of SSL products,
depending on the specific products made. Although Nakamura’s race with Akasaki to develop a
bright blue GaN LED could be modeled as a traditional patent race (but with Akasaki unaware of
Nakamura’s competition), the race’s outcome must be understood in the context of patent
thickets.
Patents are very important in a high-technology industry’s birth, when lawsuits and
cross-licensing arrangements are being negotiated, as a tool to help protect firms’ future profit
streams (12). Although for typical products patenting is just one of several methods to protect
profits of technological innovation, patents may be a particularly important source of competitive
advantage in the years leading up to emergence of a major industry. In SSL, this is when major
patent lawsuits were fought and many licenses negotiated. The findings here do not address
whether patents are socially beneficial or harmful, only how they matter competitively.
9.4. Invading Mainstream Markets When radical disruptive technologies arise, incumbent firms may anticipate the new
technology and act aggressively to transition to it, yet still be faced with stiff competition from
new entrants and potentially lose their market leadership (13). The shift in technology from
traditional lighting to SSL fits all the major hallmarks identified for disruptive technological
shifts – a new product based on different areas of science and technology, architecturally
29
different in its components and their assembly, starting out in niche markets, with entirely
different production technologies. It is a rebuke to established theories of disruption, then, that
the leading lighting firms all transitioned early to the new technology, and did so relatively
successfully (so far). Incumbents’ success in transitioning to the new technology apparently
involved openness to change, perhaps stemming from dynamic capabilities of the firms. In any
case, the incumbents’ preemptive activity could prove insufficient to remain the market leaders
given entry by large numbers of new competitors also establishing strong capabilities in SSL.
After creation of a new industry that has strong potential for continued technological
advance, a race to keep up technologically results in continued exit of less able firms, and
eventual near-cessation of entry, yielding after the initial buildup in firms an eventual drop-off,
or shakeout, in firm numbers (14). In SSL, manufacturers are already wary of the uncertainties
involved and the competition to come. Integrated firms are already considering bailing out of
LED chip production amid uncertainties about whether giant integrated manufacturers such as
Samsung, or subsidized manufacturers in China, will outcompete them on costs. These concerns
are exacerbated by the slow transition of household consumers to SSL (coupled with the recent
macroeconomic downturn) and by concerns that sales may fall substantially after the market is
saturated. For firms to be successful in SSL supply chain segments that will experience lasting
competitive shakeouts, past industry cases suggest that it is crucial for firms to enter early, grow
their sales, and establish low-cost manufacturing processes and high-quality products.
Firms’ competitive advantage often results from differentiation through novel product
characteristics and features (15). Some SSL manufacturers are pioneering new products such as
color-changing SSL systems with readily programmable interfaces, LED-based devices to
promote health and affect Circadian rhythm and sleep, and SSL communication systems that
transmit data to devices within rooms.
10. Conclusions The bulk of economic growth stems from technological advance, to an extent not
measured in past price indices and output statistics. Technology’s unmeasured role is illustrated
by Nordhaus’s (1996) analysis of lighting technologies from stone-age fires and torches to oil
and kerosene lamps, gas lamps, electric light, and fluorescent bulbs. A next leap in this
succession of lighting technology is in progress, the switch to solid-state lighting. SSL again
30
promises an important jump in the quality and efficiency of lighting, this time with novel
features including color control and data communication.
This study yields valuable evidence in that studies of industry emergence have been few
and hampered by the difficulty of tracking not only technological trajectories but also the
complex interplay between those technologies and the decisions and actions of individual
researchers and organizations involved in technology development. This study has deliberately
taken a descriptive approach and a broad view, to move beyond network analyses of patents or
publications to a more comprehensive analysis of processes at work leading to successful
industry emergence. This study focuses on a single case, the newly emerged SSL industry, but
the lessons drawn are compared to previous findings to yield general stylized facts of industry
emergence.
Key findings pertain to the nature of technology development, to the individuals and
organizations involved, and to the way in which organizations successfully navigated the
development phase to enter the emergent industry. Technology development was drawn out and
consisted of enormous numbers of small technological changes, with occasional major
technological breakthroughs that enlarged the practical and commercial potential of the
technology. Tens of thousands of scientists and engineers were involved in this development
process, and some of them stood out as having particularly important capabilities and unusual
approaches that allowed them to make major breakthroughs. Some firms continued development
of the technology and used stepping-stone markets to help develop their products and fund
continuing development work, while other firms failed to develop stepping-stone markets and
exited LED technology development. Many types of firms, startups and international multi-
product behemoths, traditional lighting firms, and entrants from related industries like controls
and lighting fixtures, all have been entering the newly-emerged industry and bringing with them
varied advantages and capabilities that may constrain them to particular segments of the new
industry. Today another complex challenge faces firms as they develop new products and
processes, improve light quality and product features, and drive down costs to remain
competitive and appeal to a large number of customers. Making the best strategic decisions is a
formidable challenge in this complex, rapidly changing, and difficult-to-analyze new industry.
31
Appendix A. Data Sources Data were required on the development of LED and SSL technologies, the people and
organizations that developed these technologies, the companies in the recently emerged SSL
industry and those companies’ products and services, and the history of major SSL companies to
date including leading traditional lighting firms and major diversifying firms and entrepreneurial
startups. To achieve these requirements, data were drawn from several sources. To study
technological development, worldwide databases of publications and patents were used.
Organizations (and people) involved in technology development were revealed through their
publications and patents. Companies now involved in SSL were also identified using a recent
annual buyer’s guide on the LED industry. Industry reports and extensive discussions with
industry experts informed the analysis.
A.1. Publications Data
Publications data pertain to articles listed in the Science Citation Index and its companion
index of conference proceedings. Relevant publications were identified using the same search
criteria employed by another group with leading expertise in SSL (Boyack et al., 2009). The
search criteria were developed through an iterative process and were tested by those authors
against lists of publications by key LED researchers and institutions, yielding estimated precision
and recall of 70-90%, by no means perfect but reasonable for the analyses used here (Lundberg
et al., 2006). To further ensure key articles analyzed are relevant, the top 100 articles by citation
counts in each period 1945-1981, 1982-1991, and 1992-2001 were checked manually, and off-
topic and irrelevant articles were removed from the data. After 2001, when the large number of
publications being generated tend to reduce noise in citation counts, citations within articles in
the dataset were computed as a metric that provides little or no weight to irrelevant articles,
which were mainly burgeoning applications of LEDs and their materials to medicine and the
sciences. Additional criteria described by Boyack et al. (2009) were used to classify publications
as pertaining to inorganic versus organic LEDs. Each article’s authors, author affiliations, and
number of citations were recorded. Where the source data lacked information on author
affiliations (particularly in early years), data for all journal issues in the authors’ university
library (90% of all missing data) were compiled by hand. The organizational affiliations of
32
authors were matched manually to ensure that alternate spellings and (most carefully for leading
organizations) subsidiaries were treated each as a single organization.
A.2. Patent Data
Patent data are drawn from the European Patent Office’s EPO Worldwide Patent
Statistical Database. This global database not only includes applicants worldwide, but
importantly it also covers patents granted by most substantial patent authorities worldwide.
About sixty national and regional patent authorities, covering almost all nations with substantial
LED activity as well as the world’s major multi-nation patent authorities, are included. For
Taiwan, only limited national patent data are available. For mainland China data are available
from 1985, for South Korea from 1978, for Japan and Australia from 1973, and for Canada from
1970. Use of patent data from virtually all granting authorities, not just the U.S. or Europe,
avoids a Western-centric bias that would otherwise be substantial for LED-related technologies.
Applications data, available in more recent years (the number of years varies by nation),
provide a measure of recent technological activity. Application evaluation often occurs over
multiple years before a patent is granted, so applications provide a relatively leading-edge
understanding of recent developments in LED industries. Neither applications nor granted
patents provide a totally up-to-date metric, however, because national laws dictate a period of
privacy before a patent application’s full specifications are published, and because of delays in
granting decisions, in the provision of bibliographic data from national patent offices to the EPO,
and in the EPO’s preparation of its biannual database. Applications cannot be reliably attributed
as being patent versus utility model applications, given limitations of the publication type data
provided to the EPO by many national patent offices, so applications include those for utility
models (not to be confused with patents of utility) as well as regular patents, for countries that
grant utility models. An application filed in multiple nations, or multiple times in the same
nation, as measured by an INPADOC family, is herein counted only once.
LED-related documents (patents, utility models, and their applications) were identified by
developing a series of distinctive title keywords and international patent classification (IPC)
codes, through a successive iteration between identification and discussion with industry experts.
A list of title keywords and IPC codes used to identify relevant patents is available in Simons
and Sanderson (2011), except that the search term “electroluminescent” has been added here.
The codes are designed to capture a large portion of LED-related documents while excluding
33
almost every non-LED-related document. An analysis of patents applied for by three companies
that focus mainly on LED technologies revealed that approximately half of each of these
companies’ patents are caught by our patent search (50% for Color Kinetics, 41% for Cree, and
58% for Nichia). Similarly, an analysis of U.S. patents in U.S. class 362/800, which is a light-
emitting diode cross-reference art collection, showed that 45% of these LED-related patents are
caught by our search method. Inorganic LED patents and applications were identified by
excluding any that matched the organic LED identification criteria documented in Simons and
Sanderson (2011).
Applicant organizations were coded to match records with different names for the same
organization. These differences result from typos, variant names used by different national
patent offices, and variant names used within a patent office. Parts of larger organizations, such
as Philips and its subsidiaries, were combined with the parent organization, and headquarters
nationalities of organizations were likewise recorded based on the location of head offices of the
parent organization.
A.3. Industry Directory LEDs Magazine’s LED Suppliers Directory, published annually from March 2006
through January 2012, lists manufacturers, service providers for manufacturers, and suppliers of
numerous LED-related components and products. The 2012 directory is divided into ten
sections, which detail which companies supply each of a range of more specific product types.
Most but not all of these sections had information similarly catalogued from 2006 onward.
The directory unfortunately does not distinguish pure suppliers from companies that
design or build their own products or that provide services to aid LED lighting or product design.
We therefore evaluated each company based on information reported in the directory and on its
website (or past website where available for defunct companies) and eliminated from our
analysis all companies that apparently are pure suppliers.
The LEDs Magazine data are global. That said, LEDs Magazine is published in English,
and edited in Great Britain and the United States. Hence English-language companies,
particularly British and U.S. companies, are likely to be relatively highly represented. Small
firms in other nations, particularly non-English speaking nations, are less likely to have placed
their data in LEDs Magazine’s directory.
34
Directory listings are free of charge, and the publishers attempt to keep the information
up to date and accurate through an ongoing review process and solicitations of updated
information. Company representatives can add or update their listings using an Internet-based
system, and since the magazine is the leading LED-related trade publication, the directory
apparently captures many or most companies that are selling LED-related products or services.
These companies gain business by being listed in the directory and therefore have an incentive to
ensure that they are listed in it (this may be less true for companies that seek no business from
English-speaking customers). Nonetheless, many relevant firms do not appear in the directory,
and its editors seem to have carried out periodic culls of the firms included in which many
relevant firms were eliminated, possibly because they failed to submit updated information.
A.4. Industry Experts
We coupled the above quantitative sources with in-depth discussion with experts in the
U.S. and worldwide. Experts from industry, academia, and government were interviewed over
the period 2006-2012 as the authors attended LED and SSL conferences run by the U.S.
Department of Energy, LightFair, SPIE (optics and photonics engineers), the University of
California at Santa Barbara, Rensselaer Polytechnic Institute, and Boston University; meetings
with executives from Philips, Osram-Sylvania, General Electric, Color Kinetics, Walsin Lihwa,
San’an, and other organizations; meetings with government policy makers at the U.S.
Department of Energy and Taiwan’s Industrial Technology Research Institute; and meetings and
informal interactions of the NSF Smart Lighting Engineering Research Center, in which the
authors study the development and impacts of SSL, smart lighting, and their emerging industries.
Appendix B. Relative Cost of Alternative Light Bulbs SSL bulbs currently cost more than incandescent and compact fluorescent light bulbs, but
use less electricity and last longer. It is desired to analyze the recent relative costs of these light
bulb types.
The expected discounted financial cost to buy a light bulb of type i, operate it for T years,
and replace it when needed is Ci = pi + e!"t (kwih365 / 1000)dt
0
T
# + e!"t pi(365h / Li )dt0
T
# , where
pi is the bulb’s purchase price, k is the cost of electricity per kilowatt-hour, wi is electricity
35
consumption in watts, h is hours operated per day, Li is the bulb’s expected lifetime in hours,
and ! is the purchaser’s real discount rate. The bulb price and electricity price are assumed to
be constant. The figure 365 is the number of days per year, while 1000 is the number of watts
per kilowatt. The first term in Ci is the purchase price, the second term is the discounted cost of
electricity, and the third term is the discounted cost of replacing burned-out light bulbs. Ci
simplifies to pi + mi(1! e!"T ) where mi = (h365 / !)(kwi / 1000+ pi / Li ) . Letting i = 0 denote a
reference bulb type (incandescent or compact fluorescent), the time T * until the expected extra
cost of an SSL bulb of type 1 (compared to a type 0 bulb) is paid back is found by solving
C1 = C0 for T = T * . This yields T * = !1
"ln(1!
p1 ! p0
m0 ! m1
) .
Comparisons are based on hypothetical reference bulbs: a $1.00 incandescent bulb
emitting 800 lumens with 60 watts of electricity for an expected life of 1,000 hours (compare to
GE 41208: $6.99 per four-pack, 800 lumens, 60 watts, 1,000-hour rated life); a $1.30 compact
fluorescent bulb emitting 800 lumens with 12.6 watts for 8,000 hours (compare to GE 383330:
$10.34 per eight-pack, 825 lumens, 13 watts, 8,000-hour rated life); and a $12.00 SSL bulb
emitting 800 lumens with 9 watts of electricity for 30,000 hours (compare to Lighting EVER
100022-DW: $10.99 each, 630 lumens, 7 watts, 30,000-hour rated life; or to Philips 423244:
$26.77 each, 940 lumens, 10 watts, 30,000-hour rated life). Comparators are major sellers with
roughly comparable specifications and standard (A19 or common compact fluorescent) Edison-
base bulb shape on Amazon’s internet store as of March 15, 2013, and Amazon’s retail price is
used since manufacturer suggested retail prices include widely varying margins.
For T = ! , Ci = pi + mi . Using the U.S. average household electricity cost of $0.10 per
kilowatt-hour, a typical usage of 3 hours per day, and a 3% real discount rate, the infinite-
horizon expected discounted cost is $256.50 for the incandescent bulb, $53.22 for the compact
fluorescent bulb, or $59.45 for the SSL bulb. The time T * for SSL to recoup its price
differential is 1.8 years compared to incandescent, but never compared to compact fluorescent.
At the average New York City area or Japanese household electricity cost of $0.20 per kilowatt-
hour and 8 hours per day, T * is 4 months compared to incandescent or 8.6 years compared to
compact fluorescent. If the SSL bulb price falls to $6, T * falls to 2 months or 2.4 years.
36
Acknowledgements This work was supported primarily by the Engineering Research Centers Program (ERC) of the
National Science Foundation under NSF Cooperative Agreement No. EEC-0812056 and in part
by New York State under NYSTAR contract C090145. These funding sources did not affect
study design, data, writing, or journal submission. We thank three anonymous referees and Bob
Karlicek for helpful comments, and many industry experts for valuable discussions.
References Adams, J.D., 1990. Fundamental stocks of knowledge and productivity growth. Journal of
Political Economy 98 (4), 673-702.
Adams, J.D., Clemmons, J.R., Stephan, P.E., 2006. How rapidly does science leak out?, NBER
Working Paper 11997.
Amano, H., Sawaki, N., Akasaki, I., Toyoda, Y., 1986. Metalorganic vapor phase epitaxial
growth of a high quality GaN film using an AlN buffer layer. Applied Physics Letters 48 (5),
353-5.
Antonelli, C., 2008. Localised Technological Change: Towards the Economics of Complexity.
Routledge, London.
Arthur, W.B., 1988a. Competing technologies: An overview, in: Freeman, C., Nelson, R.,
Silverberg, G., Soete, L. (Eds), Technical Change and Economic Theory. Pinter Publishers,
London, pp. 590-607.
Arthur, W.B., 1988b. Self-reinforcing mechanisms in economics, in: Anderson, P.W., Arrow,
K.J., Pines, D. (Eds), The Economy as an Evolving Complex System. Addison-Wesley,
Redwood City, pp. 9-31.
Arrow, K., 1962. Economic welfare and the allocation of resources for invention, in: National
Bureau of Economic Research (Ed), The Rate and Direction of Inventive Activity. Princeton
University Press, Princeton, pp. 609-25.
Basalla, G., 1988. The Evolution of Technology. Cambridge University Press, Cambridge.
Boldrin, M., Levine, D.K., 2013. The case against patents. Journal of Economic Perspectives 27
(1), 3-22.
37
Boyack, K.W., Tsao, J.Y., Miksovic, A., Huey, M., 2009. A recursive process for mapping and
clustering technology literatures: Case study in solid-state lighting. International Journal of
Technology Transfer and Commercialisation 8 (1), 51-87.
Christensen, C., Rosenbloom, R., 1995. Explaining the attacker's advantage: Technological
paradigms, organizational dynamics, and the value network. Research Policy 24, 233-57.
Churella, A.J., 1998. From steam to diesel: Managerial customs and organizational capabilities
in the twentieth-century American locomotive industry. Princeton University Press, Princeton.
Cockburn, I.M., MacGarvie, M.J., Müller, E., 2010. Patent thickets, licensing and innovative
performance. Industrial and Corporate Change 19 (3). 899-925.
Cohen, W.M., Nelson, R.R., Walsh, J.P., 2000. Protecting their intellectual assets:
Appropriability conditions and why U.S. manufacturing firms patent (or not), NBER Working
Paper 7552.
Cooper, A.C., Schendel, D., 1976. Strategic responses to technological threats. Business
Horizons 19 (1), 61-9.
David, P., 1985. Clio and the economics of QWERTY. American Economic Review 75 (2): 332-
7.
Dosi, G., 1982, Technological paradigms and technological trajectories: A suggested
interpretation of the determinants and directions of technical change. Research Policy 11 (3),
147-62.
Fasol, G., 1996. Room-temperature blue gallium nitride laser diode. Science 272 (5269), 1751-2.
Fisher, D.E., Fisher, M.J., 1996. Tube: The Invention of Television. Counterpoint, Washington,
D.C.
Foster, R.N., 1986. Innovation: The Attacker’s Advantage. Summit Books, New York.
Geels, F.W., 2002. Technological transitions as evolutionary reconfiguration processes: A multi-
level perspective and a case-study. Research Policy 31, 1257-74.
Gertner, J., 2012. The Idea Factory: Bell Labs and the Great Age of American Innovation.
Penguin Press, New York.
Gort, M., Klepper, S., 1982. Time paths in the diffusion of product innovations. Economic
Journal 92 (3), 630-53.
Hagiu, A., Yoffie, D.B., 2013. The new patent intermediaries: Platforms, defensive aggregators,
and super-aggregators. Journal of Economic Perspectives 27 (1), 45-66.
38
Haitz, R., 2003. Another semiconductor revolution: This time it’s lighting! Advances in Solid
State Physics 43, 35-50.
Haitz, R, Kish, F., Tsao, J., Nelson, J., 1999. The case for a national research program on
semiconductor lighting, Sandia National Laboratories Report SAND 2000-1612 (downloaded
on 1 March 2013 from http://www.sandia.gov/~jytsao/hpsnl_sand_report_2000.pdf).
Haitz, R., Tsao, J.Y., 2011. Solid-state lighting: ‘The case’ 10 years after and future prospects.
Physica Status Solidi A 208 (1), 17-29.
Henderson, R.M. Clark, K.B., 1990. Architectural innovation: The reconfiguration of existing
product technologies and the failure of established firms. Administrative Science Quarterly 35,
9-30.
Holonyak, N., Jr., 2013. The III-V alloy p-n diode laser and LED ultimate lamp. Proceedings of
the IEEE 101 (10), 2158-2169.
Johnstone, B., 2007. Brilliant! Shuji Nakamura and the Revolution in Lighting Technology.
Prometheus Books, Amherst NY.
Kishi, N., Takahashi, N., 2010. Licensing strategy of Japanese firms and competitive advantage.
Annals of Business Administrative Science 9 (1), 1-12.
Klepper, S., Graddy, E., 1990. The evolution of new industries and the determinants of market
structure. RAND Journal of Economics 21 (1), 27-44.
Klepper, S., Simons, K.L., 1997. Technological extinctions of industrial firms: An inquiry into
their nature and causes. Industrial and Corporate Change 6 (2), 379-460.
Klepper, S., Simons, K.L., 2005. Industry shakeouts and technological change. International
Journal of Industrial Organization 23 (1-2), 23-43.
Levin, R.C., Klevorick, A.K., Nelson, R.R., Winter, S.G., 1987. Appropriating the returns from
industrial research and development. Brookings Papers on Economic Activity 1987 (3) Special
Issue on Microeconomics, 783-831.
Levinthal, D.A., 1998. The slow pace of rapid technological change: Gradualism and
punctuation in technological change. Industrial and Corporate Change 7 (2), 217-47.
Lundberg, J., Fransson, A., Brommels, M., Skar, J., Lundkvist, I., 2006. Is it better or just the
same? Article identification strategies impact bibliometric assessments. Scientometrics 66 (1),
183-97.
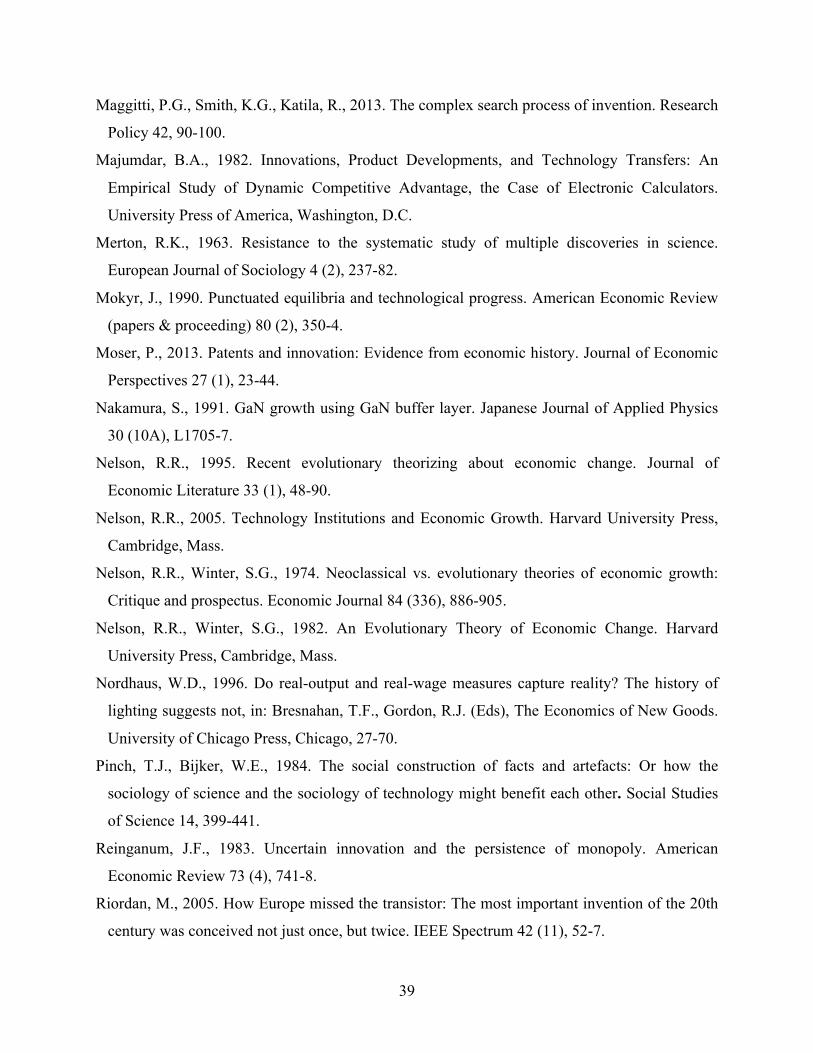
39
Maggitti, P.G., Smith, K.G., Katila, R., 2013. The complex search process of invention. Research
Policy 42, 90-100.
Majumdar, B.A., 1982. Innovations, Product Developments, and Technology Transfers: An
Empirical Study of Dynamic Competitive Advantage, the Case of Electronic Calculators.
University Press of America, Washington, D.C.
Merton, R.K., 1963. Resistance to the systematic study of multiple discoveries in science.
European Journal of Sociology 4 (2), 237-82.
Mokyr, J., 1990. Punctuated equilibria and technological progress. American Economic Review
(papers & proceeding) 80 (2), 350-4.
Moser, P., 2013. Patents and innovation: Evidence from economic history. Journal of Economic
Perspectives 27 (1), 23-44.
Nakamura, S., 1991. GaN growth using GaN buffer layer. Japanese Journal of Applied Physics
30 (10A), L1705-7.
Nelson, R.R., 1995. Recent evolutionary theorizing about economic change. Journal of
Economic Literature 33 (1), 48-90.
Nelson, R.R., 2005. Technology Institutions and Economic Growth. Harvard University Press,
Cambridge, Mass.
Nelson, R.R., Winter, S.G., 1974. Neoclassical vs. evolutionary theories of economic growth:
Critique and prospectus. Economic Journal 84 (336), 886-905.
Nelson, R.R., Winter, S.G., 1982. An Evolutionary Theory of Economic Change. Harvard
University Press, Cambridge, Mass.
Nordhaus, W.D., 1996. Do real-output and real-wage measures capture reality? The history of
lighting suggests not, in: Bresnahan, T.F., Gordon, R.J. (Eds), The Economics of New Goods.
University of Chicago Press, Chicago, 27-70.
Pinch, T.J., Bijker, W.E., 1984. The social construction of facts and artefacts: Or how the
sociology of science and the sociology of technology might benefit each other. Social Studies
of Science 14, 399-441.
Reinganum, J.F., 1983. Uncertain innovation and the persistence of monopoly. American
Economic Review 73 (4), 741-8.
Riordan, M., 2005. How Europe missed the transistor: The most important invention of the 20th
century was conceived not just once, but twice. IEEE Spectrum 42 (11), 52-7.
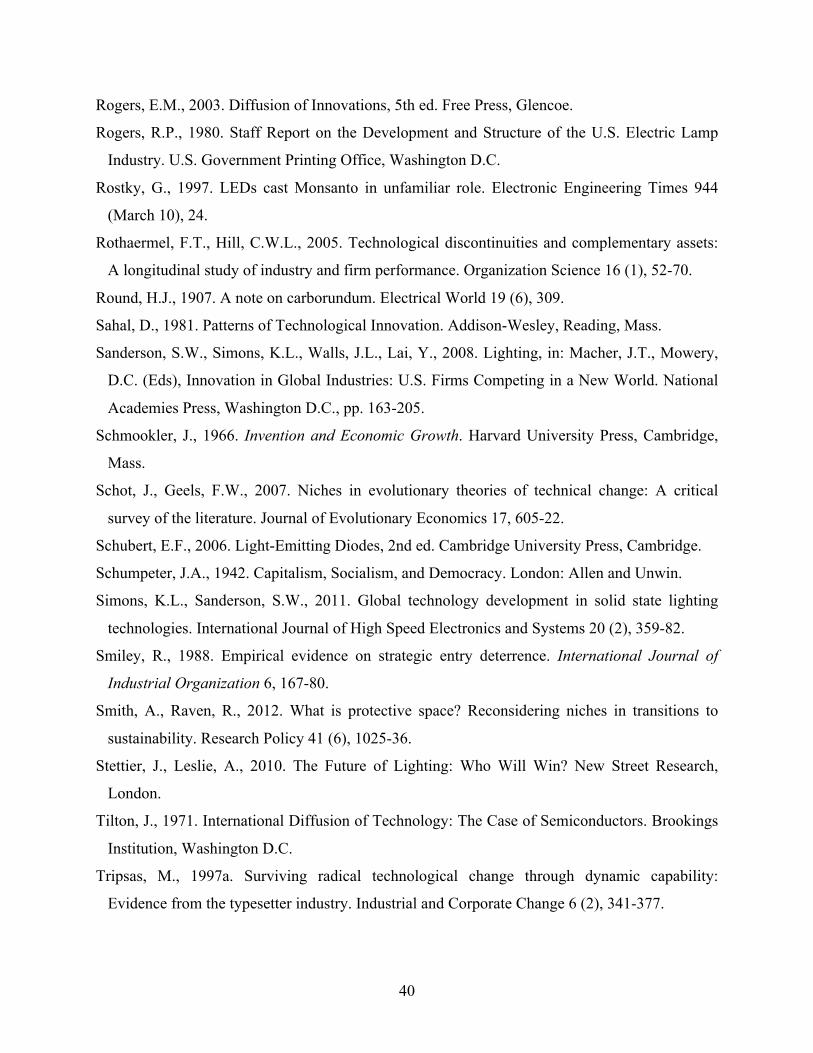
40
Rogers, E.M., 2003. Diffusion of Innovations, 5th ed. Free Press, Glencoe.
Rogers, R.P., 1980. Staff Report on the Development and Structure of the U.S. Electric Lamp
Industry. U.S. Government Printing Office, Washington D.C.
Rostky, G., 1997. LEDs cast Monsanto in unfamiliar role. Electronic Engineering Times 944
(March 10), 24.
Rothaermel, F.T., Hill, C.W.L., 2005. Technological discontinuities and complementary assets:
A longitudinal study of industry and firm performance. Organization Science 16 (1), 52-70.
Round, H.J., 1907. A note on carborundum. Electrical World 19 (6), 309.
Sahal, D., 1981. Patterns of Technological Innovation. Addison-Wesley, Reading, Mass.
Sanderson, S.W., Simons, K.L., Walls, J.L., Lai, Y., 2008. Lighting, in: Macher, J.T., Mowery,
D.C. (Eds), Innovation in Global Industries: U.S. Firms Competing in a New World. National
Academies Press, Washington D.C., pp. 163-205.
Schmookler, J., 1966. Invention and Economic Growth. Harvard University Press, Cambridge,
Mass.
Schot, J., Geels, F.W., 2007. Niches in evolutionary theories of technical change: A critical
survey of the literature. Journal of Evolutionary Economics 17, 605-22.
Schubert, E.F., 2006. Light-Emitting Diodes, 2nd ed. Cambridge University Press, Cambridge.
Schumpeter, J.A., 1942. Capitalism, Socialism, and Democracy. London: Allen and Unwin.
Simons, K.L., Sanderson, S.W., 2011. Global technology development in solid state lighting
technologies. International Journal of High Speed Electronics and Systems 20 (2), 359-82.
Smiley, R., 1988. Empirical evidence on strategic entry deterrence. International Journal of
Industrial Organization 6, 167-80.
Smith, A., Raven, R., 2012. What is protective space? Reconsidering niches in transitions to
sustainability. Research Policy 41 (6), 1025-36.
Stettier, J., Leslie, A., 2010. The Future of Lighting: Who Will Win? New Street Research,
London.
Tilton, J., 1971. International Diffusion of Technology: The Case of Semiconductors. Brookings
Institution, Washington D.C.
Tripsas, M., 1997a. Surviving radical technological change through dynamic capability:
Evidence from the typesetter industry. Industrial and Corporate Change 6 (2), 341-377.
41
Tripsas, M., 1997b. Unraveling the process of creative destruction: Complementary assets and
incumbent survival in the typesetter industry. Strategic Management Journal 18 (Special
Summer Issue), 119-142.
Tushman, M.L., Anderson, P., 1986. Technological discontinuities and organizational
environments. Administrative Science Quarterly 31 (3), 439-65.
Udelson, J.H., 1982. The Great Television Race: A History of the American Television Industry
1925-1941. University of Alabama Press, University, Alabama.
Vincenti, W. 1994. The retractable airplane landing gear and the Northrup `anomaly’: Variation-
selection and the shaping of technology. Technology and Culture 35 (1): 1-33.
Wolf, H., Wolf, R., 1936. Rubber: A Story of Glory and Greed. Covici Friede, New York.
42
Figure 1. Diffusion of LEDs by Market Niche, 2010 (estimates from Strategies Unlimited).
Figure 2. Inorganic LED Publications and Patents by Year. Source: See Appendix A.
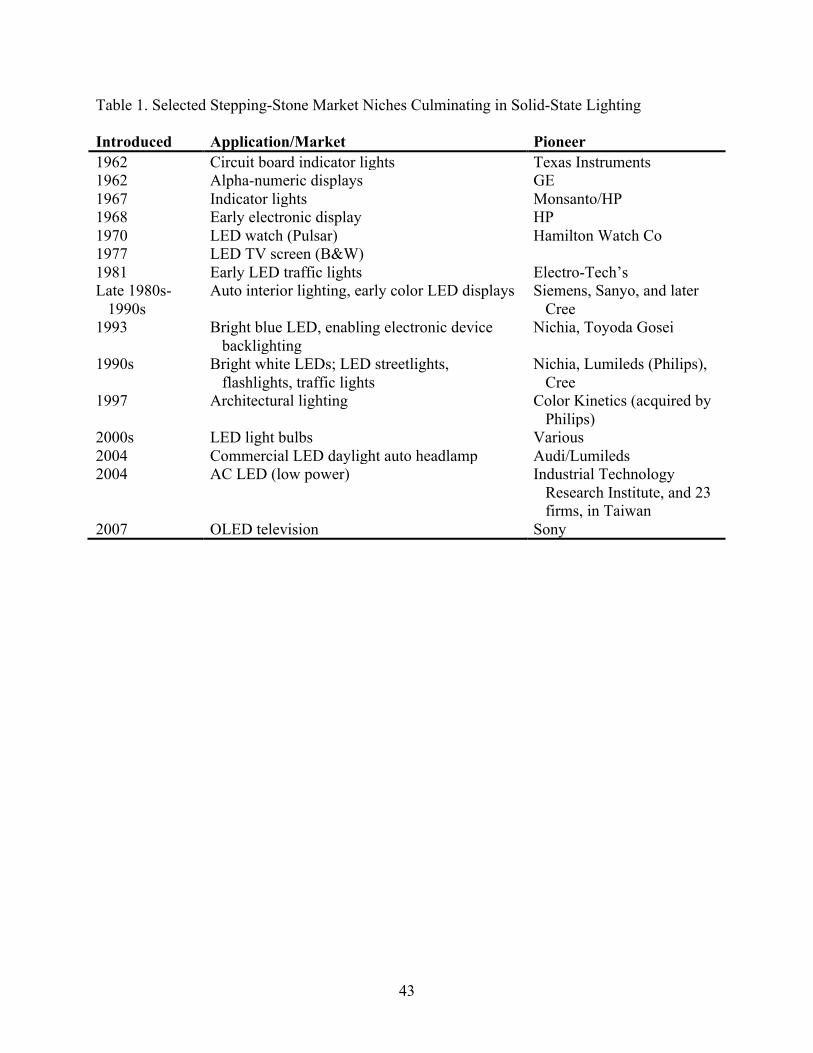
43
Table 1. Selected Stepping-Stone Market Niches Culminating in Solid-State Lighting Introduced Application/Market Pioneer 1962 Circuit board indicator lights Texas Instruments 1962 Alpha-numeric displays GE 1967 Indicator lights Monsanto/HP 1968 Early electronic display HP 1970 LED watch (Pulsar) Hamilton Watch Co 1977 LED TV screen (B&W) 1981 Early LED traffic lights Electro-Tech’s Late 1980s-
1990s Auto interior lighting, early color LED displays Siemens, Sanyo, and later
Cree 1993 Bright blue LED, enabling electronic device
backlighting Nichia, Toyoda Gosei
1990s Bright white LEDs; LED streetlights, flashlights, traffic lights
Nichia, Lumileds (Philips), Cree
1997 Architectural lighting Color Kinetics (acquired by Philips)
2000s LED light bulbs Various 2004 Commercial LED daylight auto headlamp Audi/Lumileds 2004 AC LED (low power) Industrial Technology
Research Institute, and 23 firms, in Taiwan
2007 OLED television Sony
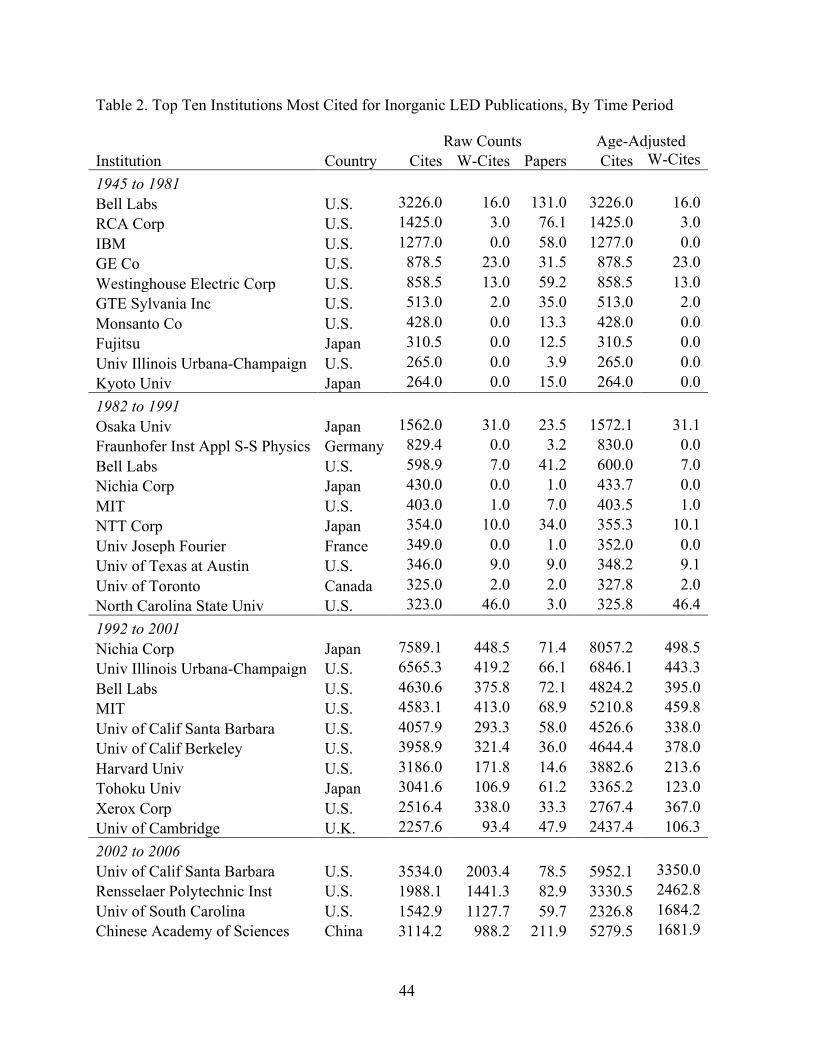
44
Table 2. Top Ten Institutions Most Cited for Inorganic LED Publications, By Time Period
Raw Counts Age-Adjusted Institution Country Cites W-Cites Papers Cites W-Cites 1945 to 1981 Bell Labs U.S. 3226.0 16.0 131.0 3226.0 16.0 RCA Corp U.S. 1425.0 3.0 76.1 1425.0 3.0 IBM U.S. 1277.0 0.0 58.0 1277.0 0.0 GE Co U.S. 878.5 23.0 31.5 878.5 23.0 Westinghouse Electric Corp U.S. 858.5 13.0 59.2 858.5 13.0 GTE Sylvania Inc U.S. 513.0 2.0 35.0 513.0 2.0 Monsanto Co U.S. 428.0 0.0 13.3 428.0 0.0 Fujitsu Japan 310.5 0.0 12.5 310.5 0.0 Univ Illinois Urbana-Champaign U.S. 265.0 0.0 3.9 265.0 0.0 Kyoto Univ Japan 264.0 0.0 15.0 264.0 0.0 1982 to 1991 Osaka Univ Japan 1562.0 31.0 23.5 1572.1 31.1 Fraunhofer Inst Appl S-S Physics Germany 829.4 0.0 3.2 830.0 0.0 Bell Labs U.S. 598.9 7.0 41.2 600.0 7.0 Nichia Corp Japan 430.0 0.0 1.0 433.7 0.0 MIT U.S. 403.0 1.0 7.0 403.5 1.0 NTT Corp Japan 354.0 10.0 34.0 355.3 10.1 Univ Joseph Fourier France 349.0 0.0 1.0 352.0 0.0 Univ of Texas at Austin U.S. 346.0 9.0 9.0 348.2 9.1 Univ of Toronto Canada 325.0 2.0 2.0 327.8 2.0 North Carolina State Univ U.S. 323.0 46.0 3.0 325.8 46.4 1992 to 2001 Nichia Corp Japan 7589.1 448.5 71.4 8057.2 498.5 Univ Illinois Urbana-Champaign U.S. 6565.3 419.2 66.1 6846.1 443.3 Bell Labs U.S. 4630.6 375.8 72.1 4824.2 395.0 MIT U.S. 4583.1 413.0 68.9 5210.8 459.8 Univ of Calif Santa Barbara U.S. 4057.9 293.3 58.0 4526.6 338.0 Univ of Calif Berkeley U.S. 3958.9 321.4 36.0 4644.4 378.0 Harvard Univ U.S. 3186.0 171.8 14.6 3882.6 213.6 Tohoku Univ Japan 3041.6 106.9 61.2 3365.2 123.0 Xerox Corp U.S. 2516.4 338.0 33.3 2767.4 367.0 Univ of Cambridge U.K. 2257.6 93.4 47.9 2437.4 106.3 2002 to 2006 Univ of Calif Santa Barbara U.S. 3534.0 2003.4 78.5 5952.1 3350.0 Rensselaer Polytechnic Inst U.S. 1988.1 1441.3 82.9 3330.5 2462.8 Univ of South Carolina U.S. 1542.9 1127.7 59.7 2326.8 1684.2 Chinese Academy of Sciences China 3114.2 988.2 211.9 5279.5 1681.9
45
Raw Counts Age-Adjusted Institution Country Cites W-Cites Papers Cites W-Cites National Cheng Kung Univ Taiwan 2029.6 945.9 100.3 3087.8 1492.3 National Chiao Tung Univ Taiwan 1346.3 943.3 88.9 2312.2 1639.5 Nichia Corp Japan 1394.4 833.0 33.6 2135.1 1247.0 National Tsing Hua Univ Taiwan 1057.4 714.6 42.2 1663.2 1112.6 National Central Univ Taiwan 839.0 604.2 55.0 1282.0 911.2 Yonsei Univ S. Korea 1031.5 600.2 27.2 1726.8 1006.9 2007 to early March 2012 Chinese Academy of Sciences China 3340.2 1148.9 540.3 11979.7 4107.5 National Taiwan Univ Taiwan 1480.2 853.7 263.7 5076.0 2897.3 Univ of Calif Santa Barbara U.S. 1909.2 796.3 149.7 6479.0 2902.0 National Chiao Tung Univ Taiwan 1079.9 726.8 239.7 4050.8 2663.4 Lehigh Univ U.S. 921.7 695.5 79.9 3973.7 2983.3 Sun Yat Sen University China 930.9 585.0 120.3 3198.0 1963.0 Samsung S. Korea 905.8 556.9 128.0 3108.9 1944.4 National Inst for Materials Sci Japan 1033.5 517.4 89.5 3443.3 1607.4 National Cheng Kung Univ Taiwan 948.5 503.7 249.1 3691.7 1878.2 Rensselaer Polytechnic Inst U.S. 645.6 449.1 102.6 2257.3 1582.7 Notes: Institutions are ranked by all citations through 2001, while papers and citations tend to be few, and are ranked by within-dataset citations thereafter, to screen out many recent off-topic publications including applications of LEDs to medicine and science. Through 2001 off-topic publications with high citation counts were identified and excluded manually. Data pertain to articles in the Science Citation Index and its conference proceedings companion, and therefore tend to undercount non-English language publications. All counts are divided by the number of institutional affiliations of authors on a paper, or for papers with information on all authors’ affiliations, counts are divided by the number of authors and then credit is apportioned to each author’s institution. For example a three-author paper with authors at three different institutions counts as 1/3 of a paper for each institution, and its number of citations is divided by three when crediting each institution. “Cites” is the total number of citations recorded in the citation indices, “W-Cites” is within-database citations for which LED-related papers cite other LED-related papers (this reduces citation counts related to external applications such as medical uses of LEDs), and “Papers” is a count of papers published. The last two columns contain age-adjusted versions of the citation metrics, using a best-fit quadratic citation lag function. Time periods are defined based on year of publication.
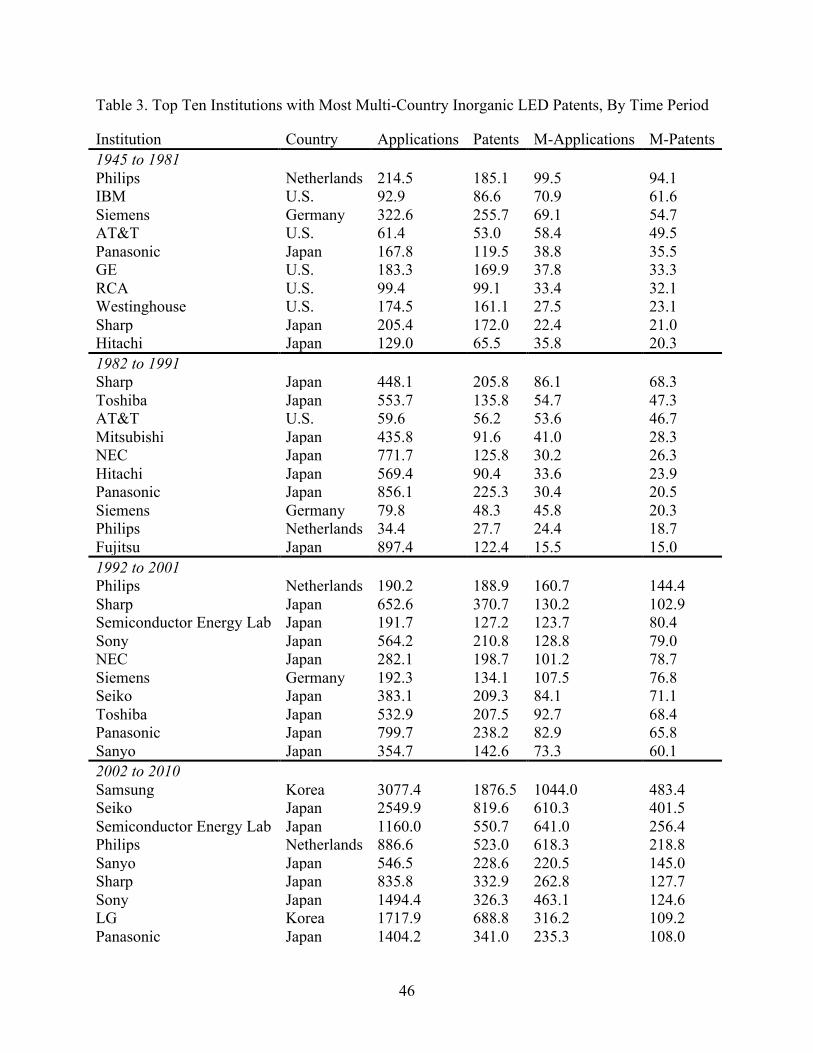
46
Table 3. Top Ten Institutions with Most Multi-Country Inorganic LED Patents, By Time Period
Institution Country Applications Patents M-Applications M-Patents 1945 to 1981 Philips Netherlands 214.5 185.1 99.5 94.1 IBM U.S. 92.9 86.6 70.9 61.6 Siemens Germany 322.6 255.7 69.1 54.7 AT&T U.S. 61.4 53.0 58.4 49.5 Panasonic Japan 167.8 119.5 38.8 35.5 GE U.S. 183.3 169.9 37.8 33.3 RCA U.S. 99.4 99.1 33.4 32.1 Westinghouse U.S. 174.5 161.1 27.5 23.1 Sharp Japan 205.4 172.0 22.4 21.0 Hitachi Japan 129.0 65.5 35.8 20.3 1982 to 1991 Sharp Japan 448.1 205.8 86.1 68.3 Toshiba Japan 553.7 135.8 54.7 47.3 AT&T U.S. 59.6 56.2 53.6 46.7 Mitsubishi Japan 435.8 91.6 41.0 28.3 NEC Japan 771.7 125.8 30.2 26.3 Hitachi Japan 569.4 90.4 33.6 23.9 Panasonic Japan 856.1 225.3 30.4 20.5 Siemens Germany 79.8 48.3 45.8 20.3 Philips Netherlands 34.4 27.7 24.4 18.7 Fujitsu Japan 897.4 122.4 15.5 15.0 1992 to 2001 Philips Netherlands 190.2 188.9 160.7 144.4 Sharp Japan 652.6 370.7 130.2 102.9 Semiconductor Energy Lab Japan 191.7 127.2 123.7 80.4 Sony Japan 564.2 210.8 128.8 79.0 NEC Japan 282.1 198.7 101.2 78.7 Siemens Germany 192.3 134.1 107.5 76.8 Seiko Japan 383.1 209.3 84.1 71.1 Toshiba Japan 532.9 207.5 92.7 68.4 Panasonic Japan 799.7 238.2 82.9 65.8 Sanyo Japan 354.7 142.6 73.3 60.1 2002 to 2010 Samsung Korea 3077.4 1876.5 1044.0 483.4 Seiko Japan 2549.9 819.6 610.3 401.5 Semiconductor Energy Lab Japan 1160.0 550.7 641.0 256.4 Philips Netherlands 886.6 523.0 618.3 218.8 Sanyo Japan 546.5 228.6 220.5 145.0 Sharp Japan 835.8 332.9 262.8 127.7 Sony Japan 1494.4 326.3 463.1 124.6 LG Korea 1717.9 688.8 316.2 109.2 Panasonic Japan 1404.2 341.0 235.3 108.0
47
Siemens Germany 801.2 347.5 334.3 98.9 Notes: Institutions are ranked by LED patents granted in multiple nations, as a metric of quality. Data pertain to patents granted in patent authorities worldwide (see Appendix A for details). For patents with multiple authors at different institutions, credit is divided equally among the authors and assigned to each author’s institutional affiliation. “Applications” includes LED patents applied for but not necessarily granted, and is subject to non-availability of data on non-granted patent applications in early periods in most nations. “Patents” are only granted patents. “M-Applications” and “M-Patents” are applications filed in, and patents granted in, multiple nations.
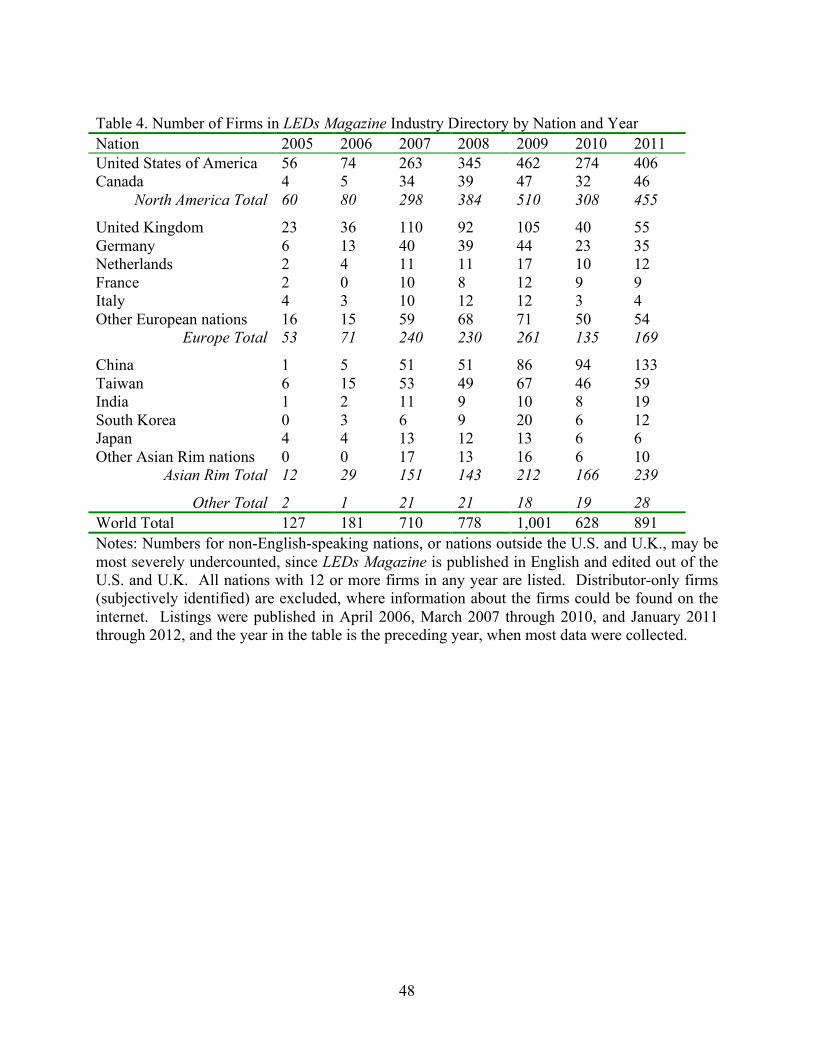
48
Table 4. Number of Firms in LEDs Magazine Industry Directory by Nation and Year Nation 2005 2006 2007 2008 2009 2010 2011 United States of America 56 74 263 345 462 274 406 Canada 4 5 34 39 47 32 46
North America Total 60 80 298 384 510 308 455
United Kingdom 23 36 110 92 105 40 55 Germany 6 13 40 39 44 23 35 Netherlands 2 4 11 11 17 10 12 France 2 0 10 8 12 9 9 Italy 4 3 10 12 12 3 4 Other European nations 16 15 59 68 71 50 54
Europe Total 53 71 240 230 261 135 169
China 1 5 51 51 86 94 133 Taiwan 6 15 53 49 67 46 59 India 1 2 11 9 10 8 19 South Korea 0 3 6 9 20 6 12 Japan 4 4 13 12 13 6 6 Other Asian Rim nations 0 0 17 13 16 6 10
Asian Rim Total 12 29 151 143 212 166 239
Other Total 2 1 21 21 18 19 28 World Total 127 181 710 778 1,001 628 891 Notes: Numbers for non-English-speaking nations, or nations outside the U.S. and U.K., may be most severely undercounted, since LEDs Magazine is published in English and edited out of the U.S. and U.K. All nations with 12 or more firms in any year are listed. Distributor-only firms (subjectively identified) are excluded, where information about the firms could be found on the internet. Listings were published in April 2006, March 2007 through 2010, and January 2011 through 2012, and the year in the table is the preceding year, when most data were collected.
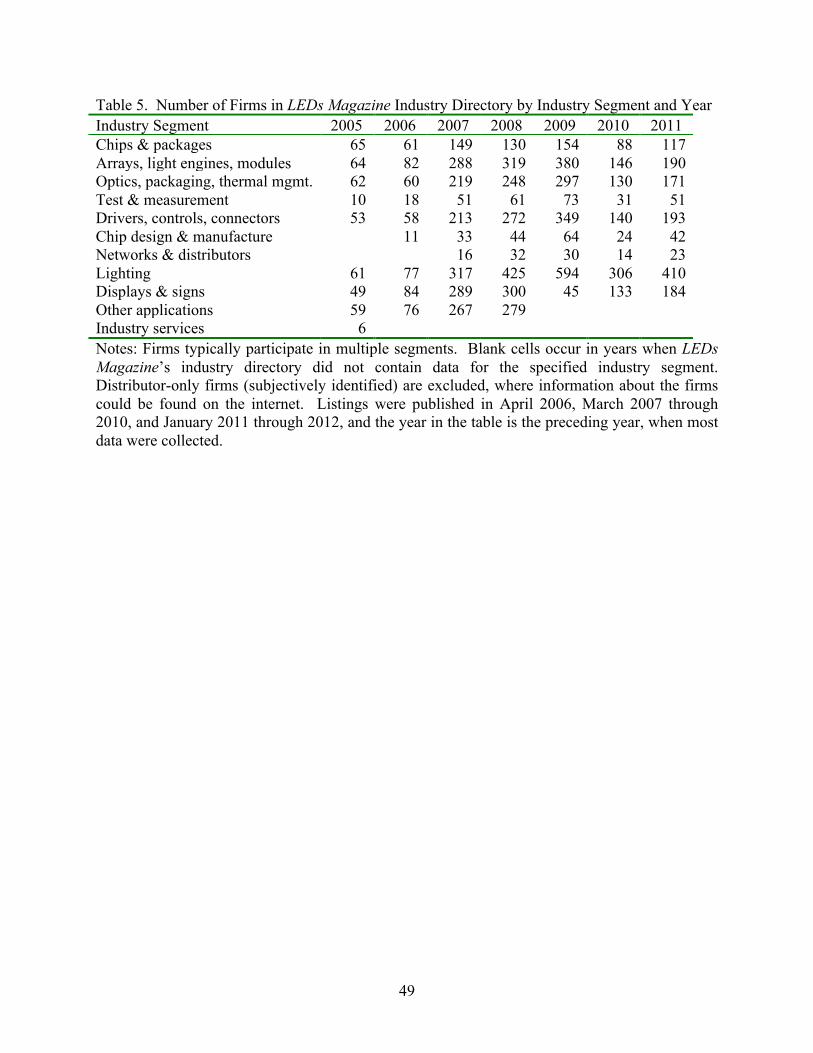
49
Table 5. Number of Firms in LEDs Magazine Industry Directory by Industry Segment and Year Industry Segment 2005 2006 2007 2008 2009 2010 2011 Chips & packages 65 61 149 130 154 88 117 Arrays, light engines, modules 64 82 288 319 380 146 190 Optics, packaging, thermal mgmt. 62 60 219 248 297 130 171 Test & measurement 10 18 51 61 73 31 51 Drivers, controls, connectors 53 58 213 272 349 140 193 Chip design & manufacture 11 33 44 64 24 42 Networks & distributors 16 32 30 14 23 Lighting 61 77 317 425 594 306 410 Displays & signs 49 84 289 300 45 133 184 Other applications 59 76 267 279 Industry services 6 Notes: Firms typically participate in multiple segments. Blank cells occur in years when LEDs Magazine’s industry directory did not contain data for the specified industry segment. Distributor-only firms (subjectively identified) are excluded, where information about the firms could be found on the internet. Listings were published in April 2006, March 2007 through 2010, and January 2011 through 2012, and the year in the table is the preceding year, when most data were collected.


