Download - LCA of cultivated meat - CE Delft

LCA of cultivated meat Future projections for different scenarios
ecoinvbron

1 190107 - LCA of cultivated meat – February 2021
LCA of cultivated meat Future projections for different scenarios
This report was prepared by:
Pelle Sinke, Ingrid Odegard
Delft, CE Delft, February 2021
Publication code: 21.190107.019
LCA / prospective analysis / cultivated / cultured / cell-based / meat / meat alternatives / 2030 / industry data
FT: Cultivation
Client: GAIA and The Good Food Institute
Publications of CE Delft are available from www.cedelft.eu
Further information on this study can be obtained from the contact persons, Pelle Sinke and Ingrid Odegard
(CE Delft)
© copyright, CE Delft, Delft
CE Delft
Committed to the Environment
Through its independent research and consultancy work CE Delft is helping build a sustainable world. In the
fields of energy, transport and resources our expertise is leading-edge. With our wealth of know-how on
technologies, policies and economic issues we support government agencies, NGOs and industries in pursuit of
structural change. For 40 years now, the skills and enthusiasm of CE Delft’s staff have been devoted to
achieving this mission.

2 190107 - LCA of cultivated meat – February 2021
Content
Summary 3
1 Introduction 8 1.1 A life cycle assessment based on the latest company data 8 1.2 Clients, partners and roles 8 1.3 Reading guide 9
2 Methodology and inventory 10 2.1 Goal and scope 10 2.2 Functional unit 11 2.3 Inventory 11 2.4 System and system boundaries 13 2.5 LCA method 18
3 Results and interpretation 20 3.1 Cultivated meat production system – baseline scenario 20 3.2 Comparison to conventional products 24 3.3 Sensitivity analyses 31
4 Conclusions and discussion 33 4.1 Conclusions and discussion 33 4.2 Recommendations 36 4.3 A process under development: uncertainties and limitations 36
References 37
A ReCiPe 39
B Inventory and data quality 40
C Sensitivity analyses 43
3 190107 - LCA of cultivated meat – February 2021
Summary
In this prospective Life Cycle Assessment (LCA) study1 of cultivated meat (CM, also
sometimes referred to as cell-based meat, clean meat, cultured meat and in-vitro meat) we
provide insight into the environmental impact of this product when produced at commercial
scales. This is the first LCA study which uses primary data from multiple CM companies and
from associated companies in the CM supply chain. Data collection efforts have been
carried out among over 15 companies active in CM development and its supply chain,
supplemented with cross-checks with independent experts. While uncertainties still exist
due to the early stage of technology development, we believe this has resulted in a robust
inventory with as much primary data as is currently possible.
Comparing future production systems in 2030
The results represent a production scenario for 2030, which reflects expected changes, both
internally (e.g. the scaling up of CM production) and externally (e.g. share of sustainable
sources in electricity mix). The final product being modelled is a ground-meat product,
cultivated around 37°C, produced in a future commercial-scale facility. The results for this
product are compared to an ambitious benchmark for conventional protein products, which
was chosen to make sure conclusions with regard to the sustainability of CM would be as
robust as possible. The ambitious benchmark should not be interpreted as a projection of
global average meat consumption in 2030. Results are presented using the weighted ReCiPe
single score (environmental single score) to represent the total environmental impact and
the carbon footprint (CFP) measured in greenhouse gas equivalents (GHGe). For more
context, global average carbon footprints are also shown for both the CFP and the
environmental single score (ambitious benchmark adjusted for average carbon footprint).
Cultivated meat has the potential to be a highly sustainable meat product
CM is compared to ambitious benchmarks of traditional meats and meat alternatives. CM in
the conventional energy scenario has a lower environmental single score and lower CFP than
beef (also dairy beef), but a higher environmental single score than chicken, pork, and
plant-based meat alternatives in the baseline scenario (Figure 1 and Figure 2). As can be
seen in Figure 1, in case of a switch to sustainable energy, CM has a lower environmental
single score than all meat products.
If the carbon footprint component in the environmental single score is adjusted to reflect
the global average carbon footprint of meat products, conventional energy CM scores
comparable to the adjusted single score for chicken, and lower than pork and beef. CM can
compete on carbon footprint with the global average footprints for chicken and pork, if
> 30% of energy use is sourced sustainably.
Compared to all meat products, both cultivated and conventional, the environmental single
score and the carbon footprint of vegetable protein products is low. With a carbon footprint
which is 2.5 to 4 times lower, and an environmental single score of over 3 and 7 times
________________________________ 1 Note: This report is one part of the combined Life Cycle Assessment (LCA) and Techno-Economic Assessment
(TEA) project. For the TEA, see CE Delft (2021).

4 190107 - LCA of cultivated meat – February 2021
lower, cultivated meat is unlikely to be able to compete with vegetable protein products on
these two indicators.
In livestock production, the total environmental impact is driven by a number of impacts:
climate change, fine particulate matter formation (both direct from stables and feed crop
production, as indirect from ammonia), land use and human toxicity. For CM, this is
primarily driven by climate change impacts, and to a lesser extent fine particulate matter
formation. This also means that switching to sustainable energy means lowering the impact
of multiple environmental impact categories at once.
Figure 1 – Environmental impact (ReCiPe single score) of CM and conventional protein products (ambitious
benchmark and ambitious benchmark adjusted for global average score on global warming)
* Intensive, West-European, circular agriculture with LUC-free soy.
** ‘Other’ includes 14 impact categories, among which other toxicity categories, acidification and resource
depletion. A complete list can be found in Annex A.
*** Current global average carbon footprint taken from Poore and Nemecek (2018).
We have analysed the effects of a conventional energy scenario (global stated policies
electricity mix for 2030 and heat from natural gas) and a sustainable scenario (solar and
wind electricity and geothermal heat) in this study. Of course there are many other
variations possible, with sustainability performance likely to fall somewhere between these
scenarios, at least in the timeframe modelled in our study (2030). This largely depends on
the geographical location and choices of the CM producer to either buy or produce certain
types of electricity.
Most important drivers of impact: energy use and medium
The environmental impact of CM is largely driven by energy use; primarily electricity use
during production itself, but also electricity and heat use in upstream production of
medium. We therefore see that electricity use is the most important driver for the
environmental single score impact of CM in a conventional energy scenario (see Figure 2).
200
400
600
800
1000
1200
1400
1600
1800
2000
Meatless Tofu CM(sust.)
Chicken Pork CM(conv.)
Beef(dairycattle)
Beef(beef
cattle)
mPt
/ k
g p
roduct
Environmental single scoreCultivated meat (CM) compared to ambitious benchmark for conventional products*
Global warming
Land use
Water consumption
Fine particulate matter formation
Human toxicity
Other**
AB + current global average GWP***
4006

5 190107 - LCA of cultivated meat – February 2021
After climate change, fine particulate matter formation contributes most to total impacts.
Both are primarily driven by energy production and heavy industrial processes (mining and
raw material processing) upstream in the globalised supply chains. If these processes take
place in areas of high population density, the impacts can be significant. It is therefore
important to have transparency in the supply chain.
Sensitivity analyses show that results are sensitive to medium quantity (driven by efficiency
of conversion of medium into final product), lower maximum cell densities and cooling load
required (for eliminating hotspots caused by metabolic heat). Process optimisation in these
areas may result in significant environmental improvements.
Figure 2 – Environmental impact (ReCiPe single score) per kg CM, contribution analysis
354
130
50
100
150
200
250
300
350
400
Conventional energy Sustainable energy
mPt
/ k
g C
M
Environmental impact of cultivated meat (CM)Baseline scenario
HVAC
Wastewater treatment
CIP/SIP
Equipment
Scaffolds
Medium
Heat for production
Electricity for production
Total

6 190107 - LCA of cultivated meat – February 2021
Figure 3 – Carbon footprint of CM and conventional protein products (ambitious benchmark + global average
based on Poore and Nemecek 2018)
* Intensive, West-European, circular agriculture with LUC-free soy. The ‘current’ bar represents additional
impacts of current production compared to the 2030 benchmark.
** Taken from Poore and Nemecek (2018).
In comparison to earlier studies (Tuomisto et al. 2014; Tuomisto and Teixeira de Mattos
2011; Mattick et al. 2015), the CFP of CM is higher in this study. This is mainly driven by the
model assumption that cooling of the process takes place using active cooling. This also
results in significantly higher industrial energy use than in aforementioned studies. We show
however the potential benefits of using a more sustainable energy mix for production.
This study shows that CM has the potential to become a sustainable source of protein
compared to most conventional meat products, and could even undercut all conventional
animal meats in sustainable energy scenarios. Specific attention should thus be given
towards sourcing of sustainable energy and optimising specific process characteristics
regarding medium efficiency, maximum cell density and the balance of heating and cooling
during proliferation.
10
20
30
40
50
60
Meatless Tofu CM (sust.) Chicken Pork CM (conv.) Beef (dairycattle)
Beef (beefcattle)
kg C
O2-e
q. / k
g p
roduct
Carbon footprintCultivated meat (CM) compared to ambitious benchmark for
conventional products*
Cultivated meat - 2030
Conventional products - current (ambitious benchmark)*
Conventional products - 2030 (ambitious benchmark)*
Conventional products - current (global average)**
99

7 190107 - LCA of cultivated meat – February 2021
Overlap LCA and TEA
At the same time this LCA was carried out, a techno-economic assessment (TEA) was also
made (CE Delft 2021). Do conclusions overlap? Can measures to reduce environmental
impact also lower costs, and vice versa? Four aspects stand out:
1. Energy efficiency: being more energy efficient reduces environmental impact and
costs. There still are uncertainties regarding energy use for heating and cooling, and
further research into e.g. energy efficient cooling and sustainable heat sources could
help reduce both environmental impact and costs.
2. Energy sources: a switch to sustainable energy, especially electricity, substantially
lowers the environmental impact. The most transparent and robust way to ensure
additional sustainable electricity production, which actually lowers the national average
environmental impact of electricity generation, is taking care of one’s own sustainable
electricity generation. If sustainable electricity is generated by the CM company on site,
this could also mean a reduction in cost compared to either fossil or sustainable
electricity purchased on the market.
3. Medium use: both increased medium efficiency and increasingly efficient production of
ingredients can lower both costs and environmental impacts. Especially regarding
certain functional ingredients: the results of the LCA and of the TEA both highlight
certain specialty functional ingredients such as recombinant proteins in this regard.
A reduction or a switch could mean reducing both impact and costs.
4. Supply chain collaboration: To reduce environmental impact and costs further,
collaboration in the supply can help lower impact and costs of production of all required
substances for CM production. Most notably this is important with regard to medium
ingredients, but this reasoning can of course be extended to other inputs (e.g. scaffolds,
filtration membranes) as well.

8 190107 - LCA of cultivated meat – February 2021
1 Introduction
Numerous innovative companies are currently exploring and developing methods to produce
cultivated meat (CM, also sometimes referred to as cell-based meat, clean meat, cultured
meat or in-vitro meat): animal cells cultivated in bioreactors, as opposed to on a farm.
Conventional meat production is associated with high environmental impacts, e.g. in
contribution to climate change, land use and land use change related to feed, and local
air quality. Therefore, an alternative could potentially be very attractive from an
environmental perspective. A prospective life cycle assessment (LCA) is the best way to
explore the potential impact.
1.1 A life cycle assessment based on the latest company data
Several studies on the environmental impact of CM have been done, but there are still large
uncertainties surrounding the results (for an overview, see Scharf et al. 2019). The results
so far suggest that whether CM compares favourably to its conventional counterpart, largely
depends on the type of conventional meat CM is compared to. Most studies suggest
cell-based beef may become more environmentally friendly than conventional beef, since
the latter has a high associated environmental impact. For chicken meat and pork, it is less
clear how cell-based meat compares to conventional counterparts. So far, none of the
studies assessing the environmental impact of CM have used primary data from multiple CM
manufacturers or and from associated companies in the supply chain. Acknowledging that
CM is still in development and many significant challenges exist (see e.g. Stephens et al.
2018), our life cycle assessment (LCA) uses the latest data and understanding to give the
currently best possible insight into the expected environmental impact of CM when
production is scaled up to commercial scales in the future.
The goal of our assessment is to get a better idea of how CM compares environmentally to
different types of conventional meat, for different environmental indicators. Furthermore,
the contribution of different parts of the process will be of specific interest, and how a
potential range in certain inputs and outputs influences the environmental outcome.
Because the CM process is still in development, there is a degree of uncertainty regarding
the results. Where possible we have included ranges and interpretation of such ranges and
the uncertainties. Therefore, the results presented here should not be interpreted as ‘the
truth’, but rather as a good indication and a basis to assess impact of internal and external
factors, and the possibilities and focus areas for further improvement of the CM process in
the future.
1.2 Clients, partners and roles
This study was commissioned by GAIA and The Good Food Institute (clients). While expertise
from both organisations was relevant in the research process, CE Delft was independent in
carrying out the research, and data from (CM and other) companies was not shared with the
clients. Over fifteen companies (both CM developing companies and companies active in the
supply chain) were involved in this project to provide data, for modelling and cross-checks.
A full list of main data partners is included in Chapter 2.

9 190107 - LCA of cultivated meat – February 2021
1.3 Reading guide
In Chapter 2 we describe the methodology used and the process followed for data inventory
and data sources. Because much of the data gathered is confidential, this report does not
include a full data inventory (a summary is given in Annex A). In Chapter 3 we describe the
results; we dive into the weighted score (the ReCiPe single score (Annex A), which includes
eighteen environmental impact categories), and the carbon footprint of CM. We also make a
comparison to conventional products. In the comparison, additional to the ReCiPe single
score and the carbon footprint, we highlight the results for land use, water use and
particulate matter formation. Furthermore, in Chapter 3 we elaborate on certain parts of
the production process with sensitivity analyses (underlying data and assumption in
Annex C). In Chapter 4 we interpret results and draw conclusions.

10 190107 - LCA of cultivated meat – February 2021
2 Methodology and inventory
In this chapter we elaborate on the methodology used to assess the environmental impact
of cultivated meat (CM) and the process of data inventory.
2.1 Goal and scope
This study is a comparative ex-ante life cycle assessment (LCA) of cultivated meat, with a
comparison to conventional protein products, both meat- and plant-based. The goal of this
study is to gain insight into the environmental impact of CM, into the contribution of
different processes to the impact and compare the impact to conventional protein products
(meat and plant-based alternatives).
As CM is still in development, we model a future commercial scale production facility which
reflects expected changes, both internally (the scaling up of CM production) and externally
(e.g. share of sustainable sources in electricity mix).
In this LCA we look at cultivated meat production from cradle to facility gate. This means
that all process inputs and outputs up to the meat leaving the facility are considered.
This includes resource extraction, energy production that is needed to produce the
cultivated meat, from all parts of the production process (including nutrition medium and
production equipment) and transport between processes. For the conventional meat
products and plant-based alternatives this means we look at all inputs into the agricultural
processes (e.g. fertilizer and land used for feed production), transport of feed to the animal
farm, emissions at the animal farm, including emissions for energy use, transport to a
slaughterhouse and slaughtering.
We present the environmental impact for a non-specific type of CM. The baseline scenario
considers a CM product of a meat product, cultivated around 37°C. Water-based animals
can often be grown at lower temperatures, but this temperature-range is currently out of
scope, as are comparisons to conventional seafood. Other model inputs, besides energy
demand, are based on inventory data from both land-based and water-based animals.
Because of data confidentiality, no division into different types of meat (e.g. beef, chicken)
is possible at the moment, as the number of data sources per type of cultivated meat is
limited. Presenting results per type, if possible (because of data availability), would
therefore for some types mean presenting results for a specific company, which we do not
do in this report. Therefore, the results do not represent the impact of a specific product
developed by a specific CM company, and may not be interpreted as such. CM companies
can use the results to gain insight into factors that may contribute (significantly) to their
impact, or extract recommendations for focus areas for future exploration within their
product development and for product improvement.

11 190107 - LCA of cultivated meat – February 2021
2.2 Functional unit
The functional unit of this study is: the production of 1 kg of high-protein product (i.e. CM,
conventional meat or a plant-based meat alternative that is eaten for its high protein
content)2.
Composition and structures of different protein products may vary (slightly), e.g. in terms
of water, protein and carbohydrate content, or in texture and mouth-feel.
The compositions of the CM product modelled, as well as of conventional meat products and
alternatives are presented in Table 1. For CM, the final product is determined to be a
ground-meat type product that has had ten days of differentiation and maturation.
This yields a product that is slightly texturized, but needs further processing into final
products. This further processing into final products is out of scope, for CM as well as for
conventional meat products (which often undergo further processing as well).
Table 1 – Composition of different protein products3
Product Water Protein Carbohydrates Other
% of total weight
CM 70-80 18-25 0 0-12
Beef 74 23 0 3
Pork 72 22 2 4
Chicken 74 23 0 3
Tofu 78 11 1 10
Meatless (wheat-based)4 50-80 10-25 1-5 10-25
2.3 Inventory
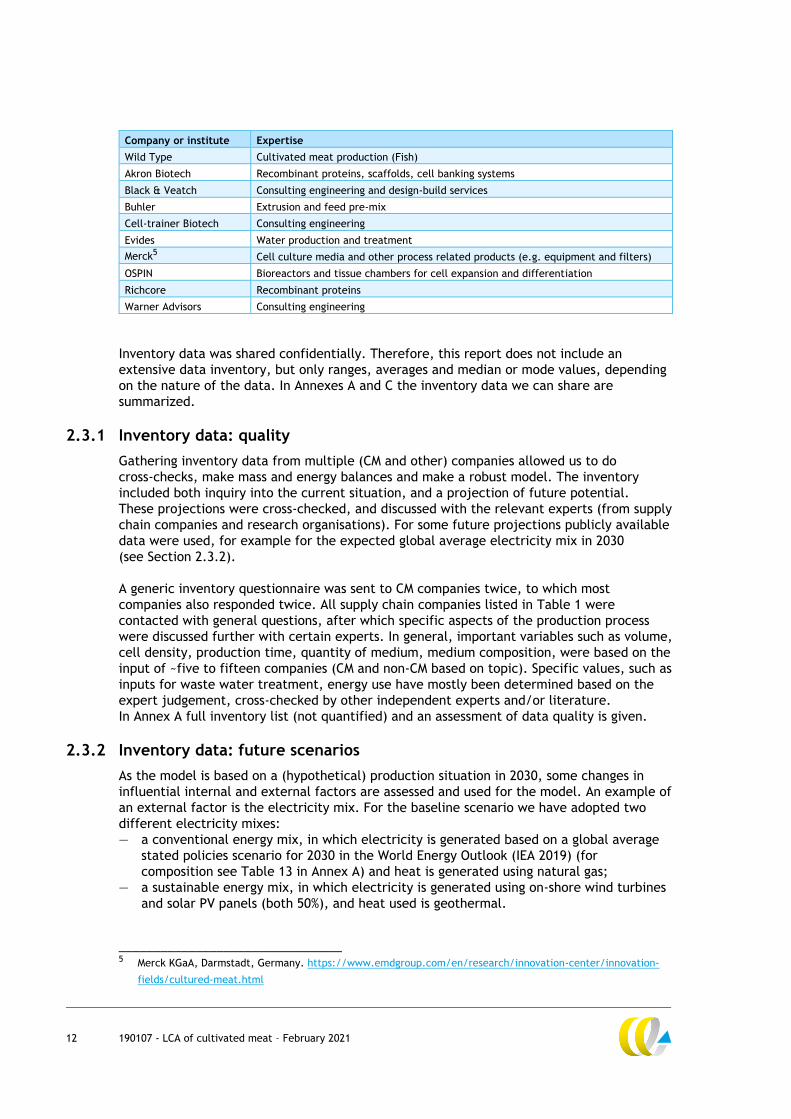
To ensure a robust model and robust results, we contacted over fifteen companies that (aim
to) have a role in the CM supply chain for environmental data. These main data suppliers
and their expertise to the data inventory are listed in Table 2.
Table 2 – Partnering companies and institute, and their contribution to the data inventory for the LCA
Company or institute Expertise
A*star Cultivated meat research institute (Avian)
Aleph Farms Cultivated meat production (Bovine)
Avant Meats Cultivated meat production (Fish)
Mosa Meat Cultivated meat production (Bovine)
Shiok Meats Cultivated meat production (Crustacean)
________________________________ 2 In the case of CM this means 1 kg of meat cells. The impact of any scaffolding material is added to the total
environmental impact, but is not counted as mass for the functional unit. In this study this means that 1 kg of
CM actually is 1.1 kg of ‘CM-product’, including 0.1 kg of edible plant-based scaffolding material. This is done in
order to avoid underestimations of the environmental impact of CM because of low-impact scaffolding material
skewing final results. 3 https://nevo-online.rivm.nl/ 4 Meatless is a brand of texturized meat replacement products (high protein content). Various product types,
among which the one mentioned here, are included in the Agri-Footprint LCA database. For more info:
https://www.meatless.nl/. Exact composition is unknown to us, composition was based on summary of typical
meat analog ingredients taken from Egbert and Borders (2006).
12 190107 - LCA of cultivated meat – February 2021
Company or institute Expertise
Wild Type Cultivated meat production (Fish)
Akron Biotech Recombinant proteins, scaffolds, cell banking systems
Black & Veatch Consulting engineering and design-build services
Buhler Extrusion and feed pre-mix
Cell-trainer Biotech Consulting engineering
Evides Water production and treatment
Merck5 Cell culture media and other process related products (e.g. equipment and filters)
OSPIN Bioreactors and tissue chambers for cell expansion and differentiation
Richcore Recombinant proteins
Warner Advisors Consulting engineering
Inventory data was shared confidentially. Therefore, this report does not include an
extensive data inventory, but only ranges, averages and median or mode values, depending
on the nature of the data. In Annexes A and C the inventory data we can share are
summarized.
2.3.1 Inventory data: quality
Gathering inventory data from multiple (CM and other) companies allowed us to do
cross-checks, make mass and energy balances and make a robust model. The inventory
included both inquiry into the current situation, and a projection of future potential.
These projections were cross-checked, and discussed with the relevant experts (from supply
chain companies and research organisations). For some future projections publicly available
data were used, for example for the expected global average electricity mix in 2030
(see Section 2.3.2).
A generic inventory questionnaire was sent to CM companies twice, to which most
companies also responded twice. All supply chain companies listed in Table 1 were
contacted with general questions, after which specific aspects of the production process
were discussed further with certain experts. In general, important variables such as volume,
cell density, production time, quantity of medium, medium composition, were based on the
input of ~five to fifteen companies (CM and non-CM based on topic). Specific values, such as
inputs for waste water treatment, energy use have mostly been determined based on the
expert judgement, cross-checked by other independent experts and/or literature.
In Annex A full inventory list (not quantified) and an assessment of data quality is given.
2.3.2 Inventory data: future scenarios
As the model is based on a (hypothetical) production situation in 2030, some changes in
influential internal and external factors are assessed and used for the model. An example of
an external factor is the electricity mix. For the baseline scenario we have adopted two
different electricity mixes:
— a conventional energy mix, in which electricity is generated based on a global average
stated policies scenario for 2030 in the World Energy Outlook (IEA 2019) (for
composition see Table 13 in Annex A) and heat is generated using natural gas;
— a sustainable energy mix, in which electricity is generated using on-shore wind turbines
and solar PV panels (both 50%), and heat used is geothermal.
________________________________ 5 Merck KGaA, Darmstadt, Germany. https://www.emdgroup.com/en/research/innovation-center/innovation-
fields/cultured-meat.html

13 190107 - LCA of cultivated meat – February 2021
These two 2030 energy mixes were used for the CM production process itself and for the
medium production process. For electricity use further downstream, e.g. production of
bioreactors and auxiliaries, current electricity mixes were used. This means the
environmental footprint could be lower if electricity use is sustainably sourced throughout
the supply chain.
For production processes upstream, we have selected state-of-the art production processes
as much as possible in the Ecoinvent database (Wernet et al. 2016). This usually means that
production data is from >2005 and from industrialised countries. For some products in the
upstream supply chain, there are no industrial-scale production facilities yet. In these
situations, together with the companies and independent experts we have estimated
increases in efficiency and expected effects of economies of scale, based on comparable
effects observed in the sector. If this was not possible, we have assumed current best
practice to be representative of 2030 production.
The availability and quality of data inevitably introduce uncertainties into the model,
therefore we have assessed different scenarios and sensitivity analyses to estimate to which
extent (ranges in) different factors influence results (see Section 2.4.3 and Section 3.3).
2.4 System and system boundaries
Figure 4 shows a simplified flowchart of the CM production process. Vials with inoculum of
cell lines are stored in a cell bank. To start production, a vial is taken and the cells are
multiplied in a series of bioreactors of increasing volume in a process called the seed train
(small-scale proliferation). Finally the cells are moved to the largest proliferation vessel,
where they multiply until maximum cell density is reached. At this point, a percentage of
the total cells is removed from the proliferation reactor and seeded onto a scaffold in a
perfusion reactor for differentiation and maturation. At the end of the process, the cells
are harvested from the perfusion reactor and prepared for further processing by washing
and centrifuging.

14 190107 - LCA of cultivated meat – February 2021
Figure 4 – Simplified flow chart of cultivated meat (CM) production
2.4.1 Main parameters for model (baseline scenario)
We modelled production of CM for a future situation, in which production is scaled up to a
production unit of 10 kton per year. The theoretical baseline production line is described
below and in Figure 5. This design of the production process is based on Specht (2020),
adapted in some aspects for the purposes of this study.
The input data for the model is based on company data, as described in Section 2.3.
The baseline parameters for the model are reported in Annex A. The baseline parameters
are based on representative averages, or in some cases median or mode, values (depending
on the spread). It is important to note that the values used in this study do not represent
any single production system and the values can therefore not be interpreted as being fully
representative for the product system of any of the companies involved in providing data.
For a few parameters, variation in company data causes large uncertainties in final results,
and therefore sensitivity analyses were performed (see Section 2.4.3 for elaboration).
The process (schematically shown in Figure 1) is semi-continuous with three intermediate
harvests. Proliferating occurs until the largest stirred-tank reactor (STR) volume (working
volume 10,000 L) is filled, at which point 50% of the cells are harvested, the medium is
refilled, and cells again proliferate until maximum density is reached. This repeats a total
of three times, in total ensuring 200% (relative to the largest proliferation reactor: 50% +
50% + 100%) of cells are harvested. Harvested cells are seeded onto scaffolds in perfusion
reactors (PR). This production line has a total of 4 PRs (working volume 2,000 L, each

15 190107 - LCA of cultivated meat – February 2021
containing 50% of the harvest) installed in parallel6. After each production run (for the
10,000 L STR this is twelve days, for each of the PR this is ten days) the reactors are
cleaned using a clean-in-place and steam-in-place (CIP/SIP) system. The total production
time from cell vial to harvest is 42 days. Around 130 of these production lines are assumed
to be operating in parallel to meet the demands of 10 kton annually set forth in the study.
Figure 5 – Baseline production line, semi-continuous with three intermediate harvests
2.4.2 Conventional protein products
In this assessment, we compare the results for CM with conventional protein products.
In Table 3 the conventional protein products which are used in the comparison are listed, as
well as the basis (database and process) for the assessment of their impacts.
We note an important aspect related to system boundaries of the intensive animal
production systems. For pork and chicken, manure application in agriculture and
corresponding emissions are not included in the model. In circular agriculture, with an
intensity (number of farms) that fit the local and regional environmental boundaries,
manure is considered a valuable resource. Emissions in the agricultural phase are allocated
to the agricultural product for which the manure is used as a fertilizer. It is important to
note that the value of manure depends on the local situation; in regions with a nitrogen
surplus, manure becomes a waste stream, as is the case in the Netherlands. For beef (cattle
and dairy) manure application is included in the model, for which an extensive system is
assumed where all manure is used on grassland within the system boundaries of the farm.
________________________________ 6 The perfusion systems modelled in this study do not yet exist and the cultivated meat industry will have to
innovate over the next decade to develop cost-effective perfusion systems tailored for meat production. Areas
of focus may include automated, adaptive control of feeding and perfusion rates that limit the formation of
nutrient and oxygen gradients, incorporation of scaffolding, and automated media recycling and cell harvesting
systems.

16 190107 - LCA of cultivated meat – February 2021
We also included two vegetable protein products: tofu and meatless. First, because
vegetable protein products are also alternatives to meat when looking for more sustainable
sources of protein. Second, because products like meatless can, similarly to CM, be used in
hybrid products (with conventional meat or CM). There are therefore included to show a
more complete picture.
Changes in production systems, which may have an effect on environmental impact, are
possible. To make sure we include such changes, and present a fair comparison to CM, a
number of changes were made to the conventional processes to present an ambitious 2030
benchmark. These changes are not meant to be interpreted as a projection.
Box 1 – Rationale ambitious benchmark conventional products and system perspective
We chose an ambitious benchmark to make sure that no unfair advantage is given to CM; if CM is presented as an
environmental solution, it needs to be able to compete environmentally with the conventional meat products
which have a relatively low environmental impact. This also means that the potential environmental benefits of
CM shown here, are minimum benefits; compared to ‘global average production’ environmental benefits are
larger.
The footprints for conventional products presented here are not meant as a projection, certainly not of global
average footprints. In our opinion they represent the low end (footprint-wise) of optimized intensive production
in 2030 in West-European countries, in case of a circular agricultural system.
Important to note here is that not all sustainability issues are included in LCA, some of which are particularly
interesting when considering animal products; e.g. soil health, odour and animal welfare. We also stress that
looking at environmental impact of products is not the only indicator of sustainability of this sector. Also, the
local situation, and the intensity of the system (number of producers in an area) is important; emissions of
particulate matter, odour, acidification and eutrophication are more of a problem in areas with higher
population, with higher background concentrations of these emissions and therefore also in areas with numerous
producers generating these emissions.
Methane emission from enteric fermentation contributes significantly to the carbon
footprint of beef products. Food additives have been developed that claim a reduction of
methane emissions from enteric fermentation, of up to 30%7. To our knowledge, these
claims are not yet robustly substantiated in field tests and literature, and therefore we
have modelled a reduction of 15%, with an addition to feed of 1.5 grams of enzymes per
day. Electricity and heat used for production of these enzymes is modelled as sustainable.
For pork and chicken (and to a much lesser extent beef) the inclusion of e.g. soy products
contributes significantly to the carbon footprint and to loss of biodiversity, through land use
change (LUC). For soy, certification of LUC-free soy has been around for a while8.
For all feedstuffs, it was therefore assumed possible that LUC associated with soy will be
zero in 2030 (both in m2a and in kg CO2).
Energy (electricity and heat) is used in numerous processes throughout the meat (and meat
alternatives) production chains. In the comparison with CM, it was assumed that all
electricity and heat is from a similar source (same environmental impact) as in the
sustainable energy scenario for CM.
________________________________ 7 https://www.dsm.com/corporate/solutions/climate-energy/minimizing-methane-from-
cattle.html#:~:text=Just%20a%20quarter%20teaspoon%20of,the%20cow's%20normal%20digestive%20system 8 The Round Table on Responsible Soy was founded in 2006. https://responsiblesoy.org/sobre-la-rtrs?lang=en

17 190107 - LCA of cultivated meat – February 2021
For cattle (beef and dairy), emission of ammonia (NH3) contributes substantially to the
environmental single score result. With additional outdoor grazing, ammonia emissions can
be reduced. Outdoor grazing is already included, for example for dairy cattle based on the
average grazing in the Netherlands. The ammonia emissions modelled for Ireland (beef) are
a little higher. For both, 50% of the difference between the Dutch average and the required
amount for organic production, in hours of outdoor grazing per year, was included as a
potential reduction of ammonia emissions (based on Hoving et al. (2014)). This translates to
a reduction of ammonia emissions by 5.4%.
The changes presented here results in an environmental single score which is 6% (beef),
11% (pork), and 25% (chicken) lower, and a carbon footprint which is 15% (beef), 26% (pork)
and 53% (chicken) lower for the 2030 benchmark.
Table 3 – Choice for ambitious benchmark for conventional products (intensive, West-European, circular
agriculture, LUC-free soy), their source for the impact assessment, and the adjustments made to reflect
changes in production systems in 2030
Product Based on database and process Adjusted for
Beef
(beef
cattle)
Agri-footprint: Beef meat, fresh,
from beef cattle, at slaughterhouse,
PEF compliant/IE Economic
Methane emissions from enteric fermentation: -15%,
additional input: enzymes.
Additional outdoor grazing resulting in ~5.4% lower NH3
emissions.
Sustainable energy (electricity and heat) at farm and in
feed compound production and soybean production.
Beef
(dairy
cattle)
Agri-footprint: Beef meat, fresh,
from dairy cattle, at slaughterhouse,
PEF compliant/NL Economic
Methane emissions from enteric fermentation: -15%,
additional input: enzymes.
Additional outdoor grazing resulting in ~5.4% lower NH3
emissions.
Sustainable energy (electricity and heat) at farm and in
feed compound production and soybean production.
Pork Agri-footprint: Pig meat, fresh, at
slaughterhouse/NL Economic
No LUC or associated GHG emissions related to soy in
feed.
Sustainable energy (electricity and heat) at farm and in
feed compound production and soybean production.
Chicken Agri-footprint: Chicken meat, fresh,
at slaughterhouse/NL Economic
No LUC or associated GHG emissions related to soy in
feed.
Sustainable energy (electricity and heat) at farm and in
feed compound production and soybean production.
Tofu Ecoinvent: Tofu [CA-QC]| production
| Cut-off
No LUC or associated GHG emissions related to soy.
Sustainable energy (electricity and heat) at production
facility and for soybean production.
Meatless
(wheat-
based)
Agri-footprint: Meatless, hydrated
(wet), wheat based, at plant/NL
Economic
Sustainable energy (electricity and heat) at production
facility.
2.4.3 Sensitivity analyses
As the technology is still under development and companies pursue different final products
for a range of species, there is a lot of uncertainty in the results. While the production
process generally is the same across these companies, details may vary. The baseline
scenario is based on average, or sometimes median, values derived from the questionnaires.
Where variation in influential parameters was observed, sensitivity analyses were

18 190107 - LCA of cultivated meat – February 2021
conducted in order to provide insight into the different process designs. Companies can
compare the results of the baseline scenario with those of the sensitivity analysis in order
to estimate the environmental profile of their own production process.
The sensitivity analyses performed are the following:
— Production run time: Can be longer or shorter depending on doubling time (during
proliferation stages) and the desired level of maturity of the cells in the final product.
— Maximum cell density: During proliferation stages the cell density can be higher or
lower depending on e.g. cell type or reactor type.
— Cell volume: The cell volume can be smaller or larger, depending on species type and
cell type.
— Efficiency of medium use: Ingredients can be used more or less efficiently, influencing
both inputs (amount of nutrients needed) and waste output.
The variation of model parameters for these scenarios is described in Annex C. The results
are reported in Section 3.3.
An important difference between companies that is assumed not to lead to significant
differences in results is the difference between water-based and land-based species. In this
study it was not possible to reliably quantify the implications for the environmental profile.
The topic is however discussed qualitatively below.
2.4.4 Process temperature and difference between water-based and land-
based species
There are a few important differences related to heating and cooling demand in cell
cultivation of land-based and water-based species. First, the temperature at which the
process has to be maintained is lower for water-based species (15-30°C) than for
land-based species (around 37°C) (Krueger et al. 2019). Second, the acceptable
temperature range is generally larger for water-based species than for land-based species,
meaning they are less sensitive to overheating and to the formation of temperature hot
spots in the reactor. Third, metabolic processes may differ significantly, resulting in
different energy expenditure dynamics and variation in metabolic heat produced.
Based on our data it was not possible to sufficiently determine differences in metabolic
heat produced. The aforementioned differences suggest that water-based species
production systems have a lower energy demand, both from lower heating demand and
lower cooling demand. Further analysis with more specific process data will have to shed
more light on this topic.
2.5 LCA method
There are two types of LCA assessment: attributional and consequential. In an attributional
analysis one assesses the impact of realisation of the functional unit and does not consider
(environmental) impacts on the overall economy if the product or service under assessment
would replace the current situation. In a consequential assessment, such considerations are
taken into account. This increases the number of variables and the uncertainty of results.
In this study an attributional approach was chosen, because we are looking at a product
under development, which already has its own internal and external variables and
uncertainties. Furthermore, because an important part of the promise of CM is the potential
reduction in environmental impact, it is important to start with a clear and transparent
assessment of that impact.

19 190107 - LCA of cultivated meat – February 2021
2.5.1 Software, databases and impact assessment method
The LCA was modelled in the LCA software SimaPro. The LCA database Ecoinvent 3 (Wernet
et al. 2016), version 3.6 (allocation cut-off by classification), was used for most background
processes in the CM model. For some of the biobased ingredients in the medium (maize
solubles and soy), the conventional products and the plant-based alternatives the Agri-
footprint database (Durlinger et al. 2017) was used (version 4.0, economic allocation). The
impact assessment method used is ReCiPe World H/A. The ReCiPe method is described in
more detail in Annex A.
2.5.2 Environmental impact categories
Food products (or bio-based products in general) are associated with a wide range of
environmental impacts. Not only an impact on climate change, but also e.g. land use,
particulate matter formation and water use. Because an important part of the CM
production process is medium production, based on bio-based ingredients, assessing a set of
impact categories is also important when assessing CM. Therefore, we look at the ReCiPe
single score, which includes the eighteen impact categories listed in Table 4. We call this
the ‘environmental single score’ throughout the report. This way we make sure that we
have insight into potential shifting of burdens (from one category to the other). The results
on these impact categories reflect potential impacts. For most of these categories, actual
impacts depend on the local or regional situation, except for global warming. Therefore, for
CM companies who want to minimize their impacts for future production locations,
assessing the local situation is important (e.g. is this a water scarce region?), and
implementing procurement criteria (e.g. sustainable/no-LUC soy and sustainable energy).
Table 4 – Impact categories, and corresponding units, included in ReCiPe method
Impact category Unit
Global Warming kg CO2-eq.
Stratospheric ozone depletion kg CFC11-eq.
Ionizing radiation kBq Co-60-eq.
Ozone formation, Human health kg NOx-eq.
Fine particulate matter formation kg PM2.5-eq.
Ozone formation, Terrestrial ecosystems kg NOx-eq.
Terrestrial acidification kg SO2-eq.
Freshwater eutrophication kg P-eq.
Marine eutrophication kg N-eq.
Terrestrial ecotoxicity kg 1,4-DCB-eq.
Freshwater ecotoxicity kg 1,4-DCB-eq.
Marine ecotoxicity kg 1,4-DCB-eq.
Human carcinogenic toxicity kg 1,4-DCB-eq.
Human non-carcinogenic toxicity kg 1,4-DCB-eq.
Land use m2a crop-eq.
Mineral resource scarcity kg Cu-eq.
Fossil resource scarcity kg oil-eq.
Water consumption m3

20 190107 - LCA of cultivated meat – February 2021
3 Results and interpretation
In this chapter we present the LCA results. We first focus on the CM production system in
Section 3.1: we start with the impact on the ReCiPe (environmental) single score in
Section 3.1.1, then elaborate on the carbon footprint in Section 3.1.2. In Section 3.2 we
focus on a comparison between CM and different protein products, again zooming into
environmental single score results (Section 3.2.1) and the carbon footprint (Section 3.2.2).
Furthermore, we show the results for three additional impact categories: particulate matter
formation, land use and water use. In Section 3.3 we present sensitivity analyses in which
we explore a range of potentially influential parameters on the environmental performance
of CM.
3.1 Cultivated meat production system – baseline scenario
In this section we explore the results of the baseline scenario (see Annex B for key
parameters); commercial scale production of CM in 2030. In each figure, results of CM
production with a conventional energy mix (global average stated policies scenario for 2030
(IEA 2019) and sustainable energy mix are presented (see Section 2.3).
3.1.1 Environmental single score results
In Figure 6 the environmental impact, in environmental single score (ReCiPe), is presented,
both for the scenario in which conventional energy is used and the scenario in which
sustainable energy is used. In the conventional energy system, the main drivers for
environmental impact are electricity use during production, and medium production.
The energy production system offers a large reduction in environmental footprint compared
to the conventional energy production system. For the sustainable energy scenario,
electricity and medium production have roughly the same impact.

21 190107 - LCA of cultivated meat – February 2021
Figure 6 – Environmental impact (ReCiPe single score) per kg CM, contribution analysis processes
In Figure 7, the contribution of the different impact categories (e.g. climate change, land
use) is presented for both the conventional energy scenario and the sustainable energy
scenario. The main contributors to environmental single score impacts are climate change
and fine particulate matter formation, followed human toxicity and land use. Impacts of
fine particulate matter formation are highly dependent on geographical characteristics.
If these processes take place in areas of high population density, the impacts can be
significant.
The main drivers for the carbon footprint are discussed in Section 3.1.2. The main driver for
fine particulate matter formation is electricity generation in the conventional energy
scenario. In the sustainable energy scenario the drivers are raw material mining and
processing for energy infrastructure and the production of feedstock ingredients (such as
soybeans and maize) for medium ingredient production. Human toxicity impacts are
primarily driven by mining and raw material processing for electricity production and
infrastructure in both systems, followed by fertilizer and pesticide use in medium feedstock
production. Eventually, most of these impacts can be traced back to heavy industrial
processes (mining, raw material processing or other energy-intensive activities) far
upstream in the globalised supply chains.
354
130
0
50
100
150
200
250
300
350
400
Conventional energy Sustainable energy
mPt
/ k
g C
M
Environmental impact of cultivated meat (CM)Baseline scenario
HVAC
Wastewater treatment
CIP/SIP
Equipment
Scaffolds
Medium
Heat for production
Electricity for production
Total

22 190107 - LCA of cultivated meat – February 2021
Figure 7 – Environmental impact (ReCiPe single score) for CM, contribution analysis impact categories
3.1.2 Climate change
Figure 8 presents the carbon footprint of 1 kg of CM production. In the conventional energy
scenario, this carbon footprint is ~14 kg CO2-eq./kg CM. In the sustainable energy scenario,
this drops to ~2 kg CO2-eq./kg CM meat. The main driver for the carbon footprint in the
conventional energy scenario is electricity use during production, followed by the
production of medium ingredients. A significant reduction in carbon footprint can be
achieved by decarbonising the energy mix. In the (upstream) production of medium,
reductions that can be achieved by decarbonisation are smaller because a part of the
carbon footprint there is caused by the agricultural production of the feedstock and
chemicals used during production of the medium ingredients, which rely on heavy industrial
processes, that are harder to decarbonise. Scaffolds (assumed in this study to be in the
form of a hydrogel), equipment, wastewater treatment and HVAC of the facility make up a
relatively minor part of the carbon footprint (total of < 2%).
354
130
0
50
100
150
200
250
300
350
400
Conventional energy Sustainable energy
mPt
/ k
g C
M
Environmental impact of cultivated meat (CM)Baseline scenario
Global warming
Land use
Water consumption
Fine particulate matter formation
Human toxicity
Ecotoxicity
Acidification
Eutrophication
Resource scarcity
Stratospheric ozone depletion
Ozone formation
Ionizing radiation
Total

23 190107 - LCA of cultivated meat – February 2021
Figure 8 – Carbon footprint of CM
Zooming into the carbon footprint of energy use during production, the main driver is large-
scale proliferation, followed by differentiation and maturation, as shown in Figure 9.
Figure 9 – Electricity use per process stage, % of total
13.6
2.5
2
4
6
8
10
12
14
16
Conventional energy Sustainable energy
kg C
O2-e
q.
/ k
g C
M
Carbon footprint of cultivated meat (CM)Baseline scenario
HVAC
Wastewater treatment
CIP/SIP
Equipment
Scaffolds
Medium
Heat for production
Electricity for production
Total
0%
4%
83%
9%
0%
3%0% 1%
Contribution to carbon footprint of energy use per process stage
Cell bank maintenance
Small-scale proliferation
Large-scale proliferation
Differentiation and maturation
Harvesting
Cleaning of bioreactors
Wastewater treatment
HVAC

24 190107 - LCA of cultivated meat – February 2021
During large-scale proliferation, the main driver for electricity use is the heat exchanger
(94%) delivering a cooling load to the bioreactor to avoid overheating (Figure 10). In this
study, we have assumed that active cooling of the cooling fluid is necessary. This is a
different assumption from Mattick et al. (2015), where cooling was modelled using ambient
temperature cooling water. This assumption has a large influence on the results.
While metabolic heat production of animal cell cultures is lower than for e.g. bacteria,
especially at low cell densities, the cultures are sensitive to overheating. Therefore our
current model design incorporates a stand-by cooling load for cooling down rapidly,
mitigating heat inhomogeneity, or eliminating temperature hotspots. This especially seems
to become more important for large-scale cultures (Li et al. 2020). How much heating or
cooling large-scale cell cultures need is highly dependent on various factors, such as cell
densities, oxygen uptake rates (OUR), glucose consumption and type and volume of the
bioreactors.
Figure 10 – Electricity use for large-scale proliferation, % for different parts of the process
3.2 Comparison to conventional products
In this section we compare results for CM with results of our ambitious benchmark for
conventional products; intensive, West-European, circular agriculture with LUC-free soy,
see Section 2.4.2 for full elaboration. For more context, results for the environmental single
score are also shown adjusted for the global average carbon footprint (based on Poore and
Nemecek 2018). Results for the carbon footprint are also shown for the current global
average footprint (Supplementary Materials to Poore and Nemecek 2018).
2%
0%
91%
3%
4%
Contribution to carbon footprint of energy use during large-scale proliferation
Mixing
Pumping
Heat exchanger (cooling)
Heating of water
Aeration

25 190107 - LCA of cultivated meat – February 2021
3.2.1 Environmental single score results
Looking at the environmental single score results (Figure 11), in all cases CM compares
favourably to beef meat from both specialised beef cattle and dairy cows. Compared to
beef meat from dairy cows, the difference is smaller, due to a large part of the
environmental impact being allocated to milk production.
Differences between CM and chicken or pork are smaller, and highly dependent on the
energy mix selected for CM production, as the energy mix is an important driver for both
climate change and fine particulate matter formation. While pork and chicken have lower
carbon footprints than CM in the conventional energy scenario, land use and fine particulate
matter formation contribute to a greater extent to the impact of animal production
systems. In case of a sustainable energy scenario for CM, it scores lower than both chicken
and pork on the environmental single score.
In Figure 11 results for the environmental single score adjusted for the global average
carbon footprint of these products is also shown, in grey. Adjustments for other
environmental impact categories could not be done, due to differences in methodology.
As can be seen in the figure, conventional energy CM scores comparable to the adjusted
single score for chicken, and lower than pork and beef.
In all cases, CM has a higher environmental footprint than plant-based alternatives tofu and
wheat-based meatless (a textured plant-based product). This is due to the relatively high
environmental impacts of upstream industrial processes and energy-intensive production in
the CM supply chain.
Figure 11 – Environmental impact (ReCiPe single score) of CM and conventional protein products (ambitious
benchmark and ambitious benchmark adjusted for global average score on global warming)
* Intensive, West-European, circular agriculture with LUC-free soy.
** ‘Other’ includes 14 impact categories, among which other toxicity categories, acidification and resource
depletion. A complete list can be found in Annex A.
*** Current global average carbon footprint taken from Poore and Nemecek (2018). All other impact category
scores are identical to the ambitious benchmark.
200
400
600
800
1000
1200
1400
1600
1800
2000
Meatless Tofu CM
(sust.)
Chicken Pork CM
(conv.)
Beef
(dairy
cattle)
Beef
(beef
cattle)
mPt
/ k
g p
roduct
Environmental single scoreCultivated meat (CM) compared to ambitious benchmark for conventional
products*
Global warming
Land use
Water consumption
Fine particulate matter formation
Human toxicity
Other**
AB + current global average GWP***
4006

26 190107 - LCA of cultivated meat – February 2021
Table 5 shows the environmental impact for CM in a sustainable energy scenario set to 100%
(third column). In the second column, the contribution of the impact category to the total
environmental single score of CM from the sustainable energy system is shown, showing the
relative importance of different environmental impact categories. Fine particulate matter
formation (47%), global warming (33%), human toxicity (10%) and land use (6%) contribute
most to the environmental single score of CM in a sustainable energy scenario.
Table 5 – Impact of protein products (ReCiPe single score – ambitious benchmark) relative to CM - sustainable
energy, for different impact categories
Impact category % of single
score of CM
(sust.)
CM
(sust.)
CM
(conv.)
Beef
(beef
cattle)
Beef
(dairy
cattle)
Pork Chicken Tofu Meatless
Fine particulate
matter formation 47% 100% 140% 1,400% 671% 197% 142% 20% 10%
Global warming 33% 100% 539% 1,198% 694% 209% 121% 38% 17%
Human toxicity* 10% 100% 94% 1,191% 880% 187% 98% 11% 16%
Land use 6% 100% 109% 1,892% 526% 361% 274% 107% 12%
Other** 4% 100% 262% 1,830% 843% 259% 165% 26% 30%
* CM (conv.) has a lower human toxicity score than CM (sust.) due to relatively high toxic emissions during
mining and raw material processing in the supply chains of wind and solar PV energy.
** ‘Other’ includes 14 impact categories, among which other toxicity categories, acidification and resource
depletion. A complete list can be found in Annex A.
The production of CM in a sustainable energy scenario compares favourably to beef,
pork and chicken meat and CM in a conventional energy scenario on all relevant impact
categories. The plant-based alternatives compare favourably to CM on all impact
categories, except in the case of land use impacts of tofu, for which CM scores better
in the sustainable energy scenario.
3.2.2 Climate change
In comparison to other protein-rich products, the carbon footprint of CM production falls in
the spectrum between beef cattle meat and plant-based meat alternatives. Depending on
the grade of decarbonisation of energy production, it compares either favourably or
unfavourably to chicken and pork meat. This is shown in Figure 12. In Section 2.4.2,
Table 3, the adjustments made to the current ambitious benchmark, to achieve the 2030
ambitious benchmark, are elaborated on. Most importantly, a shift tot sustainable energy is
made throughout the supply chain and LUC-free soy is used in the feed mixes.

27 190107 - LCA of cultivated meat – February 2021
Figure 12 – Carbon footprint of CM and conventional protein products (ambitious benchmark + global average
based on Poore and Nemecek 2018)
* Intensive, West-European, circular agriculture with LUC-free soy. The ‘current’ bar represents additional
impacts of current production compared to the 2030 benchmark.
** Taken from Poore and Nemecek (2018).
As stated in Chapter 2 on methodology and inventory, the basis for the comparison chosen
here is ambitious. The carbon footprints of meat products vary wildly on a global level.
As Poore and Nemecek present (Poore and Nemecek 2018), the ninetieth percentile GHG
emissions of beef (90% of results fall within this range) are 105 kg CO2-eq. per 100 grams of
protein. As the researchers assume a protein content of 20%, that translates to a carbon
footprint of ~210 kg CO2-eq. per kg beef (beef cattle), which is almost seven times the
footprint of beef cattle in our ambitious benchmark. The mean carbon footprints presented
by Poore and Nemecek are (per kg of meat9): around 100 kg CO2-eq. for beef cattle, almost
40 kg CO2-eq. for lamb and mutton, around 30 kg CO2-eq. for dairy cattle, a little over 14 kg
CO2-eq. for pig meat and around 11 for poultry meat (Poore and Nemecek 2018). For all
meat categories, the low end of the carbon footprints presented by Poore and Nemecek is
________________________________ 9 Per 100 grams of protein: around 50 kg CO2-eq. for beef cattle, 19 kg CO2-eq. for lamb and mutton, 15 kg CO2-
eq. for dairy cattle, little over 7 kg CO2-eq. for pig meat and 5,5 for poultry meat (Poore and Nemecek 2018).
10
20
30
40
50
60
Meatless Tofu CM (sust.) Chicken Pork CM (conv.) Beef (dairycattle)
Beef (beefcattle)
kg C
O2-e
q. / k
g p
roduct
Carbon footprintCultivated meat (CM) compared to ambitious benchmark for
conventional products*
Cultivated meat - 2030
Conventional products - current (ambitious benchmark)*
Conventional products - 2030 (ambitious benchmark)*
Conventional products - current (global average)**
99

28 190107 - LCA of cultivated meat – February 2021
still higher than the carbon footprints we present in our ambitious benchmark, which
illustrates the level of ambition we set for the comparison. It also corroborates the
conclusion that CM, even with non-renewable energy, has a lower carbon footprint than
beef (cattle or dairy). And furthermore, that CM can compete on carbon footprint with the
global average footprints for chicken and pork presented by Poore and Nemecek, if > 30% of
energy use is sourced sustainably.
3.2.3 Other impact categories: land, water and fine particulate matter
In this section we highlight three additional impact categories: particulate matter
formation, land use and water use. Figure 13 shows the results for particulate matter
formation for the two CM scenario’s and conventional meat and vegetable protein products.
Three things stand out. First, the difference in emission contributing most to the score: for
meat products this is ammonia, for CM it is a mix of sulphur dioxide, particulates and
nitrogen oxide (which are mainly related to energy use in the background processes).
Second, CM results are lower for the sustainable energy scenario, and lower or equal for the
conventional energy scenario. Third, while CM scores relatively good compared to pork,
possibly good compared to chicken, and definitely good compared to beef, the vegetable
protein sources score much better still.
Figure 13 – Comparison of CM to conventional products (ambitious benchmark) of particulate matter formation
* Intensive, West-European, circular agriculture with LUC-free soy.
In Figure 14 and Figure 15 land use and water use (blue water) of cultivated meat and the
conventional products are presented. When we look at land use, CM scores much better
than all meat products, and comparable to tofu.
0.6 1.2
5.88.1 8.1
11.3
38.6
80.5
10
20
30
40
50
60
70
80
90
Meatless Tofu CM
(sust.)
CM
(conv.)
Chicken Pork Beef
(dairy
cattle)
Beef
(beef
cattle)
g P
M2.5
-eq.
/ k
g p
roduct
Particulate matter formation Cultivated meat (CM) compared to ambitious benchmark for
conventional products*
Ammonia
Sulfur dioxide
Nitrogen oxides
Particulates, < 2.5 um
Other
Total

29 190107 - LCA of cultivated meat – February 2021
Figure 14 – Land use of CM and conventional products (ambitious benchmark)
* Intensive, West-European, circular agriculture with LUC-free soy.
For the assessment on water use, it is important to note that this assessment only included
blue water, which contributes to scarcity (not green water (rain) which does not).
The methods to assess the impact of water use in LCA are in development, especially when
it comes to including scarcity, but are unfortunately far from perfect. Because scarcity
depends on location, we present water use here and note that the effects of water use
differ substantially from region to region, depending on scarcity. When we look at the
results for water use, shown in Figure 15, CM, chicken and pork have similar scores, which
are much lower than those for beef. What stands out though, it that for CM the result for a
sustainable energy scenario is higher than the result for a conventional energy scenario.
The additional water use for sustainable energy can be traced back to the production of
electronics-grade silicon in the model (solar cells). While this is a water-intensive process, a
study by Lohrmann et al. (2019) concluded that water use per MWh is drastically lower for
PV, compared to coal and nuclear energy. Therefore, these results are probably in part
based on out-dated inventories of the supply chain, and we therefore recommend using
these results as a guideline.
0.2
1.7
1.8
1.8
4.6
6.0
8.8
31.6
5 10 15 20 25 30 35
Meatless
CM (sust.)
Tofu
CM (conv.)
Chicken
Pork
Beef (dairy cattle)
Beef (beef cattle)
m2a crop-eq. / kg product
Land useCultivated meat (CM) compared to ambitious benchmark for
conventional products*

30 190107 - LCA of cultivated meat – February 2021
Figure 15 – Water use (blue water) of CM and conventional products (ambitious benchmark)
* Intensive, West-European, circular agriculture with LUC-free soy.
3.2.4 Feed conversion
For inputs (e.g. soy, maize), CM will be dependent on conventional agriculture. Looking at
the ‘feed conversion ratio’ (total input per output) helps understand how this dependence
for CM is compared to conventional protein products. In Table 6 the inputs (quantities) in
terms of feed and other resources are listed for CM and the conventional protein products.
CM is highly efficient in terms of resource utilisation, compared to all animal products and
especially compared to beef. As compared to the conventional products, CM does have
chemical inputs, mainly chemicals used for amino acid and recombinant protein production.
Some of these are fully consumed, but some of these are not consumed and could
theoretically be recycled in the downstream supply chain. Since this is currently hard to
quantify, we choose to adopt a conservative approach and assume all inputs are consumed,
and add the amounts of the chemicals to the conventional ‘feed’ inputs.
With similar agricultural practices for feed production as for input production for CM, a
lower feed conversion most likely translates into lower land use, lower water use, lower
pesticide use. For all products, more sustainable sourcing can help reduce the
environmental impact of inputs.
For beef, the total as presented in Table 6 excludes grass (fresh and silage), which are
mentioned separately in the table. This value for grass can be even higher, for animals with
longer lifetimes. From a carbon footprint and biodiversity perspective it is undesirable to
have land use change from grass land to crop land. Because the feed conversion ratio for CM
is much lower than for beef, a switch from beef to CM is an unlikely driver of land use
change, especially because in intensive production systems (basis here) the number of cows
per hectare is maximized. With a lower number of cows per hectare (as is common in
extensive systems) grasslands can be maintained, while at the same time meat production
could remain the same by switching to CM.
2
27
40
42
46
56
115
258
50 100 150 200 250 300
Meatless
Tofu
Pork
CM (conv.)
Chicken
CM (sust.)
Beef (dairy cattle)
Beef (beef cattle)
litre / kg product
Water footprintCultivated meat (CM) compared to ambitious benchmark
for conventional products*

31 190107 - LCA of cultivated meat – February 2021
Table 6 - Indication of inputs quantities (feed and resources) for 1 kg of product
Meat type Feed
(excl.
grass)
By-products Grass
(fresh
and
silage)
Organic
chemi-
cals
In-organic
chemi-cals
Total –
kg in per
kg out
(excl.
grass)
Remarks
Cultivated
meat*
0.3 0.4
0.1 0.1 0.8 Assuming 75% amino acids from soy
hydrolysate and 25% amino acids from
conventional (microbial and chemical)
production.
Feed is biomass converted to glucose.
By-products are soybean meal and
maize solubles.
Organic chemicals mainly methanol.
Inorganic chemicals acids, ammonium
carbonate and ammonia
Beef (beef
cattle)
4.6 1.1 129.3
5.7 Feed is mostly barley, maize and
soybeans. By-products mostly
rapeseed meal.
Beef (dairy
cattle)
9.8 2.9 24.2
12.7 Economic allocation applied for milk
products.
Feed is mostly maize silage and maize
grains.
By-products mostly rapeseed meal.
soybean meal, palm kernel expeller
and sugar beet pulp.
Pork 3.1 1.5
4.6 Feed is mostly wheat and barley
grains.
By-products rapeseed meal and
soybean meal.
Chicken 1.5 1.3
2.8 Feed is mostly maize and wheat
grains.
By-products soybean meal and
rapeseed meal.
Tofu* 0.4
0.4 Soybeans
Meatless*
(wheat-
based)
0.2
0.2 Wheat
* The feed conversion ratio is <1 because of the difference in water content between input and output.
3.3 Sensitivity analyses
Several sensitivity analyses have been carried out, on:
— A: Production run time;
• A1: Shorter production run time (-25%: 32 days, 3 harvests).
• A2: Longer production run time (+25%: 52 days, 3 harvests).
— B: Maximum cell density during proliferation stages;
• B1: Higher cell density (x4: 2E8 cells/ml).
• B2: Lower cell density (x10: 5E6 cells/ml).
— C: Cell volume;
• C1: Smaller cell volume (500 µm3).

32 190107 - LCA of cultivated meat – February 2021
• C2: Larger cell volume (5,000 µm3).
— D: Medium composition and quantity used per kg of cultivated meat;
• D1: Low medium (more efficient medium usage).
• D2: High medium (less efficient medium usage).
The basis for variation of the parameters are described in Section 2.4.3 and associated
implications for model inputs are described in Annex C. Elaboration on medium
compositions assumed for the scenarios and the contribution of ingredients to total
environmental impact of medium is also described in Annex C.
The results of these sensitivity analyses are summarized in Table 7. Also shown in the table
is the deviation from the baseline scenario (in percentages). As can been seen, for certain
process parameters a variation does not influence the results significantly; production run
time, a higher cell density and a larger cell volume. Others, however, do influence the
results substantially, most notably high medium, lower cell density and smaller cell volume.
For companies focussing on reducing the environmental footprints, these aspects of the
production process are particularly important to take into consideration.
What is important to note, is how the results from these sensitivity analyses influence the
comparison made to conventional protein products. When we look at the environmental
single score, the highest value we report (599 mPt per kg CM, for the conventional energy
system) is still substantially lower than the environmental single score results for beef (both
dairy (909 mPt/kg) and cattle (1,775 mPt/ kg)). Compared to pork (278 mPt/kg) and
chicken (184 mPt/kg), the results for the sustainable energy scenario (188-235 mPt/ kg)
show a result in the same range.
When we look at the carbon footprint, scenario B2, C1 and D2 can increase the footprint to
a higher footprint than beef from dairy cattle in a conventional energy scenario. If we look
at a sustainable energy scenario, again, compared to pork (5.3 kg CO2-eq./kg) and chicken
(3.1 kg CO2-eq./kg), the results are in that range (3.5-4.5 kg CO2-eq./kg).
Table 7 – Results sensitivity analyses in environmental single score and carbon footprint per kg of product
Scenario Environmental single score (mPt) CFP (CO2-eq.)
Conventional
energy
Sustainable
energy
Conventional
energy
Sustainable
energy
Baseline scenario (mid medium)a 354 ref. 130 ref. 13.6 ref. 2.5 ref.
A1: Shorter production run time
(-25%: 32 days, 3 harvests)
343 -3% 128 -2% 13.1 -4% 2.4 -5%
A2: Longer production run time
(+25%: 52 days, 3 harvests)
369 +4% 138 +6% 14.1 +4% 2.6 +5%
B1: Higher cell density
(x4: 2E8 cells/ml)
348 -2% 131 0% 13.2 -3% 2.5 -1%
B2: Lower cell density
(x10: 5E6 cells/ml)
498 +29% 188 +31% 20.7 +34% 3.8 +33%
C1: Smaller cell volume
(500 µm3)
498 +29% 188 +31% 18.9 +28% 3.5 +28%
C2: Larger cell volume
(5,000 µm3)
350 -1% 131 0% 13.4 -1% 2.5 -1%
D1: Low medium
(more efficient medium usage)
313 -13% 111 -17% 12.1 -12% 2.1 -21%
D2: High medium
(less efficient medium usage)
599 +41% 235 +44% 22.6 +40% 4.5 +44%
a Reference scenario for comparison to sensitivity analyses results.

33 190107 - LCA of cultivated meat – February 2021
4 Conclusions and discussion
This prospective Life Cycle Assessment study of cultivated meat is the first LCA study which
uses primary data from multiple CM companies and from associated companies in the CM
supply chain. In this LCA we look at meat production from cradle to facility gate.
We present the environmental impact for a non-specific type of CM. The baseline scenario
considers a CM product cultivated at around 37°C. As CM is still in development, we
modelled a future commercial scale production facility which reflects expected changes,
both internally (the scaling up of CM production) and externally (e.g. share of sustainable
sources in electricity mix).
The results do not represent the impact of a specific product developed by a specific CM
company, and may not be interpreted as such. CM companies can use the results to gain
insight into factors that may contribute (significantly) to their impact, or extract
recommendations for focus areas for future exploration within their product development
and for product improvement.
4.1 Conclusions and discussion
The results show that:
— CM can compete with all conventional meat environmentally, and scores much better
than beef. This conclusion is based on comparison with our ambitious benchmark for
conventional products, and therefore quite robust. When producers switch to
sustainable energy, CM becomes the most environmentally friendly option for meat
production.
— The most important drivers of the environmental impact of CM are processing energy,
medium quantity and medium composition. For all these drivers an important option for
improvement is a switch sustainable energy.
— Potential variability regarding quantity of medium used, residence time of cells in the
reactors, maximum cell density and process temperature are unlikely to influence these
conclusions.
These conclusions are elaborated on hereafter.
CM can compete with all conventional meats environmentally (and scores
much better than beef); with sustainable energy CM becomes the most
environmentally attractive meat product
We compare the environmental impact of CM to conventional products, using both the
ReCiPe (environmental) single score and carbon footprint. We chose an ambitious
benchmark: conventional meat with a relatively low environmental impact (compared to
the global average).
Our assessment shows that even with conventional energy (global average stated policy
scenario in 2030), CM has a lower environmental single score and a lower carbon footprint
than beef (cattle and dairy). In order to attain lower scores than pork and chicken, a
(partial) switch to sustainable energy is necessary (95 and 76% respectively to have a carbon
footprint and environmental single score equal to chicken). If the carbon footprint
component in the environmental single score is adjusted to reflect the global average

34 190107 - LCA of cultivated meat – February 2021
carbon footprint of meat products, conventional energy CM scores comparable to the
adjusted single score for chicken, and lower than pork and beef. CM can compete on carbon
footprint with the global average footprints for chicken and pork, if > 30% of energy use is
sourced sustainably. As this is relatively easy to achieve technologically, we strongly
recommend CM companies to source energy sustainably, to achieve a relatively quick win in
reducing the footprint.
Compared to all meat products, both cultivated and conventional, the environmental single
score and the carbon footprint of vegetable protein products is low. With a carbon footprint
which is 2.5 to 4 times lower, and an environmental single score of over three and seven
times lower, cultivated meat is unlikely to be able to compete with vegetable protein
products on these two indicators.
We also assessed the impact on three important impact categories: particulate matter
formation, land use and water use. When we look at particulate matter formation, CM
results are lower than meat products for the sustainable energy scenario, and lower or
equal for the conventional energy scenario. Especially the difference between beef and CM
is particularly high (well over four to almost fourteen times higher for conventional beef).
For land use, CM is comparable to tofu, with a footprint of around 1.8 m2, substantially
lower than chicken (4.6), pork (6.0) and beef (8.8-31.6). For water use, CM is comparable
to chicken and pork, with a footprint of around 42 m3, substantially lower than beef (115-
258 m3).
Important drivers of the environmental impact of CM
Switching from a global average stated policy scenario for electricity in 2030 to sustainable
energy lowers the environment impact of CM by 60% for the single score and 80% for the
carbon footprint. In this assessment this energy switch is applied to the energy use in the
CM production process and in medium production. This also means that a (global) switch to
sustainable energy will lower the impact further, as the environmental impact of energy use
in all other background processes (e.g. production of bioreactors) will be reduced.
This effect is larger for CM than for conventional animal products, as the carbon footprint
of CM is defined by energy use, while in the animal production systems also emissions of CH4
and N2O from enteric fermentation and manure handling contribute significantly.
As CM companies are still developing, the estimates for the amount of medium required
and the composition of medium ingredients vary. It is important to consider the medium
composition, since some ingredients contribute far more to the overall environmental
impact than others. Especially albumin has a relatively large environmental footprint
compared to other ingredients, and should therefore be minimised when possible. In our
LCA, potential recycling (internally or externally) of medium is not taken into account.
If this would be possible it would help reduce the environmental footprint in multiple ways;
a reduction of (natural) resource use, lower energy use for medium production and finally
lower amounts of waste water.
This study shows that the cooling load required is highly influential on the environmental
performance of production. However, heating and cooling dynamics in large-scale cell
cultures remain difficult to predict, as it depends on a wide range of factors such as type of
production and bioreactors used, internal reactor heat dynamics, maximum cell densities,
and metabolic heat production for the specific cells used. At low densities, the culture will
almost certainly require some heating as the cell metabolism does not produce enough heat
for maintaining the temperature. For certain process designs there could be an optimum

35 190107 - LCA of cultivated meat – February 2021
where little cooling and heating is needed. Further research, and especially trial
experiments on pilot scale, will hopefully shed more light on this topic in the coming years.
Sensitivity analyses do not influence the conclusions
For certain process parameters a variation does not influence the results significantly;
production run time, a higher cell density and a larger cell volume. Others influence the
results substantially, most notably high medium use, lower cell density and smaller cell
volume. When comparing the results of the sensitivity analyses to those for conventional
products, the highest value we report for CM (599 mPt per kg CM, for the conventional
energy system) is still substantially lower than the environmental single score results for
beef (both dairy (909 mPt/kg) and cattle (1,775 mPt/kg)). Compared to pork (278 mPt/kg)
and chicken (184 mPt/kg), the results for the sustainable energy scenario (188-235 mPt/kg
CM) show a result in the same range.
When we look at the carbon footprint, three scenarios can increase the footprint to a higher
footprint than beef from dairy cattle in a conventional energy scenario. If we look at a
sustainable energy scenario, again, compared to pork (5.3 kg CO2-eq./kg) and chicken
(3.1 kg CO2-eq./kg), the results are in that range (3.5-4.5 kg CO2-eq./kg).
These results confirm that CM can compete with conventional products environmentally.
A switch to sustainable energy in the production process (of both CM and the medium)
makes CM the most environmentally attractive meat option.
Overlap LCA and TEA
At the same time this LCA was carried out, a techno-economic assessment (TEA) was also
made (CE Delft, 2020). Do conclusions overlap? Can measures to reduce environmental
impact also lower costs, and vice versa? Four aspects stand out:
1. Energy efficiency: being more energy efficient reduces environmental impact and
costs. There still are uncertainties regarding energy use for heating and cooling, and
further research into e.g. energy efficient cooling and sustainable heat sources could
help reduce both environmental impact and costs.
2. Energy sources: a switch to sustainable energy, especially electricity, substantially
lowers the environmental impact. The most transparent and robust way to ensure
additional sustainable electricity production, which actually lowers the national average
environmental impact of electricity generation, is taking care of one’s own sustainable
electricity generation. If sustainable electricity is generated by the CM company on site,
this could also mean a reduction in cost compared to either fossil or sustainable
electricity purchased on the market.
3. Medium use: both increased medium efficiency and increasingly efficient production of
ingredients can lower both costs and environmental impacts. Especially regarding
certain functional ingredients: the results of the LCA and of the TEA both highlight
certain specialty functional ingredients such as recombinant proteins in this regard.
A reduction or a switch could mean reducing both impact and costs.
4. Supply chain collaboration: To reduce environmental impact and costs further,
collaboration in the supply can help lower impact and costs of production of all required
substances for CM production. Most notably this is important with regard to medium
ingredients, but this reasoning can of course be extended to other inputs (e.g. scaffolds,
filtration membranes) as well.
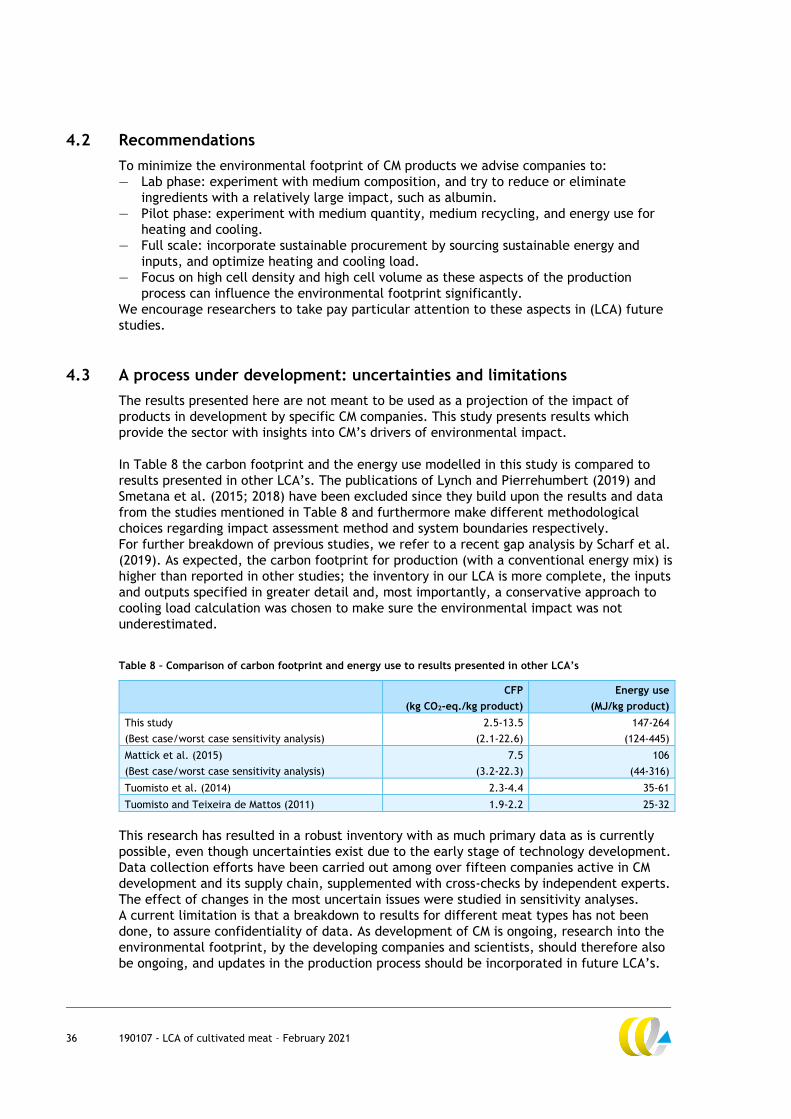
36 190107 - LCA of cultivated meat – February 2021
4.2 Recommendations
To minimize the environmental footprint of CM products we advise companies to:
— Lab phase: experiment with medium composition, and try to reduce or eliminate
ingredients with a relatively large impact, such as albumin.
— Pilot phase: experiment with medium quantity, medium recycling, and energy use for
heating and cooling.
— Full scale: incorporate sustainable procurement by sourcing sustainable energy and
inputs, and optimize heating and cooling load.
— Focus on high cell density and high cell volume as these aspects of the production
process can influence the environmental footprint significantly.
We encourage researchers to take pay particular attention to these aspects in (LCA) future
studies.
4.3 A process under development: uncertainties and limitations
The results presented here are not meant to be used as a projection of the impact of
products in development by specific CM companies. This study presents results which
provide the sector with insights into CM’s drivers of environmental impact.
In Table 8 the carbon footprint and the energy use modelled in this study is compared to
results presented in other LCA’s. The publications of Lynch and Pierrehumbert (2019) and
Smetana et al. (2015; 2018) have been excluded since they build upon the results and data
from the studies mentioned in Table 8 and furthermore make different methodological
choices regarding impact assessment method and system boundaries respectively.
For further breakdown of previous studies, we refer to a recent gap analysis by Scharf et al.
(2019). As expected, the carbon footprint for production (with a conventional energy mix) is
higher than reported in other studies; the inventory in our LCA is more complete, the inputs
and outputs specified in greater detail and, most importantly, a conservative approach to
cooling load calculation was chosen to make sure the environmental impact was not
underestimated.
Table 8 – Comparison of carbon footprint and energy use to results presented in other LCA’s
CFP
(kg CO2-eq./kg product)
Energy use
(MJ/kg product)
This study
(Best case/worst case sensitivity analysis)
2.5-13.5
(2.1-22.6)
147-264
(124-445)
Mattick et al. (2015)
(Best case/worst case sensitivity analysis)
7.5
(3.2-22.3)
106
(44-316)
Tuomisto et al. (2014) 2.3-4.4 35-61
Tuomisto and Teixeira de Mattos (2011) 1.9-2.2 25-32
This research has resulted in a robust inventory with as much primary data as is currently
possible, even though uncertainties exist due to the early stage of technology development.
Data collection efforts have been carried out among over fifteen companies active in CM
development and its supply chain, supplemented with cross-checks by independent experts.
The effect of changes in the most uncertain issues were studied in sensitivity analyses.
A current limitation is that a breakdown to results for different meat types has not been
done, to assure confidentiality of data. As development of CM is ongoing, research into the
environmental footprint, by the developing companies and scientists, should therefore also
be ongoing, and updates in the production process should be incorporated in future LCA’s.

37 190107 - LCA of cultivated meat – February 2021
References
Allan, S. J., P. A. De Bank, and M. J. Ellis. 2019. Bioprocess Design Considerations for
Cultured Meat Production with a Focus on the Expansion Bioreactor. Frontiers in
Sustainable Food Systems 3: 44.
CE Delft. 2021. Techno-Economic Assessment (TEA) of cultivated meat. Delft, NL: CE Delft.
Colantoni, A., L. Recchia, G. Bernabei, M. Cardarelli, Y. Rouphael, and G. Colla. 2017.
Analyzing the environmental impact of chemically-produced protein hydrolysate from
leather waste vs. enzymatically-produced protein hydrolysate from legume grains.
Agriculture 7(8): 62.
De Marco, I., S. Riemma, and R. Iannone. 2017. LCA of Aerogel Production using
Supercritical Gel Drying: from Bench Scale to Industrial Scale. Chemical Engineering
Transactions 57: 241-246.
Durlinger, B., E. Koukouna, R. Broekema, M. van Paassen, and J. Scholten. 2017. Agri-
footprint 4.0, edited by B. Consultants. Gouda, NL.
Egbert, R. and C. Borders. 2006. Achieving Success With Meat Analogs. Chicago, IL, USA:
Institute of Food Technologists (IFT).
Hoving, I., G. Holshof, G. Migchels, M. van der Gaag, and M. Plomp. 2014. Reductie
ammoniakemissie bij maximalisatie weidegang op biologische melkveebedrijven. 1570-
8616. Wageningen UR Livestock Research.
IEA. 2019. World Energy Outlook 2019. https://www.iea.org/reports/world-energy-outlook-
2019. Accessed 10 august 2020.
Krueger, K., N. Rubio, I. Datar, and D. Stachura. 2019. Cell-based fish: a novel approach to
seafood production and an opportunity for cellular agriculture. Frontiers in Sustainable
Food Systems 3: 43.
Li, X., G. Zhang, X. Zhao, J. Zhou, G. Du, and J. Chen. 2020. A conceptual air-lift reactor
design for large scale animal cell cultivation in the context of in vitro meat production.
Chemical Engineering Science 211: 115269.
Lohrmann, A., J. Farfan, U. Caldera, C. Lohrmann, and C. Breyer. 2019. Global scenarios for
significant water use reduction in thermal power plants based on cooling water demand
estimation using satellite imagery. Nature Energy 4(12): 1040-1048.
Lynch, J. and R. Pierrehumbert. 2019. Climate Impacts of Cultured Meat and Beef Cattle.
Frontiers in Sustainable Food Systems 3(5).
Marinussen, M. and A. Kool. 2010. Environmental impacts of synthetic amino acid
production. Netherlands: Blonk Milieu Advies BV.
Mattick, C. S. 2014. An Emerging Technology Assessment of Factory-grown Foodthesis,
Arizona State University.
Mattick, C. S., A. E. Landis, B. R. Allenby, and N. J. Genovese. 2015. Anticipatory Life Cycle
Analysis of In Vitro Biomass Cultivation for Cultured Meat Production in the United States.
Environmental Science & Technology 49(19): 11941-11949.
Poore, J. and T. Nemecek. 2018. Reducing food's environmental impacts through producers
and consumers. Science 360: 987-992.

38 190107 - LCA of cultivated meat – February 2021
ReCiPe 2016 : A harmonized life cycle impact assessment method at midpoint and endpoint
level. 2016. Bilthoven: RIVM.
Scharf, A., E. Breitmayer, and M. Carus. 2019. Review and gap-analysis of LCA-studies of
cultured meat. The Good Food Institute.
Smetana, S., A. Mathys, A. Knoch, and V. Heinz. 2015. Meat alternatives: life cycle
assessment of most known meat substitutes. The International Journal of Life Cycle
Assessment 20(9): 1254-1267.
Smetana, S., K. Aganovic, S. Irmscher, and V. Heinz. 2018. Agri-Food Waste Streams
Utilization for Development of More Sustainable Food Substitutes. In Designing Sustainable
Technologies, Products and Policies: From Science to Innovation, edited by E. Benetto, et
al. Cham: Springer International Publishing.
Specht, L. 2020. An analysis of culture medium costs and production volumes for cultivated
meat. The Good Food Institute.
Stephens, N., L. Di Silvio, I. Dunsford, M. Ellis, A. Glencross, and A. Sexton. 2018. Bringing
cultured meat to market: Technical, socio-political, and regulatory challenges in cellular
agriculture. Trends in Food Science & Technology 78: 155-166.
Tuomisto, H. L. and M. J. Teixeira de Mattos. 2011. Environmental Impacts of Cultured Meat
Production. Environmental Science & Technology 45(14): 6117-6123.
Tuomisto, H. L., M. J. Ellis, and P. Haastrup. 2014. Environmental impacts of cultured
meat: alternative production scenarios. Paper presented at Proceedings of the 9th
international conference on life cycle assessment in the agri-food sector.
Wernet, G., C. Bauer, B. Steubing, J. Reinhard, E. Moreno-Ruiz, and B. Weidema. 2016. The
ecoinvent database version 3 (part I): overview and methodology. The International Journal
of Life Cycle Assessment 21(9): 1218-1230.

39 190107 - LCA of cultivated meat – February 2021
A ReCiPe
This annex gives an introduction to the ReCiPe methodology which is used as the method for
the LCA conducted in this study.
The ReCiPe methodology is developed for the Dutch government and is used for many
LCA-studies in the Netherlands. The ReCiPe methodology translates a long list of primary
results in easier to interpret indicators. With this method the environmental effects can be
shown on two different levels:
Midpoints: problem-oriented environmental effects, such as climate change and
acidification. In the ReCiPe methodology there are seventeen midpoints. The midpoint-level
is a direct translation from substance/emission to environmental effect. The midpoint-level
gives an insight into the different environmental effects and is characterized by a high level
of transparency. The damage caused is not shown in this category, for this end the three
endpoints (Level 2) are more useful.
Endpoints: impact-oriented environmental effects, the effects on nature, effect on humans
and effect on resources. In the ReCiPe methodology the seventeen midpoints are
categorized into three endpoints. At the endpoint-level the environmental effects are
normalized and recalculated towards damage into three endpoint categories:
— damage to human health;
— damage to ecosystems;
— damage to resource availability.
Table 9 - Environmental effect categories, units and weighting according to ReCiPe 2016
Midpoints Unit Endpoints Single Score
Global warming kg CO2-eq.
Human Health
(DALY)
mPt
Stratospheric ozone depletion kg CFC11-eq.
Ionizing radiation kBq Co-60-eq.
Ozone formation. Human health kg NOx-eq.
Fine particulate matter formation kg PM2.5-eq.
Human carcinogenic toxicity kg 1,4-DCB e
Human non-carcinogenic toxicity kg 1,4-DCB e
Water consumption m3
Global warming kg CO2-eq.
Ecosystems
(species. year)
Ozone formation. Terrestrial ecosystems kg NOx-eq.
Terrestrial acidification kg SO2-eq.
Freshwater eutrophication kg P eq.
Terrestrial ecotoxicity kg 1,4-DCB e
Freshwater ecotoxicity kg 1,4-DCB e
Marine ecotoxicity kg 1,4-DCB e
Land use m2a crop eq.
Water consumption m3
Mineral resource scarcity kg Cu eq. Resources ($)
Fossil resource scarcity kg oil eq.
Source: (ReCiPe 2016 : A harmonized life cycle impact assessment method at midpoint and endpoint level 2016).

40 190107 - LCA of cultivated meat – February 2021
B Inventory and data quality
The data quality assessment classification is explained in Table 10. Table 11 shows the main
model design parameters with information on sources and data quality. Table 12 shows the
main model inputs with information on sources and data quality. Quantitative data on
model inputs is confidential and therefore not included. Table 13 shows the conventional
electricity mix modelled for this study. Table 14 shows the energy consumption modelled in
the baseline model.
Table 10 – Data quality assessment classification
Data quality assessment classification
0 No data available at this moment
1 Primary data from representative process and scale
2 Primary data from representative process with extrapolation for scale
3 Primary data from similar process and scale
4 Secondary data from literature
5 Estimate or calculation based on expert judgement
Table 11 – Main model design parameters values, sources and data quality
Main model parameters Value Source Data
quality
# of data
points
used
Independent
cross-check
Annual production of
commercial facility in 2030
10 kton CM and supply chain
companies
5 12 No
Species and cell type Various species, assuming
non-GMO cell lines
CM companies 1 7 Yes
Type of production Semi-continuous production
with 3 intermediate harvests
Literature, confirmed by
bioprocessing companies
4 1 Yes
Size of largest proliferation
vessel
10,000 L CM and supply chain
companies estimate
(median)
5 7 Yes
Size and amount of
bioreactors at facility
107 x 50 L STR,
130 x 10,000 L STR;
430 x 2,000 L PR
Calculated, based on
production line presented
in Specht (2020) and
project-specific
parameters
4/5 - Yes
Doubling time 30 hours Conservative round-up
from Specht (2020): 28
days. Range validated by
companies.
4/2 1 Yes
Duration of production from
inoculum to harvest
42 days (30 days for ~25
doublings + 2 days for
additional harvests +
10 days of differentiation
and maturation)
Specht (2020), cross-check
by bioprocessing
companies
4 1 Yes
Maximum cell density 50*106 cells/ml CM and supply chain
companies (median)
2 7 Yes
Avg. cell volume 3,500 μm3/cell CM companies (median) 1 4 Yes
Density of meat 881 kg/m3 Specht (2020) 4 N.a. No

41 190107 - LCA of cultivated meat – February 2021
Table 12 – Main model inputs, sources and data quality
Main model inputs and
their production
Source Data quality # of data points
used
Independent
cross-check
Energy use for production
(heating, cooling, mixing,
aeration, pumping)
Calculations by bioprocess
engineers with
extrapolations by CE Delft
5 1 Yes
Energy use for cleaning
(CIP/SIP)
Calculations by bioprocess
engineers with
extrapolations by CE Delft
3 1 No
Energy use for HVAC Calculations by engineers 4 1 No
Energy production Ecoinvent LCA database,
modelled after global
stated policies scenario in
World Energy Outlook 2030
(IEA 2019)
1 N.a. N.a.
Purified water use for CM
production (quantity))
CM and bioprocess
engineering companies
2 (for medium-
related water
use) and
3 (for cleaning
related water
use)
2 Yes
Purified water production Water companies 1 1 No
Medium use CM and supply chain
companies
2 6 Yes
Medium recycling rate CM and supply chain
companies
0
(no consensus)
6 Yes
Medium composition CM and supply chain
companies
2 7 Yes
Medium ingredient
production
See below
Hydrolysate (Colantoni et al. 2017)
EDIT: Soy LUC set to 0 (as
is done for conventional
products)
4 1 No
Amino acids Data from (Marinussen and
Kool 2010), Mattick (2014),
Mattick et al. (2015).
Amino acids modelled:
- L-Glutamine
- L-Threonine
- L-Lysine
- D,L-Methionine
4 1 No
Recombinant proteins Amino acid production
data from (Marinussen and
Kool 2010), Mattick (2014),
Mattick et al. (2015) used
as basis. Water and
electricity use adapted for
recombinant protein
fermentation with data
from 2 producing
companies.
2 3 Yes

42 190107 - LCA of cultivated meat – February 2021
Main model inputs and
their production
Source Data quality # of data points
used
Independent
cross-check
Other medium ingredients Ecoinvent and Agri-
footprint LCA databases
1 N.a. N.a.
Transport of medium
ingredients
Based on standard
Ecoinvent values for global
markets
1 N.a. N.a.
Scaffold use CM and supply chain
companies
5 8 companies
(total) of which
3 with future
estimate of
quantity of
scaffold used
No
Scaffold production See below
Hydrogel De Marco et al. (2017) 4 1 No
Electrospinning Supply chain companies 2 2 Yes
Bioreactor use Size from CM and
supplying companies,
amount calculated
See above See above Yes
Bioreactor production Tuomisto et al. (2014) and
industry experts within
CE Delft
4 2 Yes
Storage and mixing tanks
use
Calculated 5 1 No
Storage and mixing tanks
production
Industry experts within
CE Delft
4 1 No
Filters for filtration use Supplying companies 2 1 Yes
Filters for filtration
production
Supplying companies 1 1 No
Table 13 - Energy mix for 2030, stated policy scenario, global average (IEA 2019)
Source Share
Coal 29%
Gas 24%
Oil 3%
Nuclear 9%
Hydro 15%
Wind 9%
Solar 9%
Other renewable 3%
Table 14 - Modelled energy demand for 1 year of operation (baseline scenario)
Process Quantity
(kWh)
Electricity for aeration, agitation, pumping and heat exchanger during small-scale proliferation,
large-scale proliferation and differentiation and maturation; centrifugation and pumping washing
water during harvesting and as part of food safety measures; pumping during cleaning; HVAC;
pumping (medium mixing and sterilization
2,17E+08
Heat for initial heating of medium during small-scale proliferation, large-scale proliferation and
differentiation and maturation and cleaning; HVAC
1,08E+07

43 190107 - LCA of cultivated meat – February 2021
C Sensitivity analyses
Model inputs
Table 15 – Parameters and the relative change in parameters for the different sensitivity analyses
Parameters changed Baseline
scenario
(mid medium)
A1: Shorter
production
run time
(-25%:
32 days,
3 harvests)
A2: Longer
production
run time
(+25%:52
days,
3 harvests)
B1: Higher
cell density
(x4: 2E8
cells/ml)
B2: Lower
cell density
(x10: 5E6
cells/ml)a
C1: Smaller
cell volume
(500 µm3)a
C2: Larger
cell volume
(5,000 µm3)
D1: Low
mediume
D2: High
mediume
Amount of production runsa 100% 100% 100% 25% 1,000% 700% 70% 100% 100%
Amount of bioreactors (50 L STR) 100% 79% 121% 25% 1,000% 700% 70% 100% 100%
Amount of bioreactors
(10,000 L STR)
100% 85% 115% 25% 992% 692% 69% 100% 100%
Amount of bioreactors (2,000 L PR) 100% 79% 121% 100% 100% 100% 100% 100% 100%
Amount of storage and mixing tanks
(60,000 L)
100% 100% 100% 100% 760% 760% 100% 100% 118%
Electricity for small-scale
proliferation (total)b
100% 99% 101% 99% 126% 118% 99% 100% 100%
Heat for small-scale proliferation
(total)c
100% 100% 100% 100% 1,010% 1119% 100% 51% 356%
Electricity for large-scale
proliferation (total)b
100% 99% 101% 99% 123% 116% 99% 100% 100%
Heat for large-scale proliferation
(total)c
100% 100% 100% 100% 1,007% 979% 100% 67% 271%
Electricity for differentiation and
maturation (total)b
100% 75% 125% 100% 100% 100% 100% 100% 100%

44 190107 - LCA of cultivated meat – February 2021
Parameters changed Baseline
scenario
(mid medium)
A1: Shorter
production
run time
(-25%:
32 days,
3 harvests)
A2: Longer
production
run time
(+25%:52
days,
3 harvests)
B1: Higher
cell density
(x4: 2E8
cells/ml)
B2: Lower
cell density
(x10: 5E6
cells/ml)a
C1: Smaller
cell volume
(500 µm3)a
C2: Larger
cell volume
(5,000 µm3)
D1: Low
mediume
D2: High
mediume
Heat for differentiation and
maturation (total)c
100% 75% 125% 100% 101% 100% 100% 39% 418%
Electricity for cleaning (pumping) 100% 100% 100% 25% 1000% 700% 70% 100% 100%
Heat for cleaning (heating water) 100% 100% 100% 25% 923% 649% 73% 100% 100%
Electricity for medium mixing and
sterilisation (kWh)
100% 100% 100% 100% 760% 760% 100% 59% 311%
Electricity for HVAC (total)d 100% 100% 150% 100% 850% 650% 100% 100% 150%
Heat for HVAC (total)d 100% 100% 150% 100% 850% 650% 100% 100% 150%
Water for cleaning 100% 100% 100% 26% 631% 454% 82% 100% 100%
Medium (small-scale proliferation)e 100% 100% 100% 100% 100% 100% 100% see Table 16 see Table 16
Medium (large scale proliferation)e 100% 100% 100% 100% 100% 100% 100%
Medium (differentiation and
maturation)e
100% 75% 125% 100% 100% 100% 100%
a One production run consists of a train of proliferation reactors of increasing volume and 4 perfusion reactors (see Section 2.4.1). Depending on the potential staggering of
production runs this is more or less proportional to the total amount of reactors needed for the facility. b Electricity for the various production stages includes all aspects that are powered by electricity: Pumping, mixing, aeration and cooling in a heat exchanger. c Heat for the various production stages is the heat needed for initial heating of the medium. d HVAC includes all heating, cooling and ventilation needed to maintain ISO8 (cleanroom) environment in the production area. e All scenarios except low and high medium assume the baseline medium quantities. For the low and high medium scenarios, see Table 16.

45 190107 - LCA of cultivated meat – February 2021
Production run time
The production run time depends on the doubling time (for proliferation stages) and on the
desired maturity of cells in the final product (for differentiation and maturation). Based on
primary data we have decided to vary the total production run time with -25% and +25%.
This does not necessarily cover all data received, but we feel that this does provide a solid
basis for companies to interpret the results in comparison to their own specific process
design.
For a shorter proliferation time, the cell doubling time is reduced from 30 to 22,5 days, and
for a longer proliferation time increased from 30 to 37,5 days.
Shorter residence time in the reactors reduces overall energy demand, lowers medium
demand during differentiation and maturation (we assume a linear relation) and results in a
smaller amount of reactors needed to produce the same amount of CM. Longer residence
time effects these aspects reversely. We assume medium use in proliferation stages is not
affected, as the same amount of cells has to be produced, thus demanding the same
amount of ingredients.
Maximum cell density
Maximum cell density during proliferation stages is a parameter for which many companies
are optimising. This is highly dependent on the adopted product system and bioreactor
types. In this study, we have adopted a median maximum cell density as expected to be
achieved by CM companies in commercial-scale production. In the stirred-tank reactor (STR)
system that we model, it may be feasible to increase cell densities by a factor 4 (to 20*107
cells/ml, the higher density scenario), but not much more, according to experts in the
field. It is plausible that certain large-scale production systems will not manage to operate
at the cell densities that we model in the baseline scenario, and therefore factor 10 lower
densities (10*106 cells/ml, the lower density scenario) is also modelled. In other reactor
systems, cell densities up to 109 cells/ml are currently already feasible, albeit not yet at
very large scales (Allan et al. 2019). However, limitations regarding metabolite formation
and oxygen availability can be expected in those situations.
Higher cell densities would mean that more meat cells can be grown in a reactor of the
same volume. It affects the energy demand for heating and cooling, as cultures with higher
cell densities need less heating and more cooling, and cultures with lower cell densities
need more heating and less cooling (per unit of volume). It is assumed that the total cooling
load needed remains unchanged. Lower cell densities means that more water has to be
added to the growing medium in order to fill up the reactors, and more reactors are needed
in total to produce the same amount of CM, with subsequent more energy and water used
for cleaning. Changes in cell density during proliferation stages have no effect on assumed
cell density during differentiation and maturation.
Cell volume
Average cell volume differs per species type and cell type. For example, fat cells are much
larger than muscle cells, and within the different types of muscle cells there is large
variation. Also, small animals tend to have smaller cells than large animals. As the
companies involved in this study produce a range of species and cell types, we used an

46 190107 - LCA of cultivated meat – February 2021
average cell volume for the baseline scenario and determined smaller cell volume (500 µm3)
and larger cell volume (5,000 µm3) on primary data collected and literature.
The effects of smaller and larger cell volume are similar to that of lower and higher cell
densities, respectively, as total cell mass harvested from one unit of volume decreases
accordingly.
Medium
Table 16 shows the medium compositions for the baseline, low- and high-medium scenarios.
The quantities have been based on a combination of primary data (mostly, both from
CM-producing companies and companies active in the supply chain) and literature.
The values for the baseline scenario are based on the geometric mean of the obtained
values, as this corresponded best with the distribution of values we received. The exception
is water use, for which the low-medium scenario was adapted for the process design we
maintain; at the cell densities modelled in this study, the primary data for water use were
too low to fill up the reactors to working capacity.

47 190107 - LCA of cultivated meat – February 2021
Table 16 – Medium composition: baseline scenario, low medium scenario and high medium scenario (total per kg of cultivated meat)
Components Baseline scenario (g) Low-medium scenario (g) High-medium scenario (g) Main ingredients
Amino acids (total), of which: 316 250 400 L-glutamine, L-Arginine hydrochloride
Amino acids from hydrolysate 237 186 300
Amino acids from conventional production 79 63 100
Sugars (total), of which: 78 15 400 Glucose, pyruvate
Sugars: Glucose 76 14 396
Sugars: Pyruvate 2 1 4
Recombinant proteins 7 1 50 Albumin (mainly), insulin, transferrin
Salts 80 40 160 Sodium chloride
Buffering agent 32 10 100 HEPES
Vitamins 2 0 20 i-Inositol, Choline chloride
Growth factors <<1 <<1 <<1
Water 12,649 7,500 40,000 Ultrapure water
Total (g) 13,164 7,816 41,130
Total (L) 13 8 42
Note: Approximate (rounded) values; values may not add up.

48 190107 - LCA of cultivated meat – February 2021
Figure 16 shows the environmental impact, and Figure 17 shows the carbon footprint of
medium per kg CM, showing the importance of increasing medium efficiency in the process.
The main driver for the differences in environmental single score is the amount of
recombinant proteins needed for CM production. This follows logically from the fact that
recombinant protein production has a relatively high demand for feedstock, energy, water
and chemicals. To a lesser extent this also applies to microbial or synthetic amino acid
production. On a per kg basis, hydrolysate has a significantly lower environmental impact
than microbially or synthetically produced amino acids, because it is a relatively efficient
process and therefore the impact is in large part determined by the feedstock (in this study
soybean meal).
Especially regarding albumin and a few other proteins we have received varying data,
as production scales are still relatively small and different expectations for future
improvement exist. Due to the relatively high environmental footprint of recombinant
proteins, only small variations will have large influence on results. Companies could focus
on reducing the amount of recombinant proteins in their production process, or find
alternatives with a lower environmental impact. An interesting production route for
albumin could be to extract it from plants. However, no environmental data could be
located for this and therefore this study assumes recombinant albumin production through
fermentation.
Figure 16 – Environmental impact of medium use for 1 kg of CM
A: Conventional energy - medium high
B: Conventional energy - medium mid
C: Conventional energy - medium low
D: Sustainable energy - medium high
E: Sustainable energy - medium mid
F: Sustainable energy - medium low
308
82
41
147
53
3250
100
150
200
250
300
350
A B C D C F
mPt
/ k
g C
M
Environmental impact of medium per kg cultivated meat (CM)
Global warming
Land use
Water consumption
Fine particulate matter formation
Human toxicity
Ecotoxicity
Acidification
Eutrophication
Resource scarcity
Stratospheric ozone depletion
Ozone formation
Ionizing radiation
Total

49 190107 - LCA of cultivated meat – February 2021
Figure 17 – Carbon footprint of medium, per kg of CM produced – contribution analysis of different medium
ingredients
A: Conventional energy - medium high
B: Conventional energy - medium mid
C: Conventional energy - medium low
D: Sustainable energy - medium high
E: Sustainable energy - medium mid
F: Sustainable energy - medium low
10.9
2.5
1.1
2.9
1.10.6
2
4
6
8
10
12
A B C D E F
kg C
O2-e
q.
/ k
g C
M
Carbon footprint of medium per kg cultivated meat (CM)
Other
Water
Salts
Recombinant proteins & growth factors
Sugars
Amino acids
Hydrolysate
Total


