
Las Rosas LandfillLas Rosas Landfill
Maldonado Maldonado -- UruguayUruguay
Waste
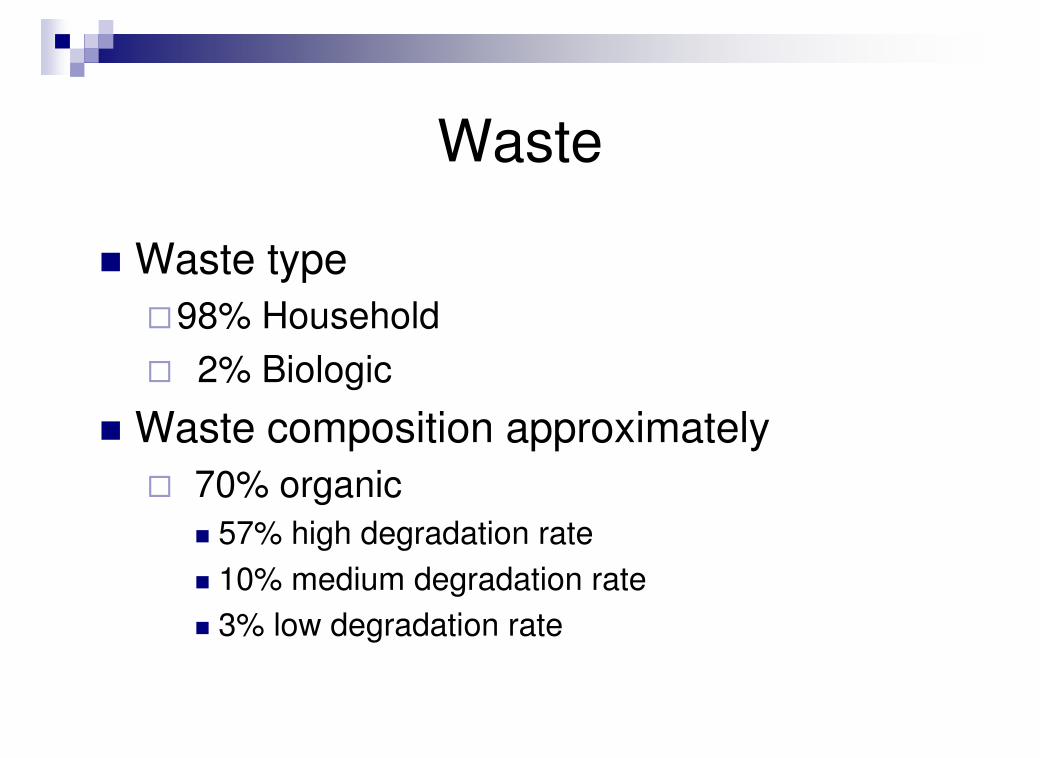
� Waste type
�98% Household
� 2% Biologic
� Waste composition approximately
� 70% organic
� 57% high degradation rate
� 10% medium degradation rate
� 3% low degradation rate

Landfill� Location
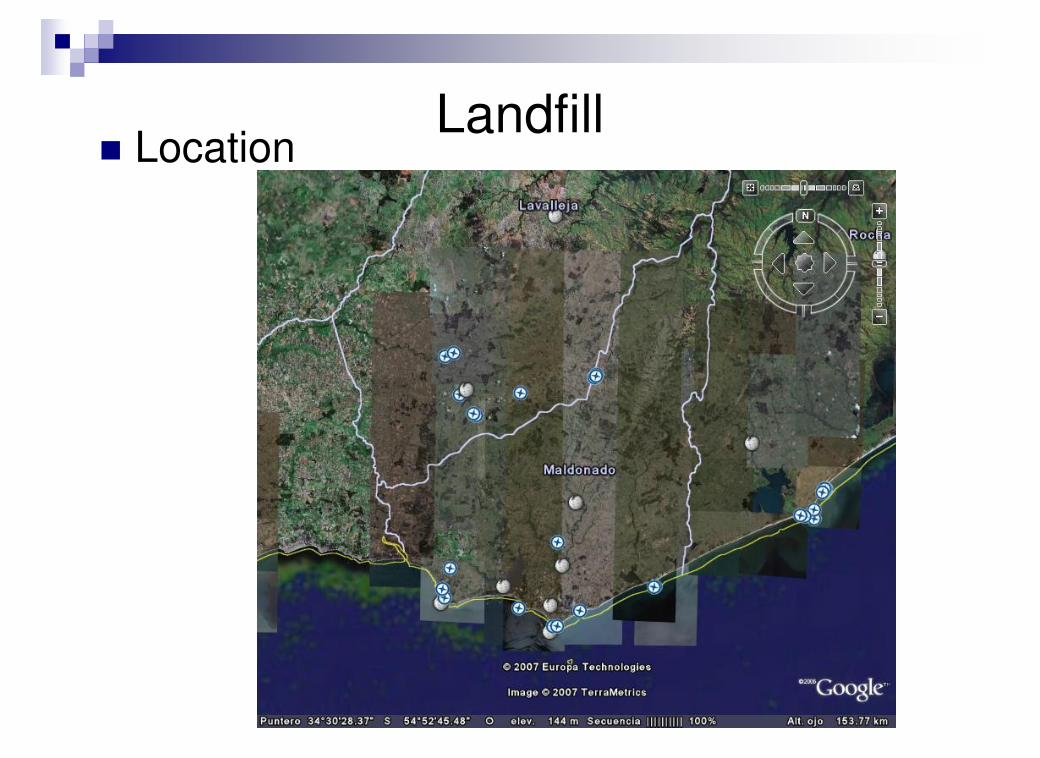
Landfill� Location

Landfill� Location
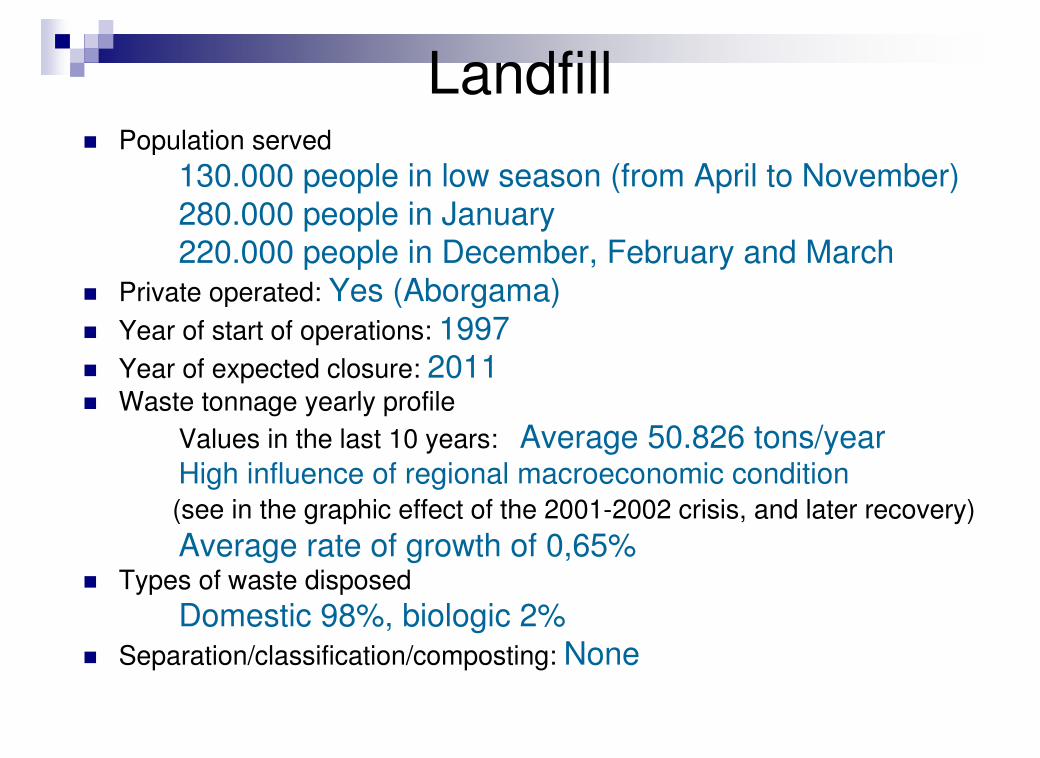
Landfill� Population served
130.000 people in low season (from April to November)280.000 people in January220.000 people in December, February and March
� Private operated: Yes (Aborgama)� Year of start of operations: 1997� Year of expected closure: 2011� Waste tonnage yearly profile
Values in the last 10 years: Average 50.826 tons/yearHigh influence of regional macroeconomic condition (see in the graphic effect of the 2001-2002 crisis, and later recovery)
Average rate of growth of 0,65%� Types of waste disposed
Domestic 98%, biologic 2%� Separation/classification/composting: None
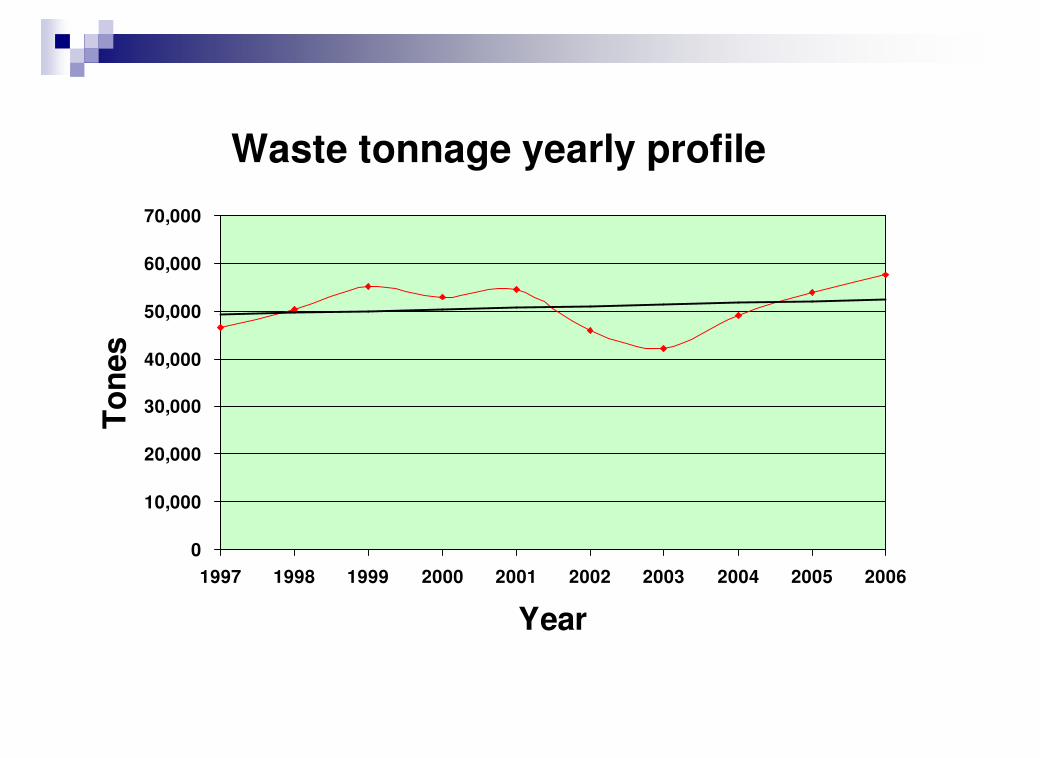
Waste tonnage yearly profile
0
10,000
20,000
30,000
40,000
50,000
60,000
70,000
1997 1998 1999 2000 2001 2002 2003 2004 2005 2006
Year
To
nes
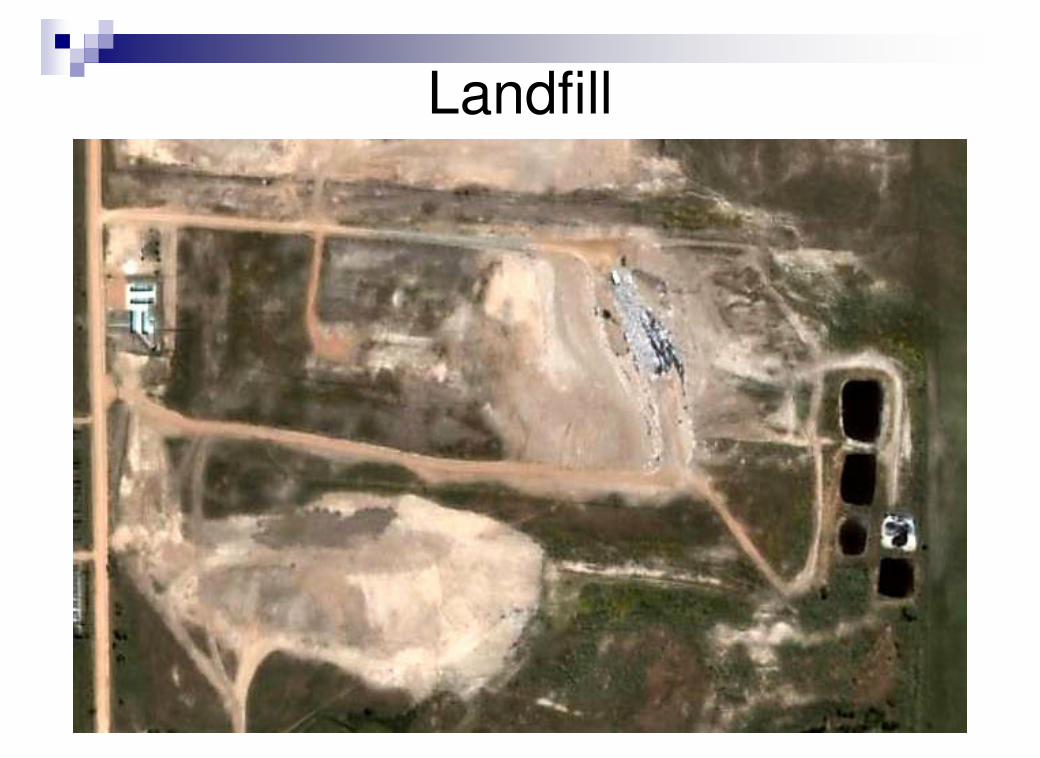
Landfill
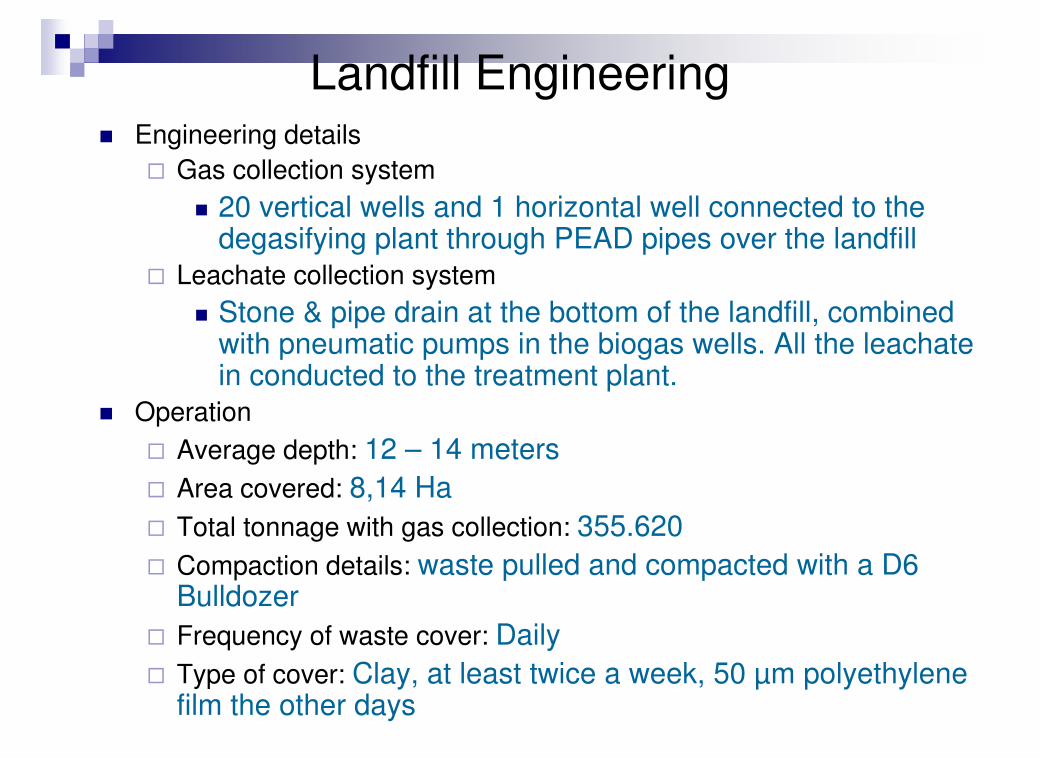
Landfill Engineering� Engineering details
� Gas collection system
� 20 vertical wells and 1 horizontal well connected to the degasifying plant through PEAD pipes over the landfill
� Leachate collection system
� Stone & pipe drain at the bottom of the landfill, combined with pneumatic pumps in the biogas wells. All the leachate in conducted to the treatment plant.
� Operation
� Average depth: 12 – 14 meters
� Area covered: 8,14 Ha
� Total tonnage with gas collection: 355.620
� Compaction details: waste pulled and compacted with a D6 Bulldozer
� Frequency of waste cover: Daily
� Type of cover: Clay, at least twice a week, 50 µm polyethylene film the other days

Biogas installation scheme
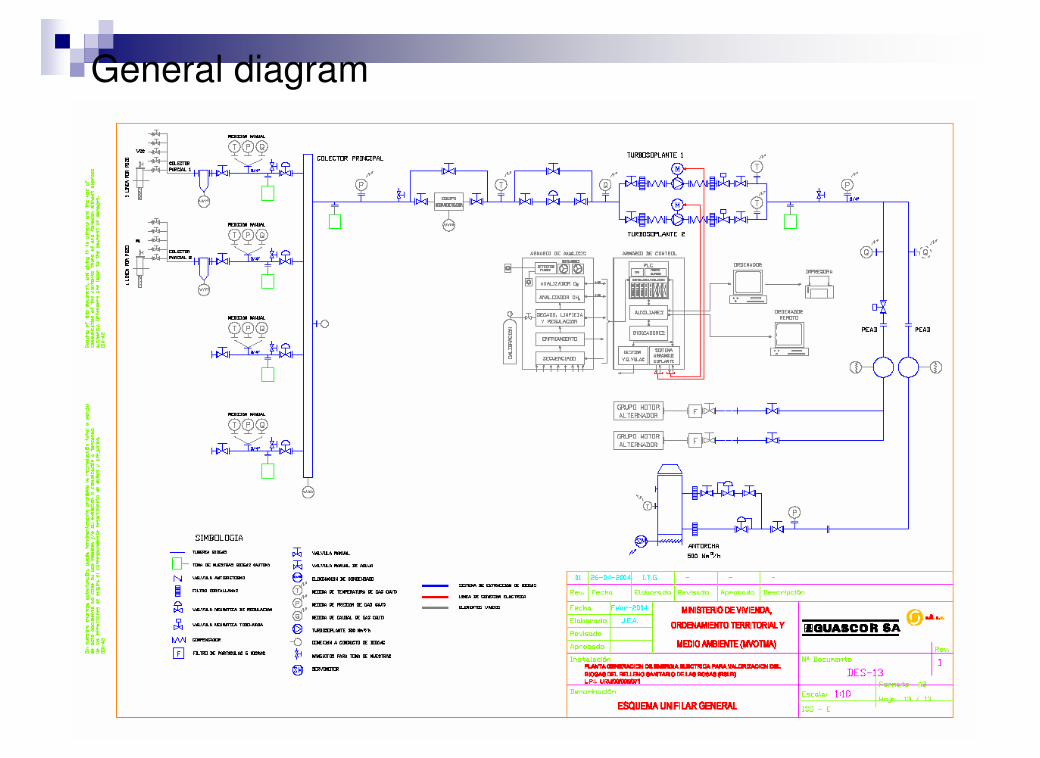
General diagram
Landfill Gas Engineering� Main responsible for LFG Engineering:
Degasifying: Sufi (Spain)Electrical generation: Guascor (Spain)
Horizontal well: Aborgama with Eng. Willumsen advising
� Modeling� When LFG curve was modeled: 2005
� Model used: self developed based on the EPA Method modifiedIncludes:
� LFG production projections
� Electrical energy
� Thermal energy
� O&M costs
� Economical analysis
� By now we are studying the influence of the depression into the landfill related with the pressure in the well heads

Modeling
� Based on the U.S. EPA Modeln
� Q = Σ 2 k L0 Mi e-kti
i=1
� Main parameters:
� L0, kh, km, kl
Input values(k, L0, yearly tones of waste…)
Projected LFG production
Extraction efficiency input
Projected LFG extraction
Combustion efficiency & reliability / capacity installed
Projected ton CO2eq
Projected Electrical generation
Projected Thermal Energy production
Sell prices / Investments / Operation Costs / Financial parameters
Economical Results Electrical generation
Sell prices / Investments / Operation Costs / Financial parameters
Economical Results Thermal energy generation
Sell prices / Investments / Operation Costs / Financial parameters
Economical Results CDM Project
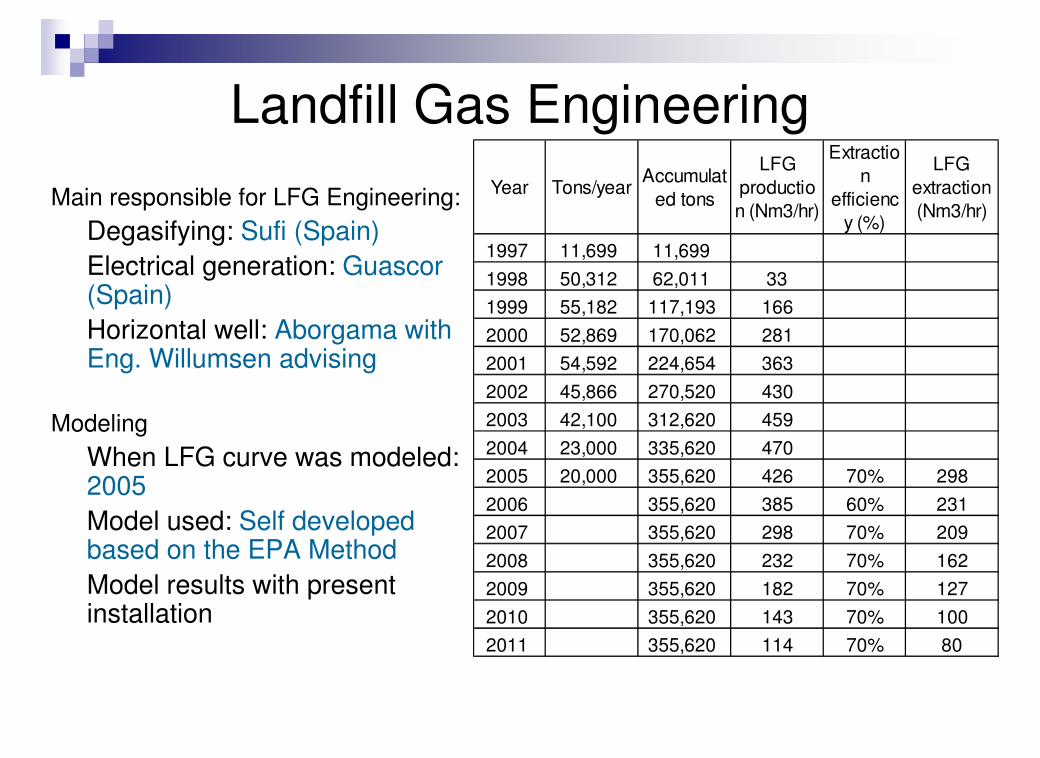
Landfill Gas Engineering
Main responsible for LFG Engineering:
Degasifying: Sufi (Spain)
Electrical generation: Guascor (Spain)
Horizontal well: Aborgama with Eng. Willumsen advising
Modeling
When LFG curve was modeled: 2005
Model used: Self developedbased on the EPA Method
Model results with present installation
Year Tons/yearAccumulat
ed tons
LFG
productio
n (Nm3/hr)
Extractio
n
efficienc
y (%)
LFG
extraction
(Nm3/hr)
1997 11,699 11,699
1998 50,312 62,011 33
1999 55,182 117,193 166
2000 52,869 170,062 281
2001 54,592 224,654 363
2002 45,866 270,520 430
2003 42,100 312,620 459
2004 23,000 335,620 470
2005 20,000 355,620 426 70% 298
2006 355,620 385 60% 231
2007 355,620 298 70% 209
2008 355,620 232 70% 162
2009 355,620 182 70% 127
2010 355,620 143 70% 100
2011 355,620 114 70% 80
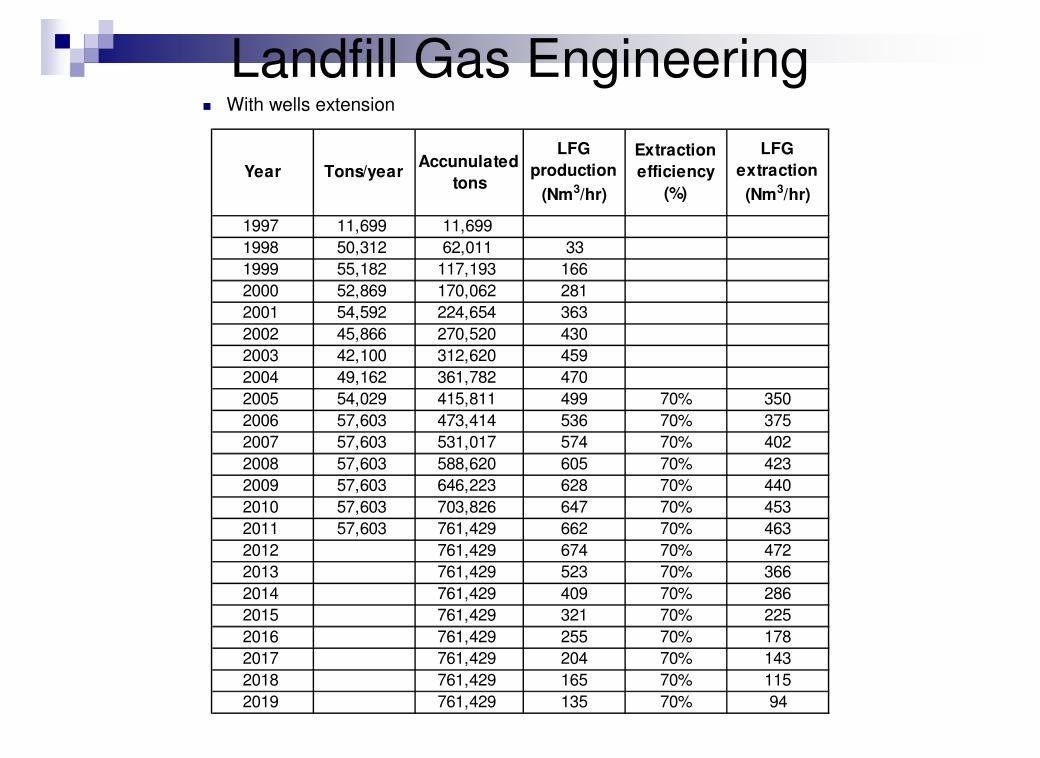
Landfill Gas Engineering� With wells extension
Year Tons/yearAccunulated
tons
LFG
production
(Nm3/hr)
Extraction
efficiency
(%)
LFG
extraction
(Nm3/hr)
1997 11,699 11,699
1998 50,312 62,011 33
1999 55,182 117,193 166
2000 52,869 170,062 281
2001 54,592 224,654 363
2002 45,866 270,520 430
2003 42,100 312,620 459
2004 49,162 361,782 470
2005 54,029 415,811 499 70% 350
2006 57,603 473,414 536 70% 375
2007 57,603 531,017 574 70% 402
2008 57,603 588,620 605 70% 423
2009 57,603 646,223 628 70% 440
2010 57,603 703,826 647 70% 453
2011 57,603 761,429 662 70% 463
2012 761,429 674 70% 472
2013 761,429 523 70% 366
2014 761,429 409 70% 286
2015 761,429 321 70% 225
2016 761,429 255 70% 178
2017 761,429 204 70% 143
2018 761,429 165 70% 115
2019 761,429 135 70% 94
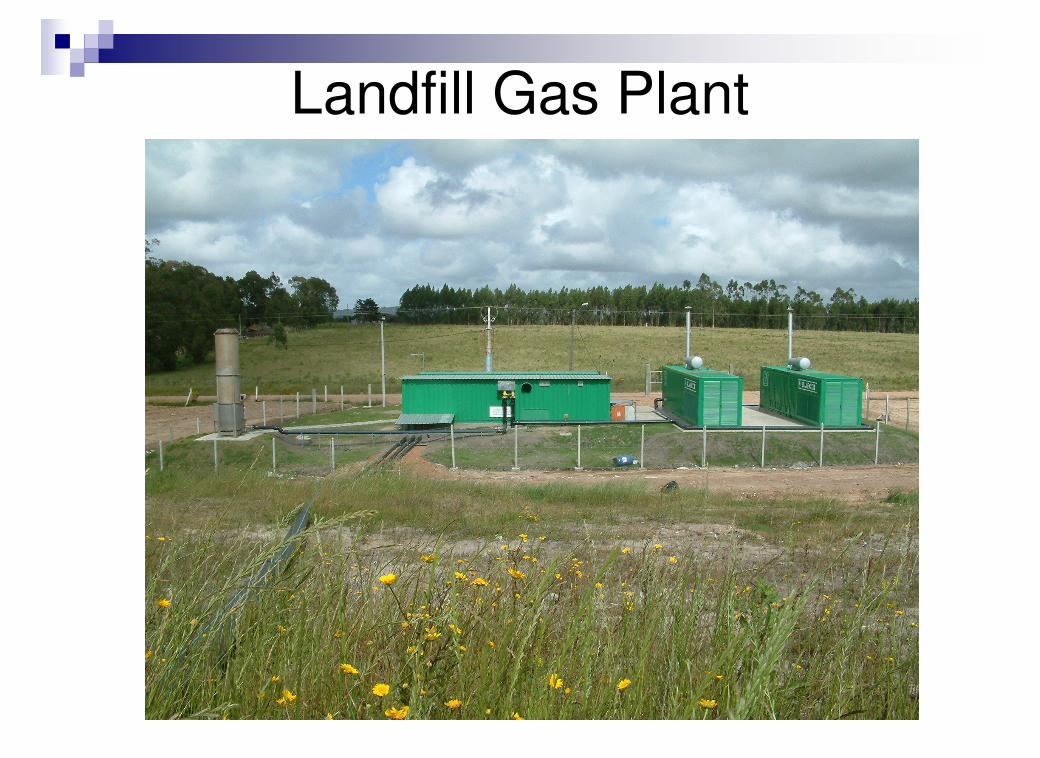
Landfill Gas Plant
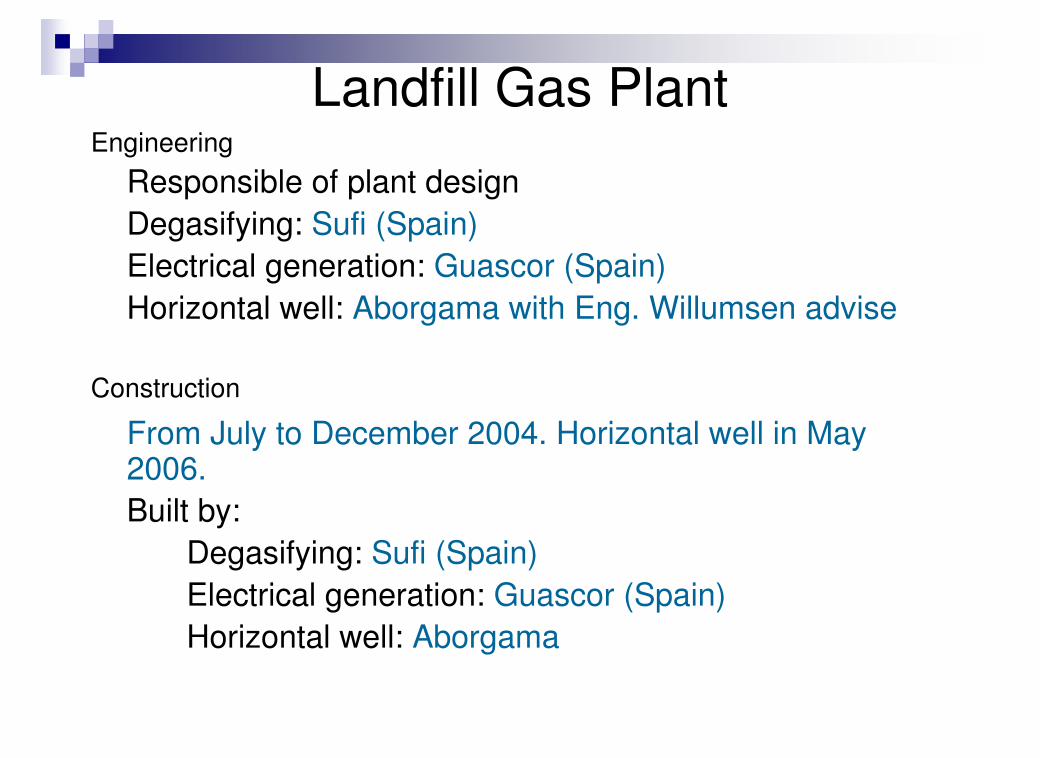
Landfill Gas PlantEngineering
Responsible of plant design
Degasifying: Sufi (Spain)
Electrical generation: Guascor (Spain)
Horizontal well: Aborgama with Eng. Willumsen advise
Construction
From July to December 2004. Horizontal well in May 2006.
Built by:
Degasifying: Sufi (Spain)
Electrical generation: Guascor (Spain)
Horizontal well: Aborgama
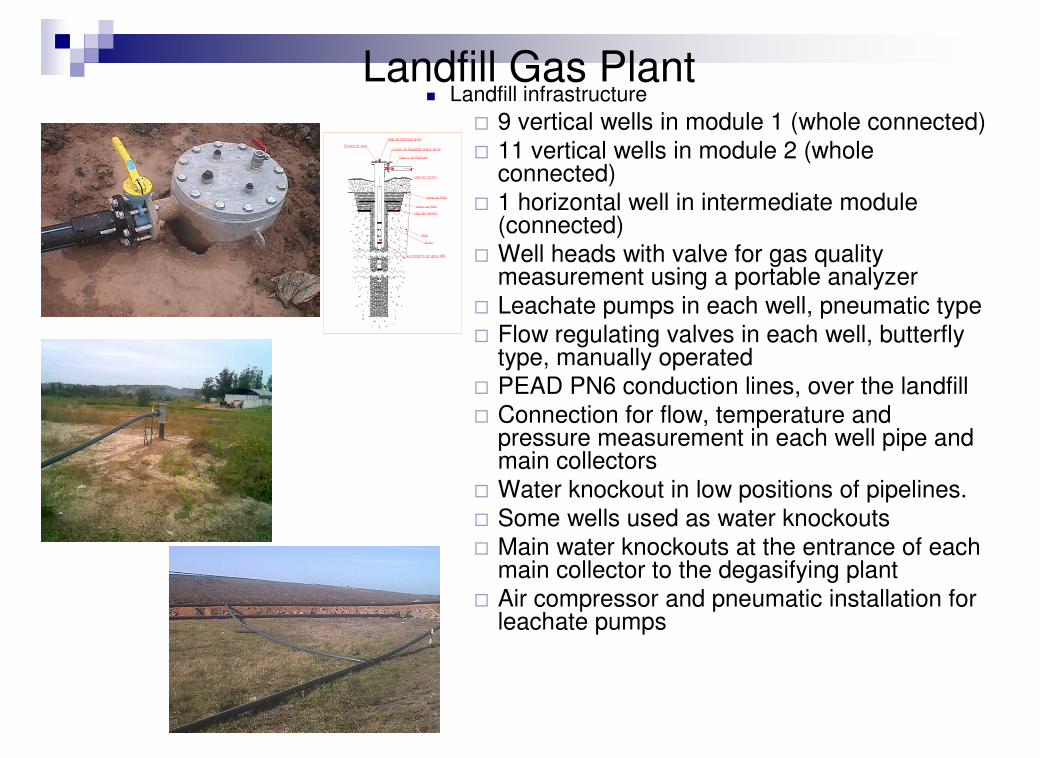
Landfill Gas Plant� Landfill infrastructure
� 9 vertical wells in module 1 (whole connected)� 11 vertical wells in module 2 (whole
connected)� 1 horizontal well in intermediate module
(connected)� Well heads with valve for gas quality
measurement using a portable analyzer
� Leachate pumps in each well, pneumatic type� Flow regulating valves in each well, butterfly
type, manually operated� PEAD PN6 conduction lines, over the landfill� Connection for flow, temperature and
pressure measurement in each well pipe and main collectors
� Water knockout in low positions of pipelines.� Some wells used as water knockouts� Main water knockouts at the entrance of each
main collector to the degasifying plant� Air compressor and pneumatic installation for
leachate pumps
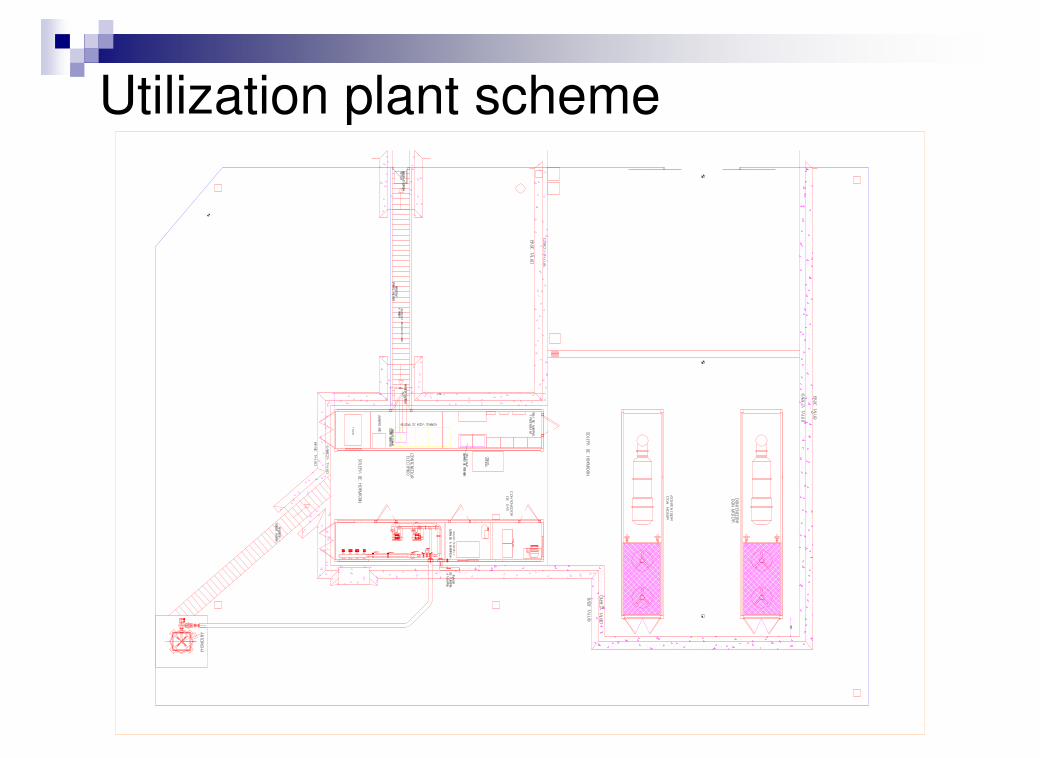
Utilization plant scheme

Landfill Gas Plant
� Degasifying plant
� Main collector from 3 main landfill pipes
� Automatic valves at the entrance of each main pipe to the main collector (modulates flow depending on methane and oxygen contents in the biogas)
� Biogas – water cooler with condensate knockout
� Automatic valve that makes constant the depression in the main collector
� Orifice plate flow meters for the total flow and for the flow sent to motors
� 2 centrifugal biogas pumps, of 500 Nm3/h capacity each, one in operation, the other stand by
� Flame arrestors, temperature and pressure meters, etc.

Landfill Gas Plant
� Control room
� Methane analyzer (infrared type)
� Oxygen analyzer (paramagnetic type)
� Pressure transducers (gas through main collector, gas to motors, flow meters)
� Degasifying PLC
� Scada system for operator interaction
� Auxiliary equipment

Landfill Gas Plant
� Generation
� 2 electrical generators, 0,5 MW capacity each, synchronic type, 380 Volt, energized by 4 stroke biogas motors, 12 cylinders, 36 liters
� Flare
� 500 Nm3/h capacity, closed type. Only burning when generation is out of operation.

Landfill Gas PlantElectrical control room
� Generation PLC (in communication with degasifying PLC)
� Individual control panel for each generator� Central generation control panel
� Dialogue terminal for operator interaction� Low tension main interrupters for each
generator� Low tension main interrupter� Medium tension main interrupter� Fire control central panel� Smoke and temperature sensors
� Other auxiliary equipment
Electrical connection� 1 transformer 0,38 / 6,3 kV� Connection cells with the electrical grid
� Control and remote acted interrupters
Other� Portable gas analyzer
(methane and oxygen)� Air compressor for
control equipment� Water cooler� Biogas sampler for
measuring pressure and gas quality into the landfill
Landfill Gas PlantAverage working conditions
� Gas pressures
� Wells: Wide variable, from 0 to -70 mbar, depending on the biogas quality
� Main collector: -70 mbar
� Entrance to biogas pump: -100 mbar
� Pump impulsion: 180 – 240 mbar� Gas flow (at present)
� Collector 1 (module 1): 110 Nm3/h
� Collector 1+ (intermediate module): 50 Nm3/h
� Collector 2 (module 2) : 20 Nm3/h
� Collector 3 (module 2) : 50 Nm3/h
� Total flow: 230 Nm3/h� Gas temperatures
� Main collector: 30 – 40 ºC
� After gas cooler: 17 ºC
� After pump: 70 ºC� Electrical generators (at present)
� 250 KW generation
� Exhaust gas temperature: 550 ºC
� Generator room temperature: 30 ºC
Landfill Gas Plant� Main equipment origin
� Electrical generator motors: Guascor, Spain
� Electrical generator: Leroy Somer, France
� Flare: Eurocomercial, Spain� Methane analyzer: Fuji Electric, USA� Oxygen analyzer: Fuji Electric, USA
� Portable analyzer: GMI, USA� Leachate pumps (3): QED, USA
� Leachate pumps (18): Self constructed, Uruguay
� Biogas pumps: Mapro, Italy
� Biogas dryer and water cooler: Airsec, Spain� Flow and pressure meters: Foxboro, USA
� Automatic valves positioners: Samson, Denmark
� Control valves motor gas feeding: Dungs, Germany� Butterfly valves: Ivalsa, Spain
� Orifice plates: Epco, Spain
� Temperature sensors: Epco, Spain
� Degasification PLC: Omron, France� Generation PLC: Telemechanique, France
� Main interrupters: Telemechanique, France� Air compressors: Ingersoll-Rand, UK

Landfill Gas Plant� Operation
� Plant operator: Aborgama
� Operation start: December 28, 2004
0.751.41532.0 3.495Dec
0.850.13443.3 4.6129Nov
0.550.77259.0 6.3176Oct
0.454.19764.7 6.9193Sep
0.454.33681.3 8.7243Aug
0.354.613886.4 9.2258Jul
0.654.421882.5 8.8246Jun
0.654.622384.2 9.0251May
1.153.322977.5 8.3231Apr
0.951.83668.0 7.3203Mar
NANA4663.0 6.7188Feb
NA
NANA15255.1 5.9165Jan
% CO2
% O2
% CH4
Precipitation (mm)
Ton CH4
extractedNm3 LFG / ton / Year
1.000 Nm3
LFG extracted
Month
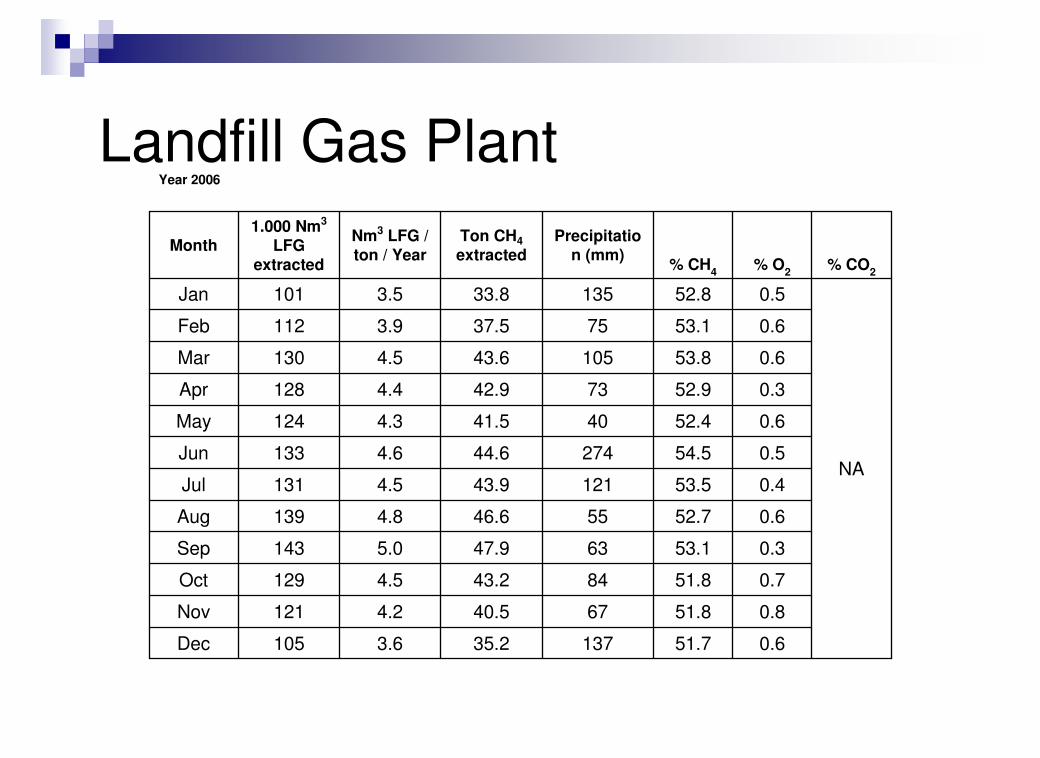
Year 2005
Landfill Gas Plant
0.651.7 13735.2 3.6105Dec
0.851.8 6740.5 4.2121Nov
0.751.8 8443.2 4.5129Oct
0.353.1 6347.9 5.0143Sep
0.652.7 5546.6 4.8139Aug
0.453.5 12143.9 4.5131Jul
0.554.5 27444.6 4.6133Jun
0.652.4 4041.5 4.3124May
0.352.9 7342.9 4.4128Apr
0.653.8 10543.6 4.5130Mar
0.653.1 7537.5 3.9112Feb
NA
0.552.8 13533.8 3.5101Jan
% CO2
% O2
% CH4
Precipitation (mm)
Ton CH4
extracted
Nm3 LFG /
ton / Year
1.000 Nm3
LFG extracted
Month
Year 2006

LFG Extracted
2005 - 2006
0
50
100
150
200
250
300
1 2 3 4 5 6 7 8 9 10 11 12 13 14 15 16 17 18 19 20 21 22 23 24
Month
('0
00
Nm
3)
30
40
50
60
Pe
rce
nta
ge
(%
)
LFG Extracted (Nm3) % CH4
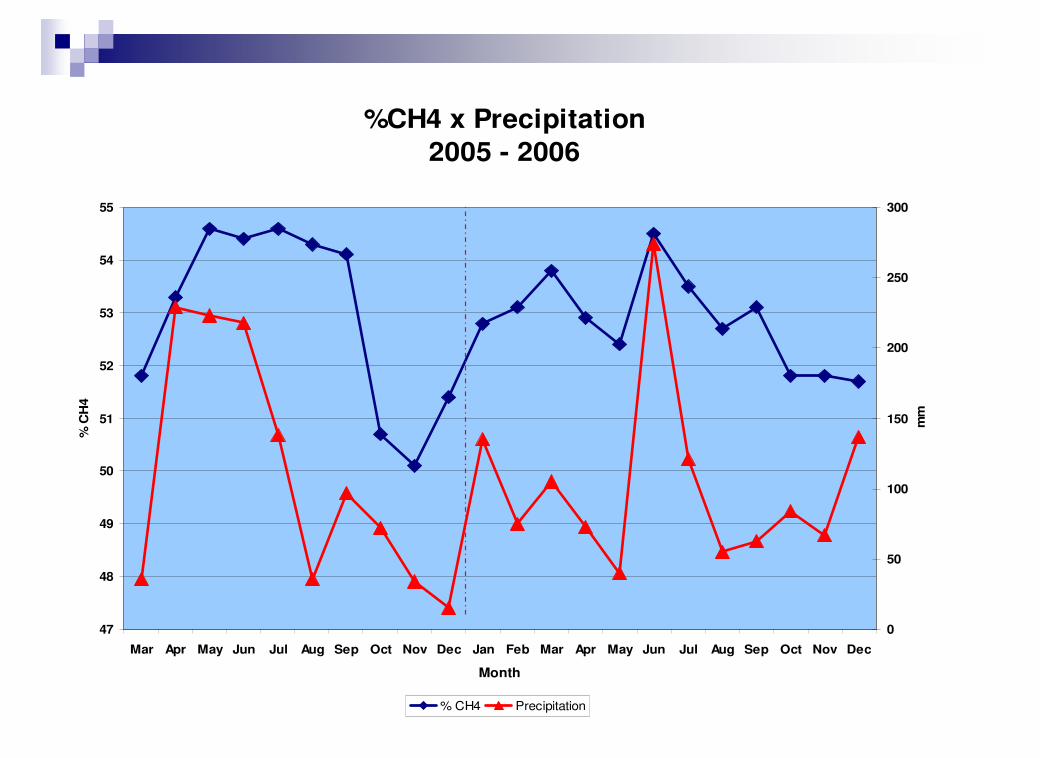
%CH4 x Precipitation
2005 - 2006
47
48
49
50
51
52
53
54
55
Mar Apr May Jun Jul Aug Sep Oct Nov Dec Jan Feb Mar Apr May Jun Jul Aug Sep Oct Nov Dec
Month
% C
H4
0
50
100
150
200
250
300
mm
% CH4 Precipitation

Landfill Gas Plant� Comparison: model/engineering vs. actual project
� Explanation for differences
� Two long dry periods affected the permeability of the final cover.
� No portable gas analyzer since July 2006 and during two months in 2005. - Very difficult to optimize biogas extraction by manual regulation.
� A dry (low rain) period from Aug to Nov 2006 – more critical to depend on gas analyzer.
� In the last dry months of 2006, the flow of biogas was often not enough to run the electrical generator. (The builder recommendation is not to run for less than 200 kw.)
-23,8%-4671.4961.9632006
-6,2%-1562.3792.5352005
Difference
(+/- %)
Difference
(+/- 103
Nm3/year)
Real LFG
extraction (103
Nm3/year)
Estimation of
LFG extraction
(103 Nm3/year)Year
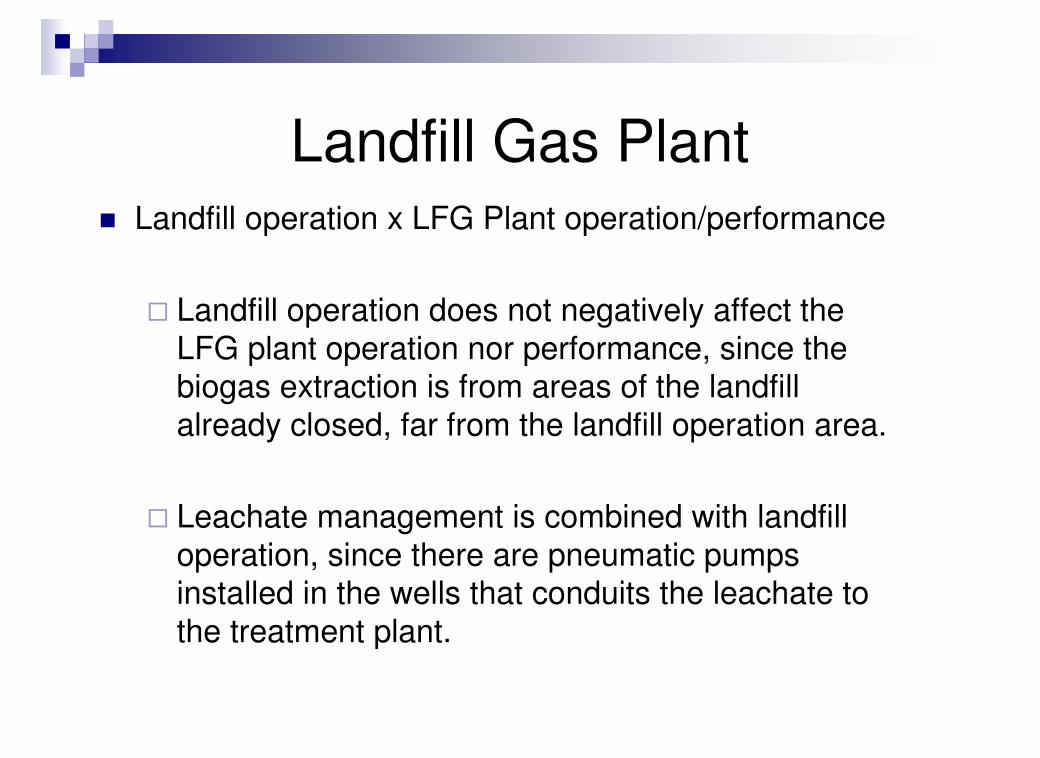
Landfill Gas Plant� Landfill operation x LFG Plant operation/performance
� Landfill operation does not negatively affect the LFG plant operation nor performance, since the biogas extraction is from areas of the landfill already closed, far from the landfill operation area.
� Leachate management is combined with landfill operation, since there are pneumatic pumps installed in the wells that conduits the leachate to the treatment plant.
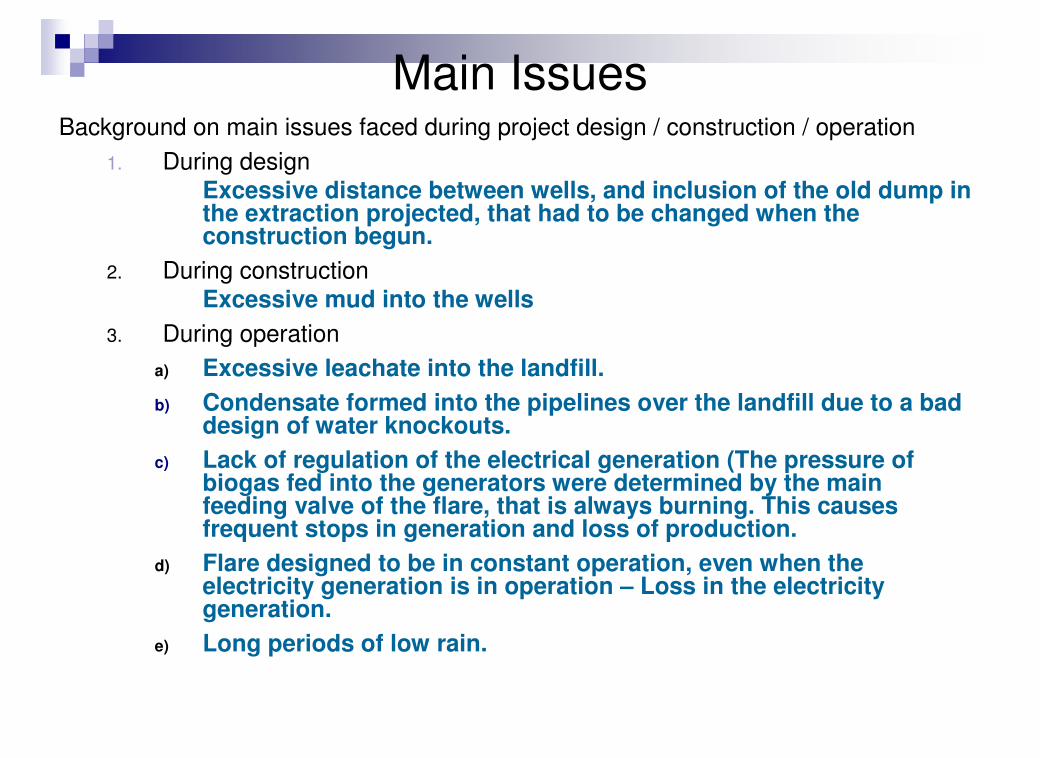
Main IssuesBackground on main issues faced during project design / construction / operation
1. During designExcessive distance between wells, and inclusion of the old dump in the extraction projected, that had to be changed when the construction begun.
2. During constructionExcessive mud into the wells
3. During operation
a) Excessive leachate into the landfill.
b) Condensate formed into the pipelines over the landfill due to a bad design of water knockouts.
c) Lack of regulation of the electrical generation (The pressure ofbiogas fed into the generators were determined by the main feeding valve of the flare, that is always burning. This causes frequent stops in generation and loss of production.
d) Flare designed to be in constant operation, even when the electricity generation is in operation – Loss in the electricity generation.
e) Long periods of low rain.
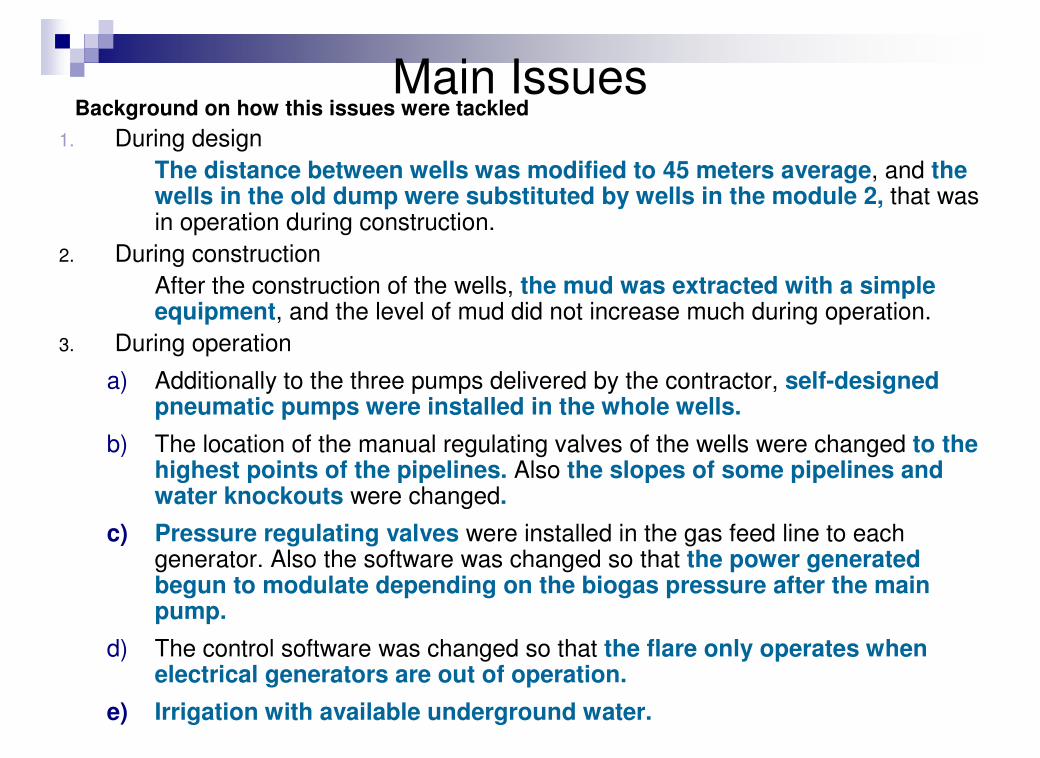
Main IssuesBackground on how this issues were tackled
1. During design
The distance between wells was modified to 45 meters average, and the wells in the old dump were substituted by wells in the module 2, that was in operation during construction.
2. During construction
After the construction of the wells, the mud was extracted with a simple equipment, and the level of mud did not increase much during operation.
3. During operation
a) Additionally to the three pumps delivered by the contractor, self-designed pneumatic pumps were installed in the whole wells.
b) The location of the manual regulating valves of the wells were changed to the highest points of the pipelines. Also the slopes of some pipelines and water knockouts were changed.
c) Pressure regulating valves were installed in the gas feed line to each generator. Also the software was changed so that the power generated begun to modulate depending on the biogas pressure after the main pump.
d) The control software was changed so that the flare only operates when electrical generators are out of operation.
e) Irrigation with available underground water.
Main Issues� Solutions under implementation / to be implemented
� Construction of complementary vertical and horizontal wells, to extract LFG from all the waste available.
� Extension of the irrigation installation in order to mitigate the effects of long dry periods.
� Continue with the biogas sample analysis in order to determine the real influence radio of the vertical and horizontal wells, as well as to determine the area affected by the lack of permeability that allows the air introduction into the landfill or system.
Final Remarks
� To which factors is the plant underperformance attributed
� Mainly due to the non construction of the additional wells
� Poor construction engineering, only affected as explained above the first period of operation.
� Long dry periods that affected the final cover permeability


