Land Productivity and Economic Development:Caloric Suitability vs. Agricultural Suitability
Oded Galor∗ and Omer Ozak†
July 12, 2015
Abstract
This paper establishes that the Caloric Suitability Index (CSI) dominates the com-monly used measure of agricultural suitability in the examination of the effect of landproductivity on comparative economic development. The analysis demonstrates thatthe agricultural suitability index does not capture the large variation in the potentialcaloric yield across equally suitable land, reflecting the fact that land suitable for agri-culture is not necessarily suitable for the most caloric-intensive crops. Hence, in lightof the instrumental role played by caloric yield in sustaining and supporting populationgrowth, and given importance of pre-industrial population density for the subsequentcourse of economic development, the Caloric Suitability Index dominates the conven-tional measure in capturing the effect of land productivity on pre-colonial populationdensity and the subsequent course of economic development.
Keywords: Caloric Suitability, Agricultural Suitability, Agricultural Productivity, LandProductivity, Economic Development, Population Density
JEL Classification: O10, O40, Q10
∗Department of Economics, Brown University. E-mail: Oded [email protected]†Department of Economics, Southern Methodist University. E-mail: [email protected]
1
1 Introduction
The role of geographical factors in comparative economic development at the national as well
as the subnational level has been at the forefront of contemporary research on the persistent
effect of deep-rooted factors in the differential development paths across nations and regions.
In particular, land productivity has been shown to be conducive for economic development
in the pre-colonial era and detrimental for prosperity in the post-colonial world.
The examination of the effect of land productivity has been based in recent years on an
index of the suitability of land for agriculture (Ramankutty et al., 2002), which measures
the fraction of each 0.5 × 0.5 degrees grid cell that is suitable for agriculture. This index,
however, does not capture the large variation in the potential caloric yield across equally
suitable land. In particular, geographical regions that according to this index are comparable
in terms of their suitability for agriculture may differ significantly in their potential caloric
output, reflecting the fact that land suitable for agriculture is not necessarily suitable for
the most productive crops in terms of their caloric return.
Thus, in light of the importance of pre-industrial population density for the subsequent
course of economic development, and given the instrumental role played by caloric yield
in sustaining and supporting population growth, it is rather apparent that this commonly
used index is not well designed to properly capture the effect of the suitability of land for
agriculture on economic development.
Galor and Ozak (2014) introduce a novel methodology that can be used to construct a
refined measure of agricultural productivity based on the caloric potential of each grid cell
on planet earth. The proposed Caloric Suitability Index (CSI) rectifies the deficiencies of
the agricultural suitability index of Ramankutty et al. (2002), as well as other measures
based on the FAO data that have measured agriculture output in tons rather than in caloric
yield, and introduce a novel and comparable measure of agricultural suitability that properly
captures the variation in potential crop yield across the globe, as accounted for by calories
per hectare per year. Furthermore, in light of the expansion of crops amenable for cultivation
in the course of the Columbian Exchange (Crosby, 1972), the index accounts for the changes
in land productivity in the post-1500 period. Finally, focusing on potential crop yield, based
on agro-climatic characteristics that are unaffected by human intervention, this measure can
viewed as an exogenous proxy for land productivity.
This paper explores the virtues of the Caloric Suitability Index (CSI) in comparison to
the index of agricultural suitability, demonstrating that effect of Caloric Suitability Index
(CSI) on population density in the pre-colonial period is highly significant economically and
statistically, whereas the effect of land suitability vanishes, once the CSI is accounted for.
2

Moreover the paper and its online companion provides four estimates of caloric suitability
for each cell of size 5′ × 5′ in the world:
1. The maximum potential caloric yield attainable given the set of crops that are suitable
for cultivation in the pre-1500 period.
2. The maximum potential caloric yield attainable, given the set of crops that are suitable
for cultivation in the post-1500 period.
3. The average potential yields within each cell attainable given the set of crops that are
suitable for cultivation in the pre-1500 period.
4. The average potential yields within each cell attainable given the set of crops that are
suitable for cultivation in the post-1500 period.
The rest of the paper is structured as follows. section 2 explains the construction of
the Caloric Suitability Index. Section 3 depicts the spatial distribution of agricultural pro-
ductivity based on the CSI and the agricultural suitability index. Section 4 analyzes the
virtues of the CSI in comparison to the agricultural suitability index. Section 5 examines
the effect of CSI on pre-colonial development and Section 6 concludes. Appendix A provides
instructions, links to the data and other resources.
2 The Caloric Suitability Indices Data
The Caloric Suitability Indices are constructed based on data from the Global Agro-
Ecological Zones (GAEZ) project of the Food and Agriculture Organization (FAO). The
GAEZ project supplies global estimates of crop yield for 48 crops in grids with cells size of
5′ × 5′ (i.e., approximately 100 km2).
The estimates are available for: alfalfa, banana, barley, buckwheat, cabbage, cacao,
carrot, cassava, chickpea, citrus, coconut, coffee, cotton, cowpea, dry pea, flax, foxtail millet,
greengram, groundnuts, indigo rice, maize, oat, oilpalm, olive, onion, palm heart, pearl
millet, phaseolus bean, pigeon pea, rye, sorghum, soybean, sunflower, sweet potato, tea,
tomato, wetland rice, wheat, spring wheat, winter wheat, white potato, yams, giant yams,
subtropical sorghum, tropical highland sorghum, tropical lowland sorghum, and white yams.
For each crop, GAEZ provides estimates for crop yield based on three alternative levels
of inputs – high, medium, and low - and two possible categories of sources of water supply
– rain-fed and irrigation. Additionally, for each input-water source category, it provides
two separate estimates for crop yield, based on agro-climatic conditions, that are arguably
unaffected by human intervention, and agro-ecological constraints, that could potentially
reflect human intervention.
3
In order to capture the conditions that were prevalent during the pre-industrial era,
while mitigating potential endogeneity concerns, the indices use the estimates of potential
crop yield under low level of inputs and rain-fed agriculture – cultivation methods that
characterized early stages of development. Moreover, the estimates of potential crop yield
are based on agro-climatic constraints that are largely orthogonal to human intervention.
Thus, these restrictions remove the potential concern that the level of agricultural inputs,
the irrigation method, and soil quality, reflect endogenous choices that could be potentially
correlated with individual preferences or institutional settings.1
The FAO dataset provides for each cell in the agro-climatic grid the potential yield for
each crop (measured in tons, per hectare, per year). These estimates account for the effect
of temperature and moisture on the growth of the crop, the impact of pests, diseases and
weeds on the yield, as well as climatic related “workability constraints”.
In order to better capture the nutritional differences across crops, and thus to ensure
comparability in the measure of crop yield, the yield of each crop in the GAEZ data (mea-
sured in tons, per hectare, per year) is converted into caloric return (measured in millions
of kilo calories, per hectare, per year). This conversion is based on the caloric content of
crops, as provided by the United States Department of Agriculture Nutrient Database for
Standard Reference. Using the estimates of the caloric content for each crop in the GAEZ
data (measured in kilo calories per 1g), a comparable measure of crop yield (in millions of
kilo calories, per hectare, per year) is constructed for each crop.
In light of the expansion in the set of crops that were available for cultivation in each
region in the course of the Columbian exchange, the constructed indices distinguish between
the caloric suitability in the pre-1500 period and in the post 1500 period. In particular,
the pre-1500 estimates are based on the 48 crops in the GAEZ/FAO data set, which were
available for cultivation in each region of the world before 1500CE, as documented in Table
10 (Crosby, 1972; Diamond, 1997).2 In the post 1500CE period, in contrast, all 48 crops
could potentially be adopted into agricultural production.3
1Additionally, the choice of rain-fed conditions is further justified by the fact that, although some societieshad access to irrigation prior to the industrial revolution, GAEZ’s data only provides estimates based onirrigation infrastructure available during the late twentieth century.
2The presence of the Asian varieties of rice (Oryza sativa) in Subsaharan Africa in the pre-1500CE periodhas been debated. In particular, the assignment of wetland (Oryza japonica) and indica (Oryza indica) ricevarieties present in the GAEZ data to Subsaharan Africa prior to 1500CE is questionable. Hence, the CSIprovide estimates based on the inclusion and the exclusion of Asian crops among those available for cultivationin Subsaharan Africa. It should be noted that while the regression analysis in Section 5 include the Asianvarieties, their exclusion magnifies the economic and statistical significance of the CSI in comparison to theagricultural suitability index.
3In fact, as Crosby (1972) shows, many of the crops were quickly transplanted between the Old and NewWorlds.
4
2.1 Caloric Suitability Within a Cell
This section provides measures for the average and maximum caloric suitability with each
cell.4 First, for each cell the average caloric yield across all available crops pre- and post-
1500CE is computed. In particular, for any given cell c, the average caloric yield is ect =∑i∈Cct eic/ |Cct|, where eic is the caloric yield per hectare per year of crop i in cell c, and crop
i belongs to the set of crops available in the cell in period t, Cct. Notice that the average
caloric yield in cell c in period t, ect is affected by the total number of crops available, which
might include crops not productive in that particular cell. Thus, this measure penalizes
the average caloric yield in cells where not all crops are productive. For this reason, an
alternative measure that excludes non-productive crops from the average for each cell is
provided. This alternative index measures the average caloric yield in cell c in period t,
e0ct =
∑i∈C0ct
ei/ |C0ct|, for crops that are productive in the cell, i.e. eic > 0. This avoids
penalizing cell-level productivities due to the availability of crops that are not productive in
a cell. Notice that for cells where all crops are productive, ect = e0ct. Furthermore, for cells
where no crops are productive, ect = 0 and e0ct is set to missing, rather than zero that is
assigned by the measure that includes all crops regardless of their level of productivity. For
all other cells, it is the case that ect < e0ct.
Hence, this paper provides four measures of Average Caloric Suitability for each cell:
1. pre-1500CE (including crops with zero productivity)
2. pre-1500CE (excluding crops with zero productivity)
3. post-1500CE (including crops with zero productivity)
4. post-1500CE (excluding crops with zero productivity)
Second, following Galor and Ozak (2014), the paper provides a measure of the Maximal
Caloric Suitability for each cell for crops that were available for cultivation in the pre and
post-1500CE period. In particular, for any given cell c, the maximum caloric yield is e∗ct =
maxi∈Cct eic. Notice that cells for which at least one crop is productive e∗ct = e0∗ct where
e0∗ct = maxi∈C0ct eic. On the other hand, if no crop is productive e∗ct = 0 and e0∗
ct is set
to missing. Using these two measures, the analysis builds four sets of grids of Maximum
Caloric Suitability:
1. pre-1500CE (including crops with zero productivity)
4The measures constructed by Galor and Ozak (2014) exclude bananas, cassava, and coconuts since theGAEZ/FAO data does not provide an estimate for their potential growth cycles. This restriction does notaffect their analysis since they focus on the crops that yield the highest number of calories in each cell giventhe available crops in the pre-and post-1500CE period and these excluded crops are dominated by others.
5

2. pre-1500CE (excluding crops with zero productivity)
3. post-1500CE (including crops with zero productivity)
4. post-1500CE (excluding crops with zero productivity)
While the analysis constructs and makes available only the Average and Maximum Caloric
Suitability Indices, one can clearly construct other similar Caloric Suitability Indices based
on other moments of the distribution of crops’ caloric yields.
2.2 Caloric Suitability Within a Country or Region
Country- or regional-level measures can be constructed by computing the statistic of interest
of a CSI measure over the cells located in the country or region. For example, the country-
level average of the pre-1500CE Average CSI (all cells and crops) for country C is computed
as eCt =∑
c∈C ect/ |C| for t =pre-1500CE. Notice that by construction, eCt penalizes the
country-level average due to cells that are not productive for all crops. On the other hand,
e0Ct =
∑c∈C e
0ct/ |C| excludes all cells that are not productive. As will be shown below both
measures are highly positively correlated.
A third measure can be constructed, which does not penalize for unproductive crops,
but includes the non-productive cells in the country- or regional-level analysis. Letting w0
denote the share of non-calorically-productive land, then e00Ct = w0 ·e0
Ct measures the average
caloric suitability in country C over all productive crops at each cell and including all cells in
the country. Thus, the analysis provides three different measures of caloric suitability at the
country level. First, the average caloric suitability across all cells regardless of whether crops
within the cell are productive or not. Second, the average caloric suitability for productive
cells, including only productive crops within a cell. Third, the average caloric suitability
across all cells, including only productive crops within a cell.
The CSI data can be used to assess the exogenous effect of agricultural potential on vari-
ous economic and social outcomes. The following sections compare the CSI and agricultural
suitability indices and establish their differential effects on pre-colonial population density
and economic development.
3 Caloric Crop Suitability and Agricultural Suitability
This section explores the spatial distribution of agricultural productivity as captured by
Caloric Suitability Indices (CSI) and agricultural suitability index (ASI).
6
3.1 Pre-1500CE Caloric Suitability Indices
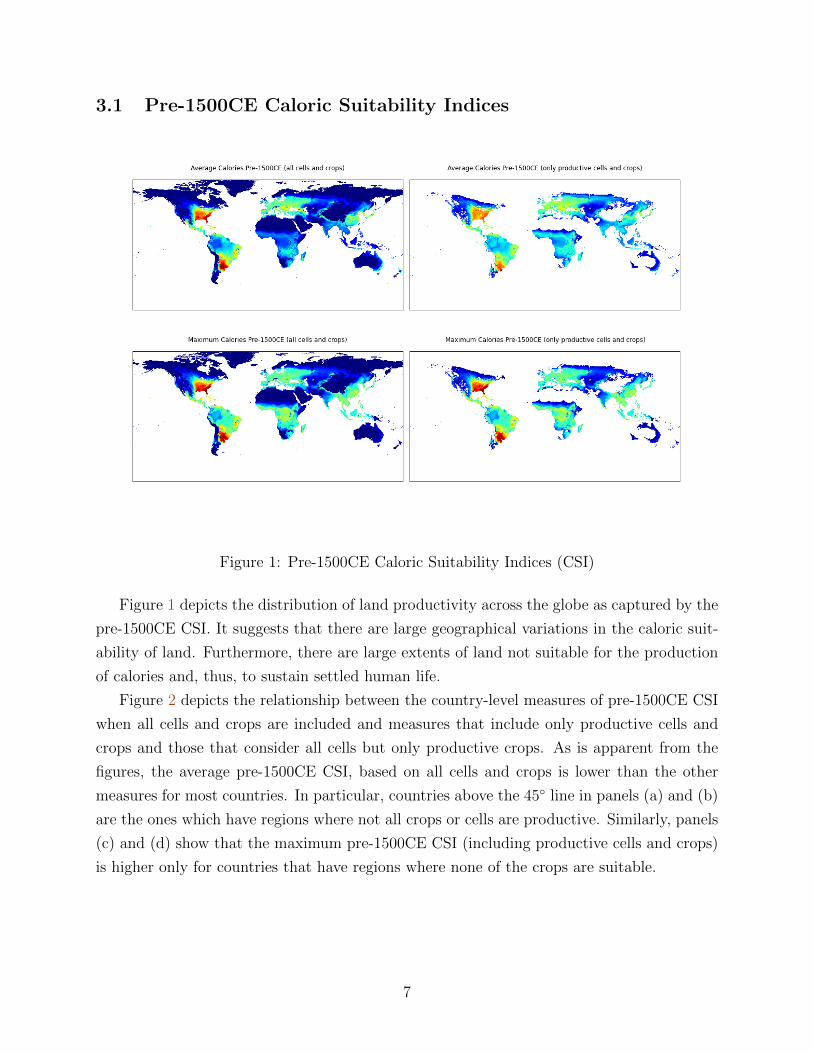
Figure 1: Pre-1500CE Caloric Suitability Indices (CSI)
Figure 1 depicts the distribution of land productivity across the globe as captured by the
pre-1500CE CSI. It suggests that there are large geographical variations in the caloric suit-
ability of land. Furthermore, there are large extents of land not suitable for the production
of calories and, thus, to sustain settled human life.
Figure 2 depicts the relationship between the country-level measures of pre-1500CE CSI
when all cells and crops are included and measures that include only productive cells and
crops and those that consider all cells but only productive crops. As is apparent from the
figures, the average pre-1500CE CSI, based on all cells and crops is lower than the other
measures for most countries. In particular, countries above the 45◦ line in panels (a) and (b)
are the ones which have regions where not all crops or cells are productive. Similarly, panels
(c) and (d) show that the maximum pre-1500CE CSI (including productive cells and crops)
is higher only for countries that have regions where none of the crops are suitable.
7

(a) Average CSI (all cells and crops) vs AverageCSI (only productive cells and crops)
(b) Average CSI (all cells and crops) vs AverageCSI (all cells and only productive crops)
(c) Maximum CSI (all cells and crops) vsMaximum CSI (only productive cells and crops)
(d) Maximum CSI (all cells and crops) vsMaximum CSI (all cells and only productive
crops)
Figure 2: Country-Level Measures of pre-1500CE Caloric Suitability Indices.
3.2 Post-1500CE Caloric Suitability Indices
Figure 3 shows the plots of the 4 rasters for the post-1500CE period. Again there are large
geographical variations in the caloric suitability of land. Furthermore, there are large extents
of land not suitable for the production of calories and, thus, to sustain settled human life,
even after the expansion of crops generated by the Columbian Exchange.
Additionally, Figure 4 shows the relation between the country-level measures for the pre-
and post-1500CE CIS data. As can be seen there, the expansion of crops generated by the
Columbian Exchange weakly increased the Maximum CSI (only productive cells and crops)
in all countries. This reflects the fact that by introducing new crops, the maximum caloric
suitability in all cells in a country increase weakly. On the other hand, the other Maximum
8
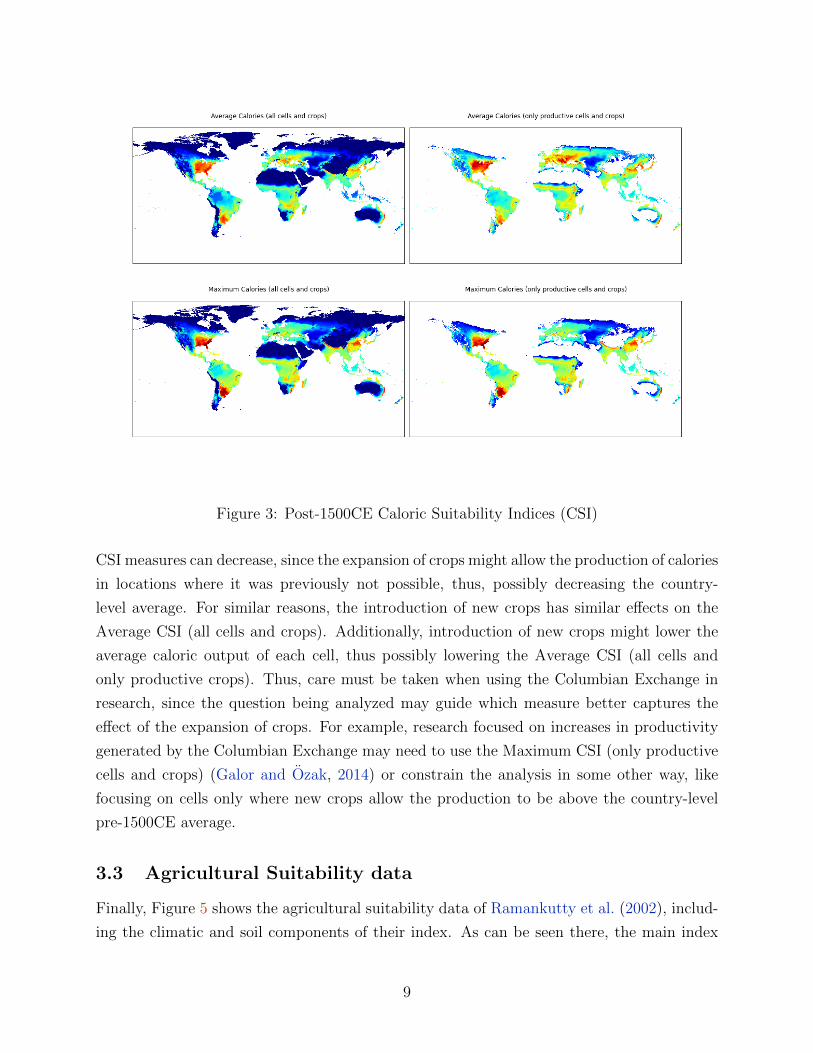
Figure 3: Post-1500CE Caloric Suitability Indices (CSI)
CSI measures can decrease, since the expansion of crops might allow the production of calories
in locations where it was previously not possible, thus, possibly decreasing the country-
level average. For similar reasons, the introduction of new crops has similar effects on the
Average CSI (all cells and crops). Additionally, introduction of new crops might lower the
average caloric output of each cell, thus possibly lowering the Average CSI (all cells and
only productive crops). Thus, care must be taken when using the Columbian Exchange in
research, since the question being analyzed may guide which measure better captures the
effect of the expansion of crops. For example, research focused on increases in productivity
generated by the Columbian Exchange may need to use the Maximum CSI (only productive
cells and crops) (Galor and Ozak, 2014) or constrain the analysis in some other way, like
focusing on cells only where new crops allow the production to be above the country-level
pre-1500CE average.
3.3 Agricultural Suitability data
Finally, Figure 5 shows the agricultural suitability data of Ramankutty et al. (2002), includ-
ing the climatic and soil components of their index. As can be seen there, the main index
9

(a) Average CSI (all cells andcrops)
(b) Average CSI (onlyproductive cells and crops)
(c) Average CSI (all cells andonly productive crops)
(d) Maximum CSI (all cellsand crops)
(e) Maximum (onlyproductive cells and crops)
(f) Maximum CSI (all cellsand only productive crops)
Figure 4: Country-Level Measures of pre- and post-1500CE Caloric Suitability Indices.
and the soil component have large subregional variations, while climatic component mostly
varies across larger regions.
4 Virtues of Caloric Suitability Index over Agricul-
tural Suitability
4.1 Finer Resolutions
The Ramankutty et al. (2002) data is constructed in grids of 0.5◦ × 0.5◦ with 360 rows and
720 columns, while the Galor and Ozak (2014) has a resolution of 5′× 5′ with 2160 rows and
4320 columns. So, each cell in the Ramankutty et al. (2002) data is equivalent to 36 cells
in the Galor and Ozak (2014) dataset. This means one can work at much smaller scales.
In particular, this increases the number of countries for which data can be generated (see
section 5). Additionally, less measurement error will be generated when extracting data for
countries or smaller regions.
10
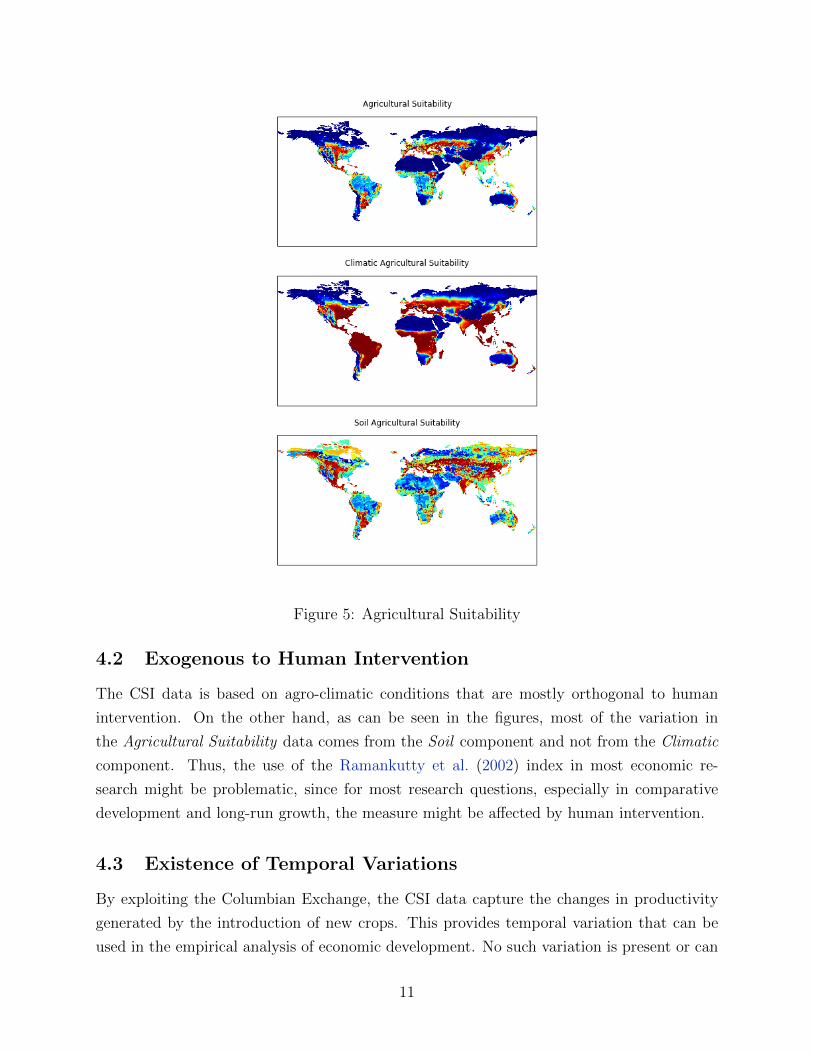
Figure 5: Agricultural Suitability
4.2 Exogenous to Human Intervention
The CSI data is based on agro-climatic conditions that are mostly orthogonal to human
intervention. On the other hand, as can be seen in the figures, most of the variation in
the Agricultural Suitability data comes from the Soil component and not from the Climatic
component. Thus, the use of the Ramankutty et al. (2002) index in most economic re-
search might be problematic, since for most research questions, especially in comparative
development and long-run growth, the measure might be affected by human intervention.
4.3 Existence of Temporal Variations
By exploiting the Columbian Exchange, the CSI data capture the changes in productivity
generated by the introduction of new crops. This provides temporal variation that can be
used in the empirical analysis of economic development. No such variation is present or can
11
be easily constructed for the agricultural suitability data of Ramankutty et al. (2002).
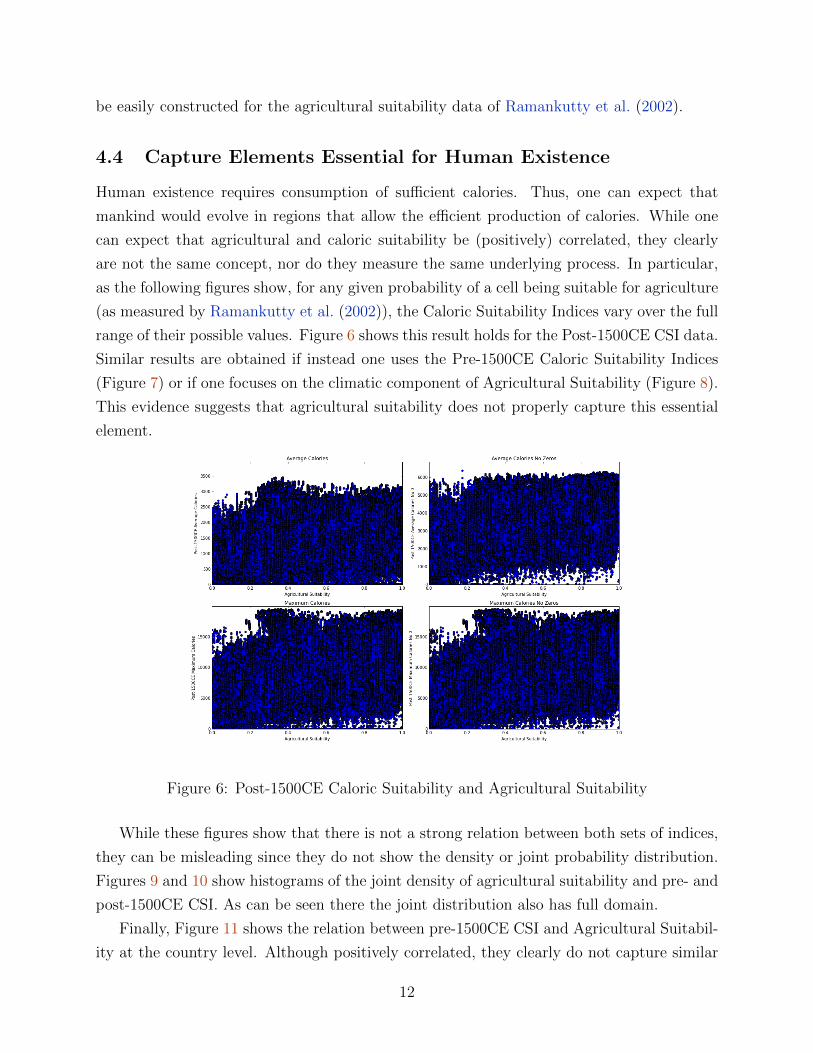
4.4 Capture Elements Essential for Human Existence
Human existence requires consumption of sufficient calories. Thus, one can expect that
mankind would evolve in regions that allow the efficient production of calories. While one
can expect that agricultural and caloric suitability be (positively) correlated, they clearly
are not the same concept, nor do they measure the same underlying process. In particular,
as the following figures show, for any given probability of a cell being suitable for agriculture
(as measured by Ramankutty et al. (2002)), the Caloric Suitability Indices vary over the full
range of their possible values. Figure 6 shows this result holds for the Post-1500CE CSI data.
Similar results are obtained if instead one uses the Pre-1500CE Caloric Suitability Indices
(Figure 7) or if one focuses on the climatic component of Agricultural Suitability (Figure 8).
This evidence suggests that agricultural suitability does not properly capture this essential
element.
Figure 6: Post-1500CE Caloric Suitability and Agricultural Suitability
While these figures show that there is not a strong relation between both sets of indices,
they can be misleading since they do not show the density or joint probability distribution.
Figures 9 and 10 show histograms of the joint density of agricultural suitability and pre- and
post-1500CE CSI. As can be seen there the joint distribution also has full domain.
Finally, Figure 11 shows the relation between pre-1500CE CSI and Agricultural Suitabil-
ity at the country level. Although positively correlated, they clearly do not capture similar
12
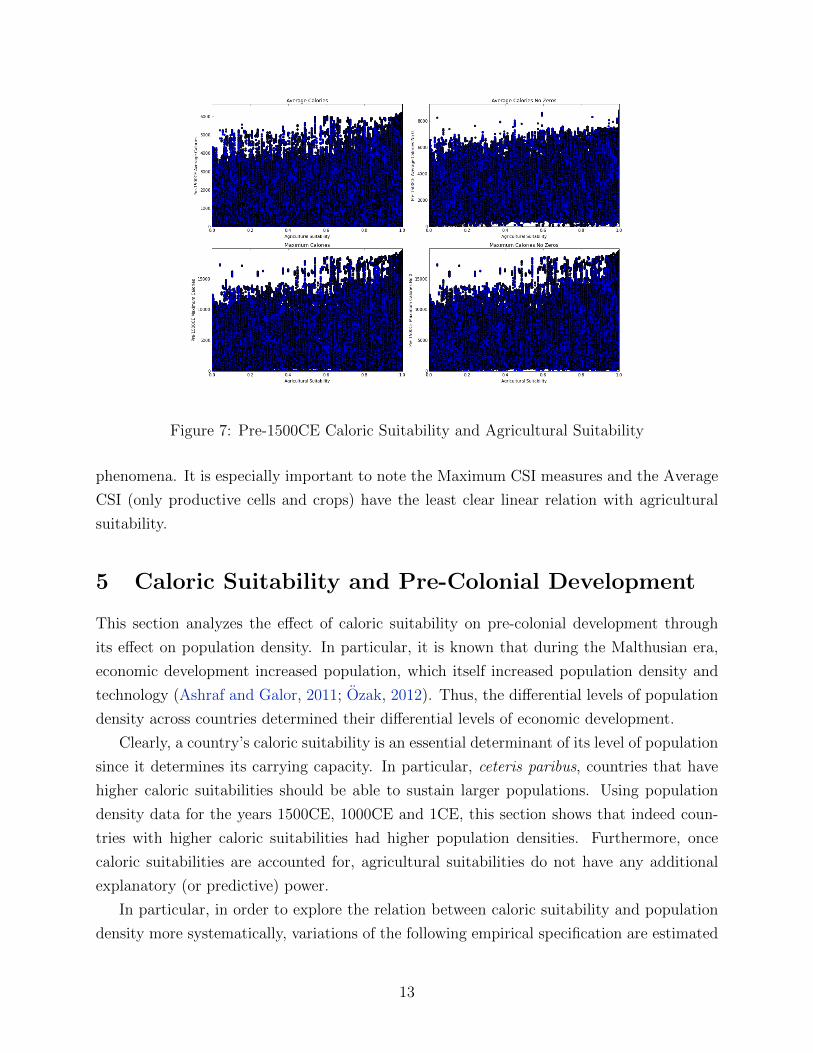
Figure 7: Pre-1500CE Caloric Suitability and Agricultural Suitability
phenomena. It is especially important to note the Maximum CSI measures and the Average
CSI (only productive cells and crops) have the least clear linear relation with agricultural
suitability.
5 Caloric Suitability and Pre-Colonial Development
This section analyzes the effect of caloric suitability on pre-colonial development through
its effect on population density. In particular, it is known that during the Malthusian era,
economic development increased population, which itself increased population density and
technology (Ashraf and Galor, 2011; Ozak, 2012). Thus, the differential levels of population
density across countries determined their differential levels of economic development.
Clearly, a country’s caloric suitability is an essential determinant of its level of population
since it determines its carrying capacity. In particular, ceteris paribus, countries that have
higher caloric suitabilities should be able to sustain larger populations. Using population
density data for the years 1500CE, 1000CE and 1CE, this section shows that indeed coun-
tries with higher caloric suitabilities had higher population densities. Furthermore, once
caloric suitabilities are accounted for, agricultural suitabilities do not have any additional
explanatory (or predictive) power.
In particular, in order to explore the relation between caloric suitability and population
density more systematically, variations of the following empirical specification are estimated
13

Figure 8: Pre-1500CE Caloric Suitability and Climatic Agricultural Suitability
via ordinary least squares (OLS):
ln(yit) = β0 + β1CSIipre1500 + β2ASIi +∑j
γ0jXij + γ1YSTi +∑c
γcδc + εit, (1)
where yit is the population density of country i in period t = 1, 1000, 1500; CSIipre1500 is
the country i’s level of pre-1500 CSI where the various measures are used in the analy-
sis; ASIi is a country’s agricultural suitability; Xij is a set of country level geographical
factors like absolute latitude, share of land within 100kms of sea, average elevation above
sea level, ruggedness, average yearly temperature, average yearly precipitation, dummies for
the country being landlocked or an island; YSTi are the number of years since the country
transitioned to agriculture; and δc is a complete set of continental fixed effects.
Tables 1-5 analyze the relation between population density in the year 1500CE and caloric
suitability as measured by all the versions of the CSI data. Tables 6-9 extend the analysis
to the years 1000CE and 1CE using only the Average CSI (only productive cells and crops)
and (all cells and only productive crops) measures.5 All tables have the same structure and
show standardized coefficients in order to facilitate comparison across years, measures and
specifications.
Table 1 shows the results when suing the pre-1500CE Average CSI (all cells and crops),
which penalizes average productivity by including non-productive crops and cells. Column
5Similar results are obtained if instead the Average CSI (all cells and crops) or the Maximum CSI wereemployed.
14

(a) (b)
(c) (d)
Figure 9: Joint distribution of agricultural suitability and post-1500CE caloric suitabilityindices.
(1) accounts for unobservable time invariant factors at the continent level, which might
affect population density and be correlated with CSI. The estimated standardized effect of
CSI on log population density in 1500CE is highly statistically and economically significant.
In particular, it implies that a 1-standard deviation (SD) increase in CSI generates a 0.5-
SD increase in log population density. Furthermore, the semi-partial R2 implies that after
controlling for the unobservable time invariant factors at the continent level the remaining
variation in CSI can explain 13% of the total variation in log population density in 1500CE.
15
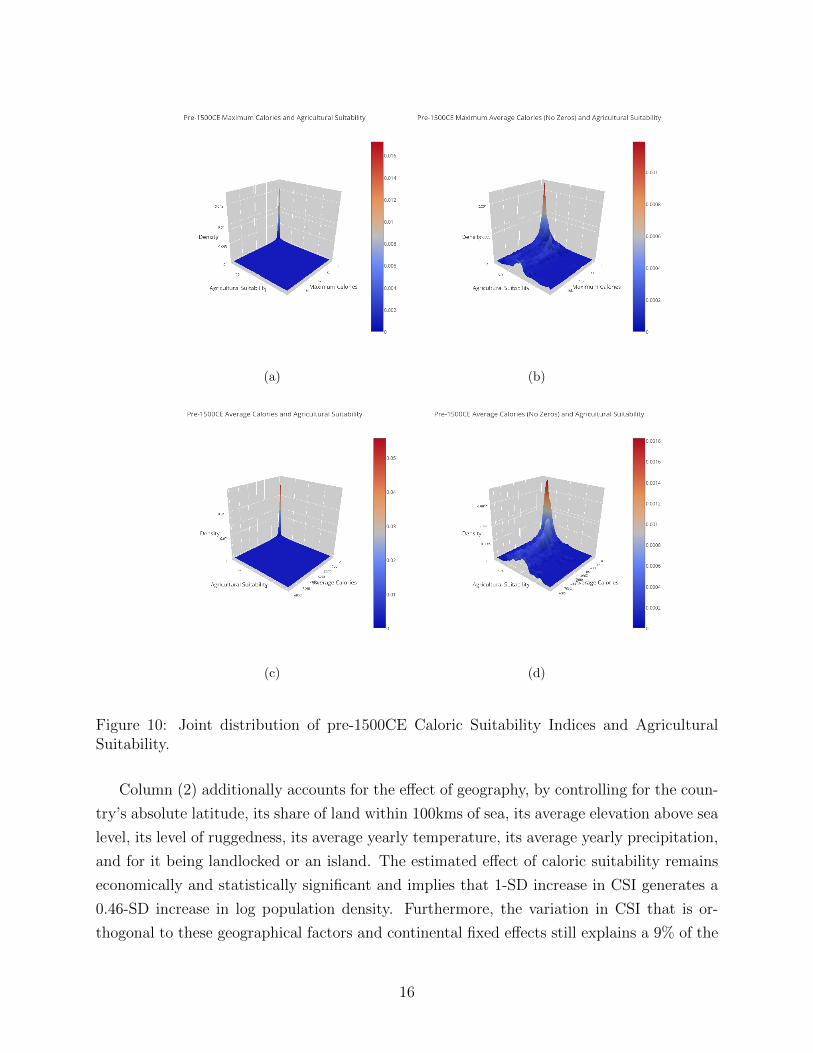
(a) (b)
(c) (d)
Figure 10: Joint distribution of pre-1500CE Caloric Suitability Indices and AgriculturalSuitability.
Column (2) additionally accounts for the effect of geography, by controlling for the coun-
try’s absolute latitude, its share of land within 100kms of sea, its average elevation above sea
level, its level of ruggedness, its average yearly temperature, its average yearly precipitation,
and for it being landlocked or an island. The estimated effect of caloric suitability remains
economically and statistically significant and implies that 1-SD increase in CSI generates a
0.46-SD increase in log population density. Furthermore, the variation in CSI that is or-
thogonal to these geographical factors and continental fixed effects still explains a 9% of the
16
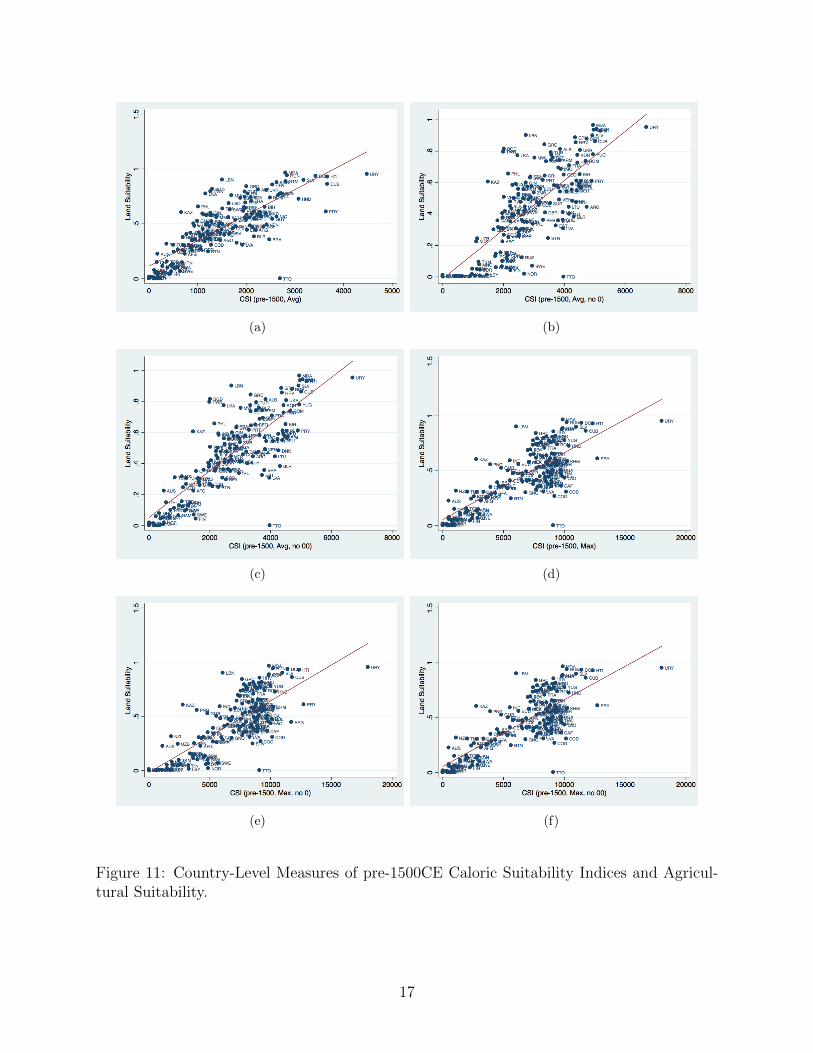
(a) (b)
(c) (d)
(e) (f)
Figure 11: Country-Level Measures of pre-1500CE Caloric Suitability Indices and Agricul-tural Suitability.
17

total variation in log population density.
Column (3) accounts for the number of years since transition to agriculture (YST), which
has been proposed as a major determinant of pre-colonial development (Diamond, 1997).
This decreases the sample size by 22 countries to 160. The standardized coefficient of the
Neolithic transition implies that increasing the number of years since the emergence of agri-
culture by 1-SD increases log population density by 0.5-SD. The coefficient on CSI decreases
to 0.38, but remains statistically significant at the 1% level. The semi-partial R2 of both
variables is 6%. Column (4) replicates the analysis of column (3) on the sample for which
agricultural suitability data is available. Notice that the sample size falls by another 9 coun-
tries due to missing data. Still, the coefficients on CSI and YST remain basically unchanged.
Columns (5)-(7) include the various versions of the agricultural suitability index into
the analysis. In the horse race between CSI and ASI, the estimated effect of CSI remains
economically and statistically significant, while the effect of ASI is always close to zero
and not statistically significant. Furthermore, as the semi-partial R2 shows, the ASI does
not have any explanatory power once CSI is included in the analysis. On the other hand,
although diminished, CSI retains its explanatory power even after controlling for agricultural
suitability.
Table 2 uses the Average pre-1500 CSI (only productive cells and crops) measure which
excludes non-productive cells and crops. As can be seen there, the estimated effect of CSI on
log population density in 1500CE is even larger than before. Furthermore, in all specifications
the variation that is specific to caloric suitability is higher than in the previous table. This
results is reassuring since the exclusion of non-productive crops and cells in the Average CSI
(only productive cells and crops) should better capture the possibilities for sustaining human
life. Inclusion of non-productive cells while excluding non-productive crops, Average CSI (all
cells and only productive crops), generates similar results as shown in table 3. Additionally,
as tables 4 and 5 show that the results also hold if one uses the Maximum CSI.
Finally, tables 6-9 show that these results also hold for the year 1000CE and 1 CE. The
estimates suggest that caloric suitability has played an important role in the determination
of the differential population densities across countries. Furthermore, the estimates suggest
that 1-SD increase in caloric suitability increased log population density between 0.3-0.5
standard deviations, which is a non-negligible effect.
6 Conclusion
This paper introduced novel indices of land productivity based on the Caloric Suitability In-
dex (CSI)Galor and Ozak (2014). It established that the CSI dominates the commonly used
18
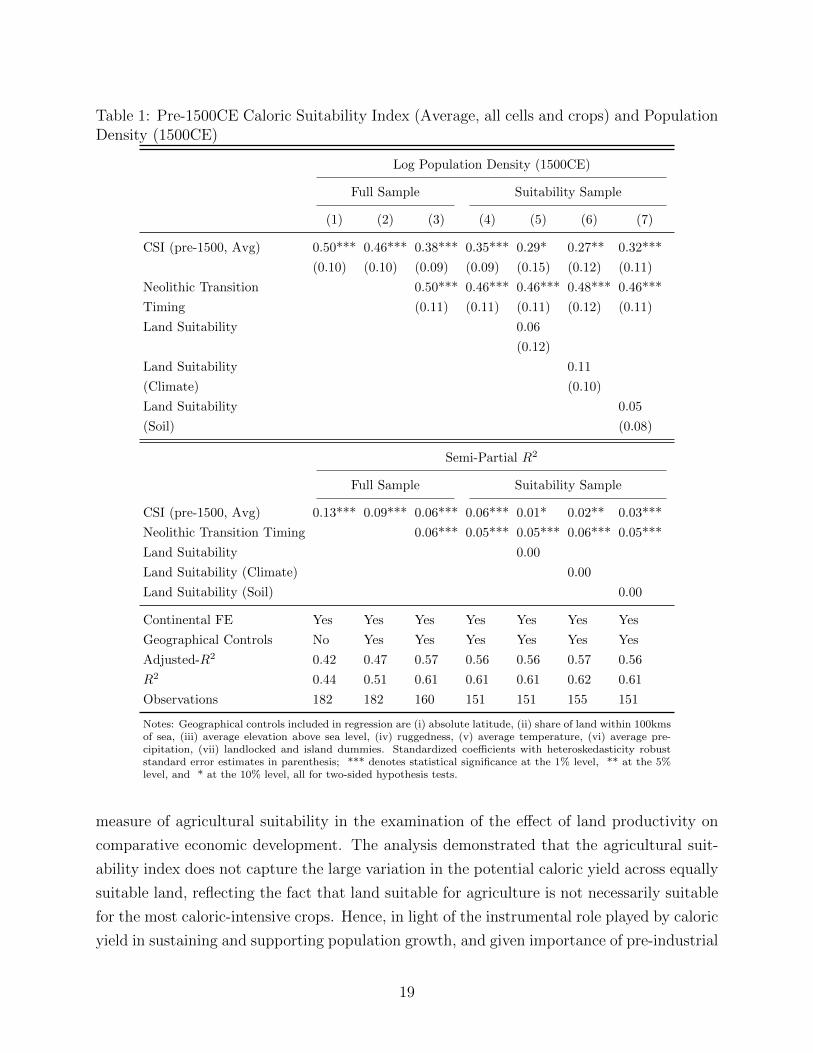
Table 1: Pre-1500CE Caloric Suitability Index (Average, all cells and crops) and PopulationDensity (1500CE)
Log Population Density (1500CE)
Full Sample Suitability Sample
(1) (2) (3) (4) (5) (6) (7)
CSI (pre-1500, Avg) 0.50*** 0.46*** 0.38*** 0.35*** 0.29* 0.27** 0.32***
(0.10) (0.10) (0.09) (0.09) (0.15) (0.12) (0.11)
Neolithic Transition 0.50*** 0.46*** 0.46*** 0.48*** 0.46***
Timing (0.11) (0.11) (0.11) (0.12) (0.11)
Land Suitability 0.06
(0.12)
Land Suitability 0.11
(Climate) (0.10)
Land Suitability 0.05
(Soil) (0.08)
Semi-Partial R2
Full Sample Suitability Sample
CSI (pre-1500, Avg) 0.13*** 0.09*** 0.06*** 0.06*** 0.01* 0.02** 0.03***
Neolithic Transition Timing 0.06*** 0.05*** 0.05*** 0.06*** 0.05***
Land Suitability 0.00
Land Suitability (Climate) 0.00
Land Suitability (Soil) 0.00
Continental FE Yes Yes Yes Yes Yes Yes Yes
Geographical Controls No Yes Yes Yes Yes Yes Yes
Adjusted-R2 0.42 0.47 0.57 0.56 0.56 0.57 0.56
R2 0.44 0.51 0.61 0.61 0.61 0.62 0.61
Observations 182 182 160 151 151 155 151
Notes: Geographical controls included in regression are (i) absolute latitude, (ii) share of land within 100kmsof sea, (iii) average elevation above sea level, (iv) ruggedness, (v) average temperature, (vi) average pre-cipitation, (vii) landlocked and island dummies. Standardized coefficients with heteroskedasticity robuststandard error estimates in parenthesis; *** denotes statistical significance at the 1% level, ** at the 5%level, and * at the 10% level, all for two-sided hypothesis tests.
measure of agricultural suitability in the examination of the effect of land productivity on
comparative economic development. The analysis demonstrated that the agricultural suit-
ability index does not capture the large variation in the potential caloric yield across equally
suitable land, reflecting the fact that land suitable for agriculture is not necessarily suitable
for the most caloric-intensive crops. Hence, in light of the instrumental role played by caloric
yield in sustaining and supporting population growth, and given importance of pre-industrial
19

Table 2: pre-1500CE Caloric Suitability Index (Average, only productive cells and crops)and Population Density (1500CE)
Log Population Density (1500CE)
Full Sample Suitability Sample
(1) (2) (3) (4) (5) (6) (7)
CSI (pre-1500, Avg) 0.51*** 0.54*** 0.46*** 0.46*** 0.48*** 0.41*** 0.45***
(0.10) (0.09) (0.09) (0.09) (0.11) (0.10) (0.10)
Neolithic Transition 0.50*** 0.46*** 0.46*** 0.47*** 0.46***
Timing (0.11) (0.10) (0.11) (0.11) (0.10)
Land Suitability -0.02
(0.09)
Land Suitability 0.06
(Climate) (0.08)
Land Suitability 0.01
(Soil) (0.08)
Semi-Partial R2
Full Sample Suitability Sample
CSI (pre-1500, Avg) 0.13*** 0.12*** 0.09*** 0.09*** 0.04*** 0.04*** 0.06***
Neolithic Transition Timing 0.06*** 0.05*** 0.05*** 0.05*** 0.05***
Land Suitability 0.00
Land Suitability (Climate) 0.00
Land Suitability (Soil) 0.00
Continental FE Yes Yes Yes Yes Yes Yes Yes
Geographical Controls No Yes Yes Yes Yes Yes Yes
Adjusted-R2 0.42 0.50 0.59 0.60 0.59 0.60 0.59
R2 0.44 0.54 0.63 0.64 0.64 0.64 0.64
Observations 182 182 160 151 151 155 151
Notes: Geographical controls included in regression are (i) absolute latitude, (ii) share of land within 100kmsof sea, (iii) average elevation above sea level, (iv) ruggedness, (v) average temperature, (vi) average pre-cipitation, (vii) landlocked and island dummies. Standardized coefficients with heteroskedasticity robuststandard error estimates in parenthesis; *** denotes statistical significance at the 1% level, ** at the 5%level, and * at the 10% level, all for two-sided hypothesis tests.
population density for the subsequent course of economic development, the Caloric Suitabil-
ity Index dominates the conventional measure in capturing the effect of land productivity
on pre-colonial population density and the subsequent course of economic development.
20
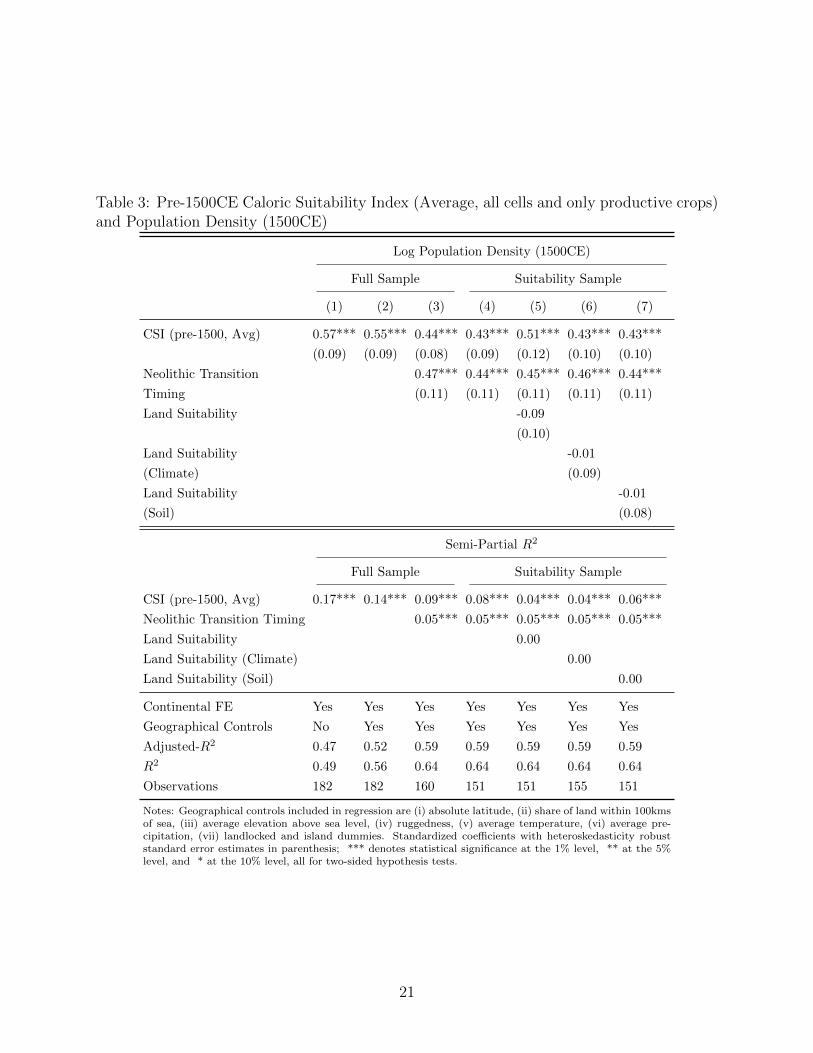
Table 3: Pre-1500CE Caloric Suitability Index (Average, all cells and only productive crops)and Population Density (1500CE)
Log Population Density (1500CE)
Full Sample Suitability Sample
(1) (2) (3) (4) (5) (6) (7)
CSI (pre-1500, Avg) 0.57*** 0.55*** 0.44*** 0.43*** 0.51*** 0.43*** 0.43***
(0.09) (0.09) (0.08) (0.09) (0.12) (0.10) (0.10)
Neolithic Transition 0.47*** 0.44*** 0.45*** 0.46*** 0.44***
Timing (0.11) (0.11) (0.11) (0.11) (0.11)
Land Suitability -0.09
(0.10)
Land Suitability -0.01
(Climate) (0.09)
Land Suitability -0.01
(Soil) (0.08)
Semi-Partial R2
Full Sample Suitability Sample
CSI (pre-1500, Avg) 0.17*** 0.14*** 0.09*** 0.08*** 0.04*** 0.04*** 0.06***
Neolithic Transition Timing 0.05*** 0.05*** 0.05*** 0.05*** 0.05***
Land Suitability 0.00
Land Suitability (Climate) 0.00
Land Suitability (Soil) 0.00
Continental FE Yes Yes Yes Yes Yes Yes Yes
Geographical Controls No Yes Yes Yes Yes Yes Yes
Adjusted-R2 0.47 0.52 0.59 0.59 0.59 0.59 0.59
R2 0.49 0.56 0.64 0.64 0.64 0.64 0.64
Observations 182 182 160 151 151 155 151
Notes: Geographical controls included in regression are (i) absolute latitude, (ii) share of land within 100kmsof sea, (iii) average elevation above sea level, (iv) ruggedness, (v) average temperature, (vi) average pre-cipitation, (vii) landlocked and island dummies. Standardized coefficients with heteroskedasticity robuststandard error estimates in parenthesis; *** denotes statistical significance at the 1% level, ** at the 5%level, and * at the 10% level, all for two-sided hypothesis tests.
21

Table 4: Pre-1500CE Caloric Suitability Index (Maximum, all cells and crops) and Popula-tion Density (1500CE)
Log Population Density (1500CE)
Full Sample Suitability Sample
(1) (2) (3) (4) (5) (6) (7)
CSI (pre-1500, Max) 0.47*** 0.44*** 0.34*** 0.32*** 0.22 0.23* 0.26**
(0.09) (0.09) (0.10) (0.10) (0.14) (0.14) (0.11)
Neolithic Transition 0.50*** 0.47*** 0.45*** 0.48*** 0.46***
Timing (0.11) (0.11) (0.12) (0.12) (0.11)
Land Suitability 0.12
(0.10)
Land Suitability 0.13
(Climate) (0.11)
Land Suitability 0.09
(Soil) (0.08)
Semi-Partial R2
Full Sample Suitability Sample
CSI (pre-1500, Max) 0.15*** 0.10*** 0.06*** 0.05*** 0.01 0.01* 0.02**
Neolithic Transition Timing 0.06*** 0.06*** 0.05*** 0.05*** 0.05***
Land Suitability 0.00
Land Suitability (Climate) 0.00
Land Suitability (Soil) 0.00
Continental FE Yes Yes Yes Yes Yes Yes Yes
Geographical Controls No Yes Yes Yes Yes Yes Yes
Adjusted-R2 0.44 0.48 0.56 0.55 0.56 0.56 0.56
R2 0.46 0.52 0.60 0.60 0.61 0.61 0.61
Observations 182 182 160 151 151 155 151
Notes: Geographical controls included in regression are (i) absolute latitude, (ii) share of land within 100kmsof sea, (iii) average elevation above sea level, (iv) ruggedness, (v) average temperature, (vi) average pre-cipitation, (vii) landlocked and island dummies. Standardized coefficients with heteroskedasticity robuststandard error estimates in parenthesis; *** denotes statistical significance at the 1% level, ** at the 5%level, and * at the 10% level, all for two-sided hypothesis tests.
22
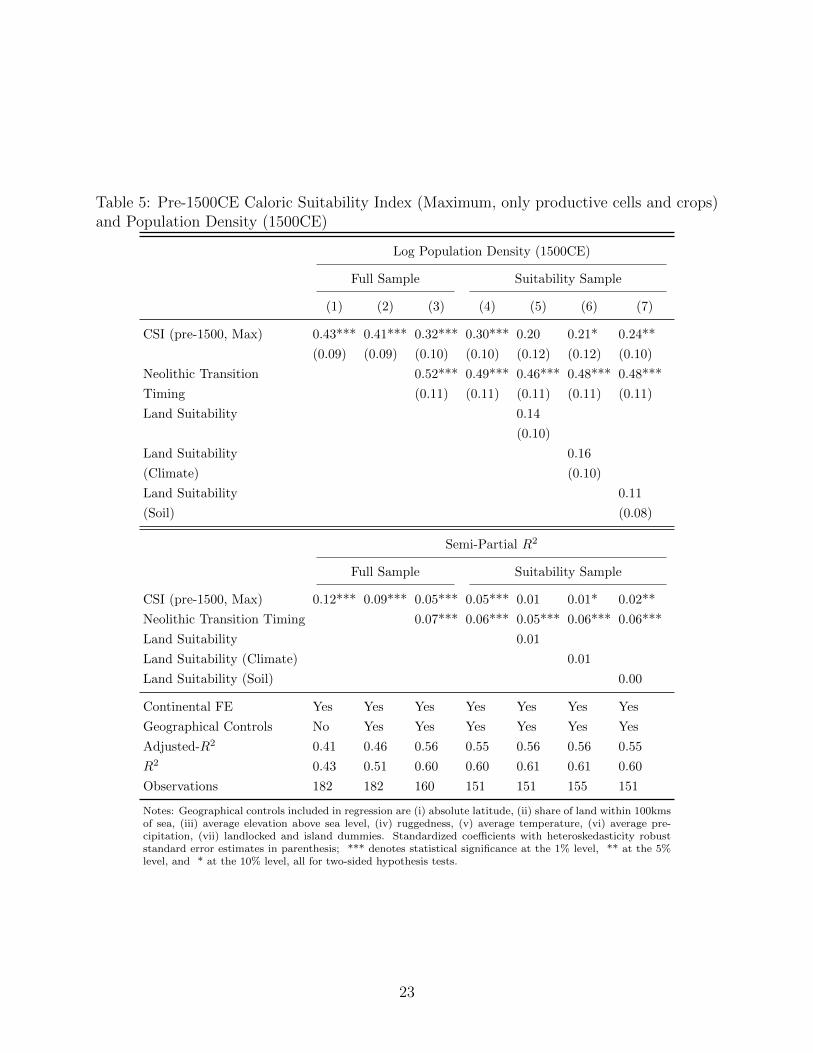
Table 5: Pre-1500CE Caloric Suitability Index (Maximum, only productive cells and crops)and Population Density (1500CE)
Log Population Density (1500CE)
Full Sample Suitability Sample
(1) (2) (3) (4) (5) (6) (7)
CSI (pre-1500, Max) 0.43*** 0.41*** 0.32*** 0.30*** 0.20 0.21* 0.24**
(0.09) (0.09) (0.10) (0.10) (0.12) (0.12) (0.10)
Neolithic Transition 0.52*** 0.49*** 0.46*** 0.48*** 0.48***
Timing (0.11) (0.11) (0.11) (0.11) (0.11)
Land Suitability 0.14
(0.10)
Land Suitability 0.16
(Climate) (0.10)
Land Suitability 0.11
(Soil) (0.08)
Semi-Partial R2
Full Sample Suitability Sample
CSI (pre-1500, Max) 0.12*** 0.09*** 0.05*** 0.05*** 0.01 0.01* 0.02**
Neolithic Transition Timing 0.07*** 0.06*** 0.05*** 0.06*** 0.06***
Land Suitability 0.01
Land Suitability (Climate) 0.01
Land Suitability (Soil) 0.00
Continental FE Yes Yes Yes Yes Yes Yes Yes
Geographical Controls No Yes Yes Yes Yes Yes Yes
Adjusted-R2 0.41 0.46 0.56 0.55 0.56 0.56 0.55
R2 0.43 0.51 0.60 0.60 0.61 0.61 0.60
Observations 182 182 160 151 151 155 151
Notes: Geographical controls included in regression are (i) absolute latitude, (ii) share of land within 100kmsof sea, (iii) average elevation above sea level, (iv) ruggedness, (v) average temperature, (vi) average pre-cipitation, (vii) landlocked and island dummies. Standardized coefficients with heteroskedasticity robuststandard error estimates in parenthesis; *** denotes statistical significance at the 1% level, ** at the 5%level, and * at the 10% level, all for two-sided hypothesis tests.
23

Table 6: Pre-1500CE Caloric Suitability Index (Average, only productive cells and crops)and Population Density (1000CE)
Log Population Density (1000CE)
Full Sample Suitability Sample
(1) (2) (3) (4) (5) (6) (7)
CSI (pre-1500, Avg) 0.50*** 0.52*** 0.44*** 0.43*** 0.42*** 0.40*** 0.40***
(0.09) (0.08) (0.08) (0.08) (0.11) (0.09) (0.10)
Neolithic Transition 0.54*** 0.50*** 0.50*** 0.52*** 0.50***
Timing (0.11) (0.11) (0.12) (0.12) (0.11)
Land Suitability 0.01
(0.09)
Land Suitability 0.03
(Climate) (0.08)
Land Suitability 0.04
(Soil) (0.08)
Semi-Partial R2
Full Sample Suitability Sample
CSI (pre-1500, Avg) 0.12*** 0.11*** 0.07*** 0.08*** 0.03*** 0.04*** 0.05***
Neolithic Transition Timing 0.07*** 0.06*** 0.06*** 0.07*** 0.06***
Land Suitability 0.00
Land Suitability (Climate) 0.00
Land Suitability (Soil) 0.00
Continental FE Yes Yes Yes Yes Yes Yes Yes
Geographical Controls No Yes Yes Yes Yes Yes Yes
Adjusted-R2 0.42 0.49 0.60 0.60 0.60 0.60 0.60
R2 0.44 0.53 0.64 0.64 0.64 0.65 0.64
Observations 175 175 154 146 146 149 146
Notes: Geographical controls included in regression are (i) absolute latitude, (ii) share of land within 100kmsof sea, (iii) average elevation above sea level, (iv) ruggedness, (v) average temperature, (vi) average pre-cipitation, (vii) landlocked and island dummies. Standardized coefficients with heteroskedasticity robuststandard error estimates in parenthesis; *** denotes statistical significance at the 1% level, ** at the 5%level, and * at the 10% level, all for two-sided hypothesis tests.
24

Table 7: Pre-1500CE Caloric Suitability Index (Average, all cells and only productive crops)and Population Density (1000CE)
Log Population Density (1000CE)
Full Sample Suitability Sample
(1) (2) (3) (4) (5) (6) (7)
CSI (pre-1500, Avg) 0.55*** 0.53*** 0.42*** 0.40*** 0.45*** 0.43*** 0.39***
(0.08) (0.08) (0.07) (0.07) (0.11) (0.09) (0.09)
Neolithic Transition 0.52*** 0.48*** 0.48*** 0.51*** 0.48***
Timing (0.12) (0.12) (0.12) (0.12) (0.12)
Land Suitability -0.05
(0.10)
Land Suitability -0.05
(Climate) (0.09)
Land Suitability 0.02
(Soil) (0.08)
Semi-Partial R2
Full Sample Suitability Sample
CSI (pre-1500, Avg) 0.16*** 0.12*** 0.08*** 0.08*** 0.04*** 0.04*** 0.05***
Neolithic Transition Timing 0.07*** 0.06*** 0.06*** 0.06*** 0.06***
Land Suitability 0.00
Land Suitability (Climate) 0.00
Land Suitability (Soil) 0.00
Continental FE Yes Yes Yes Yes Yes Yes Yes
Geographical Controls No Yes Yes Yes Yes Yes Yes
Continental FE Yes Yes Yes Yes Yes Yes Yes
Geographical Controls No Yes Yes Yes Yes Yes Yes
Adjusted-R2 0.47 0.51 0.60 0.60 0.60 0.60 0.59
R2 0.49 0.55 0.64 0.64 0.64 0.65 0.64
Observations 175 175 154 146 146 149 146
Notes: Geographical controls included in regression are (i) absolute latitude, (ii) share of land within 100kmsof sea, (iii) average elevation above sea level, (iv) ruggedness, (v) average temperature, (vi) average pre-cipitation, (vii) landlocked and island dummies. Standardized coefficients with heteroskedasticity robuststandard error estimates in parenthesis; *** denotes statistical significance at the 1% level, ** at the 5%level, and * at the 10% level, all for two-sided hypothesis tests.
25

Table 8: Pre-1500CE Caloric Suitability Index (Average, only productive cells and crops)and Population Density (1CE)
Log Population Density (1CE)
Full Sample Suitability Sample
(1) (2) (3) (4) (5) (6) (7)
CSI (pre-1500, Avg) 0.40*** 0.38*** 0.32*** 0.31*** 0.32*** 0.31*** 0.26***
(0.09) (0.09) (0.08) (0.08) (0.09) (0.08) (0.08)
Neolithic Transition 0.63*** 0.62*** 0.62*** 0.63*** 0.61***
Timing (0.11) (0.10) (0.11) (0.11) (0.10)
Land Suitability -0.01
(0.08)
Land Suitability 0.01
(Climate) (0.07)
Land Suitability 0.08
(Soil) (0.08)
Semi-Partial R2
Full Sample Suitability Sample
CSI (pre-1500, Avg) 0.08*** 0.05*** 0.04*** 0.04*** 0.02*** 0.02*** 0.02***
Neolithic Transition Timing 0.10*** 0.11*** 0.10*** 0.10*** 0.10***
Land Suitability 0.00
Land Suitability (Climate) 0.00
Land Suitability (Soil) 0.00
Continental FE Yes Yes Yes Yes Yes Yes Yes
Geographical Controls No Yes Yes Yes Yes Yes Yes
Adjusted-R2 0.48 0.52 0.69 0.69 0.69 0.69 0.69
R2 0.50 0.57 0.73 0.73 0.73 0.73 0.73
Observations 154 154 136 131 131 133 131
Notes: Geographical controls included in regression are (i) absolute latitude, (ii) share of land within 100kmsof sea, (iii) average elevation above sea level, (iv) ruggedness, (v) average temperature, (vi) average pre-cipitation, (vii) landlocked and island dummies. Standardized coefficients with heteroskedasticity robuststandard error estimates in parenthesis; *** denotes statistical significance at the 1% level, ** at the 5%level, and * at the 10% level, all for two-sided hypothesis tests.
26

Table 9: Pre-1500CE Caloric Suitability Index (Average, all cells and only productive crops)and Population Density (1CE)
Log Population Density (1CE)
Full Sample Suitability Sample
(1) (2) (3) (4) (5) (6) (7)
CSI (pre-1500, Avg) 0.44*** 0.38*** 0.27*** 0.26*** 0.27*** 0.27*** 0.19**
(0.08) (0.09) (0.08) (0.07) (0.10) (0.08) (0.09)
Neolithic Transition 0.61*** 0.60*** 0.60*** 0.61*** 0.59***
Timing (0.11) (0.11) (0.11) (0.11) (0.11)
Land Suitability -0.01
(0.09)
Land Suitability -0.01
(Climate) (0.07)
Land Suitability 0.10
(Soil) (0.08)
Semi-Partial R2
Full Sample Suitability Sample
CSI (pre-1500, Avg) 0.10*** 0.06*** 0.03*** 0.03*** 0.01*** 0.02*** 0.01**
Neolithic Transition Timing 0.10*** 0.10*** 0.10*** 0.10*** 0.10***
Land Suitability 0.00
Land Suitability (Climate) 0.00
Land Suitability (Soil) 0.00
Continental FE Yes Yes Yes Yes Yes Yes Yes
Geographical Controls No Yes Yes Yes Yes Yes Yes
Continental FE Yes Yes Yes Yes Yes Yes Yes
Geographical Controls No Yes Yes Yes Yes Yes Yes
Adjusted-R2 0.51 0.53 0.68 0.68 0.68 0.68 0.68
R2 0.53 0.58 0.72 0.72 0.72 0.72 0.72
Observations 154 154 136 131 131 133 131
Notes: Geographical controls included in regression are (i) absolute latitude, (ii) share of land within 100kmsof sea, (iii) average elevation above sea level, (iv) ruggedness, (v) average temperature, (vi) average pre-cipitation, (vii) landlocked and island dummies. Standardized coefficients with heteroskedasticity robuststandard error estimates in parenthesis; *** denotes statistical significance at the 1% level, ** at the 5%level, and * at the 10% level, all for two-sided hypothesis tests.
27
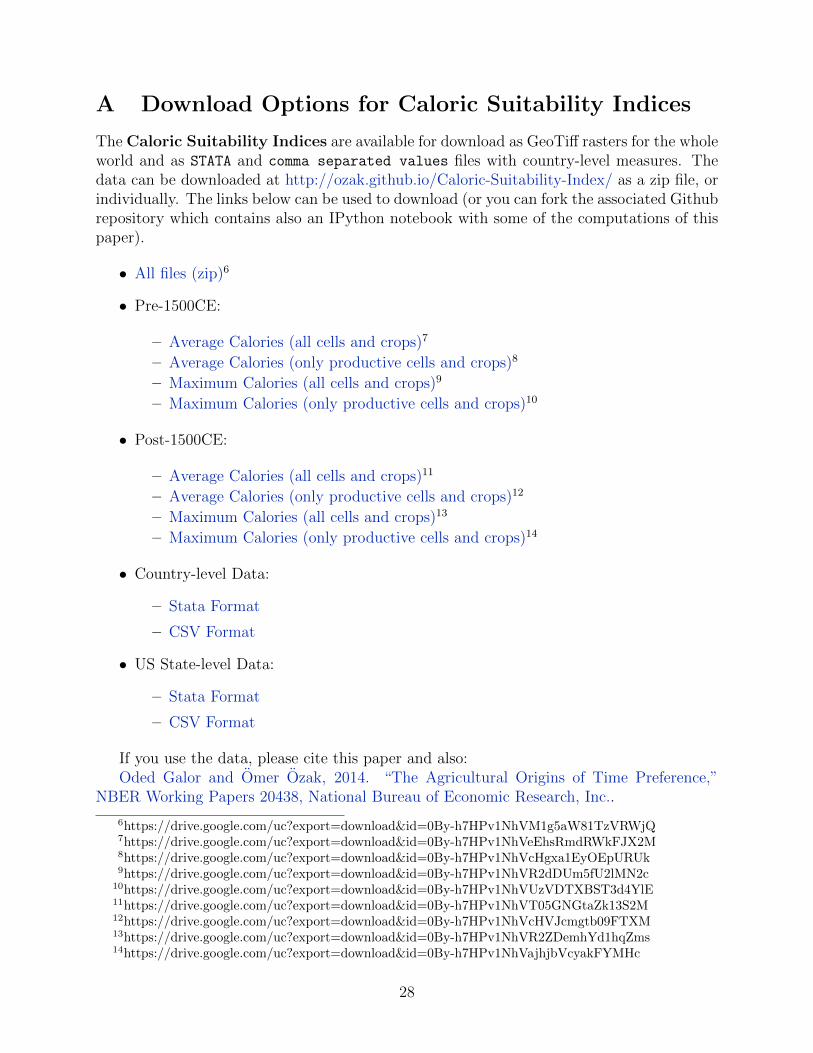
A Download Options for Caloric Suitability Indices
The Caloric Suitability Indices are available for download as GeoTiff rasters for the wholeworld and as STATA and comma separated values files with country-level measures. Thedata can be downloaded at http://ozak.github.io/Caloric-Suitability-Index/ as a zip file, orindividually. The links below can be used to download (or you can fork the associated Githubrepository which contains also an IPython notebook with some of the computations of thispaper).
• All files (zip)6
• Pre-1500CE:
– Average Calories (all cells and crops)7
– Average Calories (only productive cells and crops)8
– Maximum Calories (all cells and crops)9
– Maximum Calories (only productive cells and crops)10
• Post-1500CE:
– Average Calories (all cells and crops)11
– Average Calories (only productive cells and crops)12
– Maximum Calories (all cells and crops)13
– Maximum Calories (only productive cells and crops)14
• Country-level Data:
– Stata Format
– CSV Format
• US State-level Data:
– Stata Format
– CSV Format
If you use the data, please cite this paper and also:Oded Galor and Omer Ozak, 2014. “The Agricultural Origins of Time Preference,”
NBER Working Papers 20438, National Bureau of Economic Research, Inc..
6https://drive.google.com/uc?export=download&id=0By-h7HPv1NhVM1g5aW81TzVRWjQ7https://drive.google.com/uc?export=download&id=0By-h7HPv1NhVeEhsRmdRWkFJX2M8https://drive.google.com/uc?export=download&id=0By-h7HPv1NhVcHgxa1EyOEpURUk9https://drive.google.com/uc?export=download&id=0By-h7HPv1NhVR2dDUm5fU2lMN2c
10https://drive.google.com/uc?export=download&id=0By-h7HPv1NhVUzVDTXBST3d4YlE11https://drive.google.com/uc?export=download&id=0By-h7HPv1NhVT05GNGtaZk13S2M12https://drive.google.com/uc?export=download&id=0By-h7HPv1NhVcHVJcmgtb09FTXM13https://drive.google.com/uc?export=download&id=0By-h7HPv1NhVR2ZDemhYd1hqZms14https://drive.google.com/uc?export=download&id=0By-h7HPv1NhVajhjbVcyakFYMHc
28

B Additional Material
Table 10: Continental Distribution of 48 crops (and their variants) pre-1500CE
Crop Continent Crop Continent
Alfalfa Asia, Europe Palm Heart North Africa, SubsaharaBanana Asia, Oceania, North Africa Pearl Millet Asia, North Africa, Subsa-
haraBarley Asia, Europe, North Africa Phaseolus Bean AmericaBuckwheat Asia Pigeon Pea Asia, SubsaharaCabbage Europe Rye EuropeCacao America Sorghum North Africa, SubsaharaCarrot Asia, Europe Soybean AsiaCassava America Sunflower AmericaChick Pea Europe Sweet Potato AmericaCitrus Asia, Europe Tea AsiaCoconut America, Oceania Tomato AmericaCoffee North Africa Wetland Rice Asia, SubsaharaCotton America, Asia, Europe,
North Africa, SubsaharaWheat Asia, Europe, North Africa
Cowpea Asia, North Africa, Subsa-hara
Wheat Hard RedSpring
Asia, Europe, North Africa
Dry Pea Europe, North Africa Wheat Hard RedWinter
Asia, Europe, North Africa
Flax Asia, Europe, North Africa Wheat Hard White Asia, Europe, North AfricaFoxtail Millet Asia, Europe, North Africa Wheat Soft Red Win-
terAsia, Europe, North Africa
Greengram Asia, Subsahara Wheat Soft White Asia, Europe, North AfricaGroundnuts America White Potato AmericaIndigo Rice Asia, Subsahara Yams Asia, SubsaharaMaize America Giant Yams Asia, SubsaharaOat Europe, North Africa Sorghum (Subtropi-
cal)North Africa, Subsahara
Oilpalm North Africa, Subsahara Sorghum (TropicalHighland)
North Africa, Subsahara
Olive Europe, North Africa Sorghum (TropicalLowland)
North Africa, Subsahara
Onion America, Asia, Europe,North Africa, Subsahara,Oceania
White Yams North Africa, Subsahara
Notes: Taken from various sources, including Crosby (1972) and Diamond (1997).
29

References
Ashraf, Q. and Galor, O. (2011). Dynamics and stagnation in the malthusian epoch, TheAmerican Economic Review 101(5): 2003–2041.
Crosby, A. W. (1972). The Columbian exchange: biological and cultural consequences of1492, Contributions in American studies, no. 2, Greenwood Pub. Co, Westport, Conn.
Diamond, J. M. (1997). Guns, germs, and steel: the fates of human societies, 1st ed edn,W.W. Norton & Co., New York.
Galor, O. and Ozak, O. (2014). The agricultural origins of time preference, NBER WorkingPaper (20438).
Ozak, O. (2012). Distance to the technological frontier and economic development, SouthernMethodist University Working Paper Series .
Ramankutty, N., Foley, J. A., Norman, J. and McSweeney, K. (2002). The global distributionof cultivable lands: current patterns and sensitivity to possible climate change, GlobalEcology and Biogeography 11(5): 377–392.
30


