
Journal ofMaterials Chemistry A
PAPER
Publ
ishe
d on
03
July
201
7. D
ownl
oade
d by
NA
NJI
NG
UN
IVE
RSI
TY
on
28/0
9/20
17 0
8:21
:07.
View Article OnlineView Journal | View Issue
Luminescent Cd(
aCoordination Chemistry Institute, State Ke
School of Chemistry and Chemical Engin
Microstructures, Collaborative Innovation
Nanjing University, Nanjing 210023, Chin
edu.cn; Tel: +86 25 89683485bDepartment of Chemistry, College of Scienc
Riyadh 11451, Kingdom of Saudi Arabia
† Electronic supplementary informationdata in CIF format, IR spectra, structuralof antibiotics. CCDC 1547776–1547780. For other electronic format see DOI: 10.103
Cite this: J. Mater. Chem. A, 2017, 5,15797
Received 4th May 2017Accepted 3rd July 2017
DOI: 10.1039/c7ta03849f
rsc.li/materials-a
This journal is © The Royal Society of C
II)–organic frameworks withchelating NH2 sites for selective detection of Fe(III)and antibiotics†
Dan Zhao,a Xiao-Hui Liu,a Yue Zhao,a Peng Wang,a Yi Liu,a Mohammad Azam,b
Saud I. Al-Resayes,b Yi Lu*a and Wei-Yin Sun *a
Excess and deficiency of iron(III) and antibiotics from normal permissible limits will induce serious disorders,
so their detection is important but challenging. In this work, by introducing a new amino triazole ligand N1-
(4-(1H-1,2,4-triazole-1-yl)benzyl)-N1-(2-aminoethyl)ethane-1,2-diamine (L), a series of Cd(II)-basedmetal–
organic frameworks (MOFs) [Cd3(BDC)3(DMF)2] (1), [Cd(L)(BDC)]2$2DMF$H2O (2), [NaCd2(L)(BDC)2.5]$9H2O
(3), [Cd2(L)(2,6-NDC)2]$DMF$5H2O (4) and [Cd2(L)(BPDC)2]$DMF$9H2O (5) were synthesized. MOFs 1, 2 and
3 obtained under the same conditions with the same auxiliary ligand (H2BDC) but different amounts of alkali
(NaOH) show distinct 3D, 1D and 3D framework structures, respectively, in which L and BDC2� exhibit varied
coordination modes. 4 and 5 with 3D structures were isolated by using longer auxiliary ligands of 2,6-
H2NDC and H2BPDC. The porosity and excellent fluorescence performance of 3, 4 and 5 make them
potential luminescent sensors for Fe(III) and antibiotics. The results show that 3, 4 and 5 represent high
sensitivity for the detection of Fe(III) ions with detection limits of 155 ppb for 3, 209 ppb for 4 and 297
ppb for 5 due to the existence of open channels and chelating NH2 sites. In addition, the strong
emissions of 3, 4 and 5 can be quenched efficiently by trace amounts of NFs (nitrofurazone, NZF;
nitrofurantoin, NFT; furazolidone, FZD) antibiotics even in the presence of other competing antibiotics
such as b-lactams (penicillin, PCL). They are responsive to NZF with detection limits of 162 ppb for 3, 75
ppb for 4 and 60 ppb for 5.
1. Introduction
Iron, one of the most important and indispensable elements inmetabolic processes, is extensively distributed in environmentaland biological systems.1 Both shortage and surplus of iron mayresult in disorders such as skin diseases, iron deciency anemia(IDA), agrypnia and decreased immunity.2 In this regard,selective and sensitive detection of trace amounts of iron ionshas practical signicance.3–9 Similarly, antibiotics, as a treat-ment of bacterial infections, are widely used in aquaculturesand the abuse of them has led to high levels of antibiotic resi-dues.10 Antibiotics have been recognized as a class of seriousorganic pollutants because of their high toxicity and difficulty in
y Laboratory of Coordination Chemistry,
eering, Nanjing National Laboratory of
Center of Advanced Microstructures,
a. E-mail: [email protected]; sunwy@nju.
e, King Saud University, P. O. Box 2455,
(ESI) available: X-ray crystallographicillustrations, TG and PXRD, detectionor ESI and crystallographic data in CIF9/c7ta03849f
hemistry 2017
degradation by nature.11 Thus, monitoring and removing suchspecic pollutants are important, but challenging.12
Very recently, luminescent metal–organic frameworks(MOFs) are of bright promise as a new type of sensing materialbecause of their prominent optical properties, permanentporosity, tunable structure and relatively long emission wave-length.13–15 To date, chemists have synthesized various lumi-nescent MOF-based probes for application in the detection ofmetal ions, explosives, small molecules, etc.16–24 To obtain aneffective MOF sensor, a binding site, powerful luminophore andstable architecture are required. An effective strategy tosynthesize luminescent MOF-based probes is to use chelatingagents (receptor units) to produce a distinct uorescence uponchelation by interacting with the target metal ion (analyte)selectively and efficiently.25,26 Once the analyte is recognized bythe receptor, the uorescence signals can be observed in theform of quenching or enhancement in the uorescence due toeither electron transfer (eT), charge transfer (CT), or energytransfer (ET) processes.27 To date, chelating agents with func-tional groups, such as pyridyl, amide and hydroxyl groups, havebeen immobilized in luminescent MOFs.28–32 Particularly, theNH2 group in organic luminescent materials can be regarded asan electron-donating group suitable for binding the electron-accepting metal ions.
J. Mater. Chem. A, 2017, 5, 15797–15807 | 15797

Scheme 1 Structures of ligands L, H2BDC, 2,6-H2NDC and H2BPDC.
Journal of Materials Chemistry A Paper
Publ
ishe
d on
03
July
201
7. D
ownl
oade
d by
NA
NJI
NG
UN
IVE
RSI
TY
on
28/0
9/20
17 0
8:21
:07.
View Article Online
Based on the consideration mentioned above, we prepareda new amino triazole ligand N1-(4-(1H-1,2,4-triazole-1-yl)benzyl)-N1-(2-aminoethyl)ethane-1,2-diamine (L) (Scheme 1) andemployed it to react with Cd(II) salt to construct crystalline solidluminescent materials. As a result, a series of Cd-based MOFsdecorated with chelating NH2 sites were successfully achievedunder solvothermal conditions: [Cd3(BDC)3(DMF)2] (1),[Cd(L)(BDC)]2$2DMF$H2O (2), [Cd2Na(L)(BDC)2.5]$9H2O (3),[Cd2(L)(2,6-NDC)2]$DMF$5H2O (4) and [Cd2(L)(BPDC)2]$DMF$9H2O (5). The results revealed that the dosage of NaOHcan affect the coordination modes of L and dicarboxylateligands to control the eventual structures of 1, 2 and 3. MOFs 3,4 and 5 are three-dimensional (3D) frameworks and isolated byusing different lengths of dicarboxylate auxiliary ligands(Scheme 1). The porosity and the uorescence performance of 3,4 and 5make them potential uorescent materials for detectingFe(III) ions and antibiotics. The low detection limits for Fe(III)ions (155 ppb for 3, 209 ppb for 4 and 297 ppb for 5) andnitrofurazone (NZF) (162 ppb for 3, 75 ppb for 4 and 60 ppb for5) illustrate that 3, 4 and 5 show a fast response and highsensitivity for trace amounts of Fe(III) and antibiotics. To ourknowledge, this is the rst example for probing antibioticsusing Cd(II) luminescent MOFs.
2. Experimental2.1 General information
All chemicals and solvents were of reagent grade, obtained fromcommercial sources without further purication. Antibiotics werepurchased from Aladdin Industrial Corporation. Elementalanalyses (EA) of C, H, and N were performed on a Perkin-Elmer240C Elemental analyzer at the analysis center of NanjingUniversity. FT-IR spectra were recorded using KBr discs in therange of 400–4000 cm�1 on a Bruker Vector 22 FT-IR spectro-photometer. Thermogravimetric analyses (TGA) were carried outon a Mettler-Toledo (TGA/DSC1) thermal analyzer under nitrogenwith a heating rate of 10 �C min�1. Powder X-ray diffraction(PXRD) data were collected on a Bruker D8 Advance X-raydiffractometer with Cu Ka (l ¼ 1.5418 A) radiation. The lumi-nescence spectra of the powdered solid state samples wererecorded on an Aminco Bowman Series 2 spectrouorometer witha xenon arc lamp as the light source. In the measurements ofemission and excitation spectra the pass width is 10 nm, and allthe measurements were carried out under the same experimental
15798 | J. Mater. Chem. A, 2017, 5, 15797–15807
conditions. Quantum yields and luminescence lifetimes wereobtained on a FluoroLog UltraFast spectrouorometer analyzerwith an integrating sphere. UV/vis absorption spectra weremeasured at room temperature on a UV3600 spectrophotometer.
2.2 Preparation of complexes 1–5
[Cd3(BDC)3(DMF)2] (1). A mixture of L (9.37 mg, 0.036mmol), H2BDC (5.98 mg, 0.036 mmol), Cd(ClO4)2$6H2O(25.16 mg, 0.06 mmol), and NaOH (0.58 mg, 0.014 mmol) inDMF/methanol/H2O mixed solvent (4.5 mL, v/v/v: 3/1/0.5) wassealed in a 20 mL glass vial and heated at 90 �C for 72 h. Aerbeing cooled to room temperature, yellow block crystals of 1were obtained in 40% yield. Elemental analysis calcd (%) forC30H26N2O14Cd3: C 36.93, H 2.69, N 2.87; found: C 36.52, H 2.68,N 2.85.
[Cd(L)(BDC)]2$2DMF$H2O (2). Complex 2 was prepared bythe same procedure used for the preparation of 1, except thatthe amount of NaOH was changed to 1.15 mg (0.029 mmol).Colorless crystals of 2 were obtained in 52% yield. Elementalanalysis calcd (%) for C48H64N14O11Cd2: C 46.57, H 5.21, N15.84; found: C 46.52, H 5.28, N 15.85. IR (KBr pellet, cm�1,Fig. S1 in the ESI†): 3405 (w), 3251 (w), 1662 (m), 1567 (s), 1523(m), 1397 (s), 1280 (m), 1149 (w), 1052 (w), 982 (w), 945 (w), 890(m), 854 (w), 826 (m), 746 (s), 673 (w), 661 (w), 508 (s).
[Cd2Na(L)(BDC)2.5]$9H2O (3). Complex 3 was also achievedby the same procedure used for the synthesis of 1, except thatNaOH (2.88 mg, 0.072 mmol) was used. Light yellow blockcrystals of 3 were obtained in 55% yield. Elemental analysiscalcd (%) for C33H48N6O19NaCd2: C 36.68, H 4.48, N 7.78; found:C 36.72, H 4.45, N 7.75. IR (KBr pellet, cm�1, Fig. S1 in the ESI†):3423 (w), 3269 (w), 1666 (m), 1566 (s), 1528 (w), 1504 (w), 1393(s), 1313 (w), 1286 (w), 1223 (w), 1150 (w), 1094 (m), 1051 (w),1015 (m), 978 (m), 945 (w), 889 (m), 843 (s), 826 (w), 747 (s), 675(w), 662 (w), 520 (s).
[Cd2(L)(2,6-NDC)2]$DMF$5H2O (4). 4 was isolated by thesame procedure used for 3, except that 2,6-H2NDC (7.78 mg,0.036 mmol) was used instead of H2BDC. Aer being cooled toroom temperature, colorless crystals of 4 were obtained in 47%yield. Anal. calcd for C40H49N7O14Cd2: C 44.62, H 4.59, N 9.11;found: C 44.65, H 4.58, N 9.15. IR (KBr pellet, cm�1, Fig. S1 in theESI†): 3406 (w), 3145 (w), 1668 (w), 1608 (m), 1567 (m), 1494 (w),1402 (s), 1358 (w), 1277 (w), 1190 (w), 1139 (w), 1096 (w), 1049 (w),976 (w), 929 (w), 887 (w), 852 (w), 791 (s), 673 (w), 447 (w).
[Cd2(L)(BPDC)2]$DMF$9H2O (5). 5 was also obtained by thesame procedure used for 3, except that H2BPDC (8.72 mg, 0.036mmol) was employed instead of H2BDC. Aer being cooled toroom temperature, colorless block crystals of 5 were obtained in53% yield. Anal. calcd for C44H61N7O18Cd2: C 44.01, H 5.12, N8.17; found: C 44.05, H 5.18, N 8.15. IR (KBr pellet, cm�1, Fig. S1in the ESI†): 3263 (w), 3132 (w), 1664 (m), 1582 (s), 1527 (s), 1396(s), 1280 (w), 1177 (w), 1145 (w), 1052 (w), 1006 (w), 978 (w), 854(s), 774 (s), 679 (m).
2.3 Fluorescence study
In a typical experimental setup, 2 mg of 3, 4 or 5 was weighedand added to a cuvette containing 2.5 mL of DMF, and then
This journal is © The Royal Society of Chemistry 2017

Table 1 Crystallographic data and structural refinements for 1–5
Complex 1 2 3 4 5Chemical formula C30H26N2O14Cd3 C48H64N14O11Cd2 C33H30N6O10NaCd2 C37H32N6O8Cd2 C41H36N6O8Cd2Formula weight 975.73 1237.93 918.42 913.48 965.56Temperature (K) 293(2) 293(2) 293(2) 293(2) 293(2)Crystal system Monoclinic Triclinic Triclinic Triclinic MonoclinicSpace group C2/c P�1 P�1 P�1 C2/ca/A 25.338(6) 10.7640(15) 9.8070(14) 10.9405(12) 24.068(3)b/A 9.524(2) 10.8279(15) 13.1382(19) 12.6609(13) 10.0444(13)c/A 18.120(4) 14.278(2) 18.607(3) 17.2175(18) 43.667(5)a/� 90 69.098(2) 89.278(2) 91.149(3) 90b/� 129.684(3) 85.433(3) 76.577(2) 96.514(3) 92.677(2)g/� 90 64.744(2) 70.256(2) 112.944(3) 90Volume/A3 3365.1(13) 1400.8(3) 2189.2(6) 2176.7(4) 10 545(2)Z 4 1 2 2 8Dc/g cm�3 1.926 1.467 1.393 1.394 1.216m/mm�1 1.949 0.827 1.034 1.028 0.852F(000) 1904 634 914 912 3872Reections collected 14 325 9594 14 589 18 248 34 655Unique reections 3750 6369 9891 10 079 11 990Parameters 252 345 470 478 524Restraints 48 6 0 0 0GOF 1.133 1.028 0.992 1.193 1.219R1, wR2 [I > 2s(I)]a,b R1 ¼ 0.0288,
wR2 ¼ 0.0835R1 ¼ 0.0413,wR2 ¼ 0.1149
R1 ¼ 0.0445,wR2 ¼ 0.1144
R1 ¼ 0.0524,wR2 ¼ 0.1394
R1 ¼ 0.0736,wR2 ¼ 0.1630
R1, wR2 (all data) R1 ¼ 0.0359,wR2 ¼ 0.0876
R1 ¼ 0.0510,wR2 ¼ 0.1217
R1 ¼ 0.0628,wR2 ¼ 0.1239
R1 ¼ 0.0756,wR2 ¼ 0.1486
R1 ¼ 0.0799,wR2 ¼ 0.1673
a R1 ¼ S||Fo| � |Fc||/S|Fo|.b wR2 ¼ |Sw(|Fo|
2 � |Fc|2)|/S|w(Fo)
2|1/2, where w ¼ 1/[s2(Fo2) + (aP)2 + bP]. P ¼ (Fo
2 + 2Fc2)/3.
Paper Journal of Materials Chemistry A
Publ
ishe
d on
03
July
201
7. D
ownl
oade
d by
NA
NJI
NG
UN
IVE
RSI
TY
on
28/0
9/20
17 0
8:21
:07.
View Article Online
dispersed ultrasonically. The solution was stirred at a constantrate to maintain homogeneity. All titrations were performed bygradual addition of selected analytes in an incremental fashion.Each titration was repeated three times to get a concordantvalue.
2.4 X-ray crystallography
Crystallographic data collections for 1–5 were carried out ona Bruker Smart Apex II CCD area-detector diffractometer withgraphite-monochromated Mo Ka radiation (l ¼ 0.71073 A) at293(2) K using the u-scan technique. The diffraction data wereintegrated by using the SAINT program,33 which was also usedfor the intensity corrections for the Lorentz and polarizationeffects. Semi-empirical absorption corrections were appliedusing the SADABS program.34 The structures were solved bydirect methods and all the non-hydrogen atoms were renedanisotropically on F2 using the full-matrix least-squares tech-nique using the SHELXL-2014 crystallographic sowarepackage.35,36 The hydrogen atoms except those of water mole-cules were generated geometrically and rened isotropicallyusing the riding model. Atoms N1, O7, C13, C14 and C15 of theDMF molecule in 1 and N4, C32 and C33 atoms in 5 aredisordered in two positions, each with a site occupancy of 0.50.Due to the highly disordered solvent molecules in 3, 4 and 5,their contribution to densities was modeled using the SQUEEZEroutine in PLATON.37,38 The nal chemical formulae of 3, 4 and5 were obtained from crystallographic, EA and TG data. Thedetails of the crystal parameters, data collection, and rene-ments for 1–5 are summarized in Table 1, selected bond lengths
This journal is © The Royal Society of Chemistry 2017
and angles are listed in Table S1 in the ESI,† and hydrogenbonding data are given in Table S2 in the ESI.†
3. Results and discussion
Reactions of L, Cd(ClO4)2$6H2O and H2BDC/2,6-H2NDC/H2BPDC with different amounts of NaOH in a mixed solvent ofDMF, methanol and water at 90 �C for 3 days yielded crystals 1–5. The results show that the dosage of alkali (NaOH) in thereaction causes a great variation in the resulting structuressince NaOH is alkali and can affect the deprotonation of thecarboxylic acid ligands.39
3.1 Crystal structure of [Cd3(BDC)3(DMF)2] (1)
Crystal structural analysis revealed that 1 crystallizes in themonoclinic space group C2/c and the coordination environmentaround Cd(II) is shown in Fig. 1a. Notably, no ligand L wasfound in 1 probably because of the small amount of NaOH. Cd1is coordinated by six carboxylate oxygen atoms (O1, O3, O4, O5,O6 and O6E) from four different BDC2� ligands and one oxygen(O7) from a DMF molecule to give a distorted pentagonalbipyramidal coordination geometry, while Cd2 is surroundedby six carboxylate oxygen atoms (O2, O2A, O3, O3A, O4 andO4A). Moreover, two different BDC2� ligands with (m2-h1:h2)–(m2-h1:h2) and (m2-h1:h1)–(m3-h2:h2) coordination modes(Fig. S2a and b in the ESI†) offer carboxylate oxygen atoms tocoordinate with Cd1 and Cd2 atoms to form a Cd–O one-dimensional (1D) chain (Fig. 1b). The nal structure of 1 isa 3D tubular-like framework with a diameter of 9.524 A, which is
J. Mater. Chem. A, 2017, 5, 15797–15807 | 15799

Fig. 1 (a) Coordination environment of Cd(II) in 1with ellipsoids drawnat the 30% probability level. Hydrogen atoms are omitted for clarity. (b)1D Cd–O chain in 1. (c) 3D tubular-like unit in 1. (d) 3D framework of 1.The coordinated DMF molecules are omitted for clarity.
Fig. 2 (a) Coordination environment of Cd(II) in 2with ellipsoids drawnat the 30% probability level. Hydrogen atoms and non-coordinatedsolvent molecules are omitted for clarity. (b) 1D chain in 2. (c) 2D layerof 2 with hydrogen bonds indicated by dashed lines. (d) 3D supra-molecular structure of 2 with hydrogen bonds indicated by dashedlines (each color represents a 2D layer).
Journal of Materials Chemistry A Paper
Publ
ishe
d on
03
July
201
7. D
ownl
oade
d by
NA
NJI
NG
UN
IVE
RSI
TY
on
28/0
9/20
17 0
8:21
:07.
View Article Online
constructed by the Cd–O 1D chain and BDC2� ligands (Fig. 1cand d). A similar framework has been reported previously inwhich aqua molecules, rather than the DMF, coordinated withCd(II).40
3.2 Crystal structure of [Cd(L)(BDC)]2$2DMF$H2O (2)
When double amount of NaOH was used, complex 2 was iso-lated. In 2, L acts as a terminal ligand offering the chelatingnitrogen atoms to coordinate with Cd(II). As illustrated inFig. 2a, Cd1 adopts a coordination donor set of N3O4, whichcomprises three chelating nitrogen atoms (N1, N2 and N3) fromone L, and four carboxylate oxygen ones (O1, O2, O3 and O4)from two different BDC2� ligands. Meanwhile, the carboxylategroups of BDC2� with (m1-h1:h1)–(m1-h1:h1) coordination mode(Fig. S2c in the ESI†) connect Cd atoms to produce a 1D chain(Fig. 2b), which is connected through N–H/N hydrogen bonds(N1/N5 ¼ 3.360 A) (Fig. S3a in the ESI†) to extend into a two-dimensional (2D) network (Fig. 2c). The 2D layers furtherconnect each other by N–H/O hydrogen bonds (N3/O2 ¼3.062 A) (Fig. S3b in the ESI†) to give a 3D supramolecularstructure of 2 (Fig. 2d).
3.3 Crystal structure of [Cd2Na(L)(BDC)2.5]$9H2O (3)
When the dosage of NaOH is further raised up to 0.072 mmol, 3with an entirely different structure was successfully obtained.The asymmetric unit of 3 contains two Cd(II), one Na(I) ion,one L, two and a half BDC2� and nine free water molecules.Fig. 3a shows that Cd1 is seven coordinated by three chelatingnitrogen atoms (N1, N2 and N3) and four oxygen ones (O1, O2,O3 and O4), whereas Cd2 is also seven coordinated by threepairs of chelating carboxylate groups (O5D, O6D, O7, O8, O9and O10) from three BDC2� moieties and one triazole nitrogen
15800 | J. Mater. Chem. A, 2017, 5, 15797–15807
(N6) from the L ligand. The Cd–N distances are from 2.280(5) to2.597(4) A, while the Cd–O ones are in a range of 2.269(3)–2.560(3) A, which are well-matched to those observed in thereported Cd(II) complexes.41 It is noteworthy that the Na ions in3 connect Cd(II) atoms through carboxylate oxygen atoms to givea [Na2Cd4] sub-unit (Fig. 3b and c), which is further linked byBDC2� to generate an innite 1D chain (Fig. S4 in the ESI†).Adjacent 1D chains are further extended to form a 2D networkby carboxylate oxygen through the BDC2� ligand with (m2-h1:h2)–(m2-h1:h2) mode (Fig. S2d in the ESI† and 3d).Subsequently, L acts as the bridging ligand to further link the2D layers through Cd–N bonds to generate the nal 3D structureof 3 with irregular channels (Fig. S5 in the ESI† and 3e).Considering the existence of nine free water molecules per unit,the PLATON program was used to calculate the solvent-accessible volume. It was approximately 726.5 A3 per 2189.2A3 unit cell volume, and the pore volume ratio is calculated to be33.2%.
3.4 Crystal structure of [Cd2(L)(2,6-NDC)2]$DMF$5H2O (4)
When the dicarboxylate ligand H2BDC was replaced by longerones 2,6-H2NDC and H2BPDC, 4 and 5 were isolated. As shownin Fig. 4a, Cd1 in 4 is bound by seven oxygen atoms from threepairs of chelating carboxylate groups (O1, O2, O5, O6, O7 andO8) and one bridging oxygen (O3), while Cd2 is ve-coordinatedwith a coordination donor set of N4O, which comprises threechelating nitrogen atoms (N1, N2 and N3), one triazole nitrogen(N4) from two L ligands and one bridging oxygen atom (O4)from one 2,6-NDC2�. The bond distances around Cd(II) are2.252(6)–2.460(4) A for Cd–N and 2.249(3)–2.631(5) A for Cd–O.In 4, the 2,6-NDC2� ligand acts as a m2-bridging linker with (m1-h1:h1)–(m1-h1:h1) coordination mode (Fig. S6a in the ESI†) toconnect two Cd(II) atoms to form a 2D Cd-NDC network, whichcontains a hexagon of diameter 16.815 A (Fig. 4b). Meanwhile,Cd2 atoms and L ligands are constructed into a 1D Cd–L chain
This journal is © The Royal Society of Chemistry 2017

Fig. 3 (a) Coordination environment of Cd(II) in 3with ellipsoids drawnat the 30% probability level. Hydrogen atoms and free water moleculesare omitted for clarity. (b) [Na2Cd4] unit in 3. (c) Polyhedral view of the[Na2Cd4] unit. (d) 2D layer with [Na2Cd4] units in 3. (e) 3D structure of 3.
Paper Journal of Materials Chemistry A
Publ
ishe
d on
03
July
201
7. D
ownl
oade
d by
NA
NJI
NG
UN
IVE
RSI
TY
on
28/0
9/20
17 0
8:21
:07.
View Article Online
(Fig. 4c). The combination of the 1D Cd–L chain and 2D Cd–NDC network generated the nal 3D structure of 4 lled withanother 2,6-NDC2� ligand with (m1-h1:h1)–(m2-h1:h1) mode(Fig. S6b in the ESI† and 4d). There are channels with a diam-eter of 9.147 A. PLATON calculations suggest that the resultingeffective free volume, aer the removal of non-coordinatedwater and DMF molecules, is 30.1% (655.0 A3 per 2176.7 A3
unit crystal volume).
3.5 Crystal structure of [Cd2(L)(BPDC)2]$DMF$9H2O (5)
Complex 5 crystallizes in the monoclinic space group C2/c,rather than triclinic P�1 in 4; however, the coordination envi-ronment around Cd(II) in 5 is similar to that in 4 (Fig. 5a). In 5,
Fig. 4 (a) Coordination environment of Cd(II) in 4with ellipsoids drawnat the 30% probability level. Hydrogen atoms and non-coordinatedsolventmolecules are omitted for clarity. (b) 2D Cd–NDC network in 4.(c) 1D Cd–L chain in 4. (d) 3D structure of 4.
This journal is © The Royal Society of Chemistry 2017
a 2D hexagonal network which was built by metal ions anddicarboxylate ligands was also observed. The difference betweenthe 2D hexagonal networks in 4 and 5 is the distance betweenthe hexagon sides: the largest distance between the two sides ofthe hexagon in 5 is 24.068 A which is larger than the one in 4(16.815 A) due to the longer dicarboxylate ligand (H2BPDC)(Fig. 5b). Furthermore, there are cages with a diameter of 11.774A in the 3D framework of 5 (Fig. 5c and d) and the high-solventaccessible volume in 5 is 3977.1 A3 out of the 10 545.0 A3 unitcell volume (37.7% of the total crystal volume) calculated byPLATON.
3.6 Powder X-ray diffraction (PXRD) and thermal stability
The phase purity of the as-synthesized samples was furtherconrmed by PXRD measurements, and each PXRD pattern ofthe as-synthesized samples is consistent with the simulatedones (Fig. S7 in the ESI†), implying the pure phases of 2–5.Complexes 2–5 are air stable, and their thermal stability wasinvestigated in the temperature range of 30–800 �C by TGmeasurements under a nitrogen atmosphere (Fig. S8 in theESI†). 2 shows a weight loss of 13.04% in the range of 30–220 �C,which corresponds to the loss of free water and DMF molecules(calcd 13.26%), and a further weight loss was observed at about300 �C, corresponding to the collapse of the framework. 3 loses14.99% of weight in the temperature range of 30–180 �C, whichis attributed to the departure of the free water molecules (calcd15.00%), and the residue can be stable up to about 320 �C. Aweight loss of 15.22% was observed for 4 in the temperaturerange of 30–280 �C due to the loss of the free water and DMFmolecules (calcd 15.15%), and the decomposition of theframework occurred at about 300 �C. The TG curve of 5 showsa weight loss of 19.49% in the temperature range of 30–280 �C,
Fig. 5 (a) Coordination environment of Cd(II) in 5with ellipsoids drawnat the 30% probability level. Hydrogen atoms and non-coordinatedsolvent molecules are omitted for clarity. (b) 2D network in 5. (c) Cageunit in 5. (d) 3D structure of 5 with cages of diameter 11.774 A.
J. Mater. Chem. A, 2017, 5, 15797–15807 | 15801

Journal of Materials Chemistry A Paper
Publ
ishe
d on
03
July
201
7. D
ownl
oade
d by
NA
NJI
NG
UN
IVE
RSI
TY
on
28/0
9/20
17 0
8:21
:07.
View Article Online
corresponding to the release of free water together with DMFmolecules (calcd 19.59%), and then the framework was gradu-ally decomposed above 300 �C.
3.7 Photoluminescence properties
MOFs constructed from d10-metal ions and conjugated organicligands are promising candidates for potential luminescentmaterials.42–46 The solid state photoluminescence (PL) proper-ties of ligand L and 2, 3, 4, and 5 were studied at roomtemperature (Fig. S9 in the ESI†). Intense emission bands wereobserved at lem ¼ 430 nm (lex ¼ 326 nm) for 2, 420 nm (lex ¼326 nm) for 3, 395 nm (lex ¼ 345 nm) for 4 and 389 nm (lex ¼326 nm) for 5. The ligand L exhibits uorescence emission at480 nm upon excitations at 400 nm. Compared with the freeligand L, uorescence intensities of 2–5 show apparent uo-rescence enhancement implying that the formation of MOFsenhances the uorescence of the ligand. This is known asaggregation-induced emission (AIE), which is considered to becaused by the coordination of organic ligands to metal ions thatrestricts the deformation of the ligand and induces non-radiative relaxation.47 Meanwhile, compared with the free Lligand, 2–5 show obvious blue-shied emissions which can betentatively ascribed to metal–ligand coordination interactions.Absolute quantum yields of 3, 4 and 5 are 2.06%, 5.90% and5.33%, respectively. The high absolute quantum yields of 4 and5 may be attributed to the conformational rigidity of theframeworks to reduce the non-radiative relaxation process.48
Fig. 6 Luminescence quenching efficiency of 3, 4 and 5 in the pres-ence of different metal ions.
3.8 Chemosensor for Fe(III) ions
Considering that the NH2 group in luminescent MOF materialsis an electron-donating group and can bind metal ions, theapplication of 3–5 as luminescent probes for sensing metal ionswas explored. First, stable suspension solutions used for uo-rescence measurements were obtained by immersing freshsamples in different organic solvents. It is well known that insuch ligand-based emission systems, organic ligands absorbenergy upon excitation to give the corresponding uorescence;however, in the presence of small solvent molecules, energytransfer between the organic ligands and solvent molecules mayoccur and cause the quenching of the uorescence.49 As shownin Fig. S10 in the ESI,† the uorescence emissions of 3 havea slight dependence on the solvent molecules excited at 326 nm;however, the uorescence emissions of 4 and 5 are largelydependent on the solvent molecules excited at 345 and 326 nm,respectively. This phenomenon is to a great extent ascribed tothe stability of the framework and the interactions between theframework and solvent molecules.50,51 For 4, the photo-luminescence intensity depends on the identity of the solventmolecule with the sequence of DMF > NMP > 2-PA > CH3CN >THF > CH2Cl2 > CHCl3 > acetone > EtOH > MeOH, while for 5,the sequence is DMF > 2-PA > NMP > EtOH > MeOH > CH2Cl2 >CHCl3 > CH3CN > THF > acetone. Both 4 and 5 representexcellent uorescence emissions in the suspensions of DMF,being promising candidates for detection applications in thesolution phase.
15802 | J. Mater. Chem. A, 2017, 5, 15797–15807
The good uorescence performances of 3, 4 and 5 insuspension prompt us to explore their uorescence sensingproperties by using DMF as the dispersion medium. A series ofspectroscopic measurements have been conducted to explorethe uorescence responses of MOFs 3, 4 and 5 with differentmetal ions in DMF suspension. For comparison, the nelyground samples of 3, 4 and 5 (2 mg) were dispersed in 2.5 mLDMF solutions containing M(NO3)x (1 mM, M ¼ K+, Na+, Ni2+,Ca2+, Li+, Sr2+, Sm3+, Mn2+, Zn2+, Co2+, Pb2+, Cu2+, Cr3+, Al3+,Fe3+) to form metal ion incorporated MOF suspensions forluminescence studies. As shown in Fig. 6, the luminescenceintensities of 3, 4 and 5 have been quenched to some extent forall metal ions, but the quenching level is dependent on thespecies of metal ions. Among the metal ions studied, thequenching effects of Al3+ and Fe3+ are very pronounced, espe-cially for Fe(III) ions.
In order to assess the sensing sensitivity of 3, 4 and 5,quantitative uorescence titration experiments were performed.Interestingly, the luminescence intensity of Fe(III)-incorporated3, 4 and 5 is heavily dependent on the concentration of themetal ions. As shown in Fig. 7a–c, the emission intensitydecreased monotonically and drastically when the Fe(III)concentration increased from 0 mL to 680 mL. It is remarkablethat MOFs 3, 4 and 5 feature highly sensitive and selectivesensing for Fe(III) ions in DMF suspension. The quenchingeffects of 3, 4 and 5 were examined as a function of Fe(NO3)3concentration in the range of 0–0.1 mM. The uorescencequenching efficiency can be quantitatively explained by theStern–Volmer (SV) equation: (I0/I) ¼ 1 + Ksv[M], where Ksv is thequenching constant (M�1), [M] is themolar concentration of theanalyte, and I0 and I are the luminescence intensities before andaer addition of the analyte, respectively. A detailed SV analysisfurther revealed that there exists a good linear correlation (R2 ¼0.9989 for 3, R2 ¼ 0.9998 for 4, and R2 ¼ 0.9985 for 5) betweenthe quenching efficiency and the amount of Fe(III) in the lowconcentration range (from 0 to 0.03 mM), as indicated inFig. 7a–c (inset). Moreover, when the concentration of Fe(III)increased to 0.21 mM, the quenching efficiency could almostreach 100%. On the basis of the experimental data in Fig. 7, theKsv values are calculated to be 1.67 � 104 M�1 for 3, 1.44 � 104
M�1 for 4, and 1.08 � 104 M�1 for 5. Based on the Ksv values and
This journal is © The Royal Society of Chemistry 2017

Fig. 7 Effect on the emission spectra of 3 (a), 4 (b) and 5 (c) dispersed in DMF suspensions upon incremental addition of Fe(III) ions (1 mM, 20 mLaddition each time; inset: SV plots of Fe(III) ions) and selective detection of Fe(III) ions on 3 (d), 4 (e) and 5 (f) in the presence of other metal ions inDMF suspensions.
Paper Journal of Materials Chemistry A
Publ
ishe
d on
03
July
201
7. D
ownl
oade
d by
NA
NJI
NG
UN
IVE
RSI
TY
on
28/0
9/20
17 0
8:21
:07.
View Article Online
the standard error (s) for three repeated uorescencemeasurements of blank solutions, the detection limits (3s/Ksv)are calculated to be 155 ppb for 3, 209 ppb for 4, and 297 ppb for5, which are a clear indication of the high sensing sensitivity of3, 4 and 5 towards Fe(III). As shown in Table S3 in the ESI,†compared with reported Cd–MOFs, the Ksv values of 3, 4 and 5are relatively good under the same conditions.8,9,52
For comparison, uorescence titration experiments of Al(III)-incorporated 3, 4 and 5 were also performed. As shown inFig. S11 in the ESI,† the calculated Ksv values are 4.48� 103 M�1
for 3, 4.36 � 103 M�1 for 4, and 2.52 � 103 M�1 for 5. Accord-ingly, the Ksv[Fe(III)]/Ksv[Al(III)] values are 3.73, 3.30 and 4.29 formetal ion-incorporated 3, 4 and 5, respectively. The resultsimply that 3, 4 and 5 show highly selective sensing for Fe(III)ions.
Usually, many metal ions coexist in a practical biological andenvironmental system. Considering the high sensing sensitivityof 3, 4, 5 towards Fe(III), we further checked the detectionselectivity for Fe(III) in the presence of other metal ions byuorescence spectra. In the control experiment, a 1 mM DMFsolution of M(NO3)x (M ¼ Cr3+, Sm3+, Cu2+, Zn2+, Sr2+, Ni2+ andNa+) was initially added to the DMF suspensions of 3, 4 and 5,followed by addition of Fe(III) (20 mL). With increasing Fe(III)concentration (from 0 to 0.048 mM), the uorescence emissionsof 3, 4 and 5 are quenched efficiently. These results can be easilyvisualized by plotting the percentage uorescence intensityversus the concentration of Fe(III) added, as shown in Fig. 7d–f,where the stepwise decrease in uorescence intensity clearlydemonstrates the selectivity of 3, 4 and 5 toward Fe(III).
This journal is © The Royal Society of Chemistry 2017
3.9 Chemosensor for antibiotics
Antibiotics, being used extensively for the treatment of bacterialinfections in humans and animals, have been considered asa class of important organic pollutants. Therefore, rapidprobing of antibiotics is of great signicance from the viewpointof human health and environmental protection. Consideringthe excellent luminescence behaviors and high porosities of 3, 4and 5, it will be of great interest to apply them as potentialuorescent sensors for detecting antibiotics such as NFs(nitrofurazone, NZF; nitrofurantoin, NFT; furazolidone, FZD),NMs (metronidazole, MDZ; dimetridazole, DTZ), sulfonamides(sulfadiazine, SDZ; sulfamethazine, SMZ), chloramphenicols(thiamphenicol, THI) and b-lactams (penicillin, PCL) (Fig. S12in the ESI†). To explore the ability of 3, 4 and 5 to sense a tracequantity of antibiotics, uorescence-quenching titrations wereperformed by gradual addition of antibiotics to DMF suspen-sions of 3, 4 and 5. During the titration experiments, the as-synthesized samples of 3, 4 or 5 (2 mg) in DMF solvent (2.5 mL),and then upon incremental addition of a selected antibiotic(1 mM, 20 mL addition each time). The percentage of uores-cence quenching in terms of a certain amount of differentantibiotics at room temperature is depicted in Fig. 8. Obviously,the sensing experiments show that high uorescence quench-ing of MOFs occurs upon the incremental addition of NZF, andthe order of quenching efficiency is NZF > NFT > FZD > MDZ >DTZ > SDZ > THI > PCL > SMZ for 3, NZF > NFT > FZD > MDZ >DTZ > THI > SDZ > SMZ > PCL for 4, and NZF > NFT > FZD > DTZ> SMZ > SDZ > THI > PCL for 5. NZF, NFT and FZD give rise tothe highest quenching efficiencies of 93, 83 and 69% for 3, 99,
J. Mater. Chem. A, 2017, 5, 15797–15807 | 15803
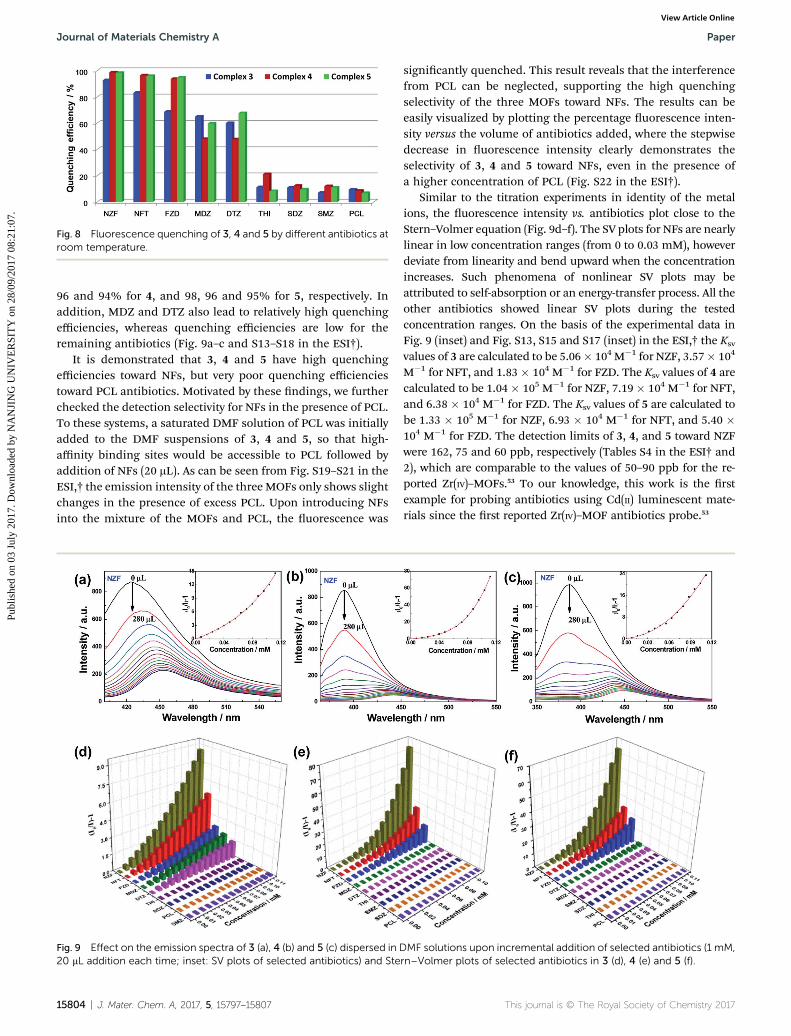
Fig. 8 Fluorescence quenching of 3, 4 and 5 by different antibiotics atroom temperature.
Journal of Materials Chemistry A Paper
Publ
ishe
d on
03
July
201
7. D
ownl
oade
d by
NA
NJI
NG
UN
IVE
RSI
TY
on
28/0
9/20
17 0
8:21
:07.
View Article Online
96 and 94% for 4, and 98, 96 and 95% for 5, respectively. Inaddition, MDZ and DTZ also lead to relatively high quenchingefficiencies, whereas quenching efficiencies are low for theremaining antibiotics (Fig. 9a–c and S13–S18 in the ESI†).
It is demonstrated that 3, 4 and 5 have high quenchingefficiencies toward NFs, but very poor quenching efficienciestoward PCL antibiotics. Motivated by these ndings, we furtherchecked the detection selectivity for NFs in the presence of PCL.To these systems, a saturated DMF solution of PCL was initiallyadded to the DMF suspensions of 3, 4 and 5, so that high-affinity binding sites would be accessible to PCL followed byaddition of NFs (20 mL). As can be seen from Fig. S19–S21 in theESI,† the emission intensity of the three MOFs only shows slightchanges in the presence of excess PCL. Upon introducing NFsinto the mixture of the MOFs and PCL, the uorescence was
Fig. 9 Effect on the emission spectra of 3 (a), 4 (b) and 5 (c) dispersed in20 mL addition each time; inset: SV plots of selected antibiotics) and Ste
15804 | J. Mater. Chem. A, 2017, 5, 15797–15807
signicantly quenched. This result reveals that the interferencefrom PCL can be neglected, supporting the high quenchingselectivity of the three MOFs toward NFs. The results can beeasily visualized by plotting the percentage uorescence inten-sity versus the volume of antibiotics added, where the stepwisedecrease in uorescence intensity clearly demonstrates theselectivity of 3, 4 and 5 toward NFs, even in the presence ofa higher concentration of PCL (Fig. S22 in the ESI†).
Similar to the titration experiments in identity of the metalions, the uorescence intensity vs. antibiotics plot close to theStern–Volmer equation (Fig. 9d–f). The SV plots for NFs are nearlylinear in low concentration ranges (from 0 to 0.03 mM), howeverdeviate from linearity and bend upward when the concentrationincreases. Such phenomena of nonlinear SV plots may beattributed to self-absorption or an energy-transfer process. All theother antibiotics showed linear SV plots during the testedconcentration ranges. On the basis of the experimental data inFig. 9 (inset) and Fig. S13, S15 and S17 (inset) in the ESI,† the Ksv
values of 3 are calculated to be 5.06� 104 M�1 for NZF, 3.57� 104
M�1 for NFT, and 1.83� 104 M�1 for FZD. The Ksv values of 4 arecalculated to be 1.04� 105 M�1 for NZF, 7.19� 104 M�1 for NFT,and 6.38 � 104 M�1 for FZD. The Ksv values of 5 are calculated tobe 1.33 � 105 M�1 for NZF, 6.93 � 104 M�1 for NFT, and 5.40 �104 M�1 for FZD. The detection limits of 3, 4, and 5 toward NZFwere 162, 75 and 60 ppb, respectively (Tables S4 in the ESI† and2), which are comparable to the values of 50–90 ppb for the re-ported Zr(IV)–MOFs.53 To our knowledge, this work is the rstexample for probing antibiotics using Cd(II) luminescent mate-rials since the rst reported Zr(IV)–MOF antibiotics probe.53
DMF solutions upon incremental addition of selected antibiotics (1 mM,rn–Volmer plots of selected antibiotics in 3 (d), 4 (e) and 5 (f).
This journal is © The Royal Society of Chemistry 2017

Table 2 Ksv, standard error, and detection limits of 3, 4 and 5 toward NZF, NFT and FZD at room temperature
Antibiotics
Ksv (M�1) Standard error (s) Detection limit (ppb)
3 4 5 3 4 5 3 4 5
5.06 � 104,(R2 ¼ 0.99932)
1.04 � 105,(R2 ¼ 0.97162)
1.33 � 105,(R2 ¼ 0.97851)
0.0131 0.0124 0.0127 162 75 60
3.57 � 104,(R2 ¼ 0.99948)
7.19 � 104,(R2 ¼ 0.99173)
6.93 � 104,(R2 ¼ 0.99458)
0.0130 0.0125 0.0131 274 131 142
1.83 � 104,(R2 ¼ 0.99954)
6.38 � 104,(R2 ¼ 0.99988)
5.40 � 104,(R2 ¼ 0.98077)
0.0127 0.0128 0.0129 494 143 170
Paper Journal of Materials Chemistry A
Publ
ishe
d on
03
July
201
7. D
ownl
oade
d by
NA
NJI
NG
UN
IVE
RSI
TY
on
28/0
9/20
17 0
8:21
:07.
View Article Online
3.10 Mechanism for probing Fe(III) ions and antibiotics
To understand the mechanism of the uorescence quenchingeffect of 3, 4 and 5 toward Fe(III) ions and antibiotics, furtherexperiments were carried out. The luminescence lifetimes of 3,4 and 5 before and aer the addition of Fe(III) are almost thesame, and the results show that there is no coordinationbetween the metal ions and MOFs (Fig. S23–S25 in the ESI†). Inaddition, the UV/vis absorption data of 3, 4, and 5 and variedmetal ions show that the wide absorption band from 230 to 500nm of Fe(III) covers the range of absorption bands of 3, 4 and 5,and is much more strongly than those of other metal ions(Fig. S26 in the ESI†). This means that the UV/vis absorption ofFe(III) upon excitation may prevent the absorption of 3, 4 and 5,and result in the decrease or quenching of the lumines-cence.54–56 As for the antibiotics, upon excitation, the excitedelectron from the conduction-band (CB) of the MOF maytransfer to the lowest unoccupied molecular orbital (LUMO) ofthe antibiotics, thus resulting in uorescence quenching.57,58
The efficient uorescence quenching observed for NFs (NZF,NFT and FZD) is consistent with the low LUMO energy of NFscalculated by DFT (Table S5 and Fig. S27 in the ESI†). In addi-tion, the nonlinearity trend of the SV plots for NFs mentionedabove indicates that there may be an energy transfer mecha-nism in the uorescence quenching processes,59 since the UV/vis absorption band of NFs has the greatest degree of over-lapping with the emission spectra of 3, 4 and 5 (Fig. S28 in theESI†). As a result, the coexistence of electron transfer and energytransfer enables NFs to have a high photoluminescencequenching effect compared with other studied antibiotics.
4. Conclusions
In summary, we designed and synthesized a series of lumines-cent Cd-based metal–organic probes decorated with chelatingNH2 sites based on a new amino triazole ligand and d10 Cd(II)ions. Frameworks 1, 2 and 3 revealed that the dosage of NaOHcan affect the coordination mode of both the ligand L and
This journal is © The Royal Society of Chemistry 2017
carboxylate auxiliary ligand to control the nal structures.Moreover, by increasing the length of the carboxylate ligand,frameworks 4 and 5 with lager channels were fabricated. Theporosities and the good uorescence performances of 3, 4 and 5make them potential uorescent materials which can be used todetect Fe(III) ions and antibiotics. The low detection limits forFe(III) ions (155 ppb for 3, 209 ppb for 4 and 297 ppb for 5) andNZF (162 ppb for 3, 75 ppb for 4 and 60 ppb for 5) illustrate that3, 4 and 5 show a fast response and high sensitivity for traceamounts of Fe(III) and antibiotics. The absorption of Fe(III)between 230 and 500 nm hindered the absorption of 3, 4 and 5and caused photoluminescence attenuation of 3, 4 and 5. Thehigh quenching efficiencies for the antibiotics may be attrib-uted to the coexistence of electron transfer and resonanceenergy transfer in antibiotic detection processes. To ourknowledge, this is the rst example for probing antibioticsusing Cd(II) luminescent MOFs.
Acknowledgements
We gratefully acknowledge the National Natural Science Foun-dation of China (grant no. 21331002, 21573106 and 21671097)and the National Basic Research Program of China (grant no.2017YFA0303500) for nancial support of this work. Theauthors extend their appreciation to the International ScienticPartnership Program ISPP at King Saud University for fundingthis research work through ISPP#0090. This work was alsosupported by a project funded by the Priority Academic ProgramDevelopment of Jiangsu Higher Education Institutions.
Notes and references
1 S. K. Sahoo, D. Sharma, R. K. Bera, G. Crisponi andJ. F. Callan, Chem. Soc. Rev., 2012, 41, 7195–7227.
2 Q. Zhao, F. Y. Li and C. H. Huang, Chem. Soc. Rev., 2010, 39,3007–3030.
3 X. Y. Xu and B. Yan, ACS Appl. Mater. Interfaces, 2015, 7, 721–729.
J. Mater. Chem. A, 2017, 5, 15797–15807 | 15805

Journal of Materials Chemistry A Paper
Publ
ishe
d on
03
July
201
7. D
ownl
oade
d by
NA
NJI
NG
UN
IVE
RSI
TY
on
28/0
9/20
17 0
8:21
:07.
View Article Online
4 Z. Chen, Y. Sun, L. Zhang, D. Sun, F. Liu, Q. Meng, R. Wangand D. Sun, Chem. Commun., 2013, 49, 11557–11559.
5 Y. Zhou, H. H. Chen and B. Yan, J. Mater. Chem. A, 2014, 2,13691–13697.
6 X. Y. Dong, R. Wang, J. Z. Wang, S. Q. Zang and T. C. W. Mak,J. Mater. Chem. A, 2015, 3, 641–647.
7 Q. Tang, S. Liu, Y. Liu, J. Miao, S. Li, L. Zhang, Z. Shi andZ. Zheng, Inorg. Chem., 2013, 52, 2799–2801.
8 Y. L. Wu, G. P. Yang, Y. D. Zhang, N. N. Shi, J. Han andY. Y. Wang, RSC Adv., 2015, 5, 90772–90777.
9 Y. L. Wu, G. P. Yang, X. Zhou, J. Li, Y. Ning and Y. Y. Wang,Dalton Trans., 2015, 44, 10385–10391.
10 X. Liu, J. C. Steele and X. Z. Meng, Environ. Pollut., 2017, 223,161–169.
11 K. Kummerer, Chemosphere, 2009, 75, 417–434.12 Q. Q. Zhang, G. G. Ying, C. G. Pan, Y. S. Liu and J. L. Zhao,
Environ. Sci. Technol., 2015, 49, 6772–6782.13 A. P. de Silva, H. Q. N. Gunaratne, T. Gunlaugsson,
A. J. M. Huxley, C. P. McCoy, J. T. Rademacher andT. E. Rice, Chem. Rev., 1997, 97, 1515–1566.
14 Y. J. Cui, Y. F. Yue, G. D. Qian and B. L. Chen, Chem. Rev.,2012, 112, 1126–1162.
15 L. E. Kreno, K. Leong, O. K. Farha, M. Allendorf, R. P. VanDuyne and J. T. Hupp, Chem. Rev., 2012, 112, 1105–1125.
16 Y. L. Li, Y. Zhao, P. Wang, Y. S. Kang, Q. Liu, X. D. Zhang andW. Y. Sun, Inorg. Chem., 2016, 55, 11821–11830.
17 J. W. Ye, L. M. Zhao, R. F. Bogale, Y. Gao, X. X. Wang,X. M. Qian, S. Guo, J. Z. Zhao and G. L. Ning, Chem.–Eur.J., 2015, 21, 2029–2037.
18 Y. L. Hou, H. Xu, R. R. Cheng and B. Zhao, Chem. Commun.,2015, 51, 6769–6772.
19 Z. C. Hu, B. J. Deibert and J. Li, Chem. Soc. Rev., 2014, 43,5815–5840.
20 Y. Q. Dong, J. H. Cai, Q. Q. Fang, X. You and Y. W. Chi, Anal.Chem., 2016, 88, 1748–1752.
21 J. H. Lee, J. Jaworski and J. H. Jung, Nanoscale, 2013, 5, 8533–8540.
22 S. S. Zhao, J. Yang, Y. Y. Liu and J. F. Ma, Inorg. Chem., 2016,55, 2261–2273.
23 Y. Guo, X. Feng, T. Han, S. Wang, Z. Lin, Y. Dong andB. Wang, J. Am. Chem. Soc., 2014, 136, 15485–15488.
24 J. W. Ye, H. L. Zhou, S. Y. Liu, X. N. Cheng, R. B. Lin, X. L. Qi,J. P. Zhang and X. M. Chen, Chem. Mater., 2015, 27, 8255–8260.
25 M. Formica, V. Fusi, L. Giorgi and M. Micheloni, Coord.Chem. Rev., 2012, 256, 170–192.
26 S. K. Sahoo, D. Sharma, R. K. Bera, G. Crisponi andJ. F. Callan, Chem. Soc. Rev., 2012, 41, 7195–7227.
27 M. Zheng, H. Q. Tan, Z. G. Xie, L. G. Zhang, X. B. Jing andZ. C. Sun, ACS Appl. Mater. Interfaces, 2013, 5, 1078–1083.
28 B. L. Chen, L. B. Wang, Y. Q. Xiao, F. R. Fronczek, M. Xue,Y. J. Cui and G. D. Qian, Angew. Chem., Int. Ed., 2009, 48,500–503.
29 Z. H. Xiang, C. Q. Fang, S. H. Leng and D. P. Cao, J. Mater.Chem. A, 2014, 2, 7662–7665.
30 D. K. Singha and P. Mahata, Inorg. Chem., 2015, 54, 6373–6379.
15806 | J. Mater. Chem. A, 2017, 5, 15797–15807
31 S. Maruyama, K. Kikuchi, T. Hirano, Y. Urano andT. Nagano, J. Am. Chem. Soc., 2002, 124, 10650–10651.
32 X. Peng, J. Du, J. Fan, J. Wang, Y. Wu, J. Zhao, S. Sun andT. Xu, J. Am. Chem. Soc., 2007, 129, 1500–1501.
33 SAINT, Program for Data Extraction and Reduction, BrukerAXS, Inc, Madison, WI, 2001.
34 G. M. Sheldrick, SADABS, Program for Empirical AdsorptionCorrection of Area Detector Data, University of G€ottingen,Germany, 2003.
35 G. M. Sheldrick, SHELXS-2014, Program for the CrystalStructure Solution, University of G€ottingen, Germany, 2014.
36 G. M. Sheldrick, SHELXL-2014, Program for the CrystalStructure renement, University of G€ottingen, Germany, 2014.
37 P. van der Sluis and A. L. Spek, BYPASS: an effective methodfor the renement of crystal structures containingdisordered solvent regions, Acta Crystallogr., Sect. A: Found.Crystallogr., 1990, 46, 194–201.
38 A. L. Spek, PLATON, A Multipurpose Crystallographic Tool;Utrecht University: The Netherlands, 2005 or. A. L. Spek,Single Crystal Structure Validation with the ProgramPLATON, J. Appl. Crystallogr., 2003, 36, 7–13.
39 Q. Liu, L. N. Jin and W. Y. Sun, Chem. Commun., 2012, 48,8814–8816.
40 J. Zhang, J. T. Bu, S. M. Chen, T. Wu, S. T. Zheng, Y. G. Chen,R. A. Nieto, P. Y. Feng and X. H. Bu, Angew. Chem., Int. Ed.,2010, 49, 8876–8879.
41 Y. Deng, Z. Y. Yao, P. Wang, Y. Zhao, Y. S. Kang andW. Y. Sun, Sens. Actuators, B, 2017, 244, 114–123.
42 V. W.W. Yam and K. K. W. Lo, Chem. Soc. Rev., 1999, 28, 323–334.
43 M. D. Allendorf, C. A. Bauer, R. K. Bhakta and R. J. T. Houka,Chem. Soc. Rev., 2009, 38, 1330–1352.
44 D. Maspoch, D. Ruiz-Molina and J. Veciana, Chem. Soc. Rev.,2007, 36, 770–818.
45 G. De Santis, L. Fabbrizzi, M. Licchelli, A. Poggi andA. Taglietti, Angew. Chem., Int. Ed. Engl., 1996, 35, 202–204.
46 J. C. Dai, X. T. Wu, Z. Y. Fu, C. P. Cui, S. M. Hu, W. X. Du,L. M. Wu, H. H. Zhang and R. Q. Sun, Inorg. Chem., 2002,41, 1391–1396.
47 N. B. Shustova, T. C. Ong, A. F. Cozzolino, V. K. Michaelis,R. G. Griffin and M. Dinc�a, J. Am. Chem. Soc., 2012, 134,15061–15070.
48 H. J. Zhang, R. Q. Fan, W. Chen, J. Z. Fan, Y. W. Dong,Y. Song, X. Du, P. Wang and Y. L. Yang, Cryst. Growth Des.,2016, 16, 5429–5440.
49 S. S. Nagarkar, A. V. Desai and S. K. Ghosh, Chem. Commun.,2014, 50, 8915–8918.
50 Y. Ooyama, A. Matsugasako, K. Oka, T. Nagano,M. Sumomogi, K. Komaguchi, I. Imae and Y. Harima,Chem. Commun., 2011, 47, 4448–4450.
51 Q. Deng, Y. Li, J. Wu, Y. Liu, G. Fang, S. Wang and Y. Zhang,Chem. Commun., 2012, 48, 3009–3011.
52 S. G. Chen, Z. Z. Shi, L. Qin, H. L. Jia and H. G Zheng, Cryst.Growth Des., 2017, 17, 67–72.
53 B. Wang, X. L. Lv, D. W. Feng, L. H. Xie, J. Zhang, M. Li,Y. B. Xie, J. R. Li and H. C. Zhou, J. Am. Chem. Soc., 2016,138, 6204–6216.
This journal is © The Royal Society of Chemistry 2017

Paper Journal of Materials Chemistry A
Publ
ishe
d on
03
July
201
7. D
ownl
oade
d by
NA
NJI
NG
UN
IVE
RSI
TY
on
28/0
9/20
17 0
8:21
:07.
View Article Online
54 W. Sun, J. Wang, G. Zhang and Z. Liu, RSC Adv., 2014, 4,55252–55255.
55 F. Yi, J. Li, D. Wu and Z. Sun, Chem.–Eur. J., 2015, 21, 11475–11482.
56 J. Chen, F. Yi, H. Yu, S. Jiao, G. Pang and Z. Sun, Chem.Commun., 2014, 50, 10506–10509.
This journal is © The Royal Society of Chemistry 2017
57 S. S. Nagarkar, A. V. Desai and S. K. Ghosh, Chem. Commun.,2014, 50, 8915–8918.
58 S. J. Toal and W. C. Trogler, J. Mater. Chem., 2006, 16, 2871–2883.
59 S. S. Nagarkar, B. Joarder, A. K. Chaudhari, S. Mukherjee andS. K. Ghosh, Angew. Chem., Int. Ed., 2013, 52, 2881–2885.
J. Mater. Chem. A, 2017, 5, 15797–15807 | 15807


![c4dt01927j 15351..15358 - Nanjing Universityhysz.nju.edu.cn/whuang/publication/Dalton-2014-ZK-authorreprints.pdf · mation of 36-membered [2 + 2] macrocyclic dinuclear Zn(II)complexes](https://cdn.vdocuments.mx/doc/165x107/5c1009a509d3f280158c065d/c4dt01927j-1535115358-nanjing-mation-of-36-membered-2-2-macrocyclic.jpg)
