HAL Id: hal-00563206https://hal.archives-ouvertes.fr/hal-00563206
Submitted on 4 Feb 2011
HAL is a multi-disciplinary open accessarchive for the deposit and dissemination of sci-entific research documents, whether they are pub-lished or not. The documents may come fromteaching and research institutions in France orabroad, or from public or private research centers.
L’archive ouverte pluridisciplinaire HAL, estdestinée au dépôt et à la diffusion de documentsscientifiques de niveau recherche, publiés ou non,émanant des établissements d’enseignement et derecherche français ou étrangers, des laboratoirespublics ou privés.
IUPAC Critical Evaluation of the Rotational-VibrationalSpectra of Water Vapor. Part II. Energy Levels andTransition Wavenumbers for HD16O, HD17O, and
HD18OJonathan Tennyson, P. F. Bernath, Linda Brown, Alain Campargue, Attila G
Csaszar, L. Daumont, Robert Gamache, J.T. Hodges, O. V. Naumenko, O.Polyansky, et al.
To cite this version:Jonathan Tennyson, P. F. Bernath, Linda Brown, Alain Campargue, Attila G Csaszar, et al.. IUPACCritical Evaluation of the Rotational-Vibrational Spectra of Water Vapor. Part II. Energy Levels andTransition Wavenumbers for HD16O, HD17O, and HD18O. Journal of Quantitative Spectroscopy andRadiative Transfer, Elsevier, 2010, 111, pp.2160. �10.1016/j.jqsrt.2010.06.012�. �hal-00563206�

IUPAC Critical Evaluation of the
Rotational-Vibrational Spectra of Water Vapor. Part II.
Energy Levels and Transition Wavenumbers for HD16O,
HD17O, and HD18O
Jonathan Tennyson,,a, Peter F. Bernathb, Linda R. Brownc, AlainCampargued, Attila G. Csaszare, Ludovic Daumontf, Robert R. Gamacheg,Joseph T. Hodgesh, Olga V. Naumenkoi, Oleg L. Polyanskyj,a, Laurence S.
Rothmank, Robert A. Toth,c, Ann Carine Vandaelel, Nikolai F. Zobovj,Sophie Fallym, Alexander Z. Fazlievi, Tibor Furtenbachere, Iouli E.
Gordonk, Shui-Ming Hun, Semen N. Mikhailenkoi, Boris A. Voronin.i
aDepartment of Physics and Astronomy, University College London, LondonWC1E 6BT, United Kingdom
bUniversity of York, York, United KingdomcJet Propulsion Laboratory, California Institute of Technology, Pasadena, CA, U.S.A.
dUniversite Joseph Fourier, Grenoble, Francee Lorand Eotvos University, Budapest, Hungary
fUniversite de Reims Champagne-Ardenne, Reims, FrancegUniversity of Massachussets, Lowell, MA, U.S.A.
hNational Institute of Standards and Technology, Gaithersburg, MD, U.S.A.iV. E. Zuev Institute of Atmospheric Optics, Russian Academy of Sciences, 1,
Academician Zuev square, 634021, Tomsk, RussiajInstitute of Applied Physics, Russian Academy of Sciences, Nizhny Novgorod, Russia
kHarvard-Smithsonian Center for Astrophysics, Cambridge, MA, U.S.A.lInstitut d’Aeronomie Spatiale de Belgique, Brussels, Belgium
mUniversite Libre de Bruxelles, Brussels, BelgiumnLaboratory of Bond-Selective Chemistry, University of Science and Technology of
China, Hefei, 230026, China
Abstract
This is the second of a series of articles reporting critically evaluated
rotational-vibrational line positions, transition intensities, pressure depen-
dences, and energy levels, with associated critically reviewed assignments and
uncertainties, for all the main isotopologues of water. This article presents
Preprint submitted to Journal of Quantitative Spectroscopy & Radiative Transfer10th June 2010
energy levels and line positions of the following singly deuterated isotopo-
logues of water: HD16O, HD17O, and HD18O. The MARVEL (Measured Ac-
tive Rotational-Vibrational Energy Levels) procedure is used to determine
the levels, the lines, and their self-consistent uncertainties for the spectral re-
gions 0–22 708, 0–1 674, and 0–12 105 cm−1 for HD16O, HD17O, and HD18O,
respectively. For HD16O, 54 740 transitions were analyzed from 76 sources,
the lines come from spectra recorded both at room temperature and from hot
samples. These lines correspond to 36 690 distinct assignments and 8 818
energy levels. For HD17O, only 485 transitions could be analyzed from 3
sources; the lines correspond to 162 MARVEL energy levels. For HD18O,
8 729 transitions were analyzed from 11 sources and these lines correspond
to 1 860 energy levels. The energy levels are checked against ones determined
from accurate variational nuclear motion computations employing exact ki-
netic energy operators. This comparison shows that the measured transitions
account for about 86 % of the anticipated absorbance of HD16O at 296 K
and that the transitions predicted by the MARVEL energy levels account for
essentially all the remaining absorbance. The extensive list of MARVEL lines
and levels obtained are given in the Supplementary Material of this article,
as well as in a distributed information system applied to water, W@DIS,
where they can easily be retrieved. In addition, the transition and energy
level information for H217O and H2
18O, given in the first paper of this series
[J. Quant. Spectr. Rad. Transfer 110 (2009) 573-596], has been updated.
Key words: Water vapor, transition wavenumbers, atmospheric physics,
energy levels, MARVEL, information system, database, W@DIS, infrared
spectra, microwave spectra, HD16O, HD17O, HD18O
2

1. Introduction
The water molecule is the most abundant polyatomic molecule in the
universe and the single most important species for controlling the Earth’s
climate. Thus, the spectrum of water is both one of the most important and
one of the most thoroughly studied.
The first 14 authors of this article form a Task Group under the auspices
of the International Union of Pure and Applied Chemistry (IUPAC) with the
aim of constructing a database of water transitions from experiment and the-
ory, with individual tasks described in Table 1 of the first paper in this series
[1], henceforth known as Part I. Given the nature of water spectroscopy [2],
this database will concentrate on the pure rotational and vibration-rotation
transitions of water which we consider simultaneously on an equal basis. This
paper is the second in a series presenting our evolving methods for collecting
and analyzing the experimental and quantum chemical spectroscopic infor-
mation as well as our validated data advocated for deposition in databases.
In Part I, we derived energy levels and transition wavenumbers for the water
isotopologues H217O and H2
18O. This was done using the Measured Active
Rotational-Vibrational Energy Levels (MARVEL) protocol of Furtenbacher
et al. [3, 4, 5], which was refined during Part I to allow for the treatment
of larger datasets and to perform a significant amount of checking in order
to minimize errors and inconsistencies in the initial experimental transition
data.
In this work we apply MARVEL to the HD16O, HD17O, and HD18O iso-
topologues of the water molecule. HD16O, singly deuterated water, has a
fractional abundance in the earth’s atmosphere, compared to H216O, of about
0.0003 (note that the natural HD17O/H217O and HD18O/H2
18O abundances
have a similar, about 3 × 10⁻⁴ value). Even though a trace species, at-
mospheric absorption by HDO can be significant. This is particularly true
for HD16O since some of its absorption spectrum, unlike that of H217O and
H218O, is significantly shifted from that of H2
16O. Observation of atmospheric
3
HDO spectra has long been used on both Earth [6] and other planets [7, 8] as
a proxy to understand their climatic evolution. Atmospheric HDO spectra
are also being extensively observed because of the information they provide
on the transport of water vapor into the stratosphere [9, 10]. Abundance
of HDO relative to H2O can vary significantly; the proportion of HDO on
Venus, for example, is over one hundred times that of the terrestrial value
[11].
Astrophysical observations of HDO are also potentially important.[9] Deu-
terium was formed in the first few minutes after the Big Bang. As D is burnt
rapidly in stellar interiors, the abundance of D has been decreasing since
this time. Deuterium burns in objects with masses greater than about 13
times that of Jupiter, which is one way of defining the boundary between a
brown dwarf and a planet. Observations of HDO in the atmospheres of such
objects, which are cool enough to be largely molecular but hot by terres-
trial standards, could be the key to a deuterium test [12] that would distin-
guish between planets and other sub-stellar objects. In the cold interstellar
medium fractionation effects become important leading to an expected over-
abundance of HDO [13]. Astronomical applications of water spectra there-
fore require spectral data appropriate for very low temperatures up to stellar
temperatures of about 3000 K.
As emphasized in Part I, a distinguishing feature of the present series of
IUPAC-sponsored studies is the joint utilization of all available experimental
and the best theoretical line and level data, with a long-term aim to create
a complete linelist for all water isotopologues. While determination of a
complete linelist is outside the scope of present-day experiments, it can be
determined by means of sophisticated first-principles quantum mechanical
computations. Consequently, as long as experiments have a higher precision
than even the most advanced computations that can be performed for a
molecule of the size of water, the complete linelist will necessarily contain
accurate experimental data and less accurate computational data. MARVEL-
4

type efforts help to (a) replace as many computed lines as possible with their
experimental counterparts, (b) validate and ideally reduce the uncertainty
with which a transition has been determined, and (c) facilitate the assignment
of experimental spectra.
2. Methods, input data, and data treatment
The methods employed in this study for collecting and critically evalu-
ating experimental transition wavenumbers and their uncertainties and for
inverting the wavenumbers in order to obtain the best possible energy levels
with uncertainties are based on the MARVEL procedure [3, 4, 5] involving
the iterative robust reweighting scheme [14]. During a MARVEL analysis
we simultaneously process all the available assigned experimental lines and
the associated energy levels for the chosen isotopologue. MARVEL is not
designed to determine any new energy levels. However, from the MAR-
VEL energy levels obtained one can determine transitions whether they have
been measured or not. The reweighting scheme means that uncertainties
for certain selected transitions are changed (increased) during iterations of
the MARVEL procedure. After cleansing of the database and applying the
iterative robust reweighting algorithm of MARVEL, a database is created
containing self-consistent and correctly assigned transitions and the seem-
ingly best possible related uncertainties supported by the database. Energy
levels, and their uncertainties, determined from these transitions are in har-
mony with the measured transitions and their (adjusted) uncertainties.
The first step in the MARVEL procedure is to split the transition data
into spectroscopic networks (SN). SNs contain all interconnecting rotational-
vibrational energy levels supported by the grand database of the transitions.
For HDO, as there is no nuclear spin symmetry, the vast majority of the
data forms a single SN. Other inter-connecting but unattached transition
networks are designated as floating networks (FSNs) or, in the case of a single
transition with no energy level in common with any of the other transitions
5

in the compilation, orphans (ORPs).
For HD16O there is a considerable number of experimental data sources
available [15, 16, 17, 18, 19, 20, 21, 22, 23, 24, 25, 26, 27, 28, 29, 30, 31, 32,
33, 34, 35, 36, 37, 38, 39, 40, 41, 42, 43, 44, 45, 46, 47, 48, 49, 50, 51, 52, 53,
54, 55, 56, 57, 58, 59, 60, 61, 62, 63, 64, 65, 66, 67, 68, 69, 70, 71, 72, 73, 74,
75, 76, 77, 78, 79, 80, 81, 82, 83, 84, 85, 86, 87, 88, 89, 90, 91, 92, 93, 94, 95,
96, 97, 98, 99, 100, 101, 102, 103, 104, 105, 106, 107, 108, 109]. In particular,
we note that a number of hot HD16O spectra [64, 82, 86, 106] are included in
the above list. Hot spectra are usually considerably richer in transitions but
have significantly larger uncertainties and a higher chance of misassignment
than spectra recorded at room temperature. As expected, there is a much
smaller number of publications reporting measured and assigned transitions
for HD17O [61, 110, 111] and HD18O [42, 51, 61, 102, 108, 110, 112, 113, 114,
115].
Tables 2–4 provide, for each data source, experimental information related
to the spectra of HD16O, HD17O, and HD18O, respectively. The number of
originally measured (A) and validated (V) transitions for each data source is
given there, as well. Due to the large number of related experimental studies,
a nearly continuous coverage has been achieved for HD16O up to 22 800 cm−1
but not for the other two isotopologues. As modern measurements of pure
rotational transitions at microwave frequencies (< 30 cm−1) are very scarce,
the microwave transitions were mostly obtained from early works and are
limited in number. Conversely, early infrared measurements, such as that
by Benedict et al. [29], have largely been superceded by more recent and
more accurate measurements and were therefore largely omitted from the
final compilation.
To be included in our tabulation, data sources must include original ex-
perimental line positions with uncertainties, line assignment, and informa-
tion on the experimental conditions under which the experimental data were
recorded. The latter data are summarized in the column ‘Physical condi-
6

tions’ in Tables 2–4. In each case the data source is identified with a tag, as
specified in Part I, based on year of publication and the names of the authors.
Abundance is a particular issue with spectra of HDO. Since a pure sample
of HDO would partially disproportionate to H2O and D2O, it is not possible
to record spectra of pure HDO. In practice, 50 % HDO is normally the best
that can be achieved. The presence of significant quantities of H2O and
D2O in any HDO sample means that a good knowledge of spectra of these
species is a prerequisite for analysing spectra of HDO. Furthermore, it is very
difficult to get complete spectral coverage for HDO since some transitions are
obscured by strong lines associated with H2O or D2O.
Most of the spectra were obtained by Fourier transform spectroscopy
(FTS), which gives a wide spectral coverage from the microwave region to
the near ultraviolet. In order to detect weak lines, FTS spectrometers have
been equipped with long multipass cells. Absorption path lengths as large
as 433 and 1804 m have been achieved with the cells available at Kitt Peak
and Reims, respectively, providing a large number of observed transitions,
mostly in the near infrared (NIR) region.
Laser-based methods, such as CRDS (cavity ringdown spectroscopy) and
ICLAS (intracavity laser absorption spectroscopy), are limited to certain
spectral regions depending on the availability of tunable laser sources. These
techniques have specific advantages in terms of sensitivity and spectral res-
olution, which make them particularly suitable for the characterization of
spectral regions with weak absorption features. This is why extensive in-
vestigations with laser-based methods were mostly limited to transparency
windows or to the visible region. In spite of the small natural abundance
of even HD16O, part of the data were obtained from spectra recorded with
water in natural abundance.
2.1. Pre-MARVEL validation
As for Part I, the experimental databases assembled for the three HDO
isotopologues were checked for transcription problems or problems charac-
7

terizing the original data source. The following checks were made apart from
the trivial checks for formatting incompatibilities and looking for entries with
zero uncertainties. The dataset of transitions was searched looking for cases
where the Ka +Kc sum, where Ka and Kc are the usual asymmetric top rigid
rotor quantum numbers, had a value different from J or J + 1, where J is
the rotational quantum number. We also searched for obvious duplications
in the dataset and a warning was issued if this happened. Overall, fewer
problems were detected for the HDO isotopologues than observed for H217O
and H218O in Part I [1].
2.2. Assignment, labels
It is a requirement of the MARVEL protocol that the dataset contains
a single unique assignment to label both the lower and the upper states
involved in each transition. In this work we retain the order of vibrational
labels applicable to H216O for HDO, i.e., v1, v2, and v3 stand for the OD
stretching, bending, and OH stretching quantum numbers, respectively, and
they provide the vibrational label (v1 v2 v3). Note that in some works, such
as Ref. [116], v1 and v3 are reversed. We use the standard asymmetric top
quantum numbers [J Ka Kc] or JKaKc to label the rotational states. Thus,
the rotation-vibration levels of each isotopologue are identified uniquely by
six labels altogether.
Before processing the published transition data we checked, as thoroughly
as possible, whether the assignments were correct and consistent. Rovibra-
tional labels, which can be used for checking the (v1 v2 v3) [J Ka Kc] labels,
can be taken from computations based on the use of an effective Hamilto-
nian (EH). In the EH approach, all vibrational states are combined in the
polyads of interacting states based on the ratio between the harmonic fre-
quencies ω1, ω2, and ω3. For HD16O, ω1 is at 2823 cm−1, very close to twice
ω2, which is at 1444 cm−1, while ω3, at 3887 cm−1, lies much higher. This
structure leads to a series of well isolated (0 0 nv3) vibrational states, whose
energy levels can be easily fitted, and, consequently, labeled within the EH
8

approach. At the same time, the coincidence of ω1 and 2ω2, and the strong
centrifugal distortion effects inherent in HDO, result in strong and numer-
ous anharmonic resonances. These result in the formation of the resonance
polyads which often include highly excited bending states. This complicates
proper EH analysis and therefore inhibits the process of labeling for many
of the high-lying energy levels. We note that to run MARVEL successfully
such labels simply have to be self-consistent; the MARVEL process itself says
nothing about the physical basis of the labels [117].
Validation of the assignments attached to the observed transitions was
performed as follows. All transitions were examined for consistency of the up-
per levels derived from combination difference (CD) relations. This method
is a simple and powerful tool for the assignment of rovibrational spectra;
however, it is often inapplicable to weak transitions because of the incom-
pleteness of the set of observed transitions. All the transitions associated
with a given rotational level of the (0 0 0) vibrational ground state have
been considered for combination differences. At this stage, conflicting la-
bels could be easily traced and corrected. This step was helped considerably
by the availability of results from variational nuclear motion computations
[118]. Where necessary, labels were changed assuming similar increases in
rotational energies as a function J and Ka for similar vibrational states with
the same v2 quantum number as well as quasi-degeneracy of rotational levels
with Ka close to J or Ka equal to 0 or 1. In the end, consistent labeling
has been established for all the assignments considered. We recommend that
the labeling provided in this paper should be generally adopted, although in
cases of strongly perturbed energy levels there is some remaining uncertainty.
2.3. Uncertainties
Within the MARVEL protocol reasonable estimates for the accuracy of
the observed transitions must be provided. Despite the adjustments by the
robust reweighting scheme, false uncertainties attached to the transitions can
noticeably deteriorate the accuracy of the MARVEL energy levels.
9

In the majority of the data sources proper experimental uncertainties are
not given for each transition. Often only the general accuracy of the data for
the region investigated is provided. For a few publications we were forced
to estimate the experimental uncertainties. As no values were presented in
the original source, these were based on average values characteristic of the
experimental setup exploited in the measurement.
For further important adjustment of the uncertainties of the transitions
see sections 2.6 and 2.8.
2.4. Variational validation
As an independent validation of the experimental transition wavenum-
bers and the derived MARVEL energy levels, systematic comparisons were
made with the results of state-of-the-art variational nuclear motion calcula-
tions. For this comparison the newly computed VTT HD16O linelist [118]
was used; this linelist was computed using the spectroscopically determined
HDO potential energy hypersurfaces of Yurchenko et al. [119], the so-called
CVR dipole moment surface [120], and the DVR3D nuclear motion program
suite [121].
When variational results are used for validation, we can rely on a well-
known feature of such calculations: the smooth and slow variation of obs −calc residuals for the energy levels of a particular vibrational state having
the same Ka and increasing J values [122]. The longest obs − calc sequences
could be investigated for the hot spectra, where transitions involving J as
high as 30 have been detected. Examples of the obs − calc deviations for the
energy levels of the (0 0 0) state with Ka = 1− 5 are shown in Fig. 1. The
obs − calc residuals for levels with a given Ka but different Kc increase as J
increases, hindering the assignment of the dense observed spectrum without
detailed consideration of these near degeneracies.
The trends in obs − calc for the highly excited vibrational states are
not particularly smooth as they can be strongly perturbed by nearby states.
10
Examples of perturbations of the obs − calc trend due to resonance interac-
tions can be observed in Fig. 2. Cases with erratic obs − calc trends were
additionally checked to see whether the calculated energy level set includes
the resonance partner, whose energy level has to be close to the level under
investigation and whose quantum numbers should satisfy the conventional
Coriolis-, Fermi-, or Darling−Dennyson-type resonance interaction rules, or
some combination of them. We stress that so-called HEL (highly excited
local) resonances [123], which do not obey conventional resonance selection
rules and can involve energy levels with a large difference in the v2 bending
quantum number, are especially strong in HDO due to the close coincidence
between the ω1 and 2ω2 harmonic frequencies [100].
Those transitions which involved a MARVEL energy level that did not
have a matching variational counterpart within the obs − calc trend estab-
lished for the corresponding vibrational state were “deleted” from the input
to MARVEL (by adding a minus sign in front of the wavenumber) and the
MARVEL process was repeated until all MARVEL levels had variational
counterparts within the appropriate obs − calc trend; possible resonance
distortions of these trends were also taken into account. The final, accepted
obs − calc values vary in magnitude from 0.01 up to 0.32 cm−1 depending
on the vibrational state and the J and Ka values. A comparison of the ex-
perimental (MARVEL) and variational [118] energy levels is given in Fig. 3.
For transitions removed at this stage, see the appropriate comments in the
footnotes supplementing Tables 2–4. Levels which the Task Group considers
to be marginally reliable were retained but are flagged in the appropriate
entry (see the Supplementary Material).
2.5. Hot transitions
Unsuprisingly, the hardest levels to validate came from the hot transitions
observed and assigned in 03JaTeBeZo [86], due to the high density of both
predicted and observed transitions and the possibility of transitions to a given
upper level originating from lower (sometimes unknown) levels belonging to
11
different vibrational states. During the process of comparing the observed
and calculated energy levels it was discovered that 03JaTeBeZo often gave
only one assignment to transitions involving quasi-degenerate lower and up-
per levels. This impeded proper evaluation of the second component of the
quasi-degenerate pair and, consequently, led to the disconnection of many
experimental energy levels which are connected to these second components.
To solve this problem, the second components of the quasi-degenerate transi-
tions omitted in 03JaTeBeZo were added to the data based on predictions of
the VTT variational linelist. Experimental transitions were considered to be
degenerate if their variational centers coincided within 0.015 cm−1, since the
smallest difference between experimentally observed lines in 03JaTeBeZo was
always at least 0.02 cm−1. By this means about 1600 extra line assignments
were added to the 03JaTeBeZo list (marked with D, see the Supplementary
Material).
For the validation procedure we also used the unpublished experimental
linelist of hot HDO emission spectra recorded by Mellau in the 400–900 cm−1
region [64]. Due to peculiarities of the hot spectrum assignment, deleting
one unconfirmed experimental transition may lead to the loss of many exper-
imental energy levels derived in 03JaTeBeZo. For this reason we assigned 65
transitions using the unassigned lines from the experimental linelist attached
to 03JaTeBeZo (for details see the Supplementary Material).
2.6. Recalibration
As discussed in Part I, the absolute accuracies of different datasets vary,
producing systematic offsets in the observed line positions. In massive compi-
lations to gather measurements obtained over decades, these differences can
arise partly because calibration standards improve over time. In the early
1980’s, advanced techniques produced frequency measurements that became
the dominant standards for infrared spectroscopy with reported accuracies
between 3 × 10⁻⁷ and 2 × 10⁻⁵ cm−1: CO2 at 10 µm [124], the P(7) line of
CH4 at 3.34 µm [125], and the 2−0 band of CO at 2.3 µm [126]. Using these
12

frequency standards, transitions of other gases were recalibrated but often
with lesser precision ( 1× 10⁻⁴ cm−1). With FTS data, such corrections are
easily made just by applying a multiplicative factor obtained as a ratio of the
new to the old positions. Water, being ubiquitous in spectrometer chambers
and having many strong bands throughout the infrared, was reinvestigated
against the then-exceptional quality frequencies [124, 125, 126]. For example,
the best prior ν2 band line positions near 6 µm [47] were altered by a factor
of 0.999 999 77 [127]. Later, newer technological developments resulted in
calibration standards in the near-infrared, such as C2H2 near 1.5 µm [128]
and atomic potassium near 0.77 µm [129].
During the course of this study it became apparent that there are several
sources of HDO data which might suffer from calibration problems. The
sources identified include 78KaKaKy [43], 83Guelachv [47], 93Tothb [61],
86FlCaMaGu [52], 89OhSa [55], 91RiSmDeBe [58], 99HuLiHeCh [70], and
99Toth [72]. It is straightforward to determine multiplicative calibration
factors with MARVEL by minimizing the root-mean-square (rms) deviation
between the observed transitions with wavenumbers scaled with a given cali-
bration factor and those produced by MARVEL from the energy levels. This
minimization was performed sequentially for all the problematic data sources;
Table 1 gives the calibration factors we determined for cases where our anal-
ysis gave a result which differed significantly from unity. For the sources
91RiSmDeBe, 93Tothb, and 99Toth the MARVEL analysis suggests that no
recalibration is needed or possible; thus, these transitions were not altered.
For 78KaKaKy, 83Guelachv, 86FlCaMaGu, and 89OhSa the experimental
FTS data were adjusted using the calibration factors determined. Only the
recalibrated results were used in the final data analysis.
Improvement of the ICLAS data via recalibration was attempted only in
one case here [75]. This is despite the fact that there are known calibration
problems with some of the ICLAS data [100]. These arise because different
calibration lines are used for every few cm−1, making it difficult to determine
13
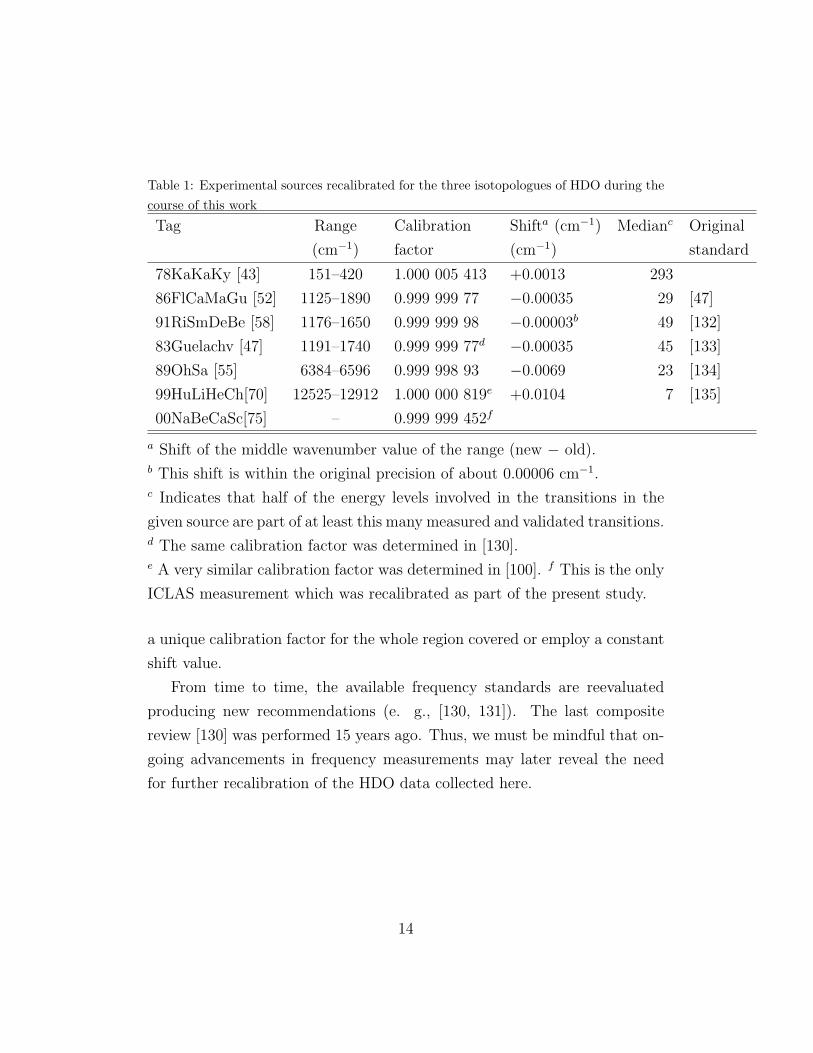
Table 1: Experimental sources recalibrated for the three isotopologues of HDO during thecourse of this work
Tag Range Calibration Shifta (cm−1) Medianc Original
(cm−1) factor (cm−1) standard
78KaKaKy [43] 151–420 1.000 005 413 +0.0013 293
86FlCaMaGu [52] 1125–1890 0.999 999 77 −0.00035 29 [47]
91RiSmDeBe [58] 1176–1650 0.999 999 98 −0.00003b 49 [132]
83Guelachv [47] 1191–1740 0.999 999 77d −0.00035 45 [133]
89OhSa [55] 6384–6596 0.999 998 93 −0.0069 23 [134]
99HuLiHeCh[70] 12525–12912 1.000 000 819e +0.0104 7 [135]
00NaBeCaSc[75] – 0.999 999 452f
a Shift of the middle wavenumber value of the range (new − old).b This shift is within the original precision of about 0.00006 cm−1.c Indicates that half of the energy levels involved in the transitions in the
given source are part of at least this many measured and validated transitions.d The same calibration factor was determined in [130].e A very similar calibration factor was determined in [100]. f This is the only
ICLAS measurement which was recalibrated as part of the present study.
a unique calibration factor for the whole region covered or employ a constant
shift value.
From time to time, the available frequency standards are reevaluated
producing new recommendations (e. g., [130, 131]). The last composite
review [130] was performed 15 years ago. Thus, we must be mindful that on-
going advancements in frequency measurements may later reveal the need
for further recalibration of the HDO data collected here.
14
2.7. Post-MARVEL validation
While data handling within the MARVEL process is performed as auto-
matically as possible, for a number of transitions, which proved to be clear
outliers by combination difference relations, the experimental uncertainties
were increased manually (see footnotes to Tables 2–4) by a process we call
post-MARVEL validation.
This extra validation and the subsequent adjustment was done when the
energy of an upper rotational-vibrational state deviated far more from the
corresponding mean value established by the lower MARVEL energy levels
plus the transition wavenumbers than the stated experimental uncertainty.
The MARVEL protocol can make similar adjustments automatically if the
error associated with a transition is an outlier and all the data have simi-
lar accuracy. However, a problem arises if an erroneously small experimental
uncertainty is attached to what is actually a much less accurate experimental
datum, the same level is involved in several measurements, and other tran-
sitions in the combination difference relations, though are consistent, have
formally much larger uncertainties. In this case the MARVEL energy level
will be determined by the formally most accurate transition which, in fact,
represents an outlier.
For HDO, all data declared to have very high accuracy, such as those
from 07VoNaCaCo [100], 07JeDaReTy [101], 97Tothc [67], and 07MiWaKaCa
[103], were subject to post-MARVEL checks. In this context we note that
sometimes the experimental uncertainty attached to a line in the original
source reflects the quality of the line profile fit rather than the real accuracy
with which the wavenumber was determined.
This validation was not performed in Part I. Thus, in the active update
of the data of H217O and H2
18O presented in the Appendix of this paper the
energy levels were subjected to a post-MARVEL validation.
15
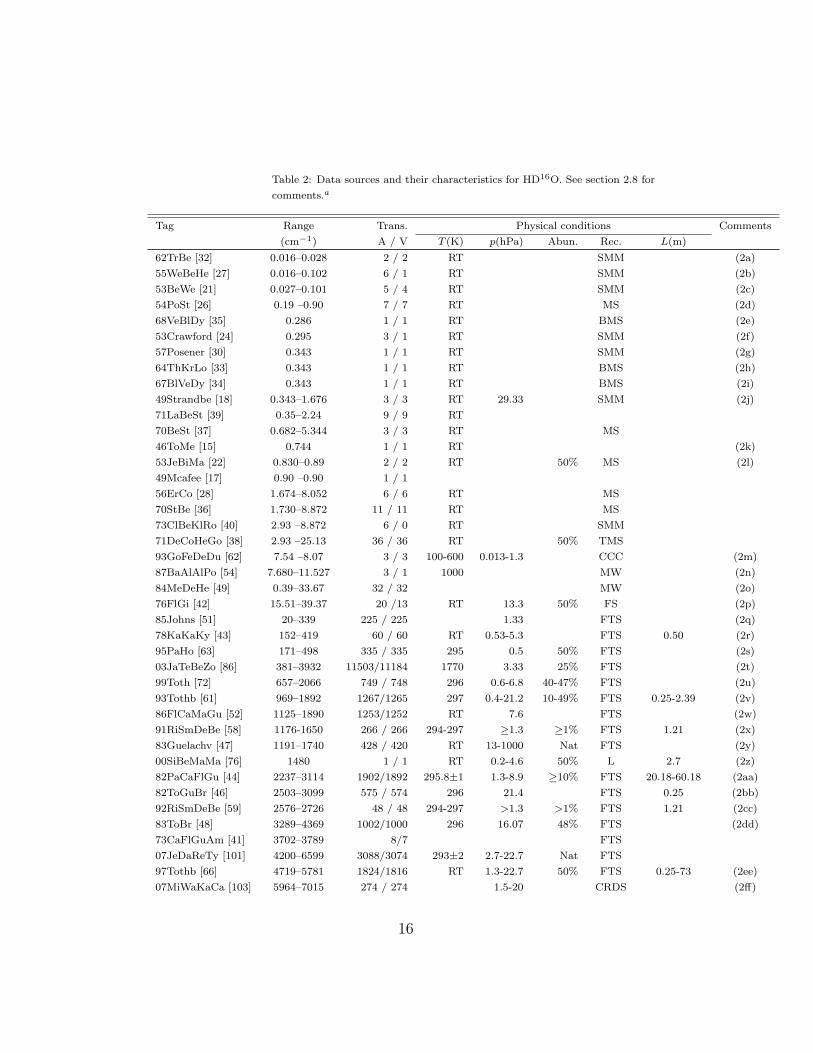
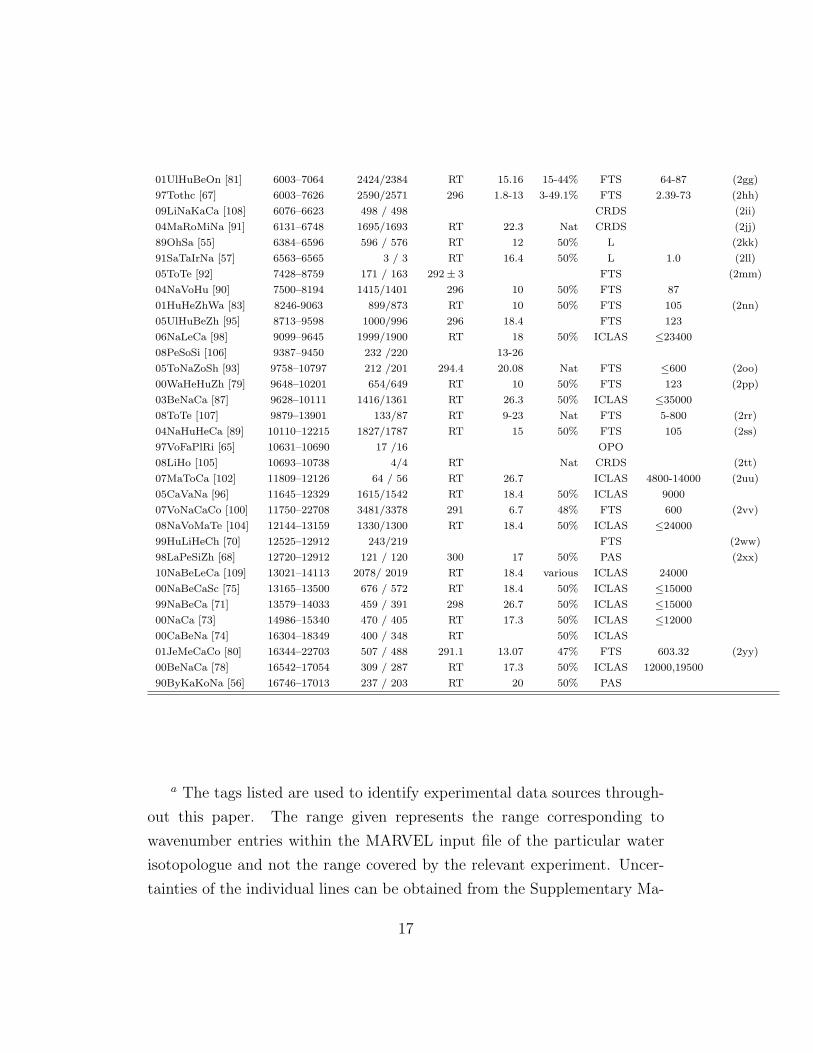
Table 2: Data sources and their characteristics for HD16O. See section 2.8 for
comments.a
Tag Range Trans. Physical conditions Comments
(cm−1) A / V T (K) p(hPa) Abun. Rec. L(m)
62TrBe [32] 0.016–0.028 2 / 2 RT SMM (2a)
55WeBeHe [27] 0.016–0.102 6 / 1 RT SMM (2b)
53BeWe [21] 0.027–0.101 5 / 4 RT SMM (2c)
54PoSt [26] 0.19 –0.90 7 / 7 RT MS (2d)
68VeBlDy [35] 0.286 1 / 1 RT BMS (2e)
53Crawford [24] 0.295 3 / 1 RT SMM (2f)
57Posener [30] 0.343 1 / 1 RT SMM (2g)
64ThKrLo [33] 0.343 1 / 1 RT BMS (2h)
67BlVeDy [34] 0.343 1 / 1 RT BMS (2i)
49Strandbe [18] 0.343–1.676 3 / 3 RT 29.33 SMM (2j)
71LaBeSt [39] 0.35–2.24 9 / 9 RT
70BeSt [37] 0.682–5.344 3 / 3 RT MS
46ToMe [15] 0.744 1 / 1 RT (2k)
53JeBiMa [22] 0.830–0.89 2 / 2 RT 50% MS (2l)
49Mcafee [17] 0.90 –0.90 1 / 1
56ErCo [28] 1.674–8.052 6 / 6 RT MS
70StBe [36] 1.730–8.872 11 / 11 RT MS
73ClBeKlRo [40] 2.93 –8.872 6 / 0 RT SMM
71DeCoHeGo [38] 2.93 –25.13 36 / 36 RT 50% TMS
93GoFeDeDu [62] 7.54 –8.07 3 / 3 100-600 0.013-1.3 CCC (2m)
87BaAlAlPo [54] 7.680–11.527 3 / 1 1000 MW (2n)
84MeDeHe [49] 0.39–33.67 32 / 32 MW (2o)
76FlGi [42] 15.51–39.37 20 /13 RT 13.3 50% FS (2p)
85Johns [51] 20–339 225 / 225 1.33 FTS (2q)
78KaKaKy [43] 152–419 60 / 60 RT 0.53-5.3 FTS 0.50 (2r)
95PaHo [63] 171–498 335 / 335 295 0.5 50% FTS (2s)
03JaTeBeZo [86] 381–3932 11503/11184 1770 3.33 25% FTS (2t)
99Toth [72] 657–2066 749 / 748 296 0.6-6.8 40-47% FTS (2u)
93Tothb [61] 969–1892 1267/1265 297 0.4-21.2 10-49% FTS 0.25-2.39 (2v)
86FlCaMaGu [52] 1125–1890 1253/1252 RT 7.6 FTS (2w)
91RiSmDeBe [58] 1176-1650 266 / 266 294-297 ≥1.3 ≥1% FTS 1.21 (2x)
83Guelachv [47] 1191–1740 428 / 420 RT 13-1000 Nat FTS (2y)
00SiBeMaMa [76] 1480 1 / 1 RT 0.2-4.6 50% L 2.7 (2z)
82PaCaFlGu [44] 2237–3114 1902/1892 295.8±1 1.3-8.9 ≥10% FTS 20.18-60.18 (2aa)
82ToGuBr [46] 2503–3099 575 / 574 296 21.4 FTS 0.25 (2bb)
92RiSmDeBe [59] 2576–2726 48 / 48 294-297 >1.3 >1% FTS 1.21 (2cc)
83ToBr [48] 3289–4369 1002/1000 296 16.07 48% FTS (2dd)
73CaFlGuAm [41] 3702–3789 8/7 FTS
07JeDaReTy [101] 4200–6599 3088/3074 293±2 2.7-22.7 Nat FTS
97Tothb [66] 4719–5781 1824/1816 RT 1.3-22.7 50% FTS 0.25-73 (2ee)
07MiWaKaCa [103] 5964–7015 274 / 274 1.5-20 CRDS (2ff)
16
01UlHuBeOn [81] 6003–7064 2424/2384 RT 15.16 15-44% FTS 64-87 (2gg)
97Tothc [67] 6003–7626 2590/2571 296 1.8-13 3-49.1% FTS 2.39-73 (2hh)
09LiNaKaCa [108] 6076–6623 498 / 498 CRDS (2ii)
04MaRoMiNa [91] 6131–6748 1695/1693 RT 22.3 Nat CRDS (2jj)
89OhSa [55] 6384–6596 596 / 576 RT 12 50% L (2kk)
91SaTaIrNa [57] 6563–6565 3 / 3 RT 16.4 50% L 1.0 (2ll)
05ToTe [92] 7428–8759 171 / 163 292± 3 FTS (2mm)
04NaVoHu [90] 7500–8194 1415/1401 296 10 50% FTS 87
01HuHeZhWa [83] 8246-9063 899/873 RT 10 50% FTS 105 (2nn)
05UlHuBeZh [95] 8713–9598 1000/996 296 18.4 FTS 123
06NaLeCa [98] 9099–9645 1999/1900 RT 18 50% ICLAS ≤23400
08PeSoSi [106] 9387–9450 232 /220 13-26
05ToNaZoSh [93] 9758–10797 212 /201 294.4 20.08 Nat FTS ≤600 (2oo)
00WaHeHuZh [79] 9648–10201 654/649 RT 10 50% FTS 123 (2pp)
03BeNaCa [87] 9628–10111 1416/1361 RT 26.3 50% ICLAS ≤35000
08ToTe [107] 9879–13901 133/87 RT 9-23 Nat FTS 5-800 (2rr)
04NaHuHeCa [89] 10110–12215 1827/1787 RT 15 50% FTS 105 (2ss)
97VoFaPlRi [65] 10631–10690 17 /16 OPO
08LiHo [105] 10693–10738 4/4 RT Nat CRDS (2tt)
07MaToCa [102] 11809–12126 64 / 56 RT 26.7 ICLAS 4800-14000 (2uu)
05CaVaNa [96] 11645–12329 1615/1542 RT 18.4 50% ICLAS 9000
07VoNaCaCo [100] 11750–22708 3481/3378 291 6.7 48% FTS 600 (2vv)
08NaVoMaTe [104] 12144–13159 1330/1300 RT 18.4 50% ICLAS ≤24000
99HuLiHeCh [70] 12525–12912 243/219 FTS (2ww)
98LaPeSiZh [68] 12720–12912 121 / 120 300 17 50% PAS (2xx)
10NaBeLeCa [109] 13021–14113 2078/ 2019 RT 18.4 various ICLAS 24000
00NaBeCaSc [75] 13165–13500 676 / 572 RT 18.4 50% ICLAS ≤15000
99NaBeCa [71] 13579–14033 459 / 391 298 26.7 50% ICLAS ≤15000
00NaCa [73] 14986–15340 470 / 405 RT 17.3 50% ICLAS ≤12000
00CaBeNa [74] 16304–18349 400 / 348 RT 50% ICLAS
01JeMeCaCo [80] 16344–22703 507 / 488 291.1 13.07 47% FTS 603.32 (2yy)
00BeNaCa [78] 16542–17054 309 / 287 RT 17.3 50% ICLAS 12000,19500
90ByKaKoNa [56] 16746–17013 237 / 203 RT 20 50% PAS
a The tags listed are used to identify experimental data sources through-
out this paper. The range given represents the range corresponding to
wavenumber entries within the MARVEL input file of the particular water
isotopologue and not the range covered by the relevant experiment. Uncer-
tainties of the individual lines can be obtained from the Supplementary Ma-
17
terial. Trans. = transitions, with A = number of assigned transitions in the
original paper, V = number of transitions validated in this study. T = tem-
perature (K), given explicitly when available from the original publication,
with RT = room temperature. p = pressure (hPa). Abun. = abundance (%)
of the given isotopologue in the gas mixture, with Enr = enriched and Nat
= natural abundance. Rec. = experimental technique used for the recording
of the spectrum, with SMM = Stark-modulated microwave spectrometer, L
= different lasers, CCC = collisionally cooled cell, MC = microwave cavities,
TMS = tunable microwave spectrometer, PAS = photo-acoustic spectrome-
ter, and OPO = optical parametric oscillator.
2.8. Comments on the data sources for HD16O given in Table 2
(2a) 62TrBe A spectrometer containing a Stark-modulated microwave coax-
ial cavity was used to measure nine hyperfine components of two rotational
transitions, the 331 → 330 and 542 → 541 lines at 487 and 825 MHz, respec-
tively. The hyperfine components are not included in the MARVEL analysis.
(2b) 55WeBeHe The apparatus of Ref. [21] was used for the measurements.
Frequencies and absorption coefficients of six transitions between 486 and
3045 MHz are reported. Frequencies of five of these have been previously
measured in Ref. [21].
(2c) 53BeWe The spectrometer employed Stark modulation and operated at
frequencies lower than 600 MHz.
(2d) 54PoSt The number of original measured line frequencies is 5. In addi-
tion, the authors reproduce three frequencies from two other measurements:
one transition from 49Mcafee [17] and two transitions from “Microwave Spec-
troscopy Laboratory, Research Laboratory of Electronics, Massachusetts In-
stitute of Technology (unpublished work)”. Note also that one of the five
frequencies of this source (8577.7±0.1 MHz, the 744 → 743 transition) was
previously reported in 53BuSt [23] but without an uncertainty.
(2e) 68VeBlDy The hyperfine structure of one rotational line, at 8577.812
18

MHz, was investigated with a beam maser spectrometer. The wrong rota-
tional assignment, 743 → 745, of the reported line was changed to the correct
744 → 743. Measured and calculated values of the hyperfine coupling con-
stants are reported but not used here.
(2f) 53Crawford Three observed lines are reported in this paper. The 8 577.80±0.08 and 8 837.22 ± 0.12 MHz transitions correspond to HD16O transitions
744 → 743 and 1056 → 1055, respectively; only the latter was included in the
final transitions file. The third one at 8884.83 MHz is neither an HDO nor a
D2O line.
(2g) 57Posener Fine structure of the 221 → 220 rotational line reported pre-
viously in Ref. [18] was examined by Stark modulation spectroscopy. Five
components were observed but not employed here.
(2h) 64ThKrLo Nine hyperfine components of the 221 → 220 rotational tran-
sition have been reported at about 10 278.2455 MHz with a beam maser
spectrometer.
(2i) 67BlVeDy The hyperfine structure of the 221 → 220 rotational line at
10 278.246 MHz was investigated with a beam maser spectrometer. Measured
values of the hyperfine coupling constants as well as the electric quadrupole
coupling tensor are reported but not employed here.
(2j) 49Strandbe Four rotational absorption transitions, 221 → 220, 322 → 321,
414 → 321, and 533 → 532, have been observed and identified using the Stark
effect. The frequencies of the first three transitions are given in the paper.
The last one was reported earlier in Ref. [16].
(2k) 46ToMe Frequency of one pure rotational transition, 533 → 532, was
reported. The frequency value, 22 309± 5 MHz, is rather far from the more
precise values reported later for the same transition.
(2l) 53JeBiMa The frequencies of four rotational lines have been observed
in microwave absorption. One of them, 26 880.47 ± 0.1 MHz, was observed
previously [17]. Two lines at 24 884.85±0.1 (A) and 26 880.47±0.1 (B) MHz
correspond to the HD16O transitions 845 → 844 and 624 → 717, respectively.
19

The two unassigned lines at 30 182.57 ± 0.1 (C) and 30 778.62 ± 0.1 MHz
(D) correspond to D216O transitions 963 → 872 and 964 → 871, respectively.
Stark spectra of all four lines and Zeeman spectra of the A and B lines were
recorded.
(2m) 93GoFeDeDu Three microwave transitions of HD16O, reported pre-
viously by 84MeDeHe [49], were broadened by H2, N2, O2, and He for
100 ≤ T ≤ 600 K. Measurements made at 10 mTorr of HD16O and about 40
broadening gas pressures up to 1 Torr.
(2n) 87BaAlAlPo Three rotational transitions in the (0 1 0) vibrational
state are reported. Only one of them, 414 → 321 at 230 427.34 MHz, is con-
firmed. The other transitions, 633 → 726 at 334 018.30 MHz and 524 → 413 at
345 795.94 MHz, have very large discrepancies as compared to the expected
frequency values (about 335 138 and 346 620 MHz, respectively).
(2o) 84MeDeHe 32 newly reported rotational transitions complemented by
transitions reported previously [40].
(2p) 76FlGi Among the 20 HD16O transition only 13 were validated. The
7 excluded transitions have differences between reported and expected fre-
quency values larger than 0.02 cm−1.
(2q) 85Johns Far infrared pure rotational spectra of six water isotopologues
were recorded with pressures less than 1 Torr (only for wavenumbers below
30 cm−1 was the pressure raised to 2 Torr) to minimize pressure shifts and
broadening. The list of HD16O transitions includes 84 MW frequencies from
84MeDeHe [49] and 212 measured line positions which correspond to 225
transitions. The experimental uncertainty was raised to 0.0002 cm−1 instead
of 0.00005 cm−1 stated originally.
(2r) 78KaKaKy Three spectra were recorded but only for one spectrum
(150–320 cm−1, p = 1.8 Torr) was the HD16O abundance greater than nat-
ural. The experimental accuracy has been estimated in the original source
to be better than 0.001 cm−1 under favorable conditions. After recalibra-
tion, 65% (39 lines) of the 65 observed transitions agree with the MARVEL
20

transitions within the declared experimental accuracy of 1.0 × 10⁻³ cm−1.
All original experimental uncertainties equal to 5 × 10⁻⁴ were changed to
1.5× 10⁻³.
(2s) 95PaHo Pure rotational spectra of 16O water isotopic species were mea-
sured with a high resolution FTS in order to obtain better calibration line
positions in the 110 – 500 cm−1 spectral region.
(2t) 03JaTeBeZo Fourier transform emission spectra analyzed together with
line positions obtained in 01PaBeZoSh [82]. Supplementary data for this ar-
ticle contains a list of 32 399 records which correspond to 31 645 unique line
positions. 10 657 rotation-vibration assignments are given in this line list.
745 of them are labeled with “D2O” or “H2O”, probably they are HDO lines
blended by “D2O” and “H2O”, respectively. About 1 600 transitions which
represent the second components of quasi-degenerate transitions, omitted in
the original source, have been added to the list, as well as 65 newly assigned
transitions. After validation of the spectrum, a list of 11 182 transitions has
been included into the final transitions file. Of the 11 182 validated transi-
tions, only 67.9% (7 592 lines) agree with the MARVEL transitions within
the declared experimental uncertainty of 1.0×10⁻³ cm−1, suggesting that the
true experimental accuracy of the line positions can be lower than declared.
Furthermore, all original experimental uncertainties of 5.0× 10⁻³ have been
lowered to 2.0× 10⁻³ cm−1.
(2u) 99Toth High-resolution Fourier-transform spectra were analyzed to ob-
tain line positions and strengths of over 6 000 transitions of HDO and D2O.
For HD16O, line positions and strengths of pure lines and of rovibrational
bands (0 1 0)–(0 0 0), (0 2 0)–(0 1 0), and (1 0 0)–(0 1 0) are reported.
Of the 749 observed transitions reported for HD16O, 95.5% (715 lines) agree
with the MARVEL transitions within the declared experimental uncertainty
of 1× 10⁻⁴ cm−1. There is an asymmetry in the obs – MARVEL deviations
with respect to the zero line: there are 276 positive and 473 negative devi-
ations. This asymmetry concerns mainly the 1 000 − 1 360 cm−1 region. A
21

calibration factor could not be determined.
(2v) 93Tothb Fourier transform spectra in the ν2 band region have been
recorded for the determination of line positions and line intensities of HD16O,
HD17O, and HD18O. Of the 1 267 lines assigned to HD16O, 94.8% (1 201
lines) agree with MARVEL transitions within the declared experimental un-
certainty of 1.2×10⁻⁴ cm−1. An asymmetry is detected in the obs – MARVEL
deviations with respect to zero line: there are 412 positive and 855 negative
deviations. A calibration factor could not be determined as it does not seem
to be constant for the whole spectral region considered.
(2w) 86FlCaMaGu Four spectra recorded between 1 040 and 1 900 cm−1
with different pressures and mixtures of D2O and H2O in order to obtain ν2
line positions of HD16O. After recalibration of the experimental spectrum,
99.3% (1 244 lines) of the 1 253 observed transitions agree with the MAR-
VEL transitions within 2.0×10⁻⁴ cm−1, compared to the stated experimental
uncertainty of 4.0× 10⁻⁴ cm−1. The experimental uncertainties of the lines
between 1 210 and 1 890 cm−1 were decreased from 4×10⁻⁴ to 2×10⁻⁴ cm−1.
As the applied calibration factor was not constant throughout the spectrum,
there is a remaining asymmetry in the obs – MARVEL deviations with re-
spect to the zero line: there are 764 positive and 489 negative deviations. In
the region below 1 200 cm−1 most part of the observed – MARVEL devia-
tions are negative, with a root-mean-square agreement of 3.6 × 10⁻⁴ cm−1.
Uncertainties that belong to the 1 210–1 890 cm−1 interval were changed
from 4.0× 10⁻⁴ cm−1 to 2.0× 10⁻⁴ cm−1.
(2x) 91RiSmDeBe Measured Lorentz-broadening and pressure-shift coeffi-
cients by air, N2, and O2 are presented for the 266 ν2 HD16O lines. Twelve
spectra were recorded at 0.0053 cm−1 resolution. Spectra with buffer gas
were recorded at total sample pressures of about 200, 300, and 400 Torr.
Spectra have been calibrated using 93Tothb [61] data, and then the experi-
mental accuracy has been adopted in this study as 1.2× 10⁻⁴ cm−1, similar
to that of 93Tothb. All 265 observed lines agree with MARVEL transitions
22
within 7.4×10⁻⁵ cm−1. An asymmetry in the obs – MARVEL deviations with
respect to the zero line: there are 182 positive and 83 negative deviations.
A calibration factor could not be determined with the technique employed
in this study as it is not constant for the whole spectral region considered.
Original experimental uncertainties of 5.0 × 10⁻⁴ cm−1 have been adjusted
to 1.2× 10⁻⁴ cm−1.
(2y) 83Guelachv Fourier transform spectra with absorption paths of 16,
24.17, 32.17, and 44.17 m. Due to a calibration problem the original re-
ported transitions had to be scaled by a scale factor of 0.999 999 77 [130].
The MARVEL input file includes only the recalibrated transitions, with the
original uncertainties. After recalibration of the spectrum, 95.1% (407 lines)
of the 428 observed transitions agree with the MARVEL transitions with an
rms deviation of 1.5× 10⁻⁴ cm−1, compared to an experimental uncertainty
of 1.2× 10⁻⁴ cm−1, estimated as an average value of individual experimental
uncertainties attached to every line. As the applied calibration factor was
not constant throughout the spectrum, there is a remaining asymmetry in
the obs – MARVEL deviations with respect to the zero line: there are 151
positive and 277 negative deviations, with the most serious discrepancies in
the 1 400–1 600 cm−1 region.
(2z) 00SiBeMaMa A CO laser was used for observation of the saturated
absorption dip of the nearby ν2 524 → 515 line of HD16O. The absolute fre-
quency of this line was obtained as 1 480.094 038 033 ± 67 × 10−9 cm−1
(44 372 102.973 ± 0.002 MHz).
(2aa) 82PaCaFlGu The 2ν2 and ν1 bands of HD16O were analyzed using
Fourier transform spectra of pure D2O and of 90% H2O – 10% D2O mix-
tures.
(2bb) 82ToGuBr HDO gas samples obtained from different mixtures of H2O
and D2O with concentrations of HD16O estimated as 50, 48, and 28%. For a
number of lines the experimental uncertainties were adjusted from 4× 10⁻³
to 4× 10⁻⁴ cm−1.
23

(2cc) 92RiSmDeBe Absorption spectra recorded for measurements of Lorentz-
broadening coefficients and pressure-induced line-shift coefficients of 48 lines
in the ν1 band of HDO were recorded using the FTS of the Kitt Peak National
Observatory. Gas samples were prepared by mixing distilled H2O with 99.96
atom% D2O. Low pressure (< 1.0 Torr) samples were mixed with samples
diluted with high-purity N2, O2, or ultra zero air at total sample pressures
of about 200, 300, and 400 Torr.
(2dd) 83ToBr FTS spectra recorded by 82ToGuBr [46] [see comment (2bb)]
were studied for line positions and strengths in the 3 289–4 369 cm−1 region.
(2ee) 97Tothb The FTS of the Kitt Peak National Observatory was used
for measuring HD16O spectra with absorption path lengths of 0.25, 2.39, 25,
and 73 m. Of the 1 824 observed transitions, 66.5% (1 213 lines) agree with
the MARVEL transitions with an rms deviation equal to the declared exper-
imental uncertainty of 1.0 × 10⁻⁴ cm−1. The measurement accuracy seems
to be slightly overestimated.
(2ff) 07MiWaKaCa Absorption spectra of natural abundance water vapor
near the 5911.0–5922.5, 5926.0–5941.8, 5957.0–6121.6, and 6475.0–7015.6
cm−1 spectral regions. Pressure values on the order of 10–20 hPa were chosen
in the 1.66 µm region and of about 1.5–2.0 hPa in the 1.455 µm region. Most
of the original experimental uncertainties were increased, from 8.0 × 10⁻⁵
cm−1 to 1.0× 10⁻³ cm−1.
(2gg) 01UlHuBeOn The Bruker IFS 120 HR FTS of the University of Science
and Technology (Hefei, China) was used to record two spectra: the first spec-
trum had a total pressure of 1 516 Pa, 44% HDO and a path length of 87 m;
the second spectrum had a total pressure of 1 500 Pa, 15% HDO and a path
length of 69 m. Transition data supplied by S-M Hu. Of the 2 424 observed
transitions, 92.9% (2 251 lines) agree with the MARVEL transitions with
an rms deviation equal to the declared measurement accuracy of 2.0× 10⁻³
cm−1. There is an asymmetry in the observed–MARVEL deviations with
respect to the zero line: there are 735 positive and 1689 negative deviations.
24
A calibration factor for the whole spectral region covered could not be deter-
mined. For 60% of the reported transitions obs – MARVEL deviations are
less than 0.001 cm−1, confirming that the measurement accuracy is slightly
better than declared.
(2hh) 97Tothc Of the 2 590 observed transitions, 61.8% (1 600 lines) agree
with the MARVEL transitions with an rms deviation equal to the declared
experimental uncertainty of 1.0 × 10⁻⁴ cm−1. The stated measurement ac-
curacy seems to be slightly overestimated.
(2ii) 09LiNaKaCa Absorption spectrum of 18O enriched water was recorded
using CW-CRDS and a series of fibered DFB lasers. The CRDS sensitivity
allowed the detection of lines with intensity as low as 10−28 cm/molecule.
Uncertainties of 2.0× 10⁻³ cm−1 were adjusted to 1.0× 10⁻³ cm−1.
(2jj) 04MaRoMiNa A pressure of 17 Torr was used in the whole spectral
region; additional recordings at 1 Torr pressure were performed above 6 510
cm−1 due to the presence of strong lines. As the HD16O absorption lines have
been observed in natural abundance, they mostly represent weak lines. Thus,
the declared measurement accuracy, better than 0.001 cm−1 on average, for
these lines was decreased to 0.002 cm−1. Of the 1 695 observed transitions,
88.7% (1 503 lines) agree with MARVEL transitions with an rms deviation
equal to the adopted measurement accuracy of 2×10⁻³ cm−1. All transitions
with measurement accuracy of 3× 10⁻³ cm−1 have been changed to 2× 10⁻³
cm−1.
(2kk) 89OhSa Absorption spectra of HDO and D2O recorded using single-
mode distributed feedback semiconductor lasers. After recalibration of the
experimental spectrum, 96.3% (574 lines) of the 596 observed transitions
agree with the MARVEL transitions within an rms deviation of 4.4 × 10⁻³
cm−1, as compared to the measurement accuracy of 5.0× 10⁻³ cm−1.
(2ll) 91SaTaIrNa A near-infrared semiconductor-laser spectrometer was used
for measurements of absolute frequencies of 30 vibration-rotation transitions
of several molecular species. Three HDO frequencies were measured with an
25
accuracy of about 30 MHz and can be used as a calibration standard in the
near infrared region. Vibrational labeling given in the paper was changed by
comparison with other assignments: the band studied is not (2 0 1)–(0 0 0)
but (0 2 1)–(0 0 0).
(2mm) 05ToTe Experimental spectra recorded by Schermaul et al. [136]
were analysed here.
(2nn) 01HuHeZhWa Transitions list supplied by S.-M. Hu. Of the 899 ob-
served transitions, 85.6% (770 lines) agree with the MARVEL transitions
with an rms deviation equal to the declared measurement accuracy of 0.001
cm−1.
(2oo) 05ToNaZoSh Re-analysis of the absorption spectra of natural abun-
dance water vapor in the 9 250–26 000 cm−1 region reported previously by
Coheur et al. [84] and by Merienne et al. [88]. The original spectra were
recorded by an FTS Bruker IFS 120M coupled with two White multiple-
reflection cells of 5 and 50 m base path. The total absorption path was up
to 600 m. For weak lines assigned to HD16O absorption, an experimental ac-
curacy of 0.003 cm−1 has been adopted in this study, though in the original
source the measurement accuracy was declared to be higher (on average). Of
the 212 transitions assigned to HD16O absorption, only 58% (212 lines) agree
with the MARVEL transitions with an rms deviation equal to the adopted
experimental accuracy of 0.003 cm−1, suggesting that the measurement ac-
curacy was indeed slightly overestimated.
(2pp) 00WaHeHuZh Spectra recorded with the Bruker IFS 120HR FTS of
the University of Science and Technology (Hefei, China). Transitions list
supplied by S.-M. Hu. Of the 626 observed transitions, 98.2% (642 lines)
agree with the MARVEL transitions with an rms deviation equal to the
declared measurement accuracy of 0.003 cm−1. There is an asymmetry in
the observed–MARVEL deviations with respect to the zero line: there are
248 positive and 406 negative deviations. A calibration factor for the whole
spectral region could not be determined. For 91% of the reported transitions
26
observed–MARVEL deviations are within 0.0016 cm−1, suggesting that the
measurement accuracy is better than declared.
(2rr) 08ToTe A multi-pathlength refit of the data of Schermaul et al [136,
137].
(2ss) 04NaHuHeCa A 1 : 1 mixture of H2O and D2O was used to make HDO.
An additional spectrum of water vapor with much higher concentration of
D2O was recorded. The observed spectrum consists of two parts: 10 110–
11 451 and 11 751–12 215 cm−1, containing 1 489 and 338 lines, respectively.
Of the 1 489 observed transitions in the first region, 85.8% (1 277 lines) agree
with the MARVEL transitions with an rms deviation equal to the declared
measurement accuracy of 0.002 cm−1. In the 11 751–12 215 cm−1 region
there is an asymmetry in the observed–MARVEL deviations with respect to
the zero line: there are 252 positive and 84 negative deviations. A calibra-
tion factor for this spectral region could not be determined. For 75.4% of the
transitions observed–MARVEL deviations are within 0.005 cm−1, suggesting
that the experimental accuracy is lower in this region.
(2tt) 08LiHo CRDS was used for precision measurements of the water line
intensities in the 10 603–10 852 cm−1 region. Four lines of the 3ν3 band of
HDO were measured.
(2uu) 07MaToCa ICLAS absorption spectra of 18O enriched water were
recorded; HDO lines were observed due to high sensitivity of the spectrome-
ter used.
(2vv) 07VoNaCaCo Assignment of previously reported FTS spectra of Bach
et al. [94].
(2ww) 99HuLiHeCh After applying a calibration factor of 1.000 000 70 (Table
1), 86% (209 lines) of the 243 observed transitions agree with the MARVEL
transitions with an rms deviation equal to the declared measurement accu-
racy of 0.005 cm−1.
(2xx) 98LaPeSiZh Absorption spectrum of HDO was investigated using a
photo-acoustic spectrometer based on a Ti-Sapphire laser.
27
(2yy) 01JeMeCaCo Some of the lines published in this paper were assigned
by 07VoNaCaCo [100]. Of the 507 observed transitions, 84.6% (429 lines)
agree with MARVEL transitions with an rms deviation equal to the declared
measurement accuracy of 0.002 cm−1.
28

Table 3: Data sources and their characteristics for HD17O. See section 2.9 for
comments.a
Tag Range Trans. Physical conditions Comments
(cm−1) A / V T (K) p(hPa) Abun. Rec. L(m)
78Lovas [110] 0.29–8.06 59/54 RT (3a)
57StTo [111] 0.346 2 /2 RT (3b)
93Tothb [61] 1118–1674 424/422 RT FTS (3c)
a See footnote a to Table 2.
2.9. Comments on the data sources for HD17O given in Table 3
(3a) 78Lovas 59 microwave transitions reproduced from G. Steenbeckeliers,
private communication, July 1971. This data source contains three orphans:
78Lovas.2 at 0.305 972, 78Lovas.11 at 0.781 876, and 78Lovas.45 at 4.614 810
cm−1. 78Lovas.27 is also part of an FSN along with 93Tothb.72.
(3b) 57StTo The quadrupole hyperfine structure of the 220 → 221 rotational
transition was measured. The unsplit line position is given as 10374.56 MHz,
while the strongest component of the multiplet is estimated as 10374.31 MHz.
(3c) 93Tothb 93Tothb.72 is part of an FSN along with 78Lovas.27.
29
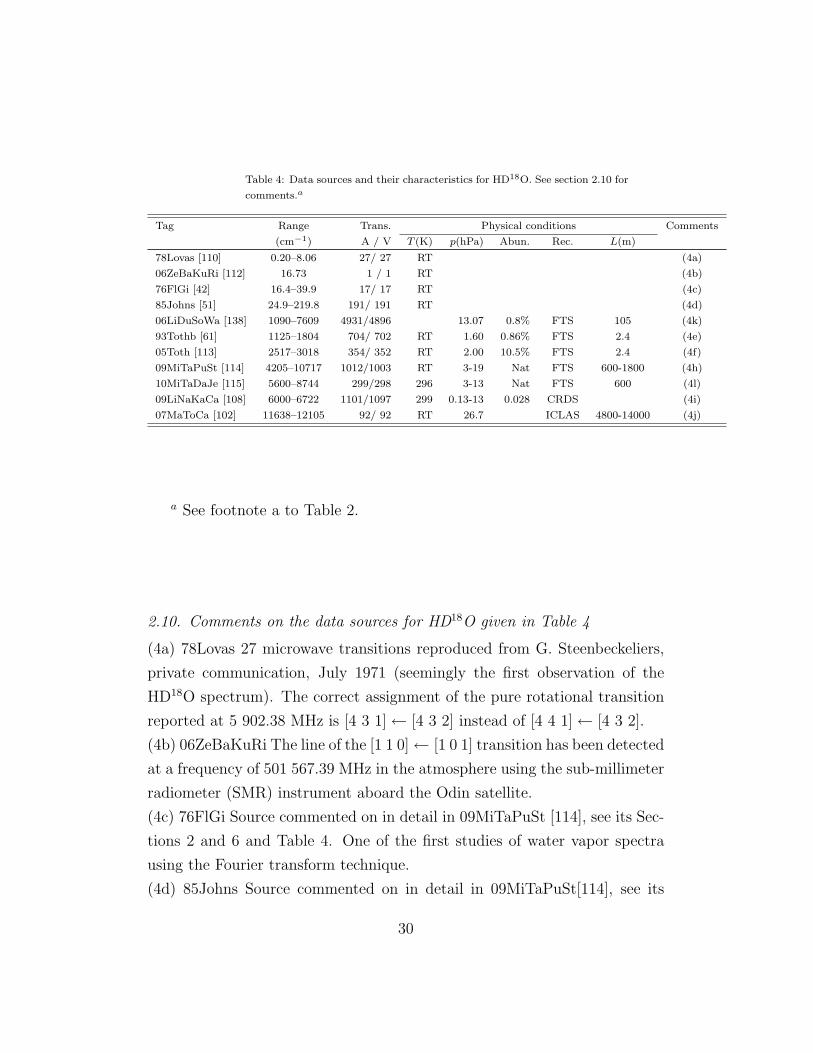
Table 4: Data sources and their characteristics for HD18O. See section 2.10 for
comments.a
Tag Range Trans. Physical conditions Comments
(cm−1) A / V T (K) p(hPa) Abun. Rec. L(m)
78Lovas [110] 0.20–8.06 27/ 27 RT (4a)
06ZeBaKuRi [112] 16.73 1 / 1 RT (4b)
76FlGi [42] 16.4–39.9 17/ 17 RT (4c)
85Johns [51] 24.9–219.8 191/ 191 RT (4d)
06LiDuSoWa [138] 1090–7609 4931/4896 13.07 0.8% FTS 105 (4k)
93Tothb [61] 1125–1804 704/ 702 RT 1.60 0.86% FTS 2.4 (4e)
05Toth [113] 2517–3018 354/ 352 RT 2.00 10.5% FTS 2.4 (4f)
09MiTaPuSt [114] 4205–10717 1012/1003 RT 3-19 Nat FTS 600-1800 (4h)
10MiTaDaJe [115] 5600–8744 299/298 296 3-13 Nat FTS 600 (4l)
09LiNaKaCa [108] 6000–6722 1101/1097 299 0.13-13 0.028 CRDS (4i)
07MaToCa [102] 11638–12105 92/ 92 RT 26.7 ICLAS 4800-14000 (4j)
a See footnote a to Table 2.
2.10. Comments on the data sources for HD18O given in Table 4
(4a) 78Lovas 27 microwave transitions reproduced from G. Steenbeckeliers,
private communication, July 1971 (seemingly the first observation of the
HD18O spectrum). The correct assignment of the pure rotational transition
reported at 5 902.38 MHz is [4 3 1]← [4 3 2] instead of [4 4 1]← [4 3 2].
(4b) 06ZeBaKuRi The line of the [1 1 0]← [1 0 1] transition has been detected
at a frequency of 501 567.39 MHz in the atmosphere using the sub-millimeter
radiometer (SMR) instrument aboard the Odin satellite.
(4c) 76FlGi Source commented on in detail in 09MiTaPuSt [114], see its Sec-
tions 2 and 6 and Table 4. One of the first studies of water vapor spectra
using the Fourier transform technique.
(4d) 85Johns Source commented on in detail in 09MiTaPuSt[114], see its
30
Sections 2 and 6 and Table 4. Note that 24 MW wavenumbers reproduced
by Johns from 78Lovas [110] were incorrectly cited in 83MeLuHe [139].
(4e) 93Tothb See section 2.2 for comments about re-callibration.
(4f) 05Toth Transitions corresponding to the 2ν2 and ν1 bands. For more
detailed comments see Sections 2 and 6 of 09MiTaPuSt.
(4h) 09MiTaPuSt Assignment of 38 unassigned lines reported by 07JeDaReTy
[101] in the 4 205–6 588 cm−1 range (see Section 3.1 and Table 1 of 09Mi-
TaPuSt) and 970 transitions from 6 129 to 10 717 cm−1. The transition
(0 2 1)[6 2 4] ← (0 0 0)[5 2 3] transition reported at 6 538.243 39 cm−1 is
re-assigned to 6 538.261 39 cm−1.
(4i) 09LiNaKaCa This source contains two orphans:
6 139.12(0.001) (1 0 1)[14 1 13] ← (000)[15 2 14], 09LiNaKaCa.43 and
6 139.6(0.001) (1 0 1)[14 2 13] ← (0 0 0)[15 1 14], 09LiNaKaCa.44.
The following transitions have been deleted by the MARVEL analysis:
6 157.76 (1 0 1)[13 2 12] ← (0 0 0)[14 1 13], 09LiNaKaCa.54 and
6 538.88 (1 0 1)[13 2 12] ← (0 0 0)[12 1 11], 09LiNaKaCa.945. One transi-
tion, 09LiNaKaCa.594 is part of an FSN.
(4j) 07MaToCa Transitions belonging to the ν2 + 3ν3 band are commented
in 09MiTaPuSt [114], see Sections 2 and 6 and Figure 4.
(4k) 06LiDuSoWa 17 transitions are part of an FSN, 7 are ORPs and 13 have
been deleted by the MARVEL analysis.
(4l) 10MiTaDaJe The transition deleted by MARVEL is: 7 015.213 870 (0 0 2)[12
1 11] ← (0 0 0)[13 1 12], 10MiTaDaJe.186.
31

3. MARVEL energy levels
Tables 5–7 contain MARVEL vibrational band origins (VBO) for HD16O,
HD17O, and HD18O, respectively. The same tables also contain information
about the number of rovibrational energy levels validated within this work
for each VBO. Observed, MARVEL predicted, and variationally determined
spectra of HD16O (VTT [118]), HD17O [116, 140], and HD18O [116, 140] are
reported in Figs. 4-6, respectively.
3.1. HD16O
For HD16O, 53 291 transitions of the 54 740 initial transitions have been
validated and used in the final MARVEL analysis. From these transitions
we derive a final set of 8 818 energy levels which belong to 54 vibrational
states and have J up to 30 and Ka up to 21. 66 transitions from 03JaTeBeZo
[86] form an FSN and 13 transitions from the same source are orphans; thus,
they could not be used for energy level determination.
A comparison of the experimental (MARVEL) and variational (VTT
[118]) energy level values is given in Fig. 2. The root-mean-square deviation
for this comparison is 0.058 cm−1, with the maximum obs − calc residuals
being −0.51 and −1.27 cm−1 for the [4 0 4] and [3 0 3] levels of the (0 6 3)
vibrational state, respectively. The (0 6 3) [3 0 3] energy level at 18 293.160 7
cm−1 was derived from two weak lines in 07VoNaCaCo [100] and should most
likely be considered incorrect. Note that these two levels were excluded when
the above quoted rms deviation was determined.
A comparison can be made between the original set of observed transi-
tions and those calculated from the experimental energy levels determined
by MARVEL; this is presented in Fig. 3. The differences do not exceed 0.038
cm−1; 52.6% and 84% of all transitions are reproduced within 0.001 and
0.005 cm−1, respectively. Only 5.6% of the observed transitions differ from
the MARVEL calculated values by more than 0.01 cm−1.
32
MARVEL may increase, via robust reweighting, an experimental uncer-
tainty of a transition when it is not consistent with that derived from the
MARVEL energy levels. For transitions with low J and Ka values it is rather
easy to evaluate a feasible experimental uncertainty if enough CDs are avail-
able. However, for increased values of J and Ka the CD relations become
less accurate and instructive, a number of experimental lines represent unre-
solved multiplets, and it becomes more and more difficult to judge properly
the actual experimental accuracy of the transitions. This in turn limits the
accuracy of the MARVEL energy levels derived. This situation could be
improved only by including additional accurate experimental information in
the MARVEL input file.
The set of MARVEL energy levels derived from processing the validated
observed transitions has been used to predict a large number of rovibrational
transitions with positions at the level of experimental accuracy. These line
positions were augmented with variational intensities. The total number of
predicted transitions with intensities larger than 1.0×10⁻²⁹ cm molecule−1 is
188 565 for T = 296 K. Observed, observed + predicted, and variational tran-
sitions are shown in Fig. 4 for HD16O. The number of residual unobserved
variational lines was obtained as the difference between the variationally cal-
culated and observed + predicted transitions; their number is 185 751 with
intensities greater than 1 × 10⁻²⁹ cm molecule−1. This figure is especially
important for future experimental studies of the high-resolution spectra of
HD16O. The strongest unobserved lines fall in the 3 600–9 600 and 9 600–
12 400 cm−1 regions with intensities 3× 10⁻²³ and 4× 10⁻²⁵ cm molecule−1,
respectively. Interestingly, in the spectral region below 2 400 cm−1 inten-
sities of the residual lines do not exceed 1 × 10⁻²⁷ cm molecule−1, and in
the 2 400–3 600 cm−1 region their intensities are not larger than 1 × 10⁻²⁶
cm molecule−1. Such a complete coverage of the 0–2 400 cm−1 region by the
obs + predicted transitions is due to energy levels derived from the analysis
of hot spectra in 03JaTeBeZo [86]. Similarly to the ‘cold’ spectrum, a set
33

of 74 122 ‘hot’ transitions at T = 1 770 K in the 380–3 932 cm−1 region
have been predicted at a level of experimental accuracy in positions using
MARVEL energy levels and variational intensities larger than 1.0 × 10⁻²⁴
cm molecule−1.
We considered three sources of hot HD16O transitions, Refs. [64, 82,
86]. The list given in 03JaTeBeZo [86] includes the transitions given by
01PaBeZoSh [82], so it was not necessary to analyse the second source inde-
pendently. Since hot water spectra have been measured for the most abun-
dant isotopologue, HD16O, the largest J is high, Jmax = 30. Then, one
can observe that, due to the large number of measured transitions, the list
of VBOs is fairly complete for HD16O and there are very few VBOs below
15 000 cm−1 for which rotational-vibrational levels have not been determined.
In fact, the only lower-lying VBOs which are missing are (1 4 0), (2 4 0),
(0 9 0), (2 3 1), (1 3 2), and (2 1 2). At higher wavenumbers a high propor-
tion of VBOs still appear (Table 5). The highest states for which VBOs and
rovibrational levels have been measured contain 7 quanta of stretch: 51 and
40 rotational levels have been determined for the (0 0 7) and (1 0 6) VBOs,
respectively. We note that double resonance measurements [97] give data on
VBOs higher than these; however, this work presents no measured transition
wavenumbers and we were therefore unable to use it in this study.
34

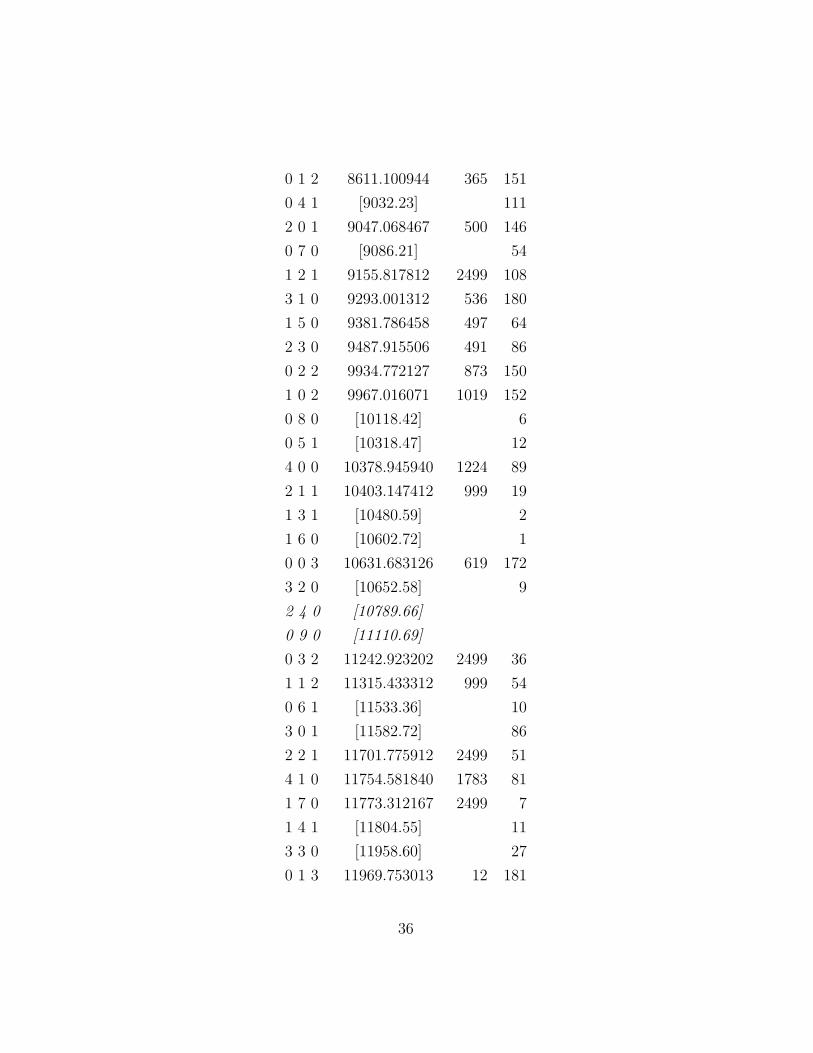
Table 5: MARVEL vibrational band origins (VBO)
for HD16O, with normal-mode (v1v2v3) assignments,
MARVEL uncertainties, and the number of validated
rotational-vibrational levels (RL) associated with the vi-
brational levels in the present database.a
v1v2v3 VBO/cm−1 Unc.a RL
0 0 0 0.000000b 0 685
0 1 0 1403.483724 15 609
1 0 0 2723.679737 49 478
0 2 0 2782.011177 36 457
0 0 1 3707.466740 177 380
1 1 0 4099.955912 250 347
0 3 0 4145.473186 292 312
0 1 1 5089.539837 41 253
2 0 0 5363.824480 50 209
0 4 0 5420.041442 1016 76
1 2 0 5506.186812 250 114
1 0 1 6415.460697 42 164
0 2 1 6451.899800 75 151
0 5 0 6690.413212 999 45
2 1 0 6746.908202 36 113
1 3 0 [6849.00] 11
0 0 2 7250.517890 257 205
0 3 1 7754.605467 500 110
1 1 1 7808.758612 500 103
0 6 0 7914.317012 500 11
3 0 0 7918.171912 500 164
2 2 0 [8090.15] 16
1 4 0 [8173.13]
35
0 1 2 8611.100944 365 151
0 4 1 [9032.23] 111
2 0 1 9047.068467 500 146
0 7 0 [9086.21] 54
1 2 1 9155.817812 2499 108
3 1 0 9293.001312 536 180
1 5 0 9381.786458 497 64
2 3 0 9487.915506 491 86
0 2 2 9934.772127 873 150
1 0 2 9967.016071 1019 152
0 8 0 [10118.42] 6
0 5 1 [10318.47] 12
4 0 0 10378.945940 1224 89
2 1 1 10403.147412 999 19
1 3 1 [10480.59] 2
1 6 0 [10602.72] 1
0 0 3 10631.683126 619 172
3 2 0 [10652.58] 9
2 4 0 [10789.66]
0 9 0 [11110.69]
0 3 2 11242.923202 2499 36
1 1 2 11315.433312 999 54
0 6 1 [11533.36] 10
3 0 1 [11582.72] 86
2 2 1 11701.775912 2499 51
4 1 0 11754.581840 1783 81
1 7 0 11773.312167 2499 7
1 4 1 [11804.55] 11
3 3 0 [11958.60] 27
0 1 3 11969.753013 12 181
36

2 5 0 [12073.36] 1
0 10 0 [12164.86] 1
0 4 2 [12516.42] 26
2 0 2 12568.190090 1809 77
1 2 2 12644.652812 2499 57
0 7 1 [12694.33] 3
5 0 0 12767.141475 309 119
1 8 0 [12852.35] 3
3 1 1 12919.938712 2499 78
1 5 1 [12986.79] 9
2 3 1 [13087.15]
0 2 3 13278.350811 46 141
1 0 3 13331.606153 216 126
0 8 1 [13716.47] 1
0 5 2 [13797.38] 5
0 0 4 13853.627343 155 185
2 1 2 [13889.58]
1 3 2 [13960.04]
5 1 0 [14147.42] 31
0 3 3 [14563.09] 8
0 12 0 [14564.83] 8
1 1 3 14660.721912 315 42
0 6 2 [14997.32] 1
6 0 0 15065.712212 4997 37
3 0 2 [15097.31] 2
0 1 4 15166.104512 17 130
1 4 2 15170.951012 33 30
4 1 1 [15349.50] 2
0 4 3 [15822.14] 1
2 0 3 [15924.17]
37

1 11 0 [16047.64] 3
1 5 2 [16449.57] 1
0 2 4 16456.190313 60 75
5 0 1 [16481.72] 3
1 0 4 [16539.04] 42
0 0 5 16920.020712 15 135
1 1 4 [17844.35] 1
0 6 3 [18202.57] 2
0 1 5 18208.446512 48 85
2 7 1 [18919.13]
0 2 5 [19472.44] 25
1 0 5 [19584.53] 21
3 1 3 [19742.09] 1
0 0 6 19836.882808 45 87
7 0 1 [20952.89]
1 0 6 22454.468792 500 40
0 0 7 22625.523004 2161 51
1 1 6 [23700.84]
a The uncertainties (Unc.) are given in units of 10−6 cm−1. For VBOs not
determined by the available experimental data, approximate variationally
computed VBOs, based on an exact kinetic energy operator and the PES
of Yurchenko et al. [119], are given in brackets. These values should only
be used for guidance about the VBOs, although their accuracy is expected
to be better than 0.1 cm−1. No uncertainies are given for these VBOs. For
completeness, VBOs for which no rovibrational states have been observed
are also given. These levels, for which no RL values are given, are printed in
italics and correspond to variationally computed values, as well. The VBOs
38

are ordered according to energy.b The value of the vibrational ground state was fixed to zero with zero un-
certainty.
3.2. HD17O and HD18O
Of the 485 transitions in the MARVEL database of HD17O, 478 were
validated and these led to 162 MARVEL energy levels with a maximum J
value of 11. There is only one VBO determined for HD17O, (0 1 0) (Table
6 and Figure 5). As is clear from Fig. 5, the energy levels determined for
this band allow one to make excellent predictions of a large number of pure
rotational levels on the ground vibrational state (0 0 0). Future experimental
investigations should validate these MARVEL predictions.
As to HD18O, of the 8 729 transitions in the MARVEL database, 8 634
were validated and these led to the determination of 1 860 MARVEL en-
ergy levels with a maximum J value of 18. Several recent studies have
addressed the assignment of the high-resolution rovibrational spectrum of
HD18O, including 06LiDuSoWa [138], 09MiTaPuSt [114], 09LiNaKaCa [108],
and 10MiTaDaJe [115]. While there have been a relatively small number of
assigned transitions for HD18O before, 06LiDuSoWa changed this situation
drastically. Furthermore, the experimental database of HD18O was treated
by the code RITZ in 09MiTaPuSt [114] and 10MiTaDaJe [115]. The RITZ
code is similar to MARVEL and results in energy levels and their uncertain-
ties. Table 7 compares the MARVEL and the RITZ VBO and uncertainty
values. The recommended values remain those obtained using the present
database and the MARVEL protocol.
39
3.3. Status of highly accurate transitions
The agreement between the MARVEL predicted and the experimental
pure rotational transitions improved slightly by the recalibration of the ex-
perimental transitions. Nevertheless, the MARVEL uncertainties of the pure
rotational levels is still uniformly larger than is usual for lines coming from
microwave determinations. To show that this is due to the uncertainties of
the upper states we performed a MARVEL analysis of the pure rotational
states. MARVEL can reproduce the microwave uncertainties very nicely,
down to the level of the experimental uncertainties, as also observed before
[5]. For example, the mean of the reproduction of the pure rotational lines
for HD16O is 2.3 × 10⁻⁵ cm−1 if only the (0 0 0) transitions are employed
in the MARVEL analysis. The agreement worsens to 4.8× 10⁻⁵ cm−1 if the
full calibrated database is used to predict the pure rotational transitions.
Another source of inaccuracy when combining measured results from sev-
eral sources is due to pressure shifts. This is especially of concern for this
study as the pressure of HDO had to be increased several times in order to
allow the detection of the HDO lines. Since there is no theory of pressure
shifts of sufficient accuracy, no attempt was made in this work to correct
the observed lines to, for example, zero pressure. This introduces a perhaps
appreciable uncertainty for most of the measured lines. This is reflected in
MARVEL uncertainties larger than otherwise expected for many rotational-
vibrational levels.
Of all the transitions outside of the micro- and millimeterwave regions
treated in this study, the most accurate one available is at 1480.094 038 033(67)
cm−1 [76], observed for HD16O. Toth [72] has measured the same transition
although with much less precision. Guelachvili [47] also measured this tran-
sition (as expected, his measured value only agrees with the other ones after
the multiplicative recalibration of his results). As the present study of all the
measured transitions of HD16O shows, the lower (0 0 0) 515 and the upper
(0 1 0) 524 energy levels of this transition are involved in 461 and 76 transi-
40

tions, respectively. This means that MARVEL can fix the energies of these
levels, and thus the transition, with considerable certainty. The MARVEL
wave number and uncertainty of this transition is 1 480.094 038 033(7000)
cm−1. Therefore, it is clear that MARVEL (a) did not change the value of
the transition known accurately and precisely, and (b) increased the uncer-
tainty of the measured line considerably. None of this is surprising given the
large number of much less precisely determined transitions the two energy
levels are involved in and the fact that MARVEL did not find it necessary
to adjust the uncertainty of the original experimental measurement (which
confirms its high precision).
41

Table 6: MARVEL vibrational band origins (VBO) for HD17O, with normal-mode (v1v2v3)assignments, MARVEL uncertainties, and the number of rotational levels (RL) the vibra-tional levels are holding within the present database.a
v1v2v3 VBO/cm−1 Unc. RL
0 0 0 0.000000b 0 86
0 1 0 1399.674626 182 76a See footnote a to Table 5.b See footnote b to Table 5.
Table 7: MARVEL and RITZ vibrational band origins
(VBO) for HD18O, with normal-mode (v1v2v3) assign-
ments, uncertainties, and the number of rotational levels
(RL) the vibrational levels are holding within the related
databases.a
MARVEL RITZ[114]
v1v2v3 VBO/cm−1 Unc. RL VBO/cm−1 Unc.
0 0 0 0.000000b 0 164 0.000000b 0
0 1 0 1396.266365 176 156 1396.266540 299
1 0 0 2709.284316 178 125 2709.284528 311
0 2 0 2767.209640 220 85 2767.212120 696
0 0 1 3696.330134 345 149 3696.330305 696
1 1 0 4080.544716 385 99 4080.544949 984
0 3 0 4121.754251 349 77 4121.754430 696
0 1 1 5071.496323 352 114 5071.496500 696
0 4 0 7
1 2 0 1
42
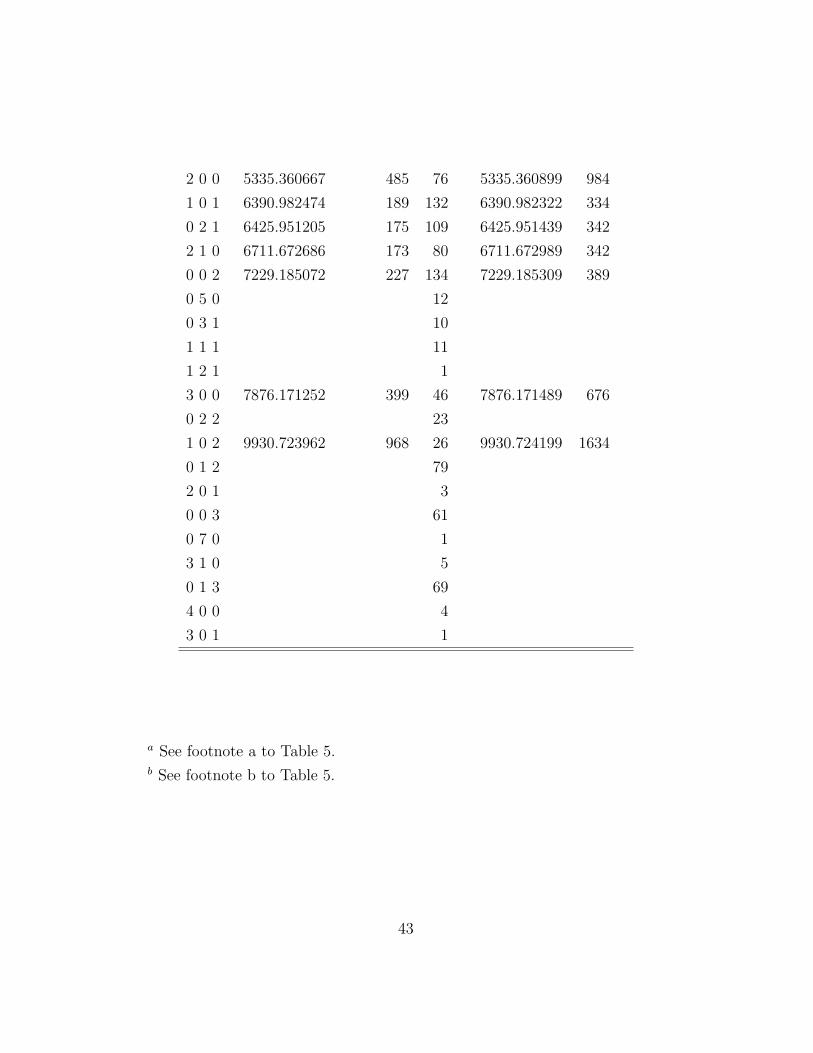
2 0 0 5335.360667 485 76 5335.360899 984
1 0 1 6390.982474 189 132 6390.982322 334
0 2 1 6425.951205 175 109 6425.951439 342
2 1 0 6711.672686 173 80 6711.672989 342
0 0 2 7229.185072 227 134 7229.185309 389
0 5 0 12
0 3 1 10
1 1 1 11
1 2 1 1
3 0 0 7876.171252 399 46 7876.171489 676
0 2 2 23
1 0 2 9930.723962 968 26 9930.724199 1634
0 1 2 79
2 0 1 3
0 0 3 61
0 7 0 1
3 1 0 5
0 1 3 69
4 0 0 4
3 0 1 1
a See footnote a to Table 5.b See footnote b to Table 5.
43

Table 8: Comparison of HD16O, HD17O, and HD18O transition data found in HITRAN[141] and used in the present compilation.
HD16O HD17O HD18O
Total number of transitions in present database 54 740 485 8 729
Unique transitions in present database 36 690 445 7 186
Number of validated transitions 53 291 478 8 634
Transitions in HITRAN database 13 238 175 1 611
Concordant transitionsa 9 627 169 848
Transitions absent in present database 3 611 6 763
Transitions absent in HITRAN 27 063 276 6 338a Transitions which are present both in HITRAN and in the present validated
IUPAC database.
4. Discussion
4.1. A comparison with HITRAN
The relevant features of the HITRAN database [141, 142] are summarized
in the original publications and in Part I; thus, they are not repeated here
in detail, and just a few remarks are made. Table 8 compares the data used
in this study with those in the HITRAN [141] database. There are several
notable differences between HITRAN and the (present) IUPAC water-vapor
data analysis. First, HITRAN contains a mixture of observed and calculated
entries, whereas the lines used in the present analysis are based strictly on
published experimental values. Even though the goal in HITRAN is to have
a complete set of self-consistent and maintainable values, in practice this is
44
not possible at this time. Entries that have been determined under controlled
laboratory conditions and are very accurate are frequently used in HITRAN.
However, in order to have adequate sets of lines for important vibration-
rotation bands, it is necessary to use theoretical extrapolations of the data
(especially to the higher rotational levels), to have calculations of lines that
are blended or obscured in laboratory observations, or to have calculations
for quantities that theory actually yields better constrained values at present
than experiment (some line-shape parameters, for example). Second, in the
case of multiple sets of data for a quantity, HITRAN takes each datum from
a single source. This consolidation of data has been made by judgment of the
quality of the different data sets. With the superior structure of the IUPAC
database, all high-quality data have been retained. In principle one can use
a filtering code to produce a smaller list for a specific application. Thirdly,
HITRAN is aimed at atmospheric temperature applications and, by applica-
tion of a minimum transition intensity at 296 K requirement, rejects many
hot transitions; our present analysis aims to capture all measured transitions.
The increased number of transitions in the present compilation is partly a
reflection of this.
The line positions of HD16O in the pure rotational band have remained
unchanged in HITRAN since the 1986 edition [132] and originate from an
older version of the JPL catalog [143]. It was generated based on the con-
stants obtained in the simultaneous fit of submillimiter measurements of
Messer et al. [49] and a set of experimentally determined ground state en-
ergy levels based on infrared measurements in the ν2 band. All the lines
from 500 to 7 514 cm−1 originate from the SISAM database [144]. Most of
the HD16O lines in SISAM are experimentally observed, while 1 525 were
calculated based on the experimentally determined energy levels. There are
no HD16O lines between 7 514 and 9 751 cm−1. From 9 751 to 10 782 cm−1,
data from Tolchenov and Tennyson [107] were used, and starting from 11 750
cm−1 lines were taken from Voronin et al. [100].
45

For HD18O, the current version of the JPL catalogue [145] was used in
HITRAN for the pure rotational band and data from Toth’s website [144]
was used for all other lines from 500 to 3 825 cm−1. Note that line positions of
56 of these lines were determined from experimentally-derived energy levels
rather than directly measured. The majority of 6 338 lines in the IUPAC
dataset of experimental transitions that are absent in HITRAN (see Table 8)
are lines above 3 825 cm−1.
For HD17O, the only lines in HITRAN are those from the SISAM database
[144], while IUPAC data includes measurements in the pure rotational band
[111, 110] and the ν2 band from 93Tothb [61].
4.2. Completeness of data
As shown in Part I, a comparison between the variational nuclear motion
calculations and the results of the MARVEL analysis can be used to assess
the overall completeness of the spectroscopic data for each water isotopologue
and to indicate key regions for further experimental study.
Figures 4, 5, and 6 show comparisons of numbers of room temperature
transitions for HD16O, HD17O, and HD18O, respectively. Each figure gives
the measured transitions, the number of new transtions predicted from the
MARVEL energy levels, the sum of these and the transitions predicted by the
variational calculations. For simplicity the VTT [118] calculated transition
intensities are assumed throughout.
46

Table 9: Proportion of the total integrated absorptiona at 296 K, as estimated usingthe VTT [118] variational line list (“calc”), of the three isotopologues of HDO recoveredexperimentally (“expt”) and by including the extra transitions predicted by the MARVELprotocol (“MARVEL”). Note that different wavenumber maximum (νmax in cm−1) andintensity cut-offs have been used for each isotopologue; theses choices were dictated by theavailable experimental data.a
νmax Cut-off A(calc) A(expt) A(obs)A(calc)
A(MARVEL) A(expt)+A(MARVEL)A(calc)
HD16O 25 000 10(−29) 5.95(−17) 5.13(−17) 86 % 8.66(−18) 100 %
HD17O 5 000 10(−28) 5.74(−17) 9.22(−18) 16 % 3.43(−17) 66 %
HD18O 20 000 10(−27) 5.79(−17) 3.50(−17) 60 % 1.60(−17) 88 %
a Absorption (A) and intensities in cm molecule−1; powers of ten given in
parenthesis.
One interesting measure of completeness is the proportion of the inte-
grated absorption recovered for each isotopologue, a summary of which is
given in Table 9. For HD16O, the measurements recover 86 % of the total
absorbance at 296 K. The extra transitions involving energy levels predicted
by MARVEL yield 14 % of the total absorbance meaning that the combined
transitions lead to essentially total recovery of the absorbance. This result is
significant because, given that the ab initio calculated transition intensities
have been proven to be reliable [146, 147], it means very reliable estimates
of missing absorption can be generated using very precise estimates of the
frequencies. We note that at higher temperatures we expect the percentage
of the total absorbance recovered experimentally to drop.
Unsuprisingly, the proportion of data observed for the minor isotopo-
logues is less than for HD16O. Under these circumstances the use of MAR-
VEL alone cannot provide all the missing absorption. However, improvement
47
in the simulation of the bands where only partial data is available is still sig-
nificant.
5. Conclusions
Among many other applications of such data, a huge quantity of high-
quality molecular data are needed for the understanding of spectroscopic
measurements related to different stars and the atmospheres of planets and
exoplanets. One must know precise positions and usually intensities and
line shapes in order to be able to judge what is observed and how much
of that species is present. Among the species for which spectroscopic data
are needed for this or other important scientific or engineering applications,
water is probably the single most important one. Thus, the study of the
complete spectra of its isotopologues is of prime importance. At the same
time, the high-resolution rovibrational spectra of the isotopologues of the
water molecule form a fertile testing ground for different experimental and
theoretical approaches yielding the required information.
While the ambitious aim of the IUPAC Task Group partially responsible
for this work is to create a complete linelist for all isotopologues of water,
a first step is to determine energy levels and line positions. This paper
provides, for the first time, a dependable and carefully validated set of energy
levels and transition wavenumbers, all with dependable and self-consistent
uncertainties, for HD16O, HD17O, and HD18O. As proven in this work, the
MARVEL approach [3, 4, 5], combined with results from variational nuclear
motion computations, provides an ideal platform to achieve this goal.
Our analysis of the available HDO line frequency measurements pointed
towards some issues with calibraton of the published data. We were not
always able to resolve these issues and it is our view that an effort to de-
velop modern frequency standards, such as that of Guelachvili et al [130], is
urgently needed.
48
The distributed information system W@DIS [148, 149], containing the
transitions and the energy levels of this study, can be accessed via http://wadis.saga.iao.ru.
Acknowledgements
We all thank the International Union of Pure and Applied Chemistry
for funding under project 2004-035-1-100 (A database of water transitions
from experiment and theory). In addition, this work has received partial
support from the UK Engineering and Physical Science Research Council,
the UK Natural Environment Research Council, the Royal Society, grant
WWLC-008535-(reintegration) MCA FP6 EC, the Scientific Research Fund
of Hungary (grant OTKA K77825), the European Union QUASAAR Marie
Curie research training network, NATO, the Russian Foundation for Basic
Research, the Belgian Federal Science Policy Office (contracts EV/35/3A,
SD/AT/01A, PRODEX 1514901NLSFe(IC)), the Belgian National Fund for
Scientific Research (FRFC contracts), the Communaute de Belgique (Ac-
tion de Recherche Concertees), the NASA laboratory astrophysics program,
NASA Earth Observing System (EOS), under grant NNX08AD92G, and the
Programme National LEFE (CHAT) of CNRS (INSU). Part of the research
described in this paper was performed at the Jet Propulsion Laboratory, Cal-
ifornia Institute of Technology, under contract with the National Aeronautics
and Space Administration
49

Appendix A
The MARVEL protocol involves active maintainance (the A in MARVEL)
and periodic update of the databases containing the measured transitions.
Since the publication of Part I [1], new measurements [108, 150] came to our
attention for H217O and H2
18O, the two water isotopologues treated there.
Furthermore, during preparation of the Part II manuscript the MARVEL pro-
cedure, as noted above, has also been slightly adjusted in order to determine
more reliable energy values and uncertainty estimates via a post-MARVEL
validation scheme. Therefore, in this appendix we give improved VBOs for
H217O and H2
18O and in the Supplementary Material we provide new or im-
proved MARVEL energy levels for these two isotopologues, as well. These
new data should replace the ones presented in Part I.
A.1 H217O
Two new sources have been added to the Part I database, 09LiNaKaCa
[108] and 86GuRa [150]. Characteristics of these two sources are given in
Table 10. Compared to Part I, the number of validated transitions increased
from 8 614 to 9 028 and the number of energy levels increased from 2 687 to
2 723.
Application of the post-MARVEL validation scheme also meant that the
MARVEL energy levels for this isotopologue changed as compared to Part
I. The full set of VBOs and their improved uncertainties are given in Table
10. There are no new VBOs compared to Part I. The improved set of MAR-
VEL rotational-vibrational energy levels are provided in the Supplementary
Material.
50

Table 10: Data sources additional to those presented in Part I and their char-
acteristics for H217O.a
Tag Range Trans. Physical conditions Comments
(cm−1) A/V T (K) p(hPa) Abun.(%) Rec. L(m)
86GuRa [150] 100–1986 203/202 (10a)
09LiNaKaCa [108] 5907–6726 212/212 299 0.13-13 0.3 CRDS (10b)
a See footnote a to Table 1.
(10a) 86GuRa MARVEL cuts the transition 83GuRa.5 at 207.73575 cm−1.
(10b) 09LiNaKaCa H217O transitions assigned in the CRDS spectrum of a
highly 18O enriched sample.
Table 11: MARVEL vibrational band origins (VBO), with polyad quantum
number (P = 2v1+v2+2v3), normal-mode (v1v2v3) and local-mode ((mn)±v2)
assignments, MARVEL uncertainties (Unc.), and the number of rotational
levels (RL) the vibrational levels are holding within the present, improved
database, for H217O.a
P v1v2v3 (mn)±v2 VBO/cm−1 Unc. RL
0 0 0 0 (00)+0 0.000000b 0 192
1 0 1 0 (00)+1 1591.325719 47 153
2 0 2 0 (00)+2 3144.980520 46 78
2 1 0 0 (10)+0 3653.142275 28 108
2 0 0 1 (10)−0 3748.318105 31 141
3 1 1 0 (10)+1 5227.705615 473 69
3 0 1 1 (10)−1 5320.251393 527 157
4 1 2 0 (10)+2 6764.725615 473 73
4 0 2 1 (10)−2 6857.272485 47 94
4 2 0 0 (20)+0 7193.246415 47 81
4 1 0 1 (20)−0 7238.714012 51 110
4 0 0 2 (11)+0 7431.076115 473 27
5 1 1 1 (20)−1 8792.544010 360 108
5 0 1 2 (11)+1 8982.869215 473 55
6 1 2 1 (20)−2 10311.201787 440 75
6 2 0 1 (30)−0 10598.475620 492 103
6 1 0 2 (21)+0 10853.505315 473 69
6 0 0 3 (21)−0 11011.882910 2465 84
51

7 1 3 1 (20)−3 11792.822200 490 40
7 2 1 1 (30)−1 12132.992610 493 94
7 0 1 3 (21)−1 12541.227060 517 51
8 2 2 1 (30)−2 13631.499810 542 52
9 0 7 1 (10)−7 13808.273310 493 2
8 3 0 1 (40)−0 13812.158110 493 74
8 1 0 3 (31)−0 14296.279510 197 36
10 3 2 1 (40)−2 16797.167510 3944 70
10 4 0 1 (50)−0 16875.620510 3944 55
a The uncertainties (Unc.) are given in units of 10−6 cm−1. The VBOs are
ordered by energy.b The value of the vibrational ground state was fixed to zero with zero un-
certainty.
A.2 H218O
Three new sources have been added to the Part I database, 09LiNaKaCa
[108], 09PuCaHaVa [151], and 86GuRa [150]. Characteristics of these sources
are given in Table 12. There are 6 orphans in the database and an FSN
containing 22 transitions. Compared to Part I, the number of validated
transitions increased from 29 364 to 31 705 and the number of energy levels
increased from 4 849 to 5 131.
Application of the post-MARVEL validation scheme also meant that the
MARVEL energy levels for H218O isotopologue changed as compared to Part
I. The full set of VBOs and their improved uncertainties are given in Table 12.
The improved set of MARVEL energy levels are provided in the Supplemetary
Material.
52

Table 12: Data sources additional to those presented in Part I and their char-
acteristics for H218O.a
Tag Range Trans. Physical conditions Comments
(cm−1) A/V T (K) p(hPa) Abun.(%) Rec. L(m)
09PuCaHaVa [151] 6.4–18.4 5/5 RT
86GuRa [150] 55 – 2 053 351/350 (12a)
09LiNaKaCa [108] 5 907–6 726 2015/2006 299 0.13-13 84-92 CRDS
a See footnote a to Table 2.
(12a) 86GuRa MARVEL cuts the transition 83GuRa.21 at 147.193 80 cm−1.
Table 13: MARVEL vibrational band origins (VBO), with polyad quantum
number (P = 2v1+v2+2v3), normal-mode (v1v2v3) and local-mode ((mn)±v2)
assignments, MARVEL uncertainties, and the number of rotational levels (RL)
the vibrational levels are holding within the present revised database, for
H218O.a
P v1v2v3 (mn)±v2 VBO/cm−1 Unc. RL
0 0 0 0 (00)+0 0.000000 0 298
1 0 1 0 (00)+1 1588.276029 22 227
2 0 2 0 (00)+2 3139.050028 36 146
2 1 0 0 (10)+0 3649.685417 50 192
2 0 0 1 (10)−0 3741.566775 45 216
3 0 3 0 (00)+3 4648.477809 341 130
3 1 1 0 (10)+1 5221.243308 377 170
3 0 1 1 (10)−1 5310.461383 281 246
4 1 2 0 (10)+2 6755.510366 283 167
4 0 2 1 (10)−2 6844.598785 194 169
4 2 0 0 (20)+0 7185.878096 506 176
4 1 0 1 (20)−0 7228.883501 493 181
4 0 0 2 (11)+0 7418.724061 294 147
5 1 3 0 (10)+3 8249.037152 459 79
5 0 3 1 (10)−3 8341.107933 417 120
5 2 1 0 (20)+1 8739.525858 503 84
5 1 1 1 (20)−1 8779.719569 349 143
5 0 1 2 (11)+1 8967.565058 503 87
6 0 4 1 (10)−4 9795.331502 473 72
6 2 2 0 (20)+2 10256.584858 503 61
53
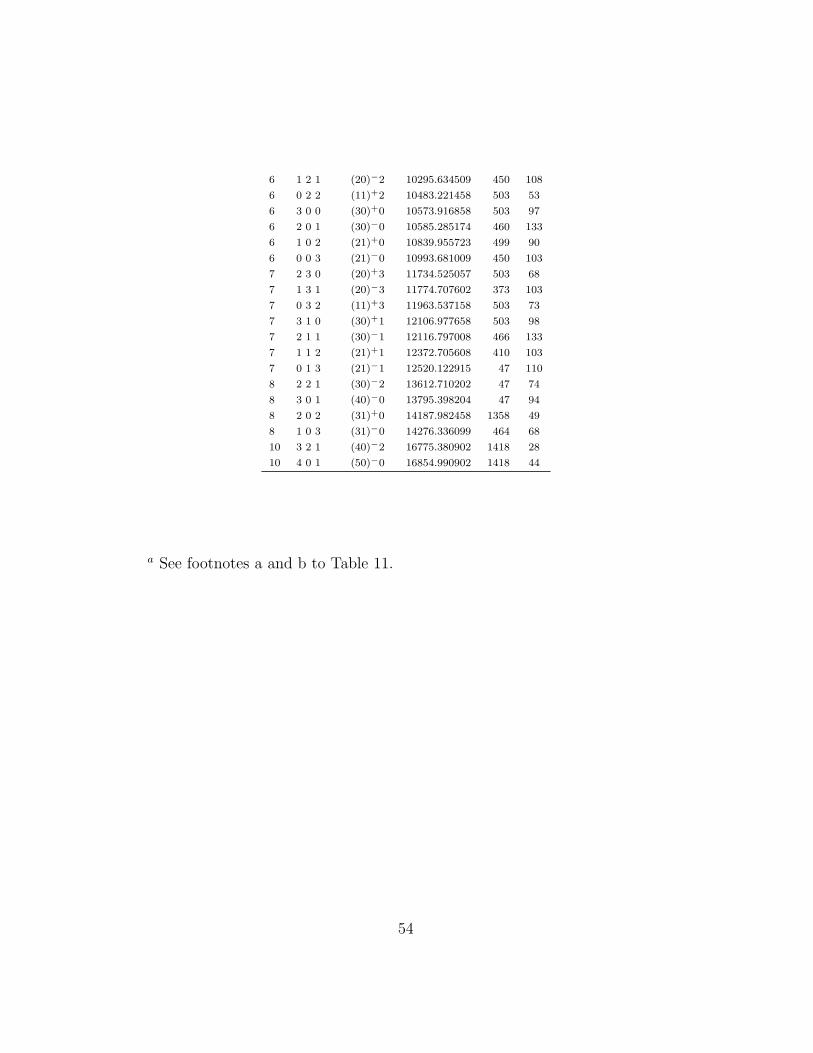
6 1 2 1 (20)−2 10295.634509 450 108
6 0 2 2 (11)+2 10483.221458 503 53
6 3 0 0 (30)+0 10573.916858 503 97
6 2 0 1 (30)−0 10585.285174 460 133
6 1 0 2 (21)+0 10839.955723 499 90
6 0 0 3 (21)−0 10993.681009 450 103
7 2 3 0 (20)+3 11734.525057 503 68
7 1 3 1 (20)−3 11774.707602 373 103
7 0 3 2 (11)+3 11963.537158 503 73
7 3 1 0 (30)+1 12106.977658 503 98
7 2 1 1 (30)−1 12116.797008 466 133
7 1 1 2 (21)+1 12372.705608 410 103
7 0 1 3 (21)−1 12520.122915 47 110
8 2 2 1 (30)−2 13612.710202 47 74
8 3 0 1 (40)−0 13795.398204 47 94
8 2 0 2 (31)+0 14187.982458 1358 49
8 1 0 3 (31)−0 14276.336099 464 68
10 3 2 1 (40)−2 16775.380902 1418 28
10 4 0 1 (50)−0 16854.990902 1418 44
a See footnotes a and b to Table 11.
54

References
[1] J. Tennyson, P. F. Bernath, L. R. Brown, A. Campargue, M. R. Car-
leer, A. G. Csaszar, R. R. Gamache, J. T. Hodges, A. Jenouvrier, O. V.
Naumenko, O. L. Polyansky, L. S. Rothman, R. A. Toth, A. C. Van-
daele, N. F. Zobov, L. Daumont, A. Z. Fazliev, T. Furtenbacher, I. E.
Gordon, S. N. Mikhailenko, S. V. Shirin, Critical Evaluation of the
Rotational-Vibrational Spectra of Water Vapor. Part I. Energy Levels
and Transition Wavenumbers for H217O and H2
18O, J. Quant. Spec-
trosc. Radiat. Transfer 110 (2009) 573–596.
[2] P. F. Bernath, The spectroscopy of water vapour: Experiment, theory
and applications, Phys. Chem. Chem. Phys. 4 (2002) 1501–1509.
[3] A. G. Csaszar, G. Czako, T. Furtenbacher, E. Matyus, An active
database approach to complete spectra of small molecules, Ann. Rep.
Comp. Chem. 3 (2007) 155–176.
[4] T. Furtenbacher, A. Csaszar, J. Tennyson, MARVEL: measured active
rotational-vibrational energy levels, J. Mol. Spectrosc. 245 (2007) 115–
125.
[5] T. Furtenbacher, A. G. Csaszar, On employing H216O, H2
17O, H218O,
and D216O lines as frequency standards in the 15 – 170 cm−1 window,
J. Quant. Spectrosc. Radiat. Transfer 109 (2008) 1234–1251.
[6] S. Joussaume, R. Sadourny, J. Jouzel, A general circulation model of
water isotope cycles in the atmosphere, Nature 311 (1984) 24–29.
[7] T. Fouchet, E. Lellouch, Vapor pressure isotope fractionation effects in
planetary atmospheres: Application to deuterium, Icarus 144 (2000)
114–123.
[8] F. Montmessin, T. Fouchet, F. Forget, Modeling the annual cycle of
HDO in the Martian atmosphere, J. Geophys. Res. 110 (2005) E03006.
55

[9] V. N. Payne, D. Noone, A. Dudhia, C. Piccolo, R. G. Grainger, Global
satellite measurements of HDO and implications for understanding the
transport of water vapour into the stratosphere, J. Quart. roy. Meteor.
Soc. 133 (2007) 1459–1471.
[10] J. Steinwagner, M. Milz, T. von Clarmann, N. Glatthor, U. Grabowski,
M. Hopfner, G. P. Stiller, T. Rockmann, HDO measurements with
MIPAS, Atmos. Chem. Phys. 7 (2007) 2601–2615.
[11] C. De Bergh, B. Bezard, T. Owen, D. Crisp, J.-P. Maillard, B. L. Lutz,
Deuterium on Venus – Observations from Earth, Science 251 (1991)
547–549.
[12] Y. V. Pavlenko, G. J. Harris, J. Tennyson, H. R. A. Jones, J. M. Brown,
J. Harrison, C. Hill, L. A. Yakovina, The electronic bands of CrD, CrH,
MgD and MgH: application to the “deuterium” test, Mon. Not. R. astr.
Soc. 386 (2008) 1338–1346.
[13] A. J. Hewitt, N. Doss, N. F. Zobov, O. L. Polyansky, J. Tennyson,
Deuterated water: Partition functions and equilibrium constant, Mon.
Not. R. Astr. Soc. 356 (2005) 1123–1126.
[14] J. K. G. Watson, Robust weighting in least-squares fits, J. Mol. Spec-
trosc. 219 (2003) 326–328.
[15] C. H. Townes, F. R. Merrit, Water spectrum near one-centimeter wave-
length, Phys. Rev. 70 (1946) 558–559.
[16] M. W. P. Strandberg, T. Wentink Jr., R. E. Hillger, G. H. Wannier,
M. L. Deutsch, Stark spectrum of HDO, Phys. Rev. 73 (1948) 188.
[17] K. B. McAfee Jr., A study of the absorption of some gases at microwave
frequencies, Ph.D. thesis, Harvard, data given by [22] (1949).
56

[18] M. W. P. Strandberg, Rotational absorption spectrum of HDO, J.
Chem. Phys. 17 (1949) 901–904.
[19] C. K. Jen, Rotational magnetic moments for H2O and HDO, Phys.
Rev. 76 (1949) 471.
[20] C. K. Jen, Rotational magnetic moment in polyatomic molecules, Phys.
Rev. 81 (1951) 197–203.
[21] Y. Beerd, S. Weisbaum, An ultra-highfrequency rotational line of HDO,
Phys. Rev. 91 (1953) 1014–10.
[22] C. K. Jen, D. R. Bianco, J. T. Massey, Some heavy water rotational
absorption lines, J. Chem. Phys. 21 (1953) 520–525.
[23] B. F. Burke, M. W. P. Strandberg, Zeeman effect in rotational spectra
of asymmetric-rotor molecules, Phys. Rev. 90 (1953) 303–308.
[24] H. D. Crawford, Two new lines in the microwave spectrum of heavy
water, J. Chem. Phys. 21 (1953) 2099.
[25] D. W. Posener, M. W. P. Strandberg, Microwave spectrum of HDO, J.
Chem. Phys. 21 (1953) 1401–1402.
[26] D. W. Posener, M. W. P. Strandberg, Centrifugal distortion effect in
asymmetric top molecules III. H2O, D2O, and HDO, Phys. Rev. 95
(1954) 374–384.
[27] S. Weisbaum, Y. Beers, G. Hermann, Low-frequency rotational spec-
trum of HDO, J. Chem. Phys. 23 (1955) 1601–1605.
[28] G. Erlandson, J. Cox, Millimeter-wave lines of heavy water, J. Chem.
Phys. 25 (1956) 778–779.
[29] W. S. Benedict, N. Gailar, E. K. Plyler, Rotation-Vibration Spectra of
Deuterated Water Vapor, J. Chem. Phys. 24 (1956) 1139–1165.
57

[30] D. W. Posener, Hyperfine structure in the microwave spectrum of wa-
ter, Austr. J. Phys. 10 (1957) 276–285.
[31] N. M. Gailar, F. P. Dickey, The vibration-rotation band ν2 of HDO
vapor, J. Mol. Spectrosc. 4 (1960) 1–15.
[32] E. B. Treacy, Y. Beers, Hyperfine structure of the rotational spectrum
of HDO, J. Chem. Phys. 36 (1962) 1473–1480.
[33] P. Thaddeus, L. C. Krisher, J. H. N. Loubser, Hyperfine structure of the
microwave spectrum of HDO, HDS, CH2O, and CHDO: beam-maser
spectroscopy and asymmetric-top molecules, J. Chem. Phys. 40 (1964)
257–273.
[34] H. Bluyssen, J. Verhoeven, A. Dymanus, Hyperfine structure of HDO
and D2O by beam maser spectroscopy, Phys. Lett. A 25 (1967) 214–
215.
[35] J. Verhoeven, H. Bluyssen, A. Dymanus, Hyperfine structure of HDO
and D2O by beam maser spectroscopy, Phys. Lett. A 26 (1968) 424–
425.
[36] G. Steenbeckeliers, J. Bellet, Spectre de rotation de l’eau lourde,
Comptes Rendus Hebdomadaires des Seances de L’Academie des Sci-
ences Serie B 270 (1970) 1039–1041.
[37] J. Bellet, G. Steenbeckeliers, Calcul des constantes rotationnelles des
molecules H2O, HDO et D2O dans leurs etats fondamentaux de vibra-
tion, Comptes Rendus Hebdomadaires des Seances de L’Academie des
Sciences Serie B 271 (1970) 1208–1211.
[38] F. C. De Lucia, R. L. Cook, P. Helminger, W. Gordy, Millimeter and
submillimeter wave rotational spectrum and centrifugal distortion ef-
fects of HDO, J. Chem. Phys. 55 (1971) 5334–5339.
58

[39] W. Lafferty, J. Bellet, G. Steenbeckeliers, Spectre microonde des tran-
sitions de faible intensite de la molecule HDO. Etude de la molecule
dans l’etat vibrationell exite ν2, Comptes Rendus Hebdomadaires des
Seances de L’Academie des Sciences Serie B 273 (1971) 388–391.
[40] S. A. Clough, Y. Beers, G. P. Klein, L. S. Rothman, Dipole moment
of water from Stark measurements of H2O, HDO, and D2O, J. Chem.
Phys. 59 (1973) 2254–2259.
[41] C. Camy-Peyret, J.-M. Flaud, G. Guelachvili, C. Amiot, High resolu-
tion Fourier transform spectrum of water between 2930 and 4255 cm−1,
Mol. Phys. 26 (1973) 825–855.
[42] J. W. Fleming, M. J. Gibson, Far-infrared absorption spectra of water
vapor H216O and isotopic modifications, J. Mol. Spectrosc. 62 (1976)
326–337.
[43] J. Kauppinen, T. Kakkainen, E. Kyro, High-resolution spectrum of
water vapour between 30 and 720 cm−1, J. Mol. Spectrosc. 71 (1978)
15–45.
[44] N. Papineau, C. Camy-Peyret, J. M. Flaud, G. Guelachvili, The 2ν2
and ν1 bands of HD16O, J. Mol. Spectrosc. 92 (1982) 451–468.
[45] A. D. Bykov, V. P. Lopasov, Y. S. Makushkin, L. N. Sinitsa, O. N.
Ulenikov, V. E. Zuev, Rotation-vibration spectra of deuterated water
vapor in the 9160–9390 cm−1 region, J. Mol. Spectrosc. 94 (1982) 1–27.
[46] R. A. Toth, V. D. Gupta, J. W. Brault, Line positions and strengths of
HDO in the 2400-3300 cm−1 region, Appl. Opt. 21 (1982) 3337–3345.
[47] G. Guelachvili, Experimental Doppler-limited spectra of the ν2-bands
of H216O, H2
17O, H218O, and HDO by Fourier-transform spectroscopy
59

- secondary wave-number standards between 1066 and 2296 cm−1, J.
Opt. Soc. Am. 2 (1983) 137–150.
[48] R. A. Toth, J. W. Brault, Line positions and strengths of lines in the
(001), (100), and (030) bands of HDO, Appl. Opt. 22 (1983) 908–926.
[49] J. K. Messer, F. C. De Lucia, P. Helminger, Submillimeter spectroscopy
of the major isotopes of water, J. Mol. Spectrosc. 105 (1984) 139–155.
[50] A. D. Bykov, Y. S. Makushkin, V. I. Serdyukov, L. N. Sinitsa, O. N.
Ulenikov, G. A. Ushakova, The vibration-rotation HDO absorption
spectrum between 8558 and 8774 cm−1, J. Mol. Spectrosc. 105 (1984)
397–409.
[51] J. W. C. Johns, High-resolution far-infrared (20-350-cm−1) spectra of
several isotopic species of H2O, J. Opt. Soc. Am. B 2 (1985) 1340–1354.
[52] J.-M. Flaud, C. Camy-Peyret, A. Mahmoudi, G. Guelachvili, The ν2
band of HD16O, Int. J. Infrared Millimeter Waves 7 (1986) 68–76.
[53] V. M. Devi, D. C. Benner, C. P. Rinsland, M. A. H. Smith, B. D.
Sidney, Diode laser measurements of air and nitrogen broadening in
the ν2 bands of HDO, H216O, and H2
18O, J. Mol. Spectrosc. 117 (1986)
403–407.
[54] O. I. Baskakov, V. A. Alekseev, E. A. Alekseev, B. I. Polevoi, New
submillimeter rotational lines of water and its isotopes, Opt. and Spec-
trosc. 63 (1987) 1016–1018.
[55] T. Ohshima, H. Sasada, 1.5-µm DFB semiconductor laser spectroscopy
of deuterated water, J. Mol. Spectrosc. 136 (1989) 250–263.
[56] A. D. Bykov, V. A. Kapitanov, S. M. Kobtsev, O. V. Naumenko, De-
tection and analysis of the 5ν3 absorption band in HD16O, Atm. Ocean.
Opt. 3 (1990) 133–141.
60

[57] H. Sasada, S. Takeuchi, M. Iritani, K. Nakatani, Semiconductor-laser
heterodyne frequency measurements of 1.52 µm molecular transitions,
J. Opt. Soc. Am. B 8 (1991) 713–718.
[58] C. P. Rinsland, M. A. H. Smith, V. M. Devi, D. C. Benner, Mea-
surements of Lorentz-broadening coefficients and pressure-induced line
shift coefficients in the ν2 band of HD16O, J. Mol. Spectrosc. 150 (1991)
640–646.
[59] C. P. Rinsland, M. A. H. Smith, V. M. Devi, D. C. Benner, Measure-
ment of Lorentz-broadening coefficients and pressure-induced line-shift
coefficients in the ν1 band of HD16O and the ν3 band of D216O, J. Mol.
Spectrosc. 156 (1992) 507–511.
[60] R. A. Toth, 2ν2–ν2 and 2ν2 bands of H216O, H2
17O, and H218O: line
positions and strengths, J. Opt. Soc. Am. B 10 (1993) 1526–1544.
[61] R. A. Toth, HD16O, HD18O, and HD17O transition frequencies and
strengths in the ν2 bands, J. Mol. Spectrosc. 162 (1993) 20–40.
[62] T. M. Goyette, D. W. Ferguson, F. C. De Lucia, J. M. Dutta, C. R.
Jones, The pressure broadening of HDO by O2, N2, H2, and He between
100 and 600 K, J. Mol. Spectrosc. 162 (1993) 366–374.
[63] R. Paso, V.-M. Horneman, High-resolution rotational absorption spec-
tra of H216O, HD16O, and D2
16O between 110 and 500 cm−1 , J. Opt.
Soc. Am. B 12 (1995) 1813–1838.
[64] G. Mellau, private communication, ZH2OAES emission spectrum,
P (H2O) = 16.6 torr, L = 60 cm, T = 1160 K (1997).
[65] O. Votava, J. R. Fair, D. F. Plusquellic, E. Riedle, D. J. Nesbitt, High
resolution vibrational overtone studies of HOD and H2O with single
61
mode, injection seeded ring optical parametric oscillators, J. Chem.
Phys. 107 (1997) 8854–8856.
[66] R. A. Toth, Measurement of HDO between 4719 and 5843 cm−1, J.
Mol. Spectrosc. 186 (1997) 276–292.
[67] R. A. Toth, Line positions and strengths of HDO between 6000 and
7700 cm−1, J. Mol. Spectrosc. 186 (1997) 66–89.
[68] V. V. Lazarev, T. M. Petrova, L. N. Sinitsa, Q.-S. Zhu, J.-X. Han, L.-
Y. Hao, Absorption spectrum of HD16O in 0.7 µm region, Atm. Ocean.
Opt. 11 (1998) 809–812.
[69] J. R. Fair, O. Votava, D. J. Nesbitt, OH stretch overtone spectroscopy
and transition dipole alignment of HOD, J. Chem. Phys. 108 (1998)
72–80.
[70] S.-M. Hu, H. Lin, S.-G. He, J. Cheng, Q.-S. Zhu, Fourier-transform
intra-cavity laser absorption spectroscopy of HOD VOD = 5 overtone,
Phys. Chem. Chem. Phys. 1 (1999) 3727–3730.
[71] O. Naumenko, E. Bertseva, A. Campargue, The 4v(OH) absorption
spectrum of HDO, J. Mol. Spectrosc. 197 (1999) 122–132.
[72] R. A. Toth, HDO and D2O low pressure, long path spectra in the
600-3100 cm−1 region; I. HDO line positions and strengths, J. Mol.
Spectrosc. 195 (1999) 73–97.
[73] O. Naumenko, A. Campargue, High-order resonance interactions in
HDO: analysis of the absorption spectrum in the 14980–15350 cm−1
spectral region, J. Mol. Spectrosc. 199 (2000) 59–72.
[74] A. Campargue, E. Bertseva, O. Naumenko, The absorption spectrum
of HDO in the 16 300 – 16 670 and 18 000 – 18 350 cm−1 spectral
regions, J. Mol. Spectrosc. 204 (2000) 94–105.
62

[75] O. Naumenko, E. Bertseva, A. Campargue, D. W. Schwenke, Experi-
mental and ab initio studies of the HDO absorption spectrum in the
13165 – 13500 cm−1 spectral region, J. Mol. Spectrosc. 201 (2000) 297–
309.
[76] K. J. Siemsen, J. E. Bernard, A. A. Madej, L. Marmet, Absolute fre-
quency measurement of an HDO absorption line near 1480 cm−1, J.
Mol. Spectrosc. 199 (2000) 144–145.
[77] S.-M. Hu, O. N. Ulenikov, G. A. Onopenko, E. S. Bekhtereva, S.-G.
He, X.-H. Wang, H. Lin, Q.-S. Zhu, High-resolution ro-vibrational spec-
troscopy of HDO in the region of 7600-8100 cm−1, J. Mol. Spectrosc.
203 (2000) 228–234.
[78] E. Bertseva, O. Naumenko, A. Campargue, The 5vOH overtone transi-
tion of HDO, J. Mol. Spectrosc. 203 (2000) 28–36.
[79] X.-H. Wang, S.-G. He, S.-M. Hu, J.-J. Zheng, Q.-S. Zhu, Analysis of the
HDO absorption spectrum between 9600-10200 cm−1, Chinese Phys. 9
(2001) 885–891.
[80] A. Jenouvrier, M. F. Merienne, M. Carleer, R. Colin, A. C. Vandaele,
P. F. Bernath, O. L. Polyansky, J. Tennyson, The visible and near
ultraviolet overtone spectrum of HOD, J. Mol. Spectrosc. 209 (2001)
165–168.
[81] O. N. Ulenikov, S.-M. Hu, E. S. Bekhtereva, G. A. Onopenko, X. H.
Wang, S.-G. He, J.-J. Zheng, Q.-S. Zhu, High-resolution Fourier trans-
form spectrum of HDO in the region 6140-7040 cm−1, J. Mol. Spectrosc.
208 (2001) 224–235.
[82] T. Parekunnel, P. F. Bernath, N. F. Zobov, S. V. Shirin, O. L. Polyan-
sky, J. Tennyson, Emission spectrum of hot HDO in the 380 – 2190
cm−1 region, J. Mol. Spectrosc. 210 (2001) 28–40.
63

[83] S.-M. Hu, S.-G. He, J.-J. Zheng, X.-H. Wang, Y. Ding, Q.-S. Zhu,
High-resolution analysis of the v2 + 2v3 band of HDO, Chinese Phys.
10 (2001) 1021–1027.
[84] P.-F. Coheur, S. Fally, M. Carleer, C. Clerbaux, R. Colin, A. Jenou-
vrier, M. F. Merienne, C. Hermans, A. C. Vandaele, New water vapor
line parameters in the 26000-13000 cm−1 region, J. Quant. Spectrosc.
Radiat. Transfer 74 (2002) 493–510.
[85] S. N. Mikhailenko, V. G. Tyuterev, V. I. Starikov, K. K. Albert, B. P.
Winnewisser, M. Winnewisser, G. Mellau, C. Camy-Peyret, R. Lan-
quetin, J.-M. Flaud, J. W. Brault, Water spectra in the region 4200-
6250 cm−1; extended analysis of ν1 + ν2, ν2 + ν3, and 3ν2 bands and
confirmation of highly excited states from flame spectra and from atmo-
spheric long-path observations, J. Mol. Spectrosc. 213 (2002) 91–121.
[86] A. Janca, K. Tereszchuk, P. F. Bernath, N. F. Zobov, S. V. Shirin,
O. L. Polyansky, J. Tennyson, Emission spectrum of hot HDO below
4000 cm−1, J. Mol. Spectrosc. 219 (2003) 132–135.
[87] E. Bertseva, O. V. Naumenko, A. Campargue, The absorption spec-
trum of HDO around 1.0 µm by ICLAS-VECSEL, J. Mol. Spectrosc.
221 (2003) 38–46.
[88] M. F. Merienne, A. Jenouvrier, C. Hermans, A. C. Vandaele, M. Car-
leer, C. Clerbaux, P. F. Coheur, R. Colin, S. Fally, M. Bach, Water
vapor line parameters in the 13000-9250 cm−1 region, J. Quant. Spec-
trosc. Radiat. Transfer 82 (2003) 92–117.
[89] O. V. Naumenko, S. M. Hu, S.-G. He, A. Campargue, Rovibrational
analysis of the absorption spectrum of HDO between 10 110 and 12
215 cm−1, Phys. Chem. Chem. Phys. 6 (2004) 910–918.
64
[90] O. V. Naumenko, S. Voronina, S.-M. Hu, High resolution Fourier trans-
form spectrum of HDO in the 7500–8200 cm−1 region: revisited, J. Mol.
Spectrosc. 227 (2004) 151–157.
[91] P. Macko, D. Romanini, S. N. Mikhailenko, O. V. Naumenko, S. Kassi,
A. Jenouvrier, V. G. Tyuterev, A. Campargue, High sensitivity CW-
cavity ring down spectroscopy of water in the region of the 1.5 µm
atmospheric window, J. Mol. Spectrosc. 227 (2004) 90–108.
[92] R. N. Tolchenov, J. Tennyson, Water line parameters for weak lines in
the range 7400–9600 cm−1, J. Mol. Spectrosc. 231 (2005) 23–27.
[93] R. N. Tolchenov, N. F. Zobov, S. V. Shirin, O. L. Polyansky, J. Ten-
nyson, O. Naumenko, M. Carleer, P.-F. Coheur, S. Fally, A. Jenouvrier,
A. C. Vandaele, Water vapor line assignments in the 9250 – 26000 cm−1
frequency range, J. Mol. Spectrosc. 233 (2005) 68–76.
[94] M. Bach, S. Fally, P.-F. Coheur, M. Carleer, A. Jenouvrier, A. C. Van-
daele, Line parameters of HDO from high-resolution Fourier transform
spectroscopy in the 11500–23000 cm−1 spectral region, J. Mol. Spec-
trosc. 232 (2005) 341–350.
[95] O. N. Ulenikov, S.-M. Hu, E. S. Bekhtereva, Q.-S. Zhu, High-resolution
ro-vibrational spectroscopy of HDO in the region of 8900-9600 cm−1,
J. Mol. Spectrosc. 231 (2005) 57–65.
[96] A. Campargue, I. Vasilenko, O. Naumenko, Intracavity laser absorp-
tion spectroscopy of HDO between 11645 and 12 330 cm−1, J. Mol.
Spectrosc. 234 (2005) 216–227.
[97] P. Theule, A. Callegari, T. R. Rizzo, J. S. Muenter, Dipole moments of
HDO in highly excited vibrational states measured by Stark induced
photofragment quantum beat spectroscopy, J. Chem. Phys. 122 (2005)
124312.
65

[98] O. V. Naumenko, O. Leshchishina, A. Campargue, High sensitivity
absorption spectroscopy of HDO by ICLAS-VeCSEL between 9100 and
9640 cm−1, J. Mol. Spectrosc. 236 (2006) 58–69.
[99] L. Joly, B. Parvitte, V. Zeninari, D. Courtois, G. Durry, A spectro-
scopic study of water vapor isotopologues H216O, H2
18O and HDO us-
ing a continuous wave DFB quantum cascade laser in the 6.7 µm region
for atmospheric applications, J. Quant. Spectrosc. Radiat. Transfer 102
(2006) 129–138.
[100] B. A. Voronin, O. V. Naumenko, R. N. Tolchenov, J. Tennyson, S. Fally,
P.-F. Coheur, M. Carleer, A. Jenouvrier, A. C. Vandaele, HDO absorp-
tion spectrum above 11500 cm−1: Assignment and dynamics, J. Mol.
Spectrosc. 244 (2007) 87–101.
[101] A. Jenouvrier, L. Daumont, L. Regalia-Jarlot, V. G. Tyuterev, M. Car-
leer, A. C. Vandaele, S. Mikhailenko, S. Fally, Fourier transform mea-
surements of water vapor line parameters in the 4200–6600 cm−1 region,
J. Quant. Spectrosc. Radiat. Transfer 105 (2007) 326–355.
[102] F. Mazzotti, R. N. Tolchenov, A. Campargue, High sensitivity ICLAS
of H218O in the region of the second decade (11520 – 12810 cm−1), J.
Mol. Spectrosc. 243 (2007) 78–89.
[103] S. N. Mikhailenko, L. Wang, S. Kassi, A. Campargue, Weak water
absorption lines around 1.455 and 1.66 µm by CW-CRDS, J. Mol.
Spectrosc. 244 (2007) 170–178.
[104] O. V. Naumenko, B. A. Voronin, F. Mazzotti, J. Tennyson, A. Cam-
pargue, Intracavity Laser Absorption Spectroscopy of HDO between
12145 and 13160 cm−1, J. Mol. Spectrosc. 248 (2008) 122–133.
[105] D. Lisak, J. T. Hodges, Low-uncertainty H2O line intensities for the
930-nm region, J. Mol. Spectrosc. 249 (2008) 6–13.
66

[106] T. M. Petrova, L. N. Sinitsa, A. M. Solodov, H2O lines shifts measure-
ments in 1.06 µm region, SPIE 6936 (2008) 93602–93602.
[107] R. N. Tolchenov, J. Tennyson, Water Line Parameters from Refitted
Spectra constrained by empirical upper state levels: study of the 9500
– 14500 cm−1 region, J. Quant. Spectrosc. Radiat. Transfer 109 (2008)
559–568.
[108] A. Liu, O. Naumenko, S. Kassi, A. Campargue, High sensitivity CW-
CRDS of 18O enriched water near 1.6 µm, J. Quant. Spectrosc. Radiat.
Transfer 110 (2009) 1781–1800.
[109] O. V. Naumenko, S. Beguier, O. M. Leshchishina, A. Campargue,
ICLAS of HDO between 13020 and 14115 cm−1, J. Quant. Spectrosc.
Radiat. Transfer 111 (2010) 36–44.
[110] F. J. Lovas, Microwave spectral tables. II. Triatomic molecules, J. Phys.
Chem. Ref. Data 7 (1978) 1445–1750.
[111] M. J. Stevenson, C. H. Townes, Quadrupole moment of 17O, Phys. Rev.
107 (1957) 635–637.
[112] Z. Zelinger, B. Barret, P. Kubat, P. Ricaud, J.-L. Attie, E. L.
Flochmoen, J. Urban, D. Murtagh, M. Strizık, Observation of HD18O,
CH3OH and vibrationally-excited N2O from Odin/SMR measurements,
Mol. Phys. 104 (2006) 2815–2820.
[113] R. A. Toth, Measurements of line positions and strengths of HD18O
and D218O in the 2500-4280 cm−1 region, J. Mol. Structure 742 (2005)
49–68.
[114] S. N. Mikhailenko, S. A. Tashkun, T. A. Putilova, E. N. Starikova,
L. Daumont, A. Jenouvrier, S. Fally, M. Carleer, C. Hermans, A. C.
67
Vandaele, Critical evaluation of measured rotation-vibration transi-
tions and an experimental dataset of energy levels of HD18O, J. Quant.
Spectrosc. Radiat. Transfer 110 (2009) 597–608.
[115] S. N. Mikhailenko, S. A. Tashkun, L. Daumont, A. Jenouvrier, S. Fally,
A. C. Vandaele, M. Carleer, Line positions and energy levels of the 18O
substitutions from the HDO/D2O spectra between 5600 and 8800 cm−1,
J. Quant. Spectrosc. Radiat. Transfer (2010) in press.
[116] H. Partridge, D. W. Schwenke, The determination of an accurate iso-
tope dependent potential energy surface for water from extensive ab
initio calculations and experimental data, J. Chem. Phys. 106 (1997)
4618–4639.
[117] E. Matyus, C. Fabri, T. Szidarovszky, G. Czako, W. D. Allen,
A. G. Csaszar, Assigning quantum labels to variationally computed
rotational–vibrational eigenstates, J. Chem. Phys. (2010) in press.
[118] B. A. Voronin, R. N. Tolchenov, J. Tennyson, A. A. Lugovskoy, S. N.
Yurchenko, A high accuracy computed line list for the HDO molecule,
Mon. Not. R. astr. Soc. 402 (2009) 492–496.
[119] S. N. Yurchenko, B. A. Voronin, R. N. Tolchenov, N. Doss, O. V.
Naumenko, W. Thiel, J. Tennyson, Potential energy surface of HDO
up to 25000 cm−1, J. Chem. Phys. 128 (2008) 044312.
[120] L. Lodi, R. N. Tolchenov, J. Tennyson, A. E. Lynas-Gray, S. V. Shirin,
N. F. Zobov, O. L. Polyansky, A. G. Csaszar, J. Tennyson, J. van
Stralen, L. Visscher, A high accuracy dipole surface for water, J. Chem.
Phys. 128 (2008) 044304.
[121] J. Tennyson, M. A. Kostin, P. Barletta, G. J. Harris, J. Ramanlal, O. L.
Polyansky, N. F. Zobov, DVR3D: a program suite for the calculation
68

of rotation-vibration spectra of triatomic molecules, Computer Phys.
Comm. 163 (2004) 85–116.
[122] O. L. Polyansky, N. F. Zobov, S. Viti, J. Tennyson, P. F. Bernath,
L. Wallace, K band spectrum of water in sunspots, Astrophys. J. 489
(1997) L205–L208.
[123] A. Bykov, O. Naumenko, L. Sinitsa, B. Voronin, J.-M. F. C. Camy-
Peyret, R. A. Lanquetin, High-order resonances in the water molecule,
J. Mol. Spectrosc. 205 (2001) 1–8.
[124] C. Freed, R. G. Odonnell, A. H. M. Ross, Absolute frequency calibra-
tion of CO2 isotope laser transitions, IEEE Trans. Instru. Meas. 25
(1976) 431–437.
[125] D. J. E. Knight, G. J. Edwards, P. R. Pearce, N. R. Cross, Measurement
of the frequency of the 3.39-µm methane-stabilized laser to ±3 parts
in 1011, IEEE Trans. Instru. Meas. 29 (1980) 257–264.
[126] C. R. Pollock, F. R. Petersen, D. A. Jennings, J. S. Wells, A. G. Maki,
Absolute frequency measurements of the 2− 0 band at CO at 2.3 µm;
calibration standard frequencies from high resolution color center laser
spectroscopy, J. Mol. Spectrosc. 99 (1983) 357–368.
[127] L. R. Brown, R. A. Toth, Comparisons of the frequencies of NH3, CO2,
H2O, N2O and CH4 as Infrared Calibration Standards, J. Opt. Soc.
Am. B 2 (1985) 842–856.
[128] K. Nakagawa, M. deLabachelerie, Y. Awaji, M. Kourogi, Accurate op-
tical frequency atlas of the 1.5 µm bands of acetylene, J. Opt. Soc. Am.
B 13 (1996) 842–856.
[129] S. Falke, E. Tiemann, C. Lisdat, H. Schnatz, G. Grosche, Transition
frequencies of the D lines of 39K, 40K and 41K measured with a fem-
tosecond laser frequency comb, Phys. Rev. A 149 (2006) 032503.
69
[130] G. Guelachvili, M. Birk, C. J. Borde, J. W. Brault, L. R. Brown,
B. Carli, A. R. H. Cole, K. M. Evenson, A. Fayt, D. Hausamann,
J. W. C. Johns, J. Kauppinen, Q. Kou, A. G. Maki, K. N. Rao, R. A.
Toth, W. Urban, A. Valentin, J. Verges, G. Wagner, M. H. Wappel-
horst, J. S. Wells, B. P. Winnewisser, M. Winnewisser, High resolution
wavenumber standards for the infrared, J. Mol. Spectrosc. 177 (1996)
164–179.
[131] A. Maki, J. Wells, New wave-number calibration tables from hetero-
dyne frequency measurements, J. Res. Nat. Inst. Stand. Technol. 97
(1992) 409–470.
[132] L. S. Rothman, R. R. Gamache, A. Goldman, L. R. Brown, R. A.
Toth, H. M. Pickett, R. L. Poynter, et al., The HITRAN database –
1986 edition, Appl.Opt. 26 (1987) 4058–4097.
[133] G. Guelachvili, Absolute wavenumbers and molecular constants of the
fundamental bands of 12C16O, 12C17O, 12C18O, 13C16O, 13C18O and of
the 2-1 bands of 12C16O and 13C16O around 5 µm by Fourier spec-
troscopy under vacuum, J. Mol. Spectrosc. 75 (1979) 251–269.
[134] H. Sasada, K. Yamada, Calibration lines of HCN in the 1.5 µm region,
Appl. Opt. 29 (1990) 3535–3547.
[135] R. A. Toth, Measurement of H216O line positions and strengths – 11610
to 12861 cm−1, J. Mol. Spectrosc. 116 (1994) 176–183.
[136] R. Schermaul, J. W. Brault, A. A. D. Canas, R. C. M. Learner, O. L.
Polyansky, N. F. Zobov, D. Belmiloud, J. Tennyson, Weak line water
vapour spectrum in the regions 13 200 – 15 000 cm−1, J. Mol. Spectrosc.
211 (2002) 169–178.
[137] R. Schermaul, R. C. M. Learner, D. A. Newnham, R. G. Williams,
J. Ballard, N. F. Zobov, D. Belmiloud, J. Tennyson, The water vapour
70
spectrum in the region 8600–15000 cm−1: experimental and theoretical
studies for a new spectral line database i: Laboratory measurements,
J. Mol. Spectrosc. 208 (2001) 32–42.
[138] A. W. Liu, J. H. Du, K. F. Song, L. Wang, L. Wan, S. M. Hu,
High-resolution Fourier-transform spectroscopy of 18O-enriched water
molecule in the 1080-7800 cm−1 region, J. Mol. Spectrosc. 237 (2006)
149–162.
[139] J. K. Messer, F. C. De Lucia, P. Helminger, The pure rotational spec-
trum of water-vapor – a millimeter, submillimeter and far infrared anal-
ysis, Int. J. Infrared Millimeter Waves 4 (1983) 505–539.
[140] D. W. Schwenke, H. Partridge, Convergence testing of the analytic
representation of an ab initio dipole moment function for water: Im-
proved fitting yields improved intensities, J. Chem. Phys. 113 (2000)
6592–6597.
[141] L. S. Rothman, I. E. Gordon, A. Barbe, D. C. Benner, P. F. Bernath,
M. Birk, V. Boudon, et al, The HITRAN 2008 molecular spectroscopic
database, J. Quant. Spectrosc. Radiat. Transfer 110 (2009) 533–572.
[142] L. S. Rothman, D. Jacquemart, A. Barbe, D. C. Benner, M. Birk, L. R.
Brown, M. Carleer, et al., The HITRAN 2004 molecular spectroscopic
database, J. Quant. Spectrosc. Radiat. Transfer 96 (2005) 139–204.
[143] H. M. Pickett, R. L. Poynter, E. A. Cohen, M. L. Delitsky, J. C. Pear-
son, H. S. P. Muller, Submillimeter, millimeter, and microwave spectral
line catalog, J. Quant. Spectrosc. Radiat. Transfer 60 (1998) 883–890.
[144] R. A. Toth, SISAM database http://mark4sun.jpl.nasa.gov (2007).
[145] JPL catalog.
URL http://spec.jpl.nasa.gov/ftp/pub/catalog/catdir.html
71
[146] L. Lodi, J. Tennyson, A linelist of allowed and forbidden rotational
transitions for water, J. Quant. Spectrosc. Radiat. Transfer 109 (2008)
1219–1233.
[147] D. Lisak, D. K. Havey, J. T. Hodges, Spectroscopic line parameters of
water vapor for rotation-vibration transitions near 7180 cm−1, Phys.
Rev. A 79 (2009) 052507.
[148] A. D. Bykov, A. Z. Fazliev, N. N. Filippov, A. V. Kozodoev, A. I.
Privezentsev, L. N. Sinitsa, M. V. Tonkov, M. Y. Tretyakov, Dis-
tributed information system on atmospheric spectroscopy, geophysical
Research Abstracts, Vol. 9, 01906, SRef-ID: 1607-7962/gra/EGU2007-
A-01906 (2007).
[149] A. G. Csaszar, A. Z. Fazliev, J. Tennyson, W@DIS - Prototype informa-
tion system for systematization of spectral data of water, abstracts of
the Twentieth Colloquium on High Resolution Molecular Spectroscopy,
(Dijon, France) http://vesta.u-bourgogne.fr/hrms/ (2007).
[150] G. Guelachvili, K. N. Rao, Handbook of infrared standards, Academic
Press, Orlando FL, 1986.
[151] C. Puzzarini, G. Cazzoli, M. E. Harding, J. Vazquez, J. Gauss, A
new experimental absolute nuclear magnetic shielding scale for oxygen
based on the rotational hyperfine structure of H217O, J. Chem. Phys.
131 (2009) 234304.
72
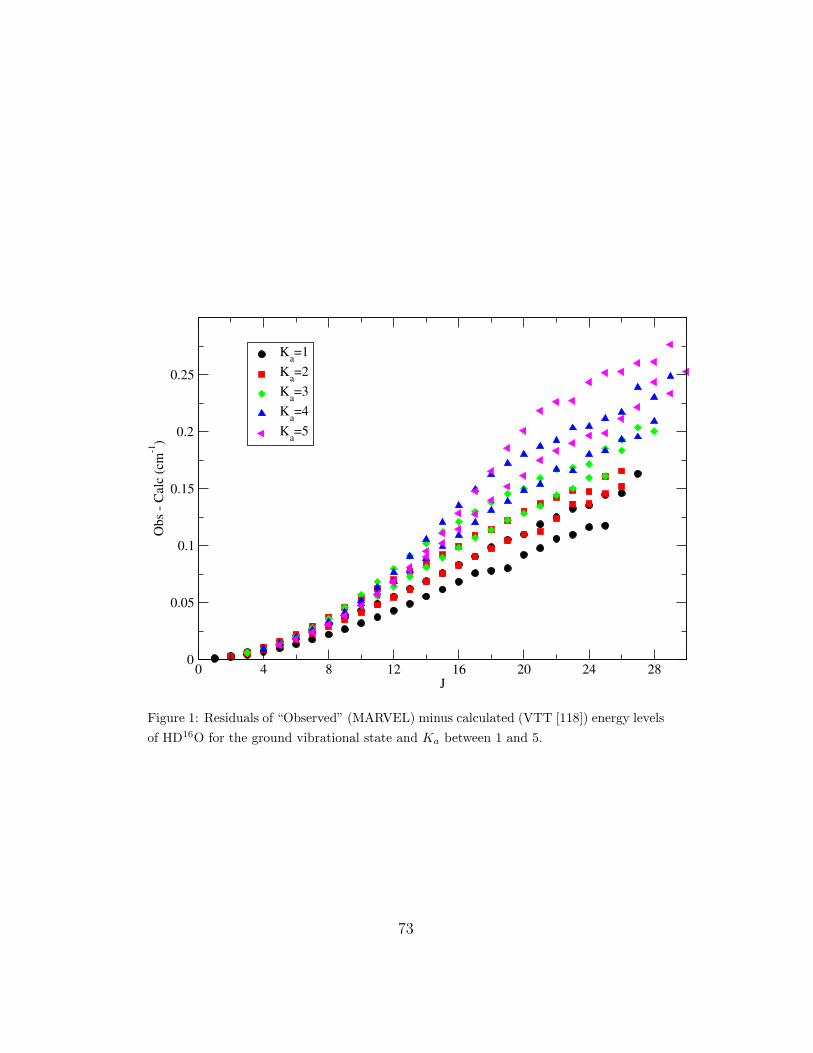
0 4 8 12 16 20 24 28J
0
0.05
0.1
0.15
0.2
0.25
Obs
- Ca
lc (c
m-1
)
Ka=1Ka=2Ka=3Ka=4Ka=5
Figure 1: Residuals of “Observed” (MARVEL) minus calculated (VTT [118]) energy levelsof HD16O for the ground vibrational state and Ka between 1 and 5.
73
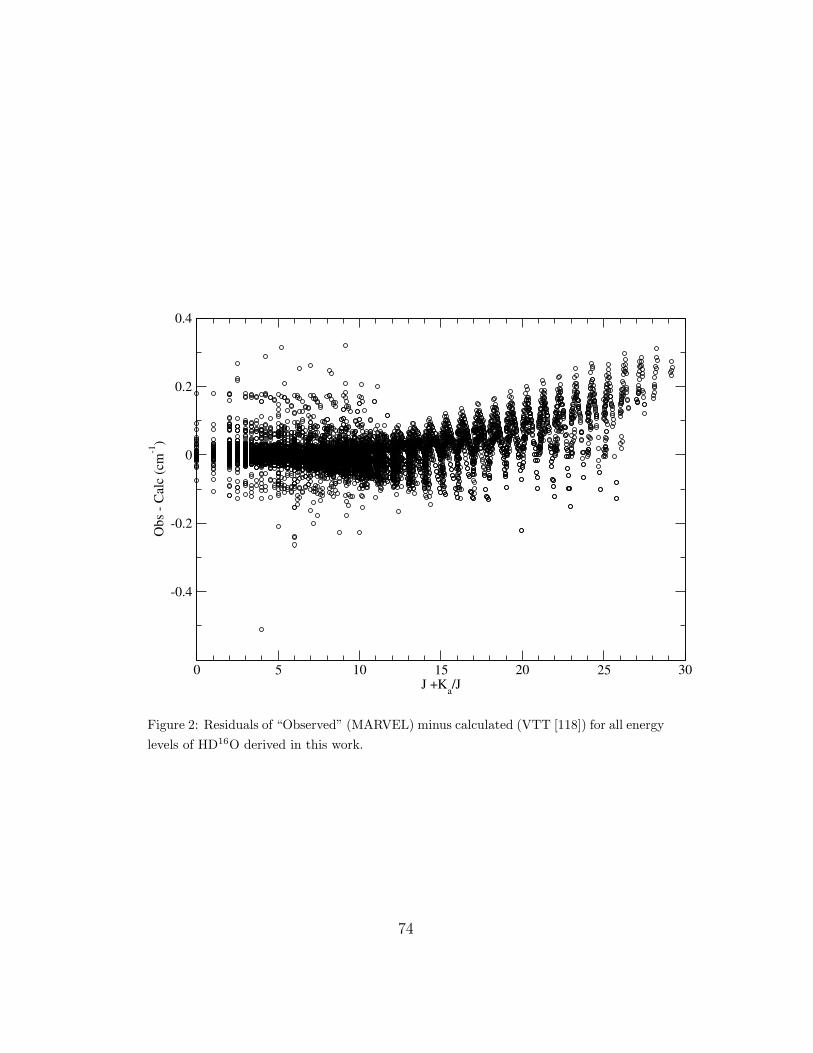
0 5 10 15 20 25 30J +Ka/J
-0.4
-0.2
0
0.2
0.4
Obs
- Ca
lc (c
m-1
)
Figure 2: Residuals of “Observed” (MARVEL) minus calculated (VTT [118]) for all energylevels of HD16O derived in this work.
74
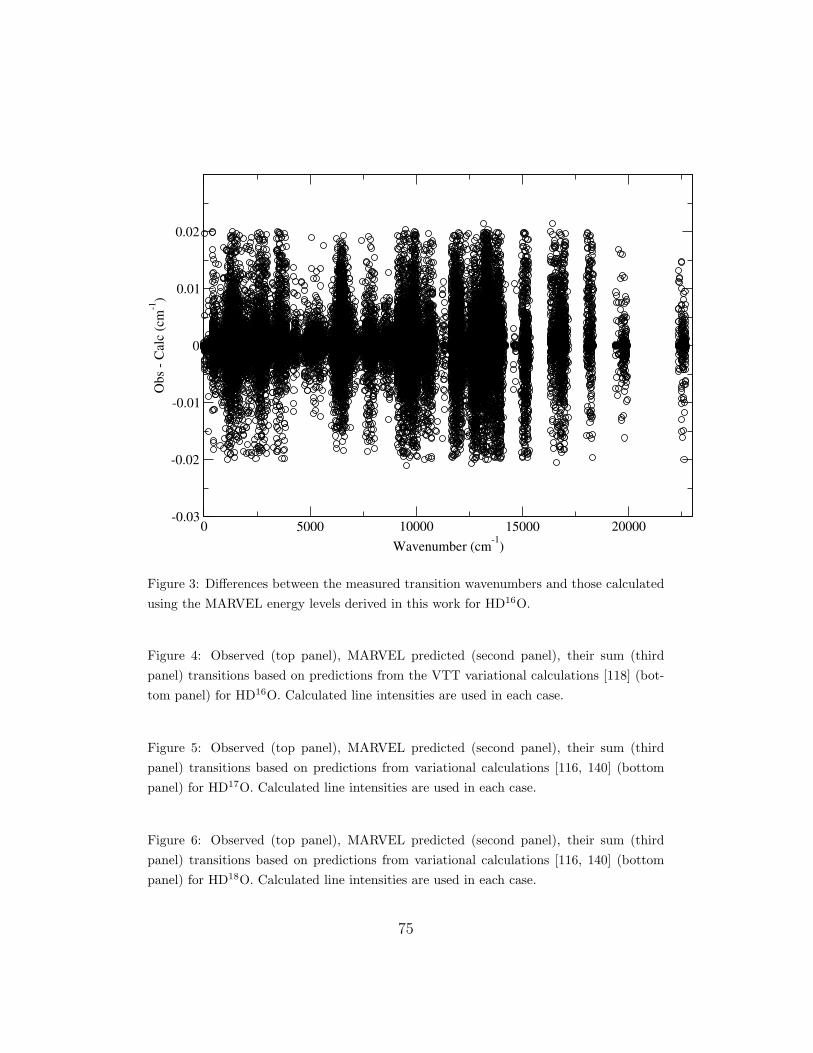
0 5000 10000 15000 20000Wavenumber (cm-1)
-0.03
-0.02
-0.01
0
0.01
0.02
Obs
- Ca
lc (c
m-1
)
Figure 3: Differences between the measured transition wavenumbers and those calculatedusing the MARVEL energy levels derived in this work for HD16O.
Figure 4: Observed (top panel), MARVEL predicted (second panel), their sum (thirdpanel) transitions based on predictions from the VTT variational calculations [118] (bot-tom panel) for HD16O. Calculated line intensities are used in each case.
Figure 5: Observed (top panel), MARVEL predicted (second panel), their sum (thirdpanel) transitions based on predictions from variational calculations [116, 140] (bottompanel) for HD17O. Calculated line intensities are used in each case.
Figure 6: Observed (top panel), MARVEL predicted (second panel), their sum (thirdpanel) transitions based on predictions from variational calculations [116, 140] (bottompanel) for HD18O. Calculated line intensities are used in each case.
75


