
1
Is Foreign Direct Investment Good for Growth? Evidence from Sectoral Analysis of China and Vietnam
Tam Bang Vu* College of Business and Economics University of Hawai’i at Hilo Byron Gangnes Department of Economics University of Hawai’i at Manoa and Ilan Noy Department of Economics University of Hawai’i at Manoa
September 2007
Abstract
We estimate the impact of FDI on growth using sectoral data for FDI inflows to China and Vietnam. Previous empirical studies, using either cross-country growth regressions or firm-level micro-econometric analysis, fail to reach a consensus. Our paper is the first to use sectoral FDI inflow data to evaluate the sector-specific impact of FDI on growth. Our results show that, for the two developing-transition economies we examine, FDI has a statistically-significant positive effect on economic growth operating directly and through its interaction with labor. Intriguingly, we find the effects seem to be very different across economic sectors, with almost all the beneficial impact limited to industrial sector. Other sectors appear to gain very little growth benefit from sector-specific FDI. Keywords: Foreign direct investment, growth, China, Vietnam. JEL codes: F21, F23. * Corresponding author: Tam Vu, University of Hawai’i at Hilo, 200 West Kawili, Hilo, Hawaii, 96720, USA, [email protected], 001-808-974-7462.
2
1. Introduction
During the past two decades, foreign direct investment (FDI) has become
increasingly important in the developing world, with a growing number of developing
countries succeeding in attracting substantial and rising amounts of inward FDI. The
theoretical literature in economics identifies a number of channels through which FDI
inflows may be beneficial to the receiving economy. Yet, the empirical literature has
lagged behind and has had more trouble identifying these advantages in practice. Most
prominently, a large number of applied papers have looked at the FDI-growth nexus, but
their results have been far from conclusive.1 Notwithstanding the absence of any robust
conclusions, most countries continue to vigorously pursue policies aimed at encouraging
more FDI inflows.2
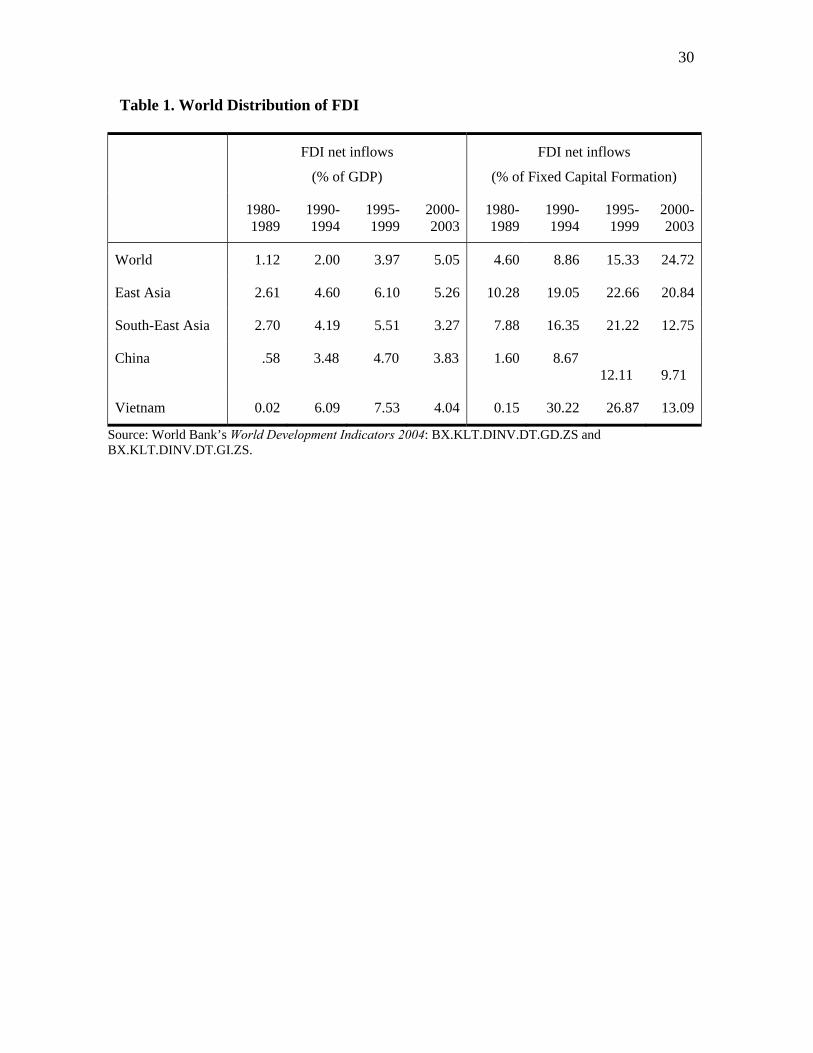
Table 1 presents recent trends in FDI inflows both as a percent of output and as a
percent of fixed capital formation. Apparent is the worldwide trend increase in the
importance of FDI (using both measures), with FDI inflows during the past decade
increasing to 4-5 times the level experienced during the 1980s. While there was a
doubling of foreign investment into East Asia during this time period, the Asian FDI
inflow period peaked in 1995-1999 and current levels are still below that peak.
A closer look at these measures for China (including Hong Kong) and Vietnam
reveals a similar trend, with both experiencing almost no inflows during the 1980s and a
very dramatic increase throughout the 1990s. Relative to the size of their economies FDI
flows into Vietnam are almost twice as large as those flowing into China. Neither
1 With the availability of better data, the last few years have seen an especially large number of empirical papers devoted to this question (e.g., Alfaro et al., 2004; Bengoa and Sanchez-Robles, 2003; Durham, 2004; Hsiao and Shen, 2003; and Li and Liu, 2005). 2 For a critical look at these domestic tax/subsidy policies, see Hanson (2001) and Mooij and Ederveen (2003). Gastanaga et al. (1998) analyze other host-country policies that aim to encourage FDI inflows.
3
country’s experience appears unique in the region; their FDI inflows show the same
relative magnitudes and temporal dynamics as other countries in East Asia.
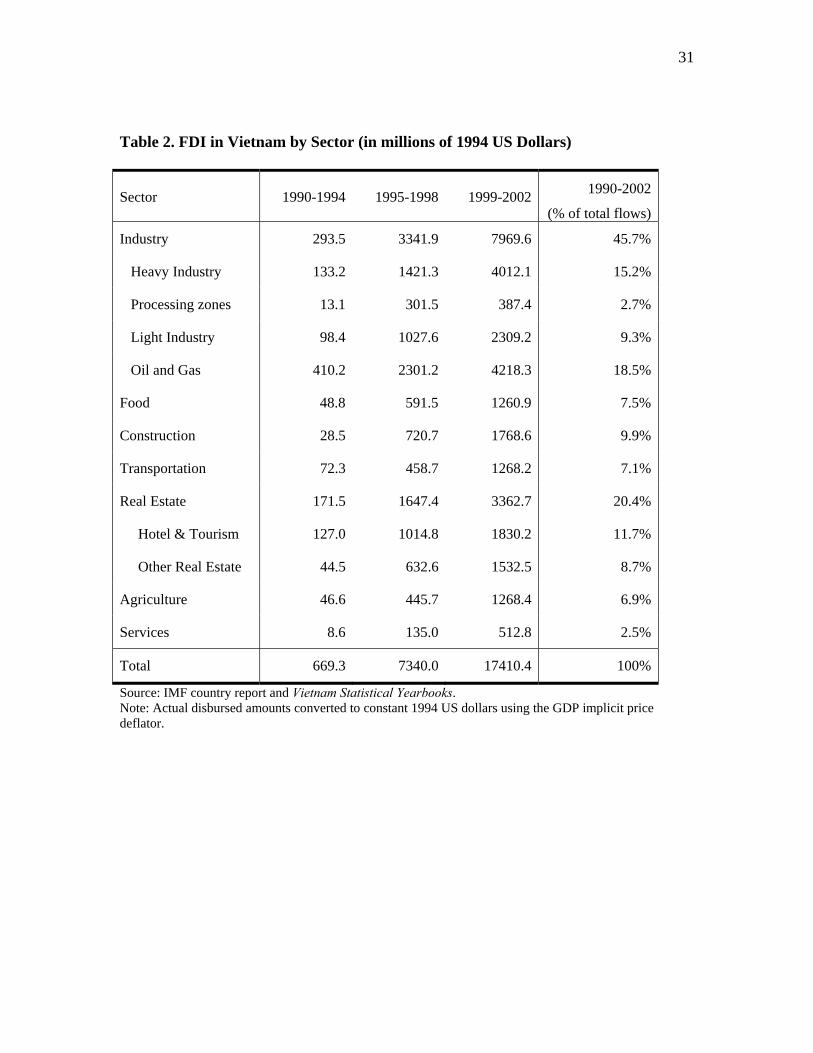
FDI inflows are not uniformly distributed across production sectors, nor is their
sectoral composition (Tables 2 and 3) the same for the two countries. For China, the
dominant sector, industry⎯defined as a combination of mining and quarrying,
manufacturing, and utilities (electricity, gas, and water)⎯accounts for 82.9% of total
inflows out of five sectors for which data are available. For Vietnam, the industrial
sector accounts for less than 46% of total inflows out of eight sectors for which data are
available.
It may be possible to gain insight into the FDI-growth nexus by examining FDI
impacts at the sectoral level. And the dramatic but uneven opening of these two
economies provides a promising environment in which to look for industry-differences.
The opening up of China and Vietnam to foreign investments began in 1979 and
1987, respectively. Since then, the legal regimes governing foreign investments have
been progressively liberalized with important modifications to the laws governing such
investments made in recent years.3
At the same time, liberalization is far from complete in both countries, and
customary rules may often be in conflict with the formal legal code. These customary
rules require an individual to obey local rules drafted by community leaders over and
above the government’s laws. Any effort by the central government to contact the
individual directly may be met with “bamboo fences” in a system that values community
benefits above private ones. These customary rules create a patronage system that invites
3 Details for Vietnam can be found at http://www.vietnamlaws.com/legal_updates.aspx. There are numerous sources for China. See, for example, http://www.chinatoday.com/law/a0.htm.
4
corruption among government officials at the intermediate levels.4 In a 2006 ranking of
property rights from the Heritage Foundation, both China and Vietnam rank very low,
with China ranking a 4 and Vietnam a 5 (for an index 1-5 with low scores implying better
property rights protection).5 All these characteristics make China’s and Vietnam’s
governance exceptionally weak and inconsistent and make it more difficult to maintain an
environment friendly to foreign investors. These barriers are likely to be more important
in some sectors than in others, potentially affecting the growth effects deriving from FDI
in particular sectors.
In this paper, we use an augmented production function to estimate the impact of
FDI on growth using sectoral data for Vietnam and China (including Hong Kong). We
let FDI affect GDP growth directly and also indirectly through its interaction with labor.
This approach creates heteroskedasticity, and so feasible generalized least squares
(FGLS) is employed. The results show that FDI in both countries has a positive and
statistically significant effect on economic growth operating directly and indirectly
through interaction with labor. Interestingly, the effect is not equally distributed across
economic sectors. FDI only has a consistently positive effect on growth in the
manufacturing sector; its effect on other sectors is usually statistically insignificant, in
some cases even negative.
Our paper contributes insights on the FDI-growth nexus in several important
ways. First, we employ a case study (single-country) regression-based approach that
enables us to disregard variables that measure the institutional, legal and cultural
environment in which FDI projects are implemented and which may have an important
4 See, for example, Tran (1997), Walter (1979) and Do (1993). 5 Few countries received a 5. Examples for these are Zimbabwe, Turkmenistan, Sierra Leone, Libya, and North Korea. For details see: http://www.heritage.org/research/features/index/downloads.cfm#scores.
5
impact on their growth consequences. The difficulty measuring these institutional
characteristics hinders easy identification in cross-country approaches.6
Second, to the best of our knowledge, our paper is the first to use data from
different sectors to examine the sectoral differences in the impact of FDI on economic
growth. This is potentially important since much of the recent theoretical and empirical
micro-econometric literature concludes that FDI spillovers, if they exist, are found in
intra-industry rather than in inter-industry settings.7 This finding further justifies our
attempt to ask whether the impact of FDI on growth might be different for different
sectors and to begin to investigate whether particular sectoral characteristics are
conducive to a positive impact of FDI.
Finally, we believe that the experience of China and Vietnam may be similar to
the development path taken by a significant number of other countries, especially those
that have recently opened up their economies after years of economic repression and that
have experienced rapid rise in trade, FDI and incomes. This last point, of course, opens
up a new comparative research agenda that we intend to pursue in future work.
A number of hypotheses have been offered regarding the interaction of foreign
investment and growth. Singer (1950) argued that FDI will "crowd out" domestic
investment since foreign firms often have greater access, at better terms, to international
capital markets and will use the cheaper credit to drive out otherwise productive firms.
This makes the foreign firms superior to the domestic ones in financing large projects and
in taking advantage of changes in comparative costs, consumers’ tastes, and market
6 See Mukand and Rodrik (2005) for insights into this problem that are relevant to the policy-applicability of estimation results. 7 For a recent survey of the issue of inter- vs. intra-industry spillovers from FDI see Lipsey and Sjöholm (2005).

6
conditions. Findlay (1978) models this channel explicitly using an augmented Solow
model. Assuming that domestic technology is an increasing function of FDI, he finds
that the growth effect of FDI is ambiguous; an increase in the technology level might be
offset by an increase in the dependency on foreign capital.8
Romer (1990) looks at technology as a non-rival input and at foreign direct
investment as a source of technological advance. In this case, the FDI effect is
unequivocally positive. Bhagwati (1978, 1985) on the other hand, suggests that the
growth effects of FDI might be positive for export promoting (EP) countries but negative
for import substituting (IS) ones; the reduction of foreign import goods in the domestic
market reduces competition and efforts to improve efficiency among the domestic firms.
Reis (2001) uses an endogenous growth model to evaluate the growth effects of
FDI when the investing firm’s profits may be repatriated. She finds that, in equilibrium,
foreign firms replace all domestic firms in the R&D sector. In this model, FDI only adds
a positive effect to growth if the world interest rate is lower than the home interest rate.
These hypotheses guide, to a large extent, all the empirical research that is described in
the following section. Section 2 provides a brief survey on the state of current empirical
work on the growth effects of FDI. Section 3 presents our model and the data we use.
Section 4 analyzes the empirical results, and Section 5 concludes.
1. Existing Empirical Literature
In light of the conflicting results in the theoretical literature, the FDI-growth
problem remains largely an empirical one. In this section, we describe the current state of
8 A related channel is the ‘creative destruction’ hypothesis raised by Aghion and Howitt (1992). If the competition from the foreign investors results in the destruction of inefficient firms, the FDI effect will turn out to be positive.
7
empirical research on the FDI-growth nexus through cross-country studies, intra-regional
comparisons, and specific case studies.
2.1 Cross-Country Studies
The early empirical work on the FDI-growth nexus modified the growth
accounting method introduced by Solow (1957). This approach defined an augmented
Solow model with technology, capital, labor, inward FDI, and a vector of ancillary
variables such as imports, exports, etc. Taking the logs and time derivatives of the
explanatory variables yields an equation in growth rates for all variables with a “Solow
residual” measuring total factor productivity (TFP) growth. Using this method and
annual panel data for 46 developing countries, Balasubramanyam et al. (1996) find
support for Bhagwati’s hypothesis (1978, 1985) that the growth effect of FDI is positive
for export promoting countries and might be negative for import substituting ones.
However, the growth rate of capital in growth accounting equations might be
correlated with the growth rate of technology. Hence, there might be endogeneity biases
involved in their estimation. Another empirical problem of the Solow-Swan model lies in
its fast convergence. Mankiw et al. (1992) test their theoretical model of endogenous
growth and find that, with human capital added to physical capital, the rate of
convergence is much slower.
Influenced by this approach, most empirical models add education to the
augmented equation as a proxy for human capital. Blomstrom et al. (1994) and Coe et al.
(1995) find that, for FDI to have positive impacts on growth, the host country must have
attained a level of development that helps it reap the benefits of higher productivity. In
8
contrast, De Mello (1996) finds that the correlation between FDI and domestic
investment is negative in developed countries. Li and Liu (2005) find that FDI not only
affects growth directly but also indirectly through its interaction with human capital.
Using a larger sample, Borensztein et al. (1998) find that inward FDI has positive
effects on growth with the strongest impact through the interaction between FDI and
human capital. De Mello (1999) finds positive effects of FDI on economic growth in both
developing and developed countries. He finds that long-term growth in host countries is
determined by the spillovers of technology and knowledge from the investing countries to
host countries. In more recent work, Carkovic and Levine (2005) argue that the positive
results described above are due to a biased estimation methodology. When employing a
different estimation technique (Arellano-Bond GMM) they find no robust relationship
between FDI inflows and domestic growth.
Alfaro et al. (2004) and Durham (2004) focus on the ways in which the FDI effect
depends on the strength of the domestic financial markets of the host country. Alfaro et
al. (2004) use annual data for 1975-1995 for a large cross section of countries, and they
find that only countries with well-developed banking and financial institutions gain from
FDI. Durham (2004) finds similar results; FDI only has a positive effect on growth in
countries with strong financial systems. Additionally, he finds that only countries with
high quality governance, as evidenced by strong institutional development and investor-
friendly legal environment, enjoy positive effects of FDI on growth. Also using data on
developing countries, Hsiao and Shen (2003) find that institutional strength and high
levels of urbanization are conditions for positive effects of FDI on growth.
9
Blonigen and Wang (2005) argue that mixing wealthy and poor countries is
inappropriate in empirical FDI studies. Organizing the aggregate data for developed
countries into six groups and developing ones into nine, they note three results. First, the
factors that affect FDI inflows are different across the groups. Second, the growth impact
of FDI is only supported for developing countries in the aggregate data, not developed
ones. Third, the crowding out effect of FDI on domestic investment is only significant
for developed countries.
2.2 Regional and Country-Specific Empirical Studies
Mortimore (1995) finds that there is a positive correlation between FDI and
capital accumulation for Latin American countries. Bengoa and Sanchez-Robles (2003)
use data for eighteen Latin American countries from 1970 to 1999. Following Barro and
Sala-i-Martin (2004), they average the data over five year periods instead of employing
yearly observations. They also use a composite variable for economic freedom that
includes financial and trade openness. They find that only countries with a higher level
of economic freedom enjoy a positive growth effect from FDI. Bende-Nabende (2001)
conducts a cross-country study on Asian countries, using annual data for 1970-1996 for
the ASEAN-5. Results show that FDI has a positive effect on GDP growth in Indonesia,
Malaysia, and Philippines, but a negative impact in Singapore and Thailand.
Using Thai annual macroeconomic data for the 1970-1999 period and adding
export openness, Kohpaiboon (2003) shows that FDI is positively correlated with GDP
growth in Thailand. Similarly, Marwah and Tavakoli (2004) examine Indonesia,
Malaysia, Philippines, and Thailand separately. Their results show that FDI has a positive
10
impact on GDP growth for all four countries. In contrast, Chakraborty and Basu (2002)
find that GDP growth in India is not influenced by FDI. Instead, the causality they find is
from GDP growth to FDI, with trade liberalization weakly increasing the flows of inward
FDI.
Several papers examine the growth effect of FDI in China. Chen et al. (1995) use
data for selected cities and provinces during the 1979-1991 period. They regress the log
of GNP on FDI and find a positive growth effect. Zhang (2001) uses data from 1984 to
1998 for 28 provinces and finds that, generally, FDI has positive effect on economic
growth in China through its interaction with human capital. Wen (2003) shows that FDI
only has positive effects on economic growth in China’s coastal provinces, which have
more open policies toward foreign investors than the inland provinces. By separating the
Chinese economy into an FDI and a non-FDI sector, Whalley and Xin (2006) conclude
that the contribution of FDI to Chinese growth is quite substantial (on the order of 3-4
percentage points per year). None of these papers distinguishes direct investment projects
by sectors.
Regarding Vietnam, very little detailed analysis on growth effects of FDI has
been conducted. Two papers by Kokko and Zejan (1996) and Kokko et al. (2003) discuss
reasons for success or failure of specific FDI projects in Vietnam. Two other papers by
Schaumburg-Muller (2003) and Ngoc and Ramstetter (2004) investigate the performance
of foreign multinationals versus local firms in Vietnam. Pham (2002) analyzes FDI and
regional development using microeconomic data on approval values of FDI for sixty-four
provinces in Vietnam. He finds that although FDI contributes to regional development
by increasing industrial output, FDI flows are unequally distributed among the provinces
11
due to poor infrastructure in remote areas. However, Kokko et al. (2003) find that the
data set for approval values is only weakly correlated with the data set for actual values,
which casts doubt on the robustness of the Pham (2002) results.
In summary, results on growth effects of FDI are controversial. Several authors
argue that only developed countries with high-quality governance and robust financial
systems benefit from FDI. Others suggest that developing countries are more likely to
enjoy a growth impetus from FDI and are less likely to suffer from crowding out effects.
Our data and methodology permit us to avoid some of the key problems that plague this
literature. Furthermore, by implementing the same methodology for two different
country-specific datasets, we are able to provide some evidence on the generality of our
results.
3. Methodology and Data
3.1. Methodology
We use the conventional augmented Cobb-Douglas production function:
1
iji i i it
nv
it it it ijtj
Y AL K C e eφα δ ε
=
= ∏ (1)
where Y, L, and K are real GDP, labor, and physical capital (henceforth simply capital),
respectively; C is a vector of control variables such as exports, imports, infrastructure,
etc. The subscripts are for sector i, variable j, and time t; α, δ, γ, and φ are parameters; vi
is the sector-specific disturbance and εit the general disturbance.
Taking natural logarithms of Equation (1) yields the linear form:
1ln ln ln ln ln
n
it i it i it ij ijt i itj
Y A L K C vα δ φ ε=
= + + + + +∑ . (2)
12
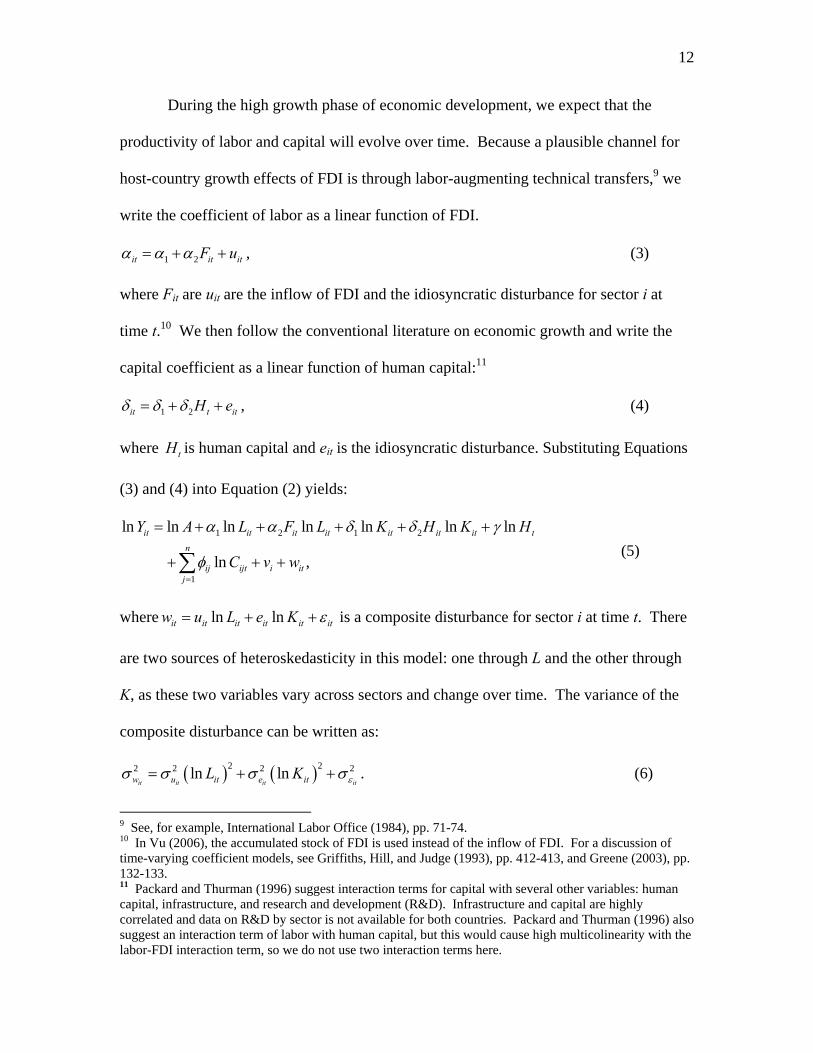
During the high growth phase of economic development, we expect that the
productivity of labor and capital will evolve over time. Because a plausible channel for
host-country growth effects of FDI is through labor-augmenting technical transfers,9 we
write the coefficient of labor as a linear function of FDI.
1 2it it itF uα α α= + + , (3)
where Fit are uit are the inflow of FDI and the idiosyncratic disturbance for sector i at
time t.10 We then follow the conventional literature on economic growth and write the
capital coefficient as a linear function of human capital:11
1 2it t itH eδ δ δ= + + , (4)
where tH is human capital and eit is the idiosyncratic disturbance. Substituting Equations
(3) and (4) into Equation (2) yields:
1 2 1 2
1
ln ln ln ln ln ln ln
ln ,
it it it it it it it t
n
ij ijt i itj
Y A L F L K H K H
C v w
α α δ δ γ
φ=
= + + + + +
+ + +∑ (5)
where ln lnit it it it it itw u L e K ε= + + is a composite disturbance for sector i at time t. There
are two sources of heteroskedasticity in this model: one through L and the other through
K, as these two variables vary across sectors and change over time. The variance of the
composite disturbance can be written as:
( ) ( )2 22 2 2 2ln lnit it it itw u it e itL K εσ σ σ σ= + + . (6)
9 See, for example, International Labor Office (1984), pp. 71-74. 10 In Vu (2006), the accumulated stock of FDI is used instead of the inflow of FDI. For a discussion of time-varying coefficient models, see Griffiths, Hill, and Judge (1993), pp. 412-413, and Greene (2003), pp. 132-133. 11 Packard and Thurman (1996) suggest interaction terms for capital with several other variables: human capital, infrastructure, and research and development (R&D). Infrastructure and capital are highly correlated and data on R&D by sector is not available for both countries. Packard and Thurman (1996) also suggest an interaction term of labor with human capital, but this would cause high multicolinearity with the labor-FDI interaction term, so we do not use two interaction terms here.
13
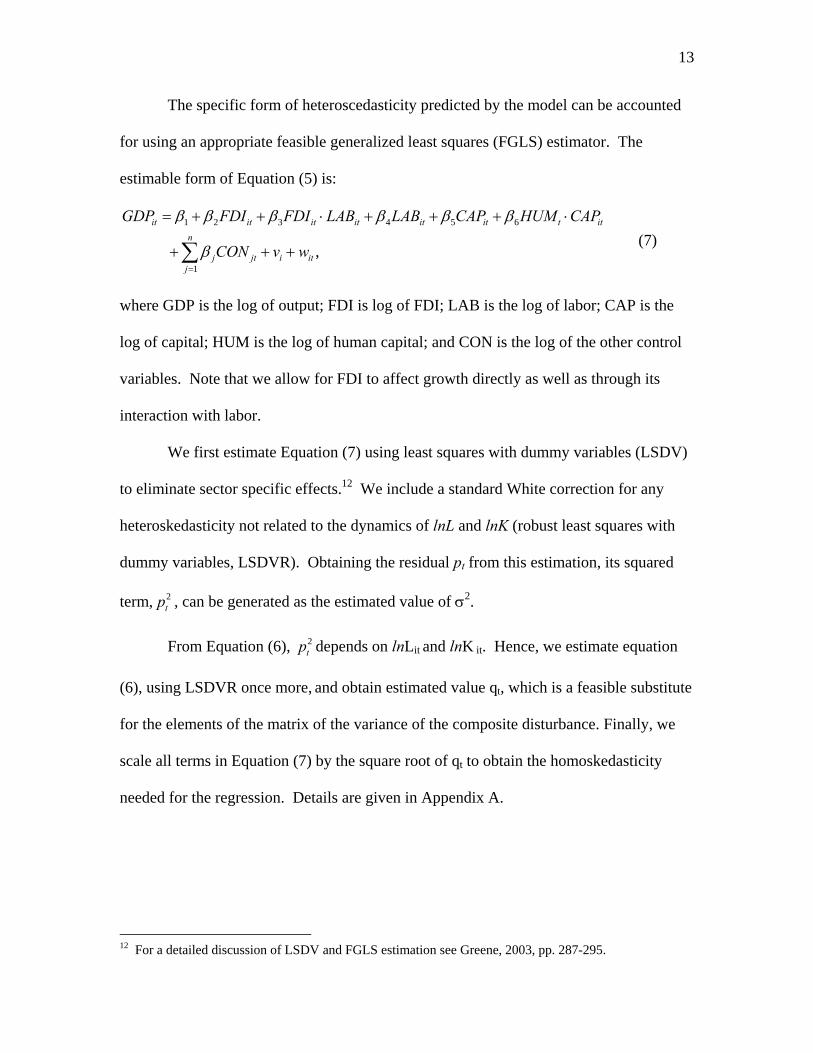
The specific form of heteroscedasticity predicted by the model can be accounted
for using an appropriate feasible generalized least squares (FGLS) estimator. The
estimable form of Equation (5) is:
1 2 3 4 5 6
1,
it it it it it it t itn
j jt i itj
GDP FDI FDI LAB LAB CAP HUM CAP
CON v w
β β β β β β
β=
= + + ⋅ + + + ⋅
+ + +∑ (7)
where GDP is the log of output; FDI is log of FDI; LAB is the log of labor; CAP is the
log of capital; HUM is the log of human capital; and CON is the log of the other control
variables. Note that we allow for FDI to affect growth directly as well as through its
interaction with labor.
We first estimate Equation (7) using least squares with dummy variables (LSDV)
to eliminate sector specific effects.12 We include a standard White correction for any
heteroskedasticity not related to the dynamics of lnL and lnK (robust least squares with
dummy variables, LSDVR). Obtaining the residual pt from this estimation, its squared
term, 2tp , can be generated as the estimated value of σ2.
From Equation (6), 2tp depends on lnLit and lnK it. Hence, we estimate equation
(6), using LSDVR once more, and obtain estimated value qt, which is a feasible substitute
for the elements of the matrix of the variance of the composite disturbance. Finally, we
scale all terms in Equation (7) by the square root of qt to obtain the homoskedasticity
needed for the regression. Details are given in Appendix A.
12 For a detailed discussion of LSDV and FGLS estimation see Greene, 2003, pp. 287-295.

14
3.2. Data
No single source of Vietnamese data has all information necessary to conduct a
study on growth effects of inward FDI. Vietnamese data for GDP of eight different
sectors from 1990 to 2003 are available from the Vietnam Statistical Yearbook (VSY)
published by the General Statistical Office of Vietnam (GSOV): data in Vietnamese
currency for 1991-2003 are provided, and we construct data for 1990 from the GDP
index with the previous year as 100, that is, GDP for 1990 is 100 and for 1991 is 106.2.
However, several sectors either lack data for most of the time period or do not match the
FDI data, leaving only five sectors for estimation: industry, construction, transportation
and communication, real estate, and agriculture-fishery-forestry (henceforth
agriculture).13 In the Industrial Output section of the VSY, industry is defined as a
combination of mining and quarrying, manufacturing, and utilities (electricity, gas and
fuel, and water supply), so we sum these sectors to obtain data on industry. Data on GDP
of real-estate for 1990-1994 are not available, so we have an unbalanced panel.14
The VSY and the GSOV's website provide data for the labor force from 1990 to
2003. We obtained data for investment—newly increase in fixed assets—for the whole
period (1990-2003) for eighteen sectors from the VSY and GSOV's website, five of
which match the data for FDI.
The GSOV only provides FDI inflows data for approved amounts. Data on actual
FDI projects implemented for eleven economic sectors from 1988 to 2003 is available
13 Data for agriculture, fishery, and forestry are also provided separately in the VSY but are combined here to match the IMF’s data set for FDI. 14 For 1995-2003, we add GDP data on hotels and restaurants to GDP data on real estate, renting and business activities to obtain GDP data on the real-estate sector that nearly match the IMF's data on FDI for real-estate, which is defined a combination hotels , tourism and other real estate.
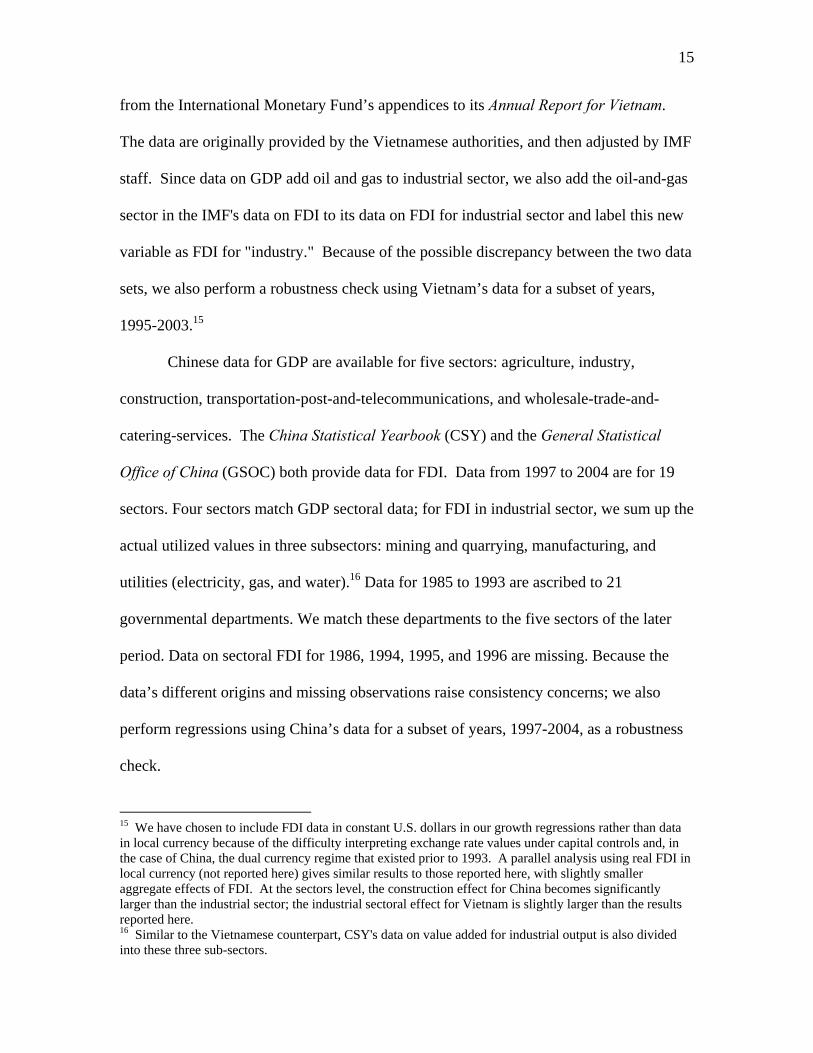
15
from the International Monetary Fund’s appendices to its Annual Report for Vietnam.
The data are originally provided by the Vietnamese authorities, and then adjusted by IMF
staff. Since data on GDP add oil and gas to industrial sector, we also add the oil-and-gas
sector in the IMF's data on FDI to its data on FDI for industrial sector and label this new
variable as FDI for "industry." Because of the possible discrepancy between the two data
sets, we also perform a robustness check using Vietnam’s data for a subset of years,
1995-2003.15
Chinese data for GDP are available for five sectors: agriculture, industry,
construction, transportation-post-and-telecommunications, and wholesale-trade-and-
catering-services. The China Statistical Yearbook (CSY) and the General Statistical
Office of China (GSOC) both provide data for FDI. Data from 1997 to 2004 are for 19
sectors. Four sectors match GDP sectoral data; for FDI in industrial sector, we sum up the
actual utilized values in three subsectors: mining and quarrying, manufacturing, and
utilities (electricity, gas, and water).16 Data for 1985 to 1993 are ascribed to 21
governmental departments. We match these departments to the five sectors of the later
period. Data on sectoral FDI for 1986, 1994, 1995, and 1996 are missing. Because the
data’s different origins and missing observations raise consistency concerns; we also
perform regressions using China’s data for a subset of years, 1997-2004, as a robustness
check.
15 We have chosen to include FDI data in constant U.S. dollars in our growth regressions rather than data in local currency because of the difficulty interpreting exchange rate values under capital controls and, in the case of China, the dual currency regime that existed prior to 1993. A parallel analysis using real FDI in local currency (not reported here) gives similar results to those reported here, with slightly smaller aggregate effects of FDI. At the sectors level, the construction effect for China becomes significantly larger than the industrial sector; the industrial sectoral effect for Vietnam is slightly larger than the results reported here. 16 Similar to the Vietnamese counterpart, CSY's data on value added for industrial output is also divided into these three sub-sectors.

16
The CSY provides data on labor force for sixteen sectors from 1985 to 2002.
Data on labor force for 2003-2004 are not available.17 Hence, we have an unbalanced
panel. For investment, the only series that is available for sixteen sectors during the
whole period (1985-2004) is investment in capital construction. We use this as a proxy
for investment. We again add up data on mining and quarrying, manufacturing, and
energy to obtain data on industrial sector.
In calculating education as a proxy for human capital, we sum up data from the
Statistical Yearbooks for enrollments in secondary schools, technical schools (vocational
schools in the case of China), worker training schools, and four-year colleges.18 We
divide the data on education by population to obtain the school enrollment ratio for each
country and label this variable as "human capital."
Data in domestic currency are converted to constant 1994 domestic currency
using GDP price indices for China and comparative 1988 and 1994 constant prices for
Vietnam. Data on FDI are converted to constant 1994 US dollars using the GDP implicit
deflator.19 We also have three zero values in China's data and two zero values in
Vietnamese counterpart. We eliminate these observations.20
For a list of variables that might explain economic growth, we consult Barro and
Sala-i-Martin (2004) and Romer (2001). We use the three-month household saving rate
17It is not clear why data on labor force for 2003-2004 are missing. The IMF has noted, "...Labor market statistics—including employment and wage data—are not comprehensive, and are only available on an annual basis, with considerable lag…." See Dunaway, M. at al. (2004), p. 50. 18 This is a more accurate expression of Vietnamese and Chinese educational systems than just secondary school enrollments. The secondary schools have to follow nationally drafted curricula, which focus heavily on political doctrine and abstract sciences. This leaves the vocational, technical schools or worker training schools the responsibility of providing technologically skilled labor. 19 Since exchange rates did not change much for Vietnam during 1991-2003 and for China during 1985-2004, we do not convert FDI data to local currencies. 20 For China, missing observations are FDI in the agricultural sector in 1985, 1987, and 1988; for Vietnam, it is FDI in construction in 1990 and 1991.

17
from the IMF International Finance Statistics, and data on exports and imports, the
number of telephones as a proxy for telecommunication capacity, and the volume of
freight traffic as a proxy for transportation infrastructure. In summary, we have a
Vietnam dataset for five sectors for 1990-2003 and a China counterpart for five sectors
for 1985-2004. Binary dummies are created to control for missing observations, so 70
observations for Vietnam and 100 observations for China are obtained for estimation.21
This yields admittedly small samples for analysis, particularly when industry effects are
included, but this is the best one can do with currently-available data.
4. Results
4.1. Specification Tests
We carry out a downward piece-wise specification search in order to avoid
omitted variable bias. We start with all available variables that may explain economic
growth based on past research. The variables are then eliminated gradually, using
multicolinearity tests. Gathering all available data, we start with a total of nine
explanatory variables: FDI, labor, their interaction, capital, the real interest rate,
education, exports, imports, telecommunication, and infrastructure. The model is initially
estimated without interaction terms. As a preliminary step, we use robust OLS to control
for heteroscedasticity rather than sector fixed-effects estimation to preserve information
that might be lost once the time-invariant effects are included.
We carry out multicolinearity tests using the Variance Inflation Factors (VIF)
approach (Kennedy, 2003). When an independent variable, Xi, is regressed on k other
21 33 missing observations for China and 7 for Vietnam.
18
independent variables, the covariance matrix is: 2 1ˆ ( )i i k iCov X M Xεβ σ −′= . The inverse of
this correlation matrix is used in detecting multicolinearity. The diagonal elements of this
matrix (the variance inflation factors) are given by 2 1(1 )i ikVIF R −= − , where 2ikR is the R2
from regressing Xi on the k other variables. When there is perfect multicolinearity, R2
equals one, and VIF approaches infinity. Kennedy (2003) recommends elimination of
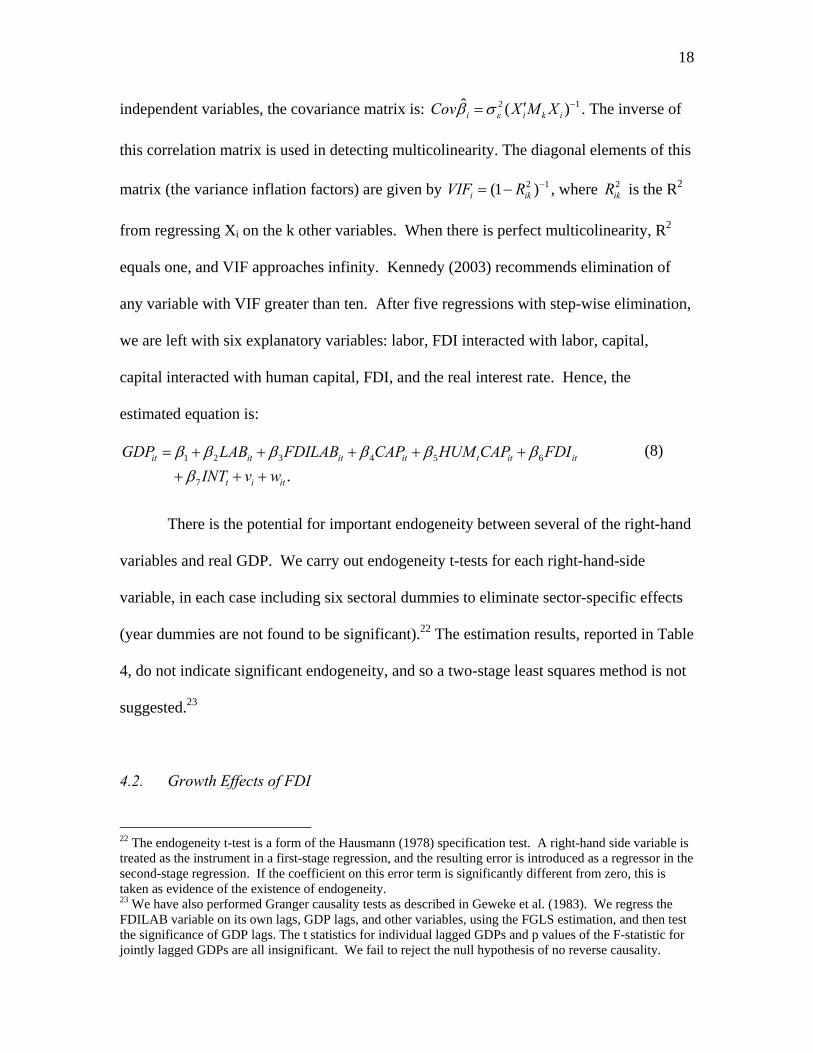
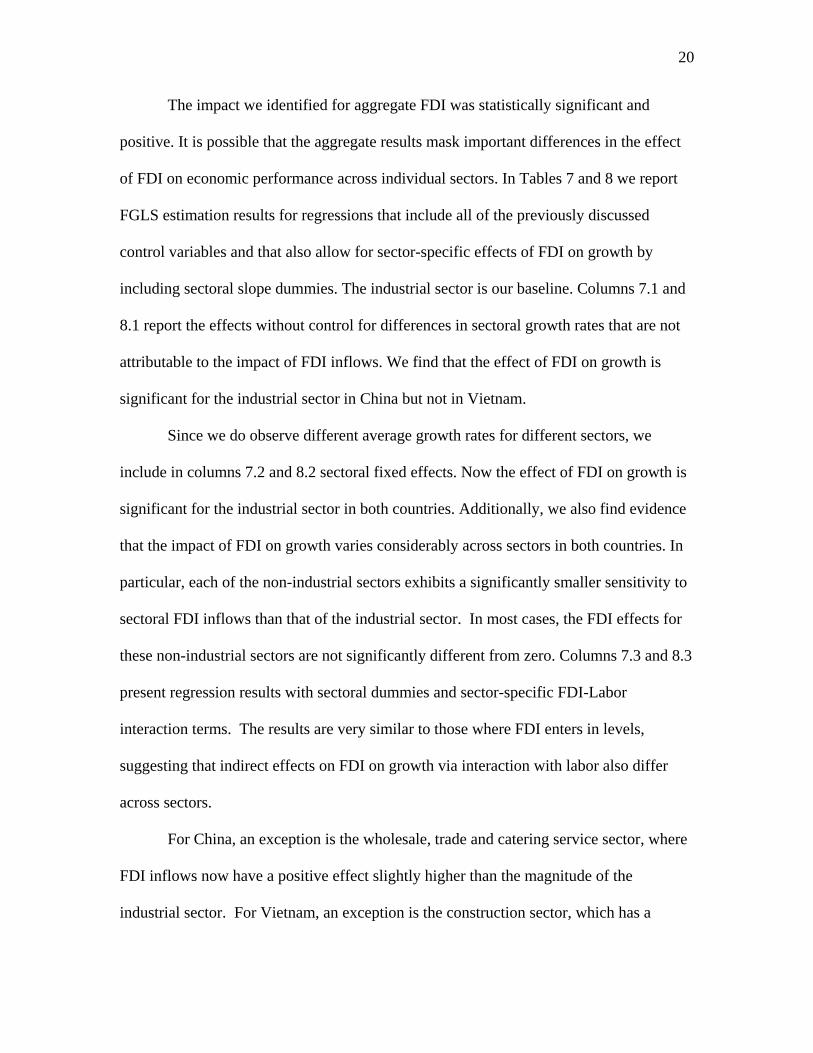
any variable with VIF greater than ten. After five regressions with step-wise elimination,
we are left with six explanatory variables: labor, FDI interacted with labor, capital,
capital interacted with human capital, FDI, and the real interest rate. Hence, the
estimated equation is:
(8)
There is the potential for important endogeneity between several of the right-hand
variables and real GDP. We carry out endogeneity t-tests for each right-hand-side
variable, in each case including six sectoral dummies to eliminate sector-specific effects
(year dummies are not found to be significant).22 The estimation results, reported in Table
4, do not indicate significant endogeneity, and so a two-stage least squares method is not
suggested.23
4.2. Growth Effects of FDI
22 The endogeneity t-test is a form of the Hausmann (1978) specification test. A right-hand side variable is treated as the instrument in a first-stage regression, and the resulting error is introduced as a regressor in the second-stage regression. If the coefficient on this error term is significantly different from zero, this is taken as evidence of the existence of endogeneity. 23 We have also performed Granger causality tests as described in Geweke et al. (1983). We regress the FDILAB variable on its own lags, GDP lags, and other variables, using the FGLS estimation, and then test the significance of GDP lags. The t statistics for individual lagged GDPs and p values of the F-statistic for jointly lagged GDPs are all insignificant. We fail to reject the null hypothesis of no reverse causality.
1 2 3 4 5 6
7 .it it it it t it it
t i it
GDP LAB FDILAB CAP HUM CAP FDIINT v w
β β β β β ββ
= + + + + ++ + +

19
We begin by examining aggregate effects of FDI. The results of FGLS estimation
for Vietnam are given in Table 5. Note that the fixed effect estimations using LSDV
approach produces in this case very high R-squared values, these arise out of the large
differences in production levels across sectors, and are an important justification for our
panel specification.
Column 5.1 presents estimation of the benchmark empirical model including only
the control variables, labor, human capital, physical capital, the interest rate, and the
human capital-capital interaction term. The signs of the coefficient estimates generally fit
our priors. In column 5.2 we add the FDI measure described above. The term enters with
a positive and significant effect (at the 1% level). An interaction of FDI with labor (5.3)
also yields positive and significant FDI effects, working indirectly through interaction
with labor. Including both the level of FDI and the interaction term (5.4) does not
markedly change the magnitudes of estimated coefficients, but the FDI and labor terms
are no longer statistically different from zero.
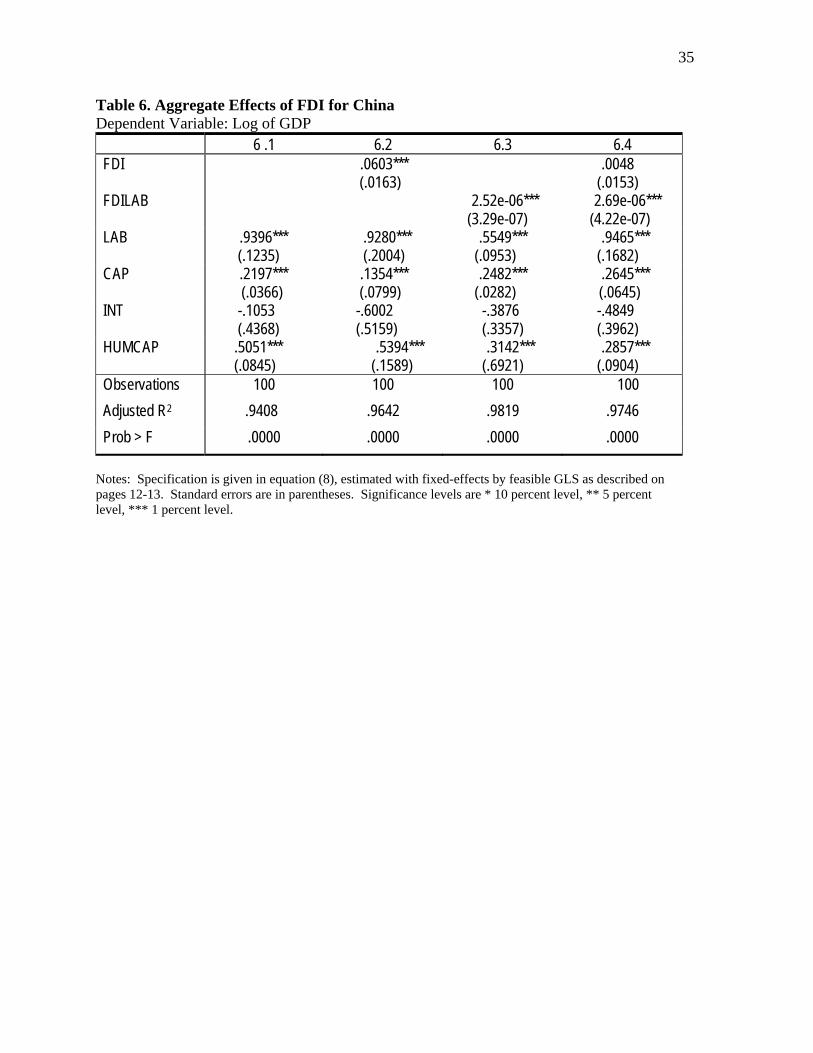
Table 6 presents equivalent results for the China data set. Column 6.1 presents
estimation of the benchmark empirical model including only the control variables, labor,
human capital, physical capital, the interest rate, and the human capital-capital interaction
term. The signs of the coefficient estimates also generally fit our priors. Qualitatively,
the effects of FDI are very similar to those for Vietnam, although the estimated
parameters on labor are consistently higher. For China, the estimated direct and indirect
effects of FDI on growth are positive but smaller than those for Vietnam. When both the
interaction term and the level of FDI are included (6.4), the level of FDI variable is no
longer significantly different from zero for both countries.
20
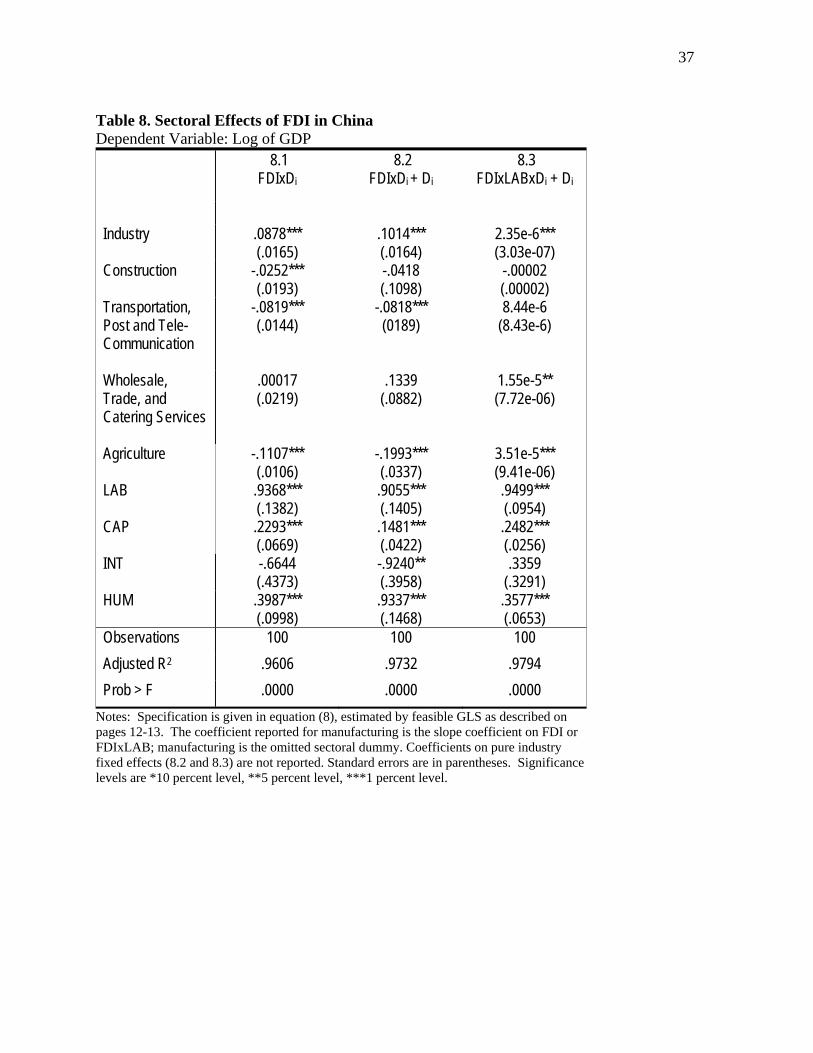
The impact we identified for aggregate FDI was statistically significant and
positive. It is possible that the aggregate results mask important differences in the effect
of FDI on economic performance across individual sectors. In Tables 7 and 8 we report
FGLS estimation results for regressions that include all of the previously discussed
control variables and that also allow for sector-specific effects of FDI on growth by
including sectoral slope dummies. The industrial sector is our baseline. Columns 7.1 and
8.1 report the effects without control for differences in sectoral growth rates that are not
attributable to the impact of FDI inflows. We find that the effect of FDI on growth is
significant for the industrial sector in China but not in Vietnam.
Since we do observe different average growth rates for different sectors, we
include in columns 7.2 and 8.2 sectoral fixed effects. Now the effect of FDI on growth is
significant for the industrial sector in both countries. Additionally, we also find evidence
that the impact of FDI on growth varies considerably across sectors in both countries. In
particular, each of the non-industrial sectors exhibits a significantly smaller sensitivity to
sectoral FDI inflows than that of the industrial sector. In most cases, the FDI effects for
these non-industrial sectors are not significantly different from zero. Columns 7.3 and 8.3
present regression results with sectoral dummies and sector-specific FDI-Labor
interaction terms. The results are very similar to those where FDI enters in levels,
suggesting that indirect effects on FDI on growth via interaction with labor also differ
across sectors.
For China, an exception is the wholesale, trade and catering service sector, where
FDI inflows now have a positive effect slightly higher than the magnitude of the
industrial sector. For Vietnam, an exception is the construction sector, which has a
21
significant and positive coefficient that is also slightly higher than that of the industrial
sector.
In sum, for both countries we find that the industrial sector consistently shows
evidence of a positive FDI effect on growth. With one exception for Vietnam and one for
China, non-industrial sectors show consistently weaker effects than manufacturing, in
most cases the effect is not statistically different from zero. As a robustness check, we
also perform regressions on China's data from 1997 to 2004 and Vietnam's data from
1995 to 2003. The results, which are not reported here, are similar: the effect for the
industrial sector is positive and significant while the effects for other sectors are not
statistically different from zero.24
These results are not entirely surprising. First, we may expect capital-intensive
sectors and ones in which technology plays a major role to exhibit a more positive impact
of FDI inflows on factor productivity. In addition, it may be much easier for firms in
these externally-oriented sectors to overcome the peculiar institutional rigidities that we
discussed above and therefore take advantage of the benefits of FDI inflows on economic
growth.
5. Conclusion
While most economists seem to agree that FDI is beneficial (if perhaps doubting
the wisdom of government subsidies for investing multinationals), many policymakers
and to a larger extent NGOs appear much less sanguine. In this work, we have estimated
the impact of FDI on growth in different economic sectors using data from China and
24 One exception for China is when the sectoral fixed effects are added, FDI's direct effect on industrial sector becomes insignificant, but its indirect effect through interaction with labor remains positive and statistically significant.
22
Vietnam. Using an augmented production function, we allow FDI to directly affect GDP
growth and also to indirectly affect growth through interaction with labor. The influence
of FDI on labor is permitted to vary over time through an idiosyncratic disturbance,
requiring a particular FGLS estimation procedure. The results reveal that FDI has a
significant and positive effect on economic growth through its interaction with labor in
both countries. However, the effect is not equally distributed across sectors. In both
countries, the industrial sector seems to be the only sector to consistently benefit from
FDI inflows.
From a policy perspective, two observations appear to follow from these results.
First, governments who want to subsidize FDI inflows may want to direct scarce
resources to manufacturing and energy extraction sectors. FDI into other sectors does not
seem to yield any statistically identifiable benefit. At the same time, more resources
should be directed toward understanding why other sectors do not appear to benefit from
FDI inflows. Is this fundamental to industry types? To transition economies? Or is it a
result of institutional barriers to effective absorption of FDI? Are there government
policies that might improve the ability of non-manufacturing sectors to benefit from FDI
inflows?
The relatively small available data samples, and the existence of discrepancies
among data sources, suggest caution in interpreting these results. More and better data
and comparative work with sectoral data from other countries are plainly needed. Also,
we have focused on the growth effect of FDI inflows. It would be useful to explore
whether other types of capital inflows—equity and foreign loans—also have differential

23
growth effects across sectors, and whether they too show both direct and indirect impact
on economic growth.
24
References:
Alfaro, L., Chanda, A., Kalemli-Ozcan, S. and S. Sayek. (2004). “FDI and Economic Growth: The Role of Local Financial Markets,” Journal of International Economics 64(1), 89-112.
Balasubramanyam, V., Salisu, M. and D. Sapsford, 1996, “FDI and Growth in EP and IS
Countries,” The Economic Journal 106(434), 92-105. Barro, R., and Sala-i-Martin, X., 2004, Economic Growth. MIT Press, Cambridge, MA. Bende-Nabebde, A., 2001, “FDI, Regional Economic Integration and Endogenous Growth, Some
evidence from Southeast Asia,” Pacific Economic Review, 6(3), 383-399. Bengoa, M., and Sanchez-Robles, 2003, “FDI, Economic Freedom, and Growth: New Evidence
from Latin America,” European Journal of Political Economy 19, 529-545. Blonigen, B., and M. G. Wang, 2005. Inappropriate Pooling of Wealthy and Poor Countries in
Empirical FDI Studies.” In: Moran, T. H., E. M. Graham and M. Blomström. Does Foreign Direct Investment Promote Development? Institute of International Economics Press, Washington DC.
Borensztein, E., de Gregorio, J., and J-W Lee, 1998, “How does foreign direct investment affect
economic growth?” Journal of international Economics 45, 115-135. Carkovic, M., and R Levine, 2005. “Does Foreign Direct Investment Accelerate Economic
Growth?” In: Moran, T. H., E. M. Graham and M. Blomström. Does Foreign Direct Investment Promote Development? Institute of International Economics, Washington DC.
Chen, C., Chang, L. and Y. Zhang, 1995. The Role of FDI in China’s Post 1978 Economic
Development. World Development 23(4), 691-703. De Mello, Jr., L.R., 1997, “FDI in Developing Countries and Growth: A Selective Survey,” The
Journal of Development Studies 34, 1, 1-34. De Mello, Jr., L.R., 1999, “FDI-led growth: evidence from time series and panel data,” Oxford
Economic Papers 51, 133-151. Do, T.D., 1993, “Modifications of the Traditional Family in the South Vietnam,” Vietnam Social
Science 3, 77-81. Dodsworth, J.,1996, “Vietnam Transition to a Market Economy,” IMF Occasional Paper, 1-58. Dunaway, M. at al., 2004, “IMF's Staff Report for the 2004 article IV Consultation for
People's Republic of China,” 1-52. Durham, B., 2004, “Absorptive capacity and the effects of FDI and equity foreign portfolio
investment on economic growth.” European Economic Review, 48, 285-306. Findlay, R., 1978, " Relative Backwardness, Direct Foreign Investment, and the Transfer of
Technology: A Simple Dynamic Model," The Quarterly Journal of Economics 92(1)., 1-16.
25
General Statistical Office, 1990-2004, Statistical Yearbooks. Statistical Publishing House, Hanoi, Vietnam.
Greene, W., 2003, Econometric Analysis, Fifth Edition, Pearson/Wesley, Princeton, NJ. Griffifth, W., Hill, C., and G. Judge, 1993, Learning and Practicing Econometrics, John Wiley &
Sons, Inc. Danvers, MA. Grossman, G., and Helpman, E, 1991, Innovation and Growth in the Global Economy. MIT
Press, MA. Hausman, Jerry A. 1978. “Specification Tests in Econometrics.” Econometrica 46(6):1251–71. Hsiao, C., and Y. Shen, 2003. Foreign direct investment and economic growth: the importance of
institutions and urbanization. Economic Development and Cultural Change, 51(4), 883-896. International Labor Office, 1984, “technology Choice and Employment Generation by
Multinational Enterprises in Developing Countries,” Geneva:ILO, 1-75. Kennedy, P., 2003, A Guide to Econometrics, Fifth Edition, MIT Press, MA. Kohpaiboon, A., 2003, “Foreign Trade Regimes and the FDI-Growth Nexus: A case Study of
Thailand,” The Journal of Development Studies Vol. 40, No. 2, 55-69. Kokko, A., and Zejan, M. 1996. Planned and Failed Foreign Direct Investment in Vietnam. Asia-
Pacific Development Journal 3(1), 37-53. Kokko, A., Kotoglou, K., and A. Krohwinkel (2003). Characteristics of failed FDI projects in
Vietnam. Transnational Corporations, 12(3), 41-77. Li, X., and Liu, X. (2005). Foreign Direct Investment and Economic Growth: An Increasingly
Endogenous Relationship. World Development 33(3), 393-407. Lipsey, R. E., and F. Sjöholm, 2005. “The Impact of Inward FDI on Host Countries: Why Such
Different Answers?” In: Moran, T. H., E. M. Graham and M. Blomström. Does Foreign Direct Investment Promote Development? Institute of International Economics Press, Washington DC.
Mankiw, G., Romer, D., and N. Weil, 1992, “A Contribution to the Empirics of Economic
Growth,” Quarterly Journal of Economics, 107, 407-437. Marwah, K., and Tavakoli, A., 2004, “The Effects of Foreign Capital and Imports on Economic
Growth,” Journal of Asian Economics, 15, 399-413. Ministry of Planning and Investment, 2004-2005, “The FDI Project Listings,” Hanoi, Vietnam,
MPI website. Ngoc, P.M., and E.D. Ramstetter, “Foreign Multinationals and Local Firms in Vietnam’s
Economic Transition.” Asian Economic Journal, 18(4), 371-404.
26
Nguyen, T.X., 1997, "The Attraction of FDI: Vietnam and Other ASEAN Countries," Institute of economics, 1996, Vietnam’s Socio-Economic Development, 11, 63-69.
Packard, L. and S. Thurman, 1996. "A Model Design for Vietnam as an Open Economy in
Transition." ASEAN Economic Bulletin, 13(2), 241-264. Pham, H.M., 2002, “Regional Economic Development and Foreign Direct Investment Flows from
Vietnam,” Journal of the Asia Pacific Economy, Vol. 7, No. 2, 182-202. Reis, A., 2001, “On the Welfare Effects of Foreign Investment,” Journal of International
Economics 54, 411-427. Romer, D., 2001, Advanced Macroeconomics, McGraw-Hill/Irwin Publication, NY. Schaumburg-Muller, H., 2003, “Rise and fall of foreign direct investment in Vietnam and its
impact on local manufacturing upgrading, European Journal of Development Research, 15(2), 44-66.
Singer, H.W, 1950, “The Distribution of Gains Between Investing and Borrowing Countries,”
American Economic Review, 473-485. Solow, R., 1957, “Technical Change and Aggregate production Function,” The Review of
Economics and Statistics 39, 312-320. Tho, T.V., Duc, N.N., Chinh, N.V., and N. Quan, 2000, Kinh te Viet Nam 1995-2000: New
Computations, New Analysis. Statistical Publishing House, Hanoi, Vietnam, 2000. Tran, N.T., 1997, Tim ve ban chat van hoa Viet Nam, Hanoi: Literature Publishing House. Walter, O., 1979, “Assertions of Cultural Well-being in Vietnam,” Journal of Southeast Asian
Study, 10, 435-443. Whalley, John and Xian Xin, 2006. China’s FDI And Non-FDI Economies and the Sustainability
of Future High Chinese Growth. NBER Working Paper 12249. Unterobertdoerster et al, 2003, “Vietnam: Selected Issues,” the IMF country Report No. 03/381. Vu, T. B., 2006. FDI and Endogenous Growth in Vietnam. Applied Economics, forthcoming. Wen, M, 2003. FDI, Regional Geographical and Market Conditions, and Regional Development:
A Panel Study on China. Division of Economics, RSPAS, ANU, 1-28. Zhang, K., 2001, “How Does FDI Affect Economic Growth in China?” Economics of Transition
9(3), 679-693.

27
Appendix A. FGLS Estimation
After a fixed effect estimation of Equation (5), the sectoral disturbance, vi, is eliminated,
and (5) can be written as:
y X wβ= + , where X is of dimension (T x K),
2[ ] 0, cov[ ] [ '] , ,TE w w E ww W W Iσ= = = ≠
where W is the covariance matrix. Since Equation (6) involves lnLit and lnK it, which vary
across sectors, another fixed effect estimation is needed. After the sectoral effects are
eliminated once more, we can factor a constant out of the matrix W and write it in the
alternative form 2 ,W Qσ= where the diagonal elements of Q are qt = {q1, q2,...,qT}. The
transformed error term is: 1/ 2 1/ 2 1/ 21 1 2 2* [( / ), ( / ),..., ( / )]tw w q w q w q= . The heteroscedasticity
is then corrected by transforming the original model to:
1* * * , 'y Py X w PX Pw P P Qβ β −= = + = + = .
The general least square estimator is the minimum variance linear unbiased
estimator under any general error covariance specification that could reflect
heteroscedasticity or autocorrelation or both:
1 1 1ˆ ( ' ) 'X W X X W yβ − − −=
In reality, since W is unknown, the feasible general least square estimator (FGLS)
is 1 1 1ˆ ˆ( ' ) 'X W X X W yβ − − −= , which is not best linear unbiased but consistent. Its
approximate large sample properties are the same as those of the GLS estimator.
28
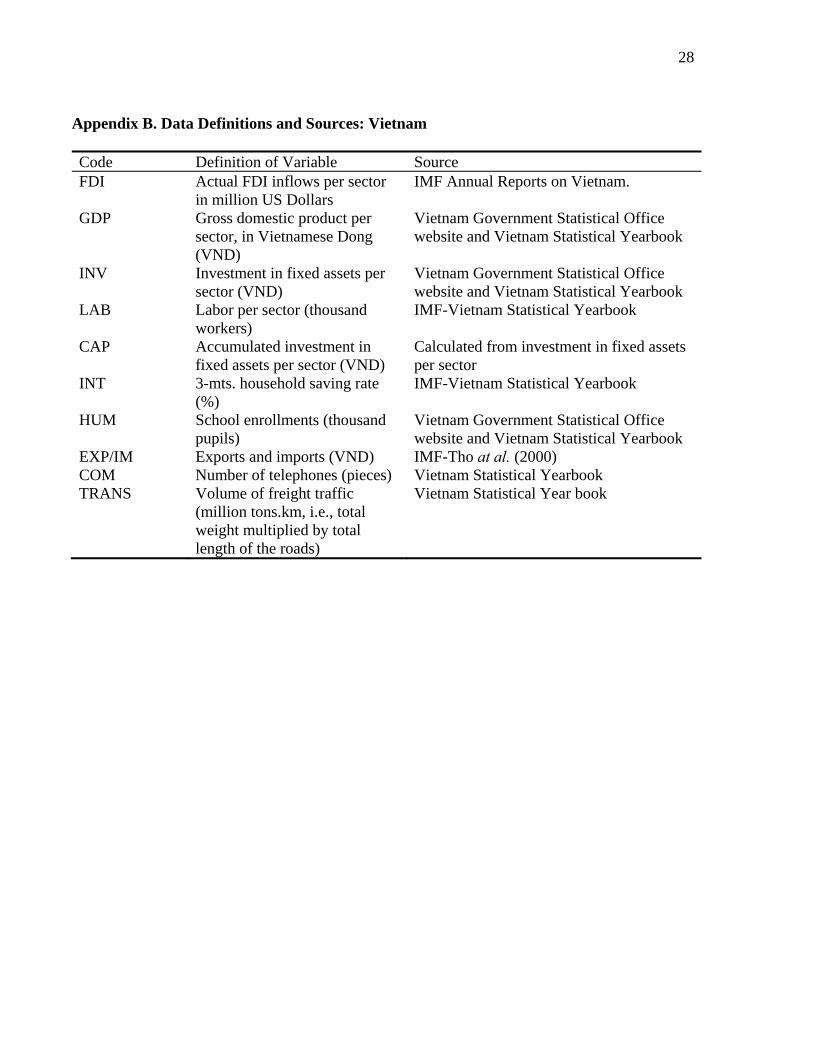
Appendix B. Data Definitions and Sources: Vietnam
Code Definition of Variable Source FDI Actual FDI inflows per sector
in million US Dollars IMF Annual Reports on Vietnam.
GDP Gross domestic product per sector, in Vietnamese Dong (VND)
Vietnam Government Statistical Office website and Vietnam Statistical Yearbook
INV Investment in fixed assets per sector (VND)
Vietnam Government Statistical Office website and Vietnam Statistical Yearbook
LAB Labor per sector (thousand workers)
IMF-Vietnam Statistical Yearbook
CAP Accumulated investment in fixed assets per sector (VND)
Calculated from investment in fixed assets per sector
INT 3-mts. household saving rate (%)
IMF-Vietnam Statistical Yearbook
HUM School enrollments (thousand pupils)
Vietnam Government Statistical Office website and Vietnam Statistical Yearbook
EXP/IM Exports and imports (VND) IMF-Tho at al. (2000) COM Number of telephones (pieces) Vietnam Statistical Yearbook TRANS Volume of freight traffic
(million tons.km, i.e., total weight multiplied by total length of the roads)
Vietnam Statistical Year book
29
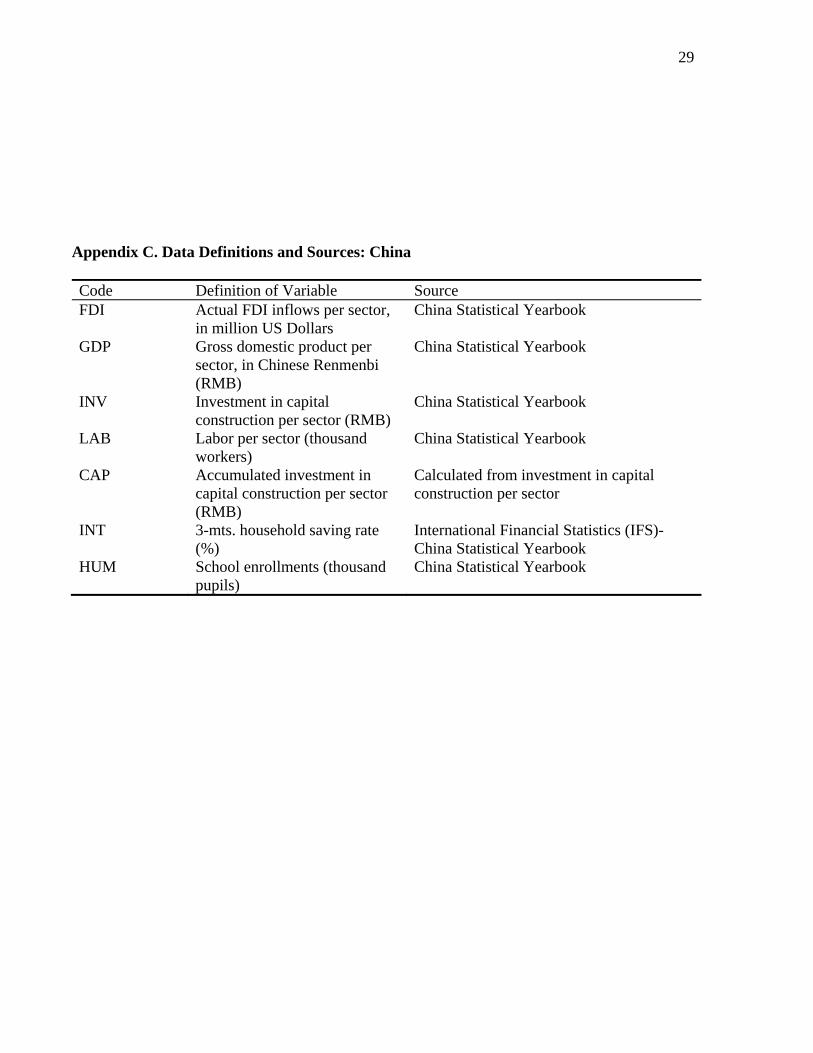
Appendix C. Data Definitions and Sources: China
Code Definition of Variable Source FDI Actual FDI inflows per sector,
in million US Dollars China Statistical Yearbook
GDP Gross domestic product per sector, in Chinese Renmenbi (RMB)
China Statistical Yearbook
INV Investment in capital construction per sector (RMB)
China Statistical Yearbook
LAB Labor per sector (thousand workers)
China Statistical Yearbook
CAP Accumulated investment in capital construction per sector (RMB)
Calculated from investment in capital construction per sector
INT 3-mts. household saving rate (%)
International Financial Statistics (IFS)-China Statistical Yearbook
HUM School enrollments (thousand pupils)
China Statistical Yearbook
30
Table 1. World Distribution of FDI
FDI net inflows
(% of GDP)
FDI net inflows
(% of Fixed Capital Formation)
1980-1989
1990-1994
1995-1999
2000-2003
1980-1989
1990-1994
1995-1999
2000-2003
World 1.12 2.00 3.97 5.05 4.60 8.86 15.33 24.72
East Asia 2.61 4.60 6.10 5.26 10.28 19.05 22.66 20.84
South-East Asia 2.70 4.19 5.51 3.27 7.88 16.35 21.22 12.75
China .58 3.48 4.70 3.83 1.60 8.67 12.11
9.71
Vietnam 0.02 6.09 7.53 4.04 0.15 30.22 26.87 13.09
Source: World Bank’s World Development Indicators 2004: BX.KLT.DINV.DT.GD.ZS and BX.KLT.DINV.DT.GI.ZS.
31
Table 2. FDI in Vietnam by Sector (in millions of 1994 US Dollars)
Sector 1990-1994 1995-1998 1999-2002 1990-2002
(% of total flows) Industry 293.5 3341.9 7969.6 45.7%
Heavy Industry 133.2 1421.3 4012.1 15.2%
Processing zones 13.1 301.5 387.4 2.7%
Light Industry 98.4 1027.6 2309.2 9.3%
Oil and Gas 410.2 2301.2 4218.3 18.5%
Food 48.8 591.5 1260.9 7.5%
Construction 28.5 720.7 1768.6 9.9%
Transportation 72.3 458.7 1268.2 7.1%
Real Estate 171.5 1647.4 3362.7 20.4%
Hotel & Tourism 127.0 1014.8 1830.2 11.7%
Other Real Estate 44.5 632.6 1532.5 8.7%
Agriculture 46.6 445.7 1268.4 6.9%
Services 8.6 135.0 512.8 2.5%
Total 669.3 7340.0 17410.4 100%
Source: IMF country report and Vietnam Statistical Yearbooks. Note: Actual disbursed amounts converted to constant 1994 US dollars using the GDP implicit price deflator.

32
Table 3. FDI in China by Sector (in millions of 1994 US Dollars)
Sector 1985-1989 1990-1994 1995-1998 1999-2002 1985-2002
(% of 5 sectors)
Farming, forestry, and fishery 50.5 1150.0 2621.6 4092.0 2.6%
Industry 133.5 24068.6 99620.9 132042.2 82.9%
Construction 81.7 3885.5 6236.7 3770.5 4.5%
Transport, post, and telecommunication
1504.9 4958.6 6407.0 4942.2 5.8%
Wholesale, Retail Trade and Catering services
289.3 3020.0 5108.2 4446.0 4.2%
Total 2059.9 37082.7 119994.4 149292.9 100%
Source: China Statistical Yearbooks. Note: Actual disbursed amounts converted to constant 1994 US$ using the GDP implicit price deflator.

33
Table 4. Endogeneity t-Tests
Vietnam
China
t-statistic
Adjusted R2
t-statistic
Adjusted R2
FDI*LAB
.98
.9782
-.43
.9652
CAP
.95
.9583
.68
.9472
LAB
.97
.9818
.45
.9769
HUM*CAP
.96
.9795
.46
.9872
INT
-.93
.9800
-.45
.9779
FDI
-.92
.9811
.14
.9793
Notes: Null hypothesis is that no significant endogeneity exists. See footnote 15. Critical value for the ninety-five percent confidence level is 1.99.

34
Table 5. Aggregate Effects of FDI on Growth for Vietnam Dependent Variable: Log of GDP
5.1
5.2 5.3 5.4
FDI .0904*** (.0323)
-.0272 (.0508)
FDILAB 3.24e-5*** (.7.8e-6)
3.81e-5*** (1.33e-5)
LAB .7823*** (.2199)
.8499*** (.2075)
.3069* (.1710)
-.1222 (.3898)
CAP .3127*** (.0631)
.1684** (.0785)
.3551*** (.0557)
.4059*** (.1104)
HUMCAP .2737* (.1629)
.4243** (.1619)
.5437*** (.1555)
.5460*** (.1567)
INT -.1283 (1.837)
-.1113 (1.449)
.5474 (1.011)
.7114 (1.088)
Observations 70 70 70 70 Adjusted R2 .9672 .9399 .9584 .9783 Prob > F .0000 .0000 .0000 .0000
Notes: Specification is given in equation (8), estimated with fixed-effects by feasible GLS as described on pages 12-13. Standard errors are in parentheses. Significance levels are * 10 percent level, ** 5 percent level, *** 1 percent level.
35
Table 6. Aggregate Effects of FDI for China Dependent Variable: Log of GDP
6 .1 6.2 6.3 6.4 FDI .0603***
(.0163) .0048
(.0153) FDILAB 2.52e-06***
(3.29e-07) 2.69e-06***
(4.22e-07) LAB .9396***
(.1235) .9280*** (.2004)
.5549*** (.0953)
.9465*** (.1682)
CAP .2197*** (.0366)
.1354*** (.0799)
.2482*** (.0282)
.2645*** (.0645)
INT -.1053 (.4368)
-.6002 (.5159)
-.3876 (.3357)
-.4849 (.3962)
HUMCAP .5051*** (.0845)
.5394*** (.1589)
.3142*** (.6921)
.2857*** (.0904)
Observations 100 100 100 100 Adjusted R2 .9408 .9642 .9819 .9746 Prob > F .0000 .0000 .0000 .0000
Notes: Specification is given in equation (8), estimated with fixed-effects by feasible GLS as described on pages 12-13. Standard errors are in parentheses. Significance levels are * 10 percent level, ** 5 percent level, *** 1 percent level.

36
Table 7. Sectoral Effects of FDI in Vietnam Dependent Variable: Log of GDP
7.1
FDIxDi
7.2 FDIxDi + Di
7.3 FDIxLABxDi + Di
Industry .0399 (.0351)
7.86e-5** (3.60e-5)
1.76e-5* (9.21e-6)
Construction .0573 (.0518)
.0261 (.0451)
1.29e-5 (1.75e-5)
Transportation -.2059*** (.0391)
.0409 (.0567)
.0001 (.0001)
Real Estate -.0555 (.0563)
.0733 (.0636)
6.0e-5* (3.24e-5)
Agriculture -.2335*** (.0548)
-.3459*** (.0531)
-.0004*** (7.0e-5)
LAB .9028*** (.1051)
.5205*** (.1125)
.5012** (.2592)
CAP .1034* (.0623)
.1946** (.0846)
.3464*** (.0697)
HUMCAP .3726 (.2352)
.3691* (.2011)
.4538*** (.1475)
INT .6260 (.5746)
-.7169 (.4761)
.3763 (.3909)
Observations 70 70 70 Adjusted R2 .9608 .9462 .9326 Prob > F .0000 .0000 .0000
Notes: Specification is given in equation (8), estimated by feasible GLS as described on pages 12-13. The coefficient reported for manufacturing is the slope coefficient on FDI or FDIxLAB; manufacturing is the omitted sectoral dummy. Coefficients on pure industry fixed effects (7.2 and 7.3) are not reported. Standard errors are in parentheses. Significance levels are * 10 percent level, ** 5 percent level, *** 1 percent level.
37
Table 8. Sectoral Effects of FDI in China Dependent Variable: Log of GDP
8.1 FDIxDi
8.2 FDIxDi + Di
8.3 FDIxLABxDi + Di
Industry .0878*** (.0165)
.1014*** (.0164)
2.35e-6*** (3.03e-07)
Construction -.0252*** (.0193)
-.0418 (.1098)
-.00002 (.00002)
Transportation, Post and Tele- Communication
-.0819*** (.0144)
-.0818*** (0189)
8.44e-6 (8.43e-6)
Wholesale, Trade, and Catering Services
.00017 (.0219)
.1339 (.0882)
1.55e-5** (7.72e-06)
Agriculture -.1107*** (.0106)
-.1993*** (.0337)
3.51e-5*** (9.41e-06)
LAB .9368*** (.1382)
.9055*** (.1405)
.9499*** (.0954)
CAP .2293*** (.0669)
.1481*** (.0422)
.2482*** (.0256)
INT -.6644 (.4373)
-.9240** (.3958)
.3359 (.3291)
HUM .3987*** (.0998)
.9337*** (.1468)
.3577*** (.0653)
Observations 100 100 100 Adjusted R2 .9606 .9732 .9794 Prob > F .0000 .0000 .0000
Notes: Specification is given in equation (8), estimated by feasible GLS as described on pages 12-13. The coefficient reported for manufacturing is the slope coefficient on FDI or FDIxLAB; manufacturing is the omitted sectoral dummy. Coefficients on pure industry fixed effects (8.2 and 8.3) are not reported. Standard errors are in parentheses. Significance levels are *10 percent level, **5 percent level, ***1 percent level.


