
Irrigation Investment
The case of Ethiopia
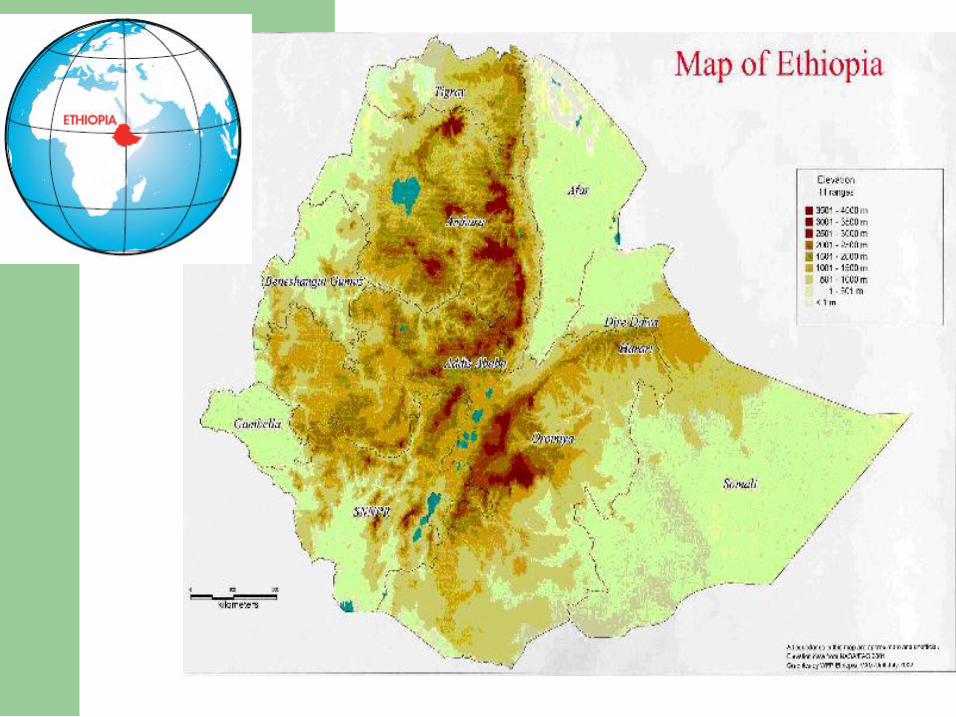
1.Brief Profile of the Country
l 1.1. Land Ethiopia covers an area of 1.14 Million km square.
1.2. Location
Situated in North Eastern Africa Bordering With Sudan, Eretria ,Djibouti, Somali and Kenya
l 1.3. Topography l Ethiopia is land of natural contrasts
Ø Highest 4620M above seal level Ø Lowest 148 M below seal level
1.Profile
1.4. Population Estimated over 77 Million – About 50% are below age 20 – Average number of inhabitants (Density) per square kilometer is 49
1.5 Economy About 85% of the Country's Population earns Living from Agriculture – Agriculture is thus the backbone of the national economy and a
source of principal export items ‘Agriculture: – 47% of GDP – 85% of employment – 13% growth rate since 2003/04

1. Profile
l GDP – US$245 per capita, lower than the SSA average – GDP growth rate >11% for past four years
l Poverty – Poverty from 46% in 1996 to 38% in 2005
2.Challenges
l Despite good recent economic performance, Ethiopia faces a number of significant development challenges – High poverty – High population growth, high population pressure in highlands – Dominance of rainfed agriculture:
l Dependence of agriculture and national economy on rainfall l Agricultural growth based on extension of area
– High level of land degradation – Food prices growing at an annual rate of 24 percent in recent
months l Weather shocks: 10 percent decline in crop production could
lead to a 3 percent decline in GDP

Ethiopia: rainfall, GDP and Ag GDP
80
60
40
20
0
20
40
60
80
1982
1983
1984
1985
1986
1987
1988
1989
1990
1991
1992
1993
1994
1995
1996
1997
1998
1999
2000
year
%
30
25
20
15
10
5
0
5
10
15
20
25
rainfall variability GDP growth Ag GDP growth
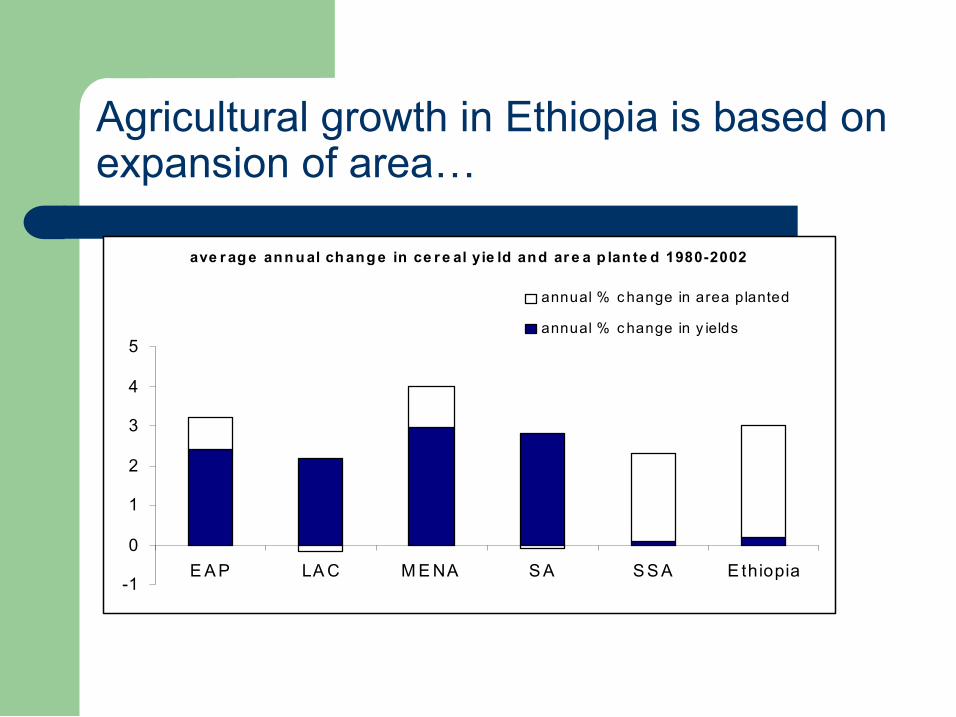
Agricultural growth in Ethiopia is based on expansion of area…
ave r age annual change in ce r e al yie ld and ar e a p lan te d 19802002
1
0
1
2
3
4
5
EAP LAC MENA SA SSA E thiopia
annual % change in area planted
annual % change in y ields

3.Potentials of Water Resources
l Water resources – 1,700 m 3 /year per capita; Ethiopia is the “Water Tower” of Africa
– Many of Ethiopia’s rivers are transboundary – Highly seasonal water availability: 70% of the total annual runoff is obtained during the period June September
– Little storage
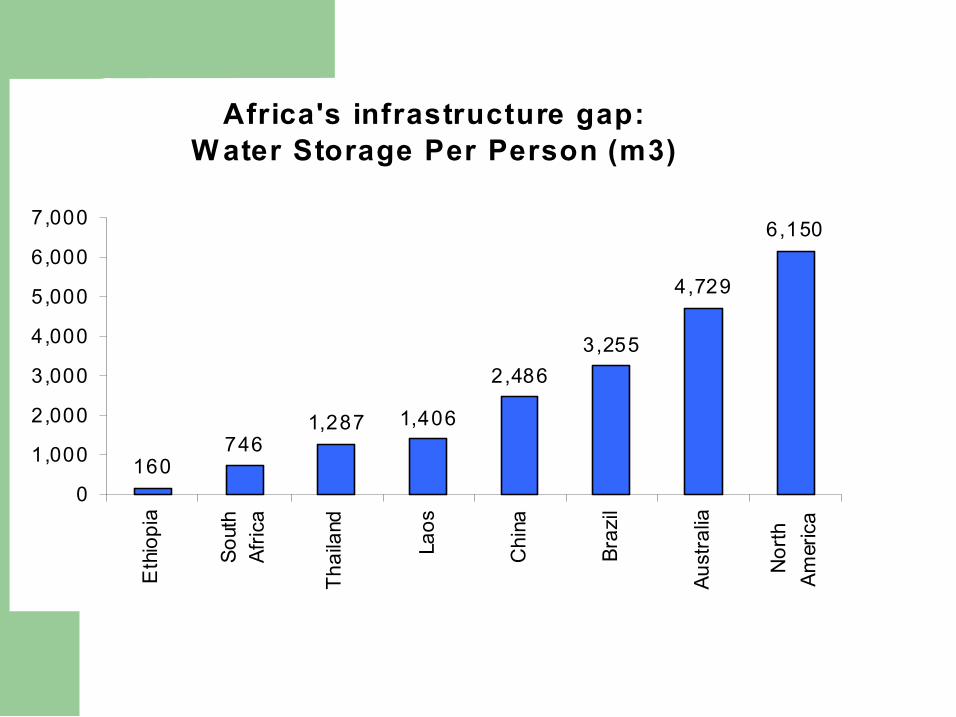
Africa's infrastructure gap: Water Storage Per Person (m3)
160 746
1,287 1,406
2,486 3,255
4,729
6,150
0
1,000
2,000
3,000
4,000
5,000
6,000
7,000
Ethiopia
South
Africa
Thailand
Laos
China
Brazil
Australia
North
America

3. Potentials of Water Resource
3.1 Ethiopia’s water resources – is estimated at 123 and 2.6 billion m3, respectively, of renewable surface and ground freshwater per annum.
– Of the ten river basins in the country, four basins, i.e. BaroAkobo, Abbay, Tekeze and OmoGhibe account for 80–90% of the country's water resource.
3.2 Yet the country is affected by recurring drought – due its reliance on rainfed agriculture and the associated seasonal fluctuation and uneven distribution of rain water.
3.3 The country irrigation potential – about 3.6 million hectares, of which currently only about 8 % has been developed.

Surface Water Resource & Irrigation Potentials
N o . R iv e r b a s in C a tc hm e n t s a re a (k m 2 )
A n nu a l r u n o ff (m 3 × 1 0 9 )
S p e c if ic d is c h a rg e ( lit r e s /k m 2 )
I r r ig a t io n p o te n t ia l (1 0 3 ha )
P e rc e n ta g e D eve lo p ed (L a rg e & S m a ll S c a le )
1 A b b a y 1 9 9 ,8 1 2 5 2 .6 0 7 .8 7 1 1 4 .3 8 2 A w a sh 1 1 2 ,7 0 0 4 .6 0 1 .4 2 0 6 3 4 .0 3 B a ro A k o bo 7 4 ,1 0 0 2 3 .6 0 9 .7 4 8 3 0 .0 6 4 G ena le D aw a 1 7 1 ,0 5 0 5 .8 8 1 .2 3 2 6 1 .1 0 5 M e r e b 5 ,9 0 0 0 .2 6 3 .2 3 8 1 .3 2 6 O m o G h ib e 7 8 ,2 0 0 1 7 .9 6 6 .7 3 4 8 3 .4 2 7 R ift V a lle y 5 2 ,7 4 0 5 .6 4 3 .4 4 6 .5 4 5 .7 5 8 T ek e z e 9 0 ,0 0 0 7 .6 3 3 .2 3 0 2 2 .2 4 9 W a b i
S h e be le 2 0 0 ,2 1 4 3 .1 6 0 .5 1 2 2 1 .2 7
1 0 D anak i l 6 2 ,8 8 2 0 .8 6 0 .0 T o ta l 2 5 8 2 .5 6 .2 4
4. Policy and Strategy
4.1 The Government of Ethiopia's (five year) Plan for Accelerated and Sustained Development to End Poverty (PASDEP) (20062011)
– aims to support increased shift to diversification and commercialization of agriculture.
– The private sector push, especially on exports, is expected to create more jobs and reduce foreign exchange constraints.
– PASDEP will strengthen its support towards increased agricultural productivity, output diversification, and greater market orientation in order to help farmers to move beyond subsistence farming to smallscale market oriented agriculture.
4.Policy and Strategy contd.
The Government's policy towards irrigation management and development has been outlined in a number of recent documents
4.2 Ethiopia’s water policy – Conservation and management of water resources has been identified as a
key policy direction for the Ministry of Water Resources (MoWR,1999).
4.3 Legislation – on water resources utilization and management has been enacted. A water
code that regulates licensing, fees establishment, charges for urban and irrigation water supply and pollution control has been prepared.
.
4. Policy Strategy and Development Program
4.4 The National Water Resource Strategy (2001) – to translate the Water Resources Management Policy into action by defining a set of medium to longterm measures or action plans in the field of general water resources, hydropower development, water supply and sanitation and irrigation development
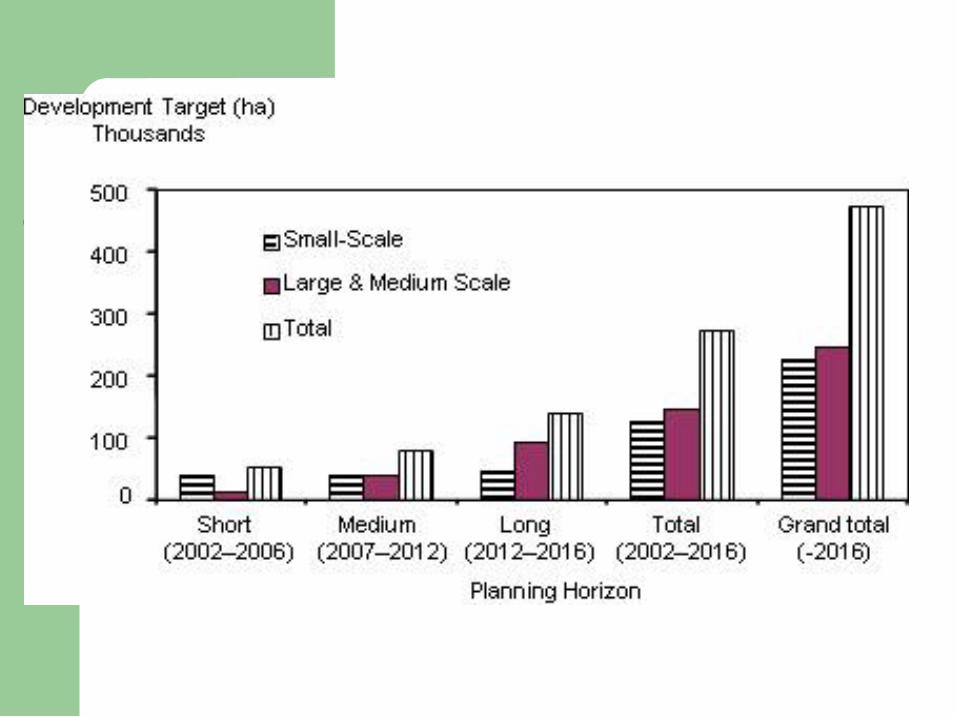
– The Water Resources Development Strategy (20022016) envisages the development of over 260,000 ha of irrigation in small, medium and largescale schemes.
– Irrigated area, as a result, is expected to reach 471,000 ha by 2016.

5.Current initiative
l The recently completed PASDEP proposes carrying out prefeasibility studies on 177,998 ha of medium and large scale irrigation. It also proposes feasibility and design on 464,051 ha and carrying out construction in 430,061 ha at an estimated investment cost of Birr 20,755 million (USD 2.3 billion).
l The ongoing I&D projects are parts of the efforts to meet GoE’s ambitious irrigation development targets, as indicated in PASDEP.
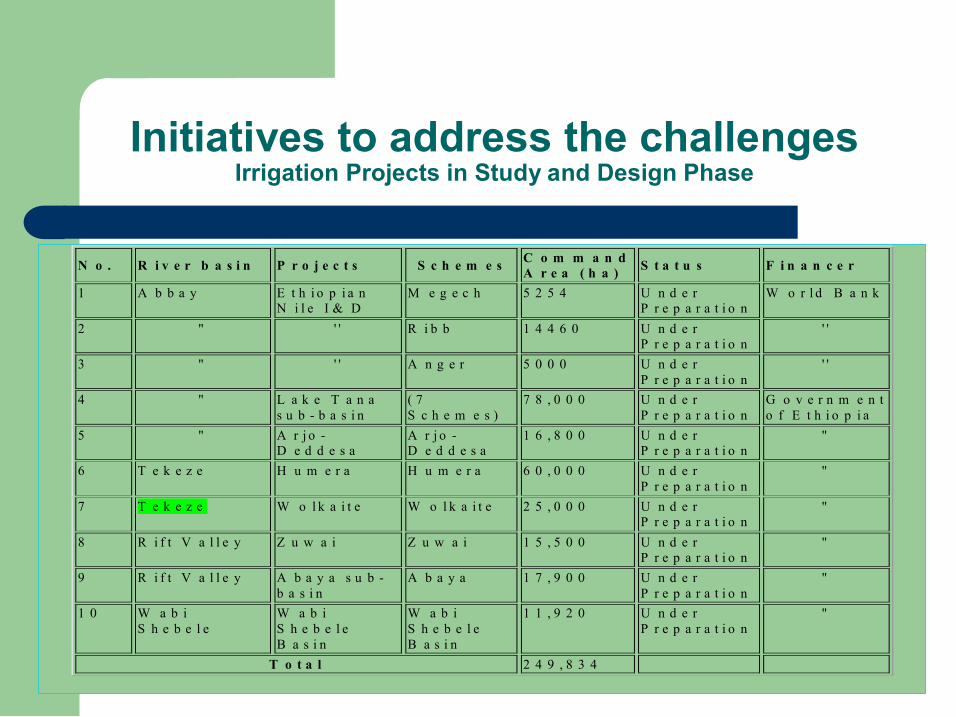
Initiatives to address the challenges Irrigation Projects in Study and Design Phase
N o . R i v e r b a s i n P r o j e c t s S c h e m e s C o m m a n d A r e a ( h a ) S t a t u s F i n a n c e r
1 A b b a y E t h i o p i a n N i l e I & D
M e g e c h 5 2 5 4 U n d e r P r e p a r a t i o n
W o r l d B a n k
2 " ' ' R i b b 1 4 4 6 0 U n d e r P r e p a r a t i o n
' '
3 " ' ' A n g e r 5 0 0 0 U n d e r P r e p a r a t i o n
' '
4 " L a k e T a n a s u b b a s i n
( 7 S c h e m e s )
7 8 , 0 0 0 U n d e r P r e p a r a t i o n
G o v e r n m e n t o f E t h i o p i a
5 " A r j o D e d d e s a
A r j o D e d d e s a
1 6 , 8 0 0 U n d e r P r e p a r a t i o n
"
6 T e k e z e H u m e r a H u m e r a 6 0 , 0 0 0 U n d e r P r e p a r a t i o n
"
7 T e k e z e W o l k a i t e W o l k a i t e 2 5 , 0 0 0 U n d e r P r e p a r a t i o n
"
8 R i f t V a l l e y Z u w a i Z u w a i 1 5 , 5 0 0 U n d e r P r e p a r a t i o n
"
9 R i f t V a l l e y A b a y a s u b b a s i n
A b a y a 1 7 , 9 0 0 U n d e r P r e p a r a t i o n
"
1 0 W a b i S h e b e l e
W a b i S h e b e l e B a s i n
W a b i S h e b e l e B a s i n
1 1 , 9 2 0 U n d e r P r e p a r a t i o n
"
T o t a l 2 4 9 , 8 3 4
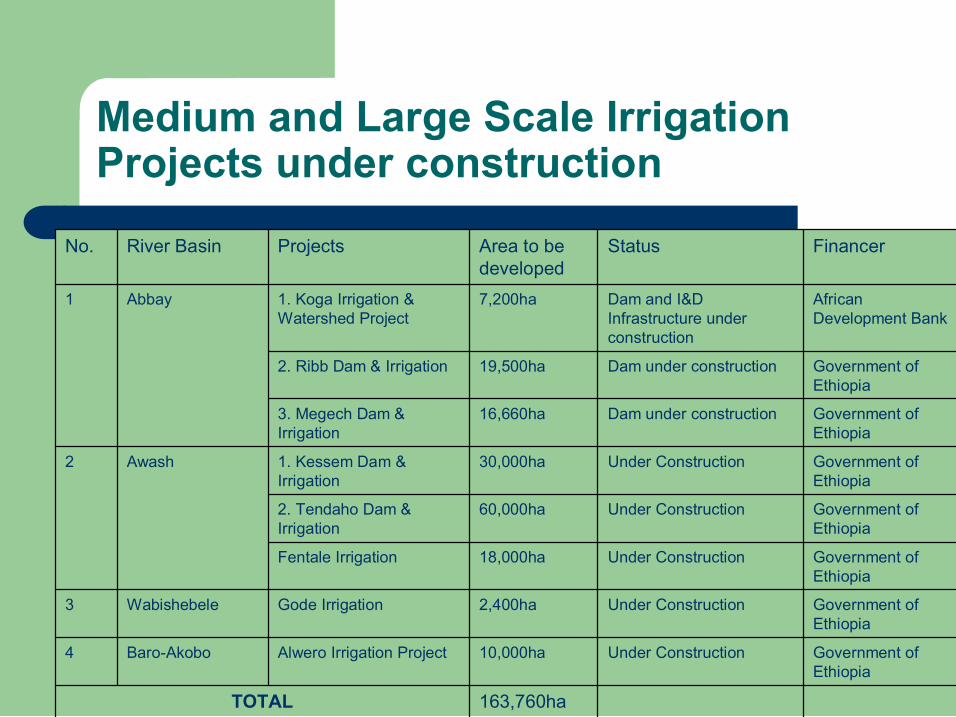
Medium and Large Scale Irrigation Projects under construction
163,760ha TOTAL
Government of Ethiopia
Under Construction 10,000ha Alwero Irrigation Project BaroAkobo 4
Government of Ethiopia
Under Construction 2,400ha Gode Irrigation Wabishebele 3
Government of Ethiopia
Under Construction 18,000ha Fentale Irrigation
Government of Ethiopia
Under Construction 60,000ha 2. Tendaho Dam & Irrigation
Government of Ethiopia
Under Construction 30,000ha 1. Kessem Dam & Irrigation
Awash 2
Government of Ethiopia
Dam under construction 16,660ha 3. Megech Dam & Irrigation
Government of Ethiopia
Dam under construction 19,500ha 2. Ribb Dam & Irrigation
African Development Bank
Dam and I&D Infrastructure under construction
7,200ha 1. Koga Irrigation & Watershed Project
Abbay 1
Financer Status Area to be developed
Projects River Basin No.
Small scale irrigation
l Smallscale irrigation schemes in Ethiopia are understood to include traditional smallscale up to 100 ha and modern communal schemes up to 200 ha (MoWR 2002).
l Traditionally, farmers have built smallscale schemes on their own initiative, sometimes with government technical and material support.
l They manage them through their own users' association or committees (MoWR 2002).
l The farm size varies between 0.25 ha and 0.5 ha. Water users' associations have long existed to manage traditional schemes. They are generally well organised and effectively operated by farmers who know each other and are committed to cooperate closely to achieve common goals.
l Typical associations comprise up to 200 users who share a main canal or a branch canal. They may be grouped into several teams of 20 to 30 farmers each. Such associations handle construction, water allocation, operation and maintenance functions.
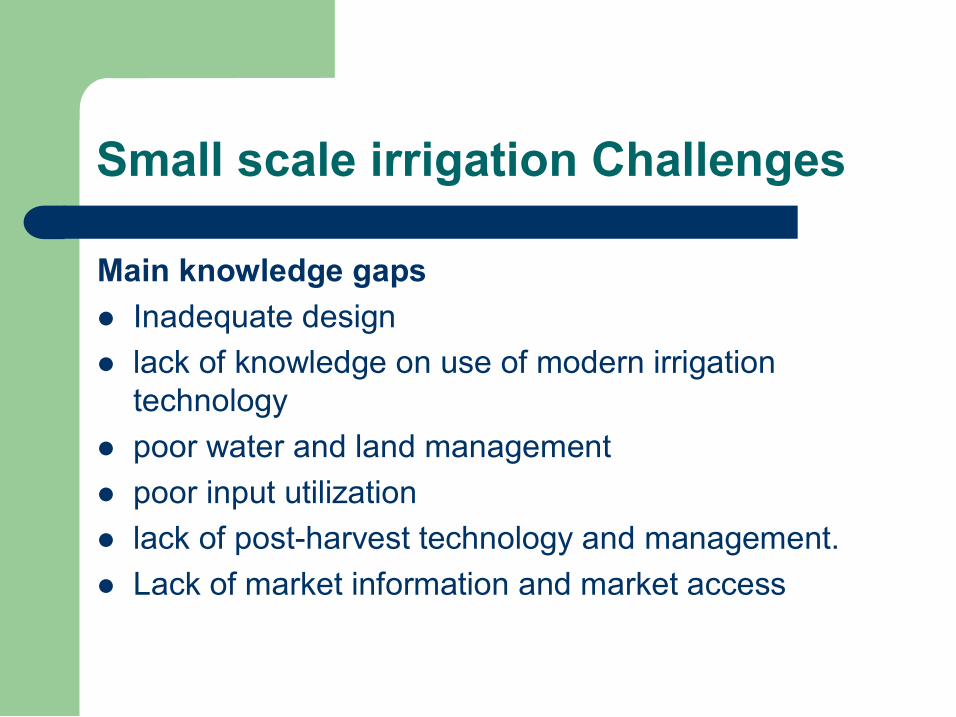
Small scale irrigation Challenges
Main knowledge gaps l Inadequate design l lack of knowledge on use of modern irrigation technology
l poor water and land management l poor input utilization l lack of postharvest technology and management. l Lack of market information and market access
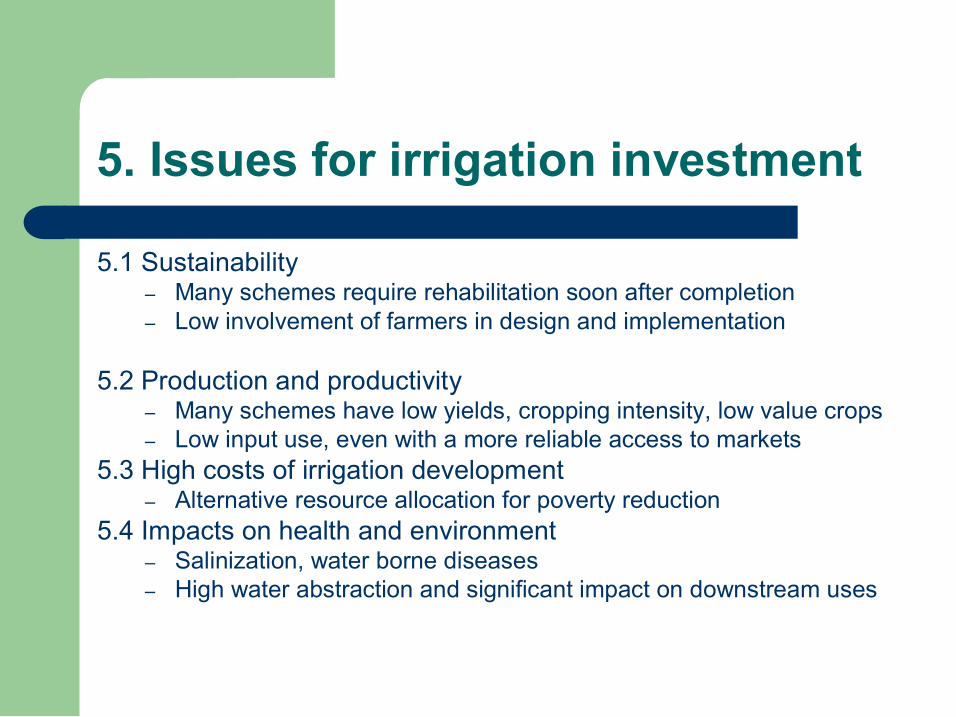
5. Issues for irrigation investment
5.1 Sustainability – Many schemes require rehabilitation soon after completion – Low involvement of farmers in design and implementation
5.2 Production and productivity – Many schemes have low yields, cropping intensity, low value crops – Low input use, even with a more reliable access to markets
5.3 High costs of irrigation development – Alternative resource allocation for poverty reduction
5.4 Impacts on health and environment – Salinization, water borne diseases – High water abstraction and significant impact on downstream uses
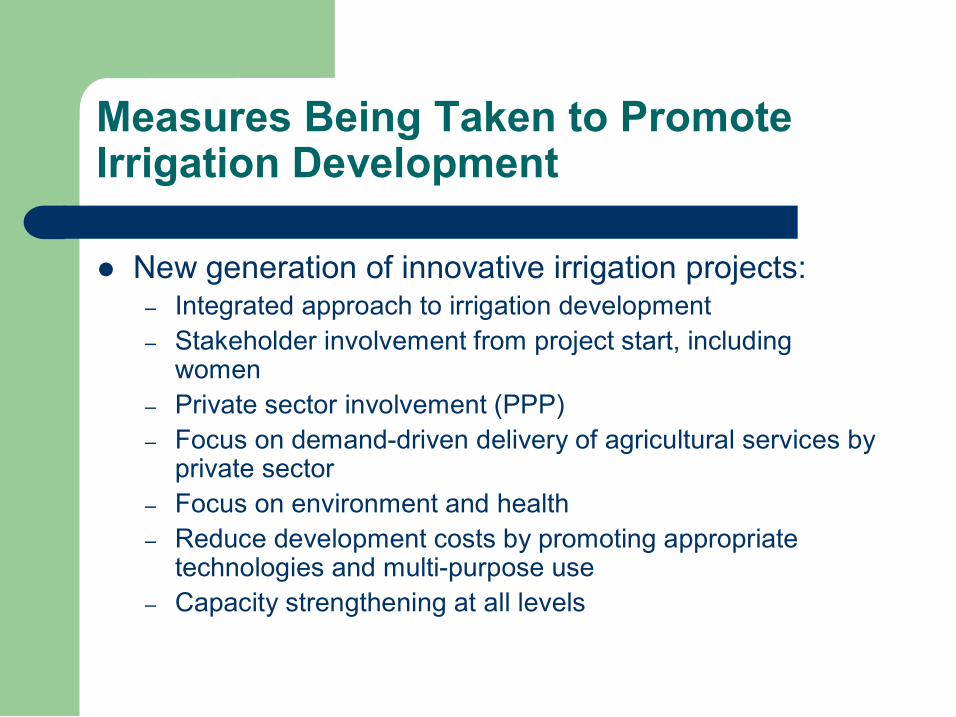
Measures Being Taken to Promote Irrigation Development
l New generation of innovative irrigation projects: – Integrated approach to irrigation development – Stakeholder involvement from project start, including women
– Private sector involvement (PPP) – Focus on demanddriven delivery of agricultural services by private sector
– Focus on environment and health – Reduce development costs by promoting appropriate technologies and multipurpose use
– Capacity strengthening at all levels


