
INVESTOR KIT JANUARY – SEPTEMBER 2010
2
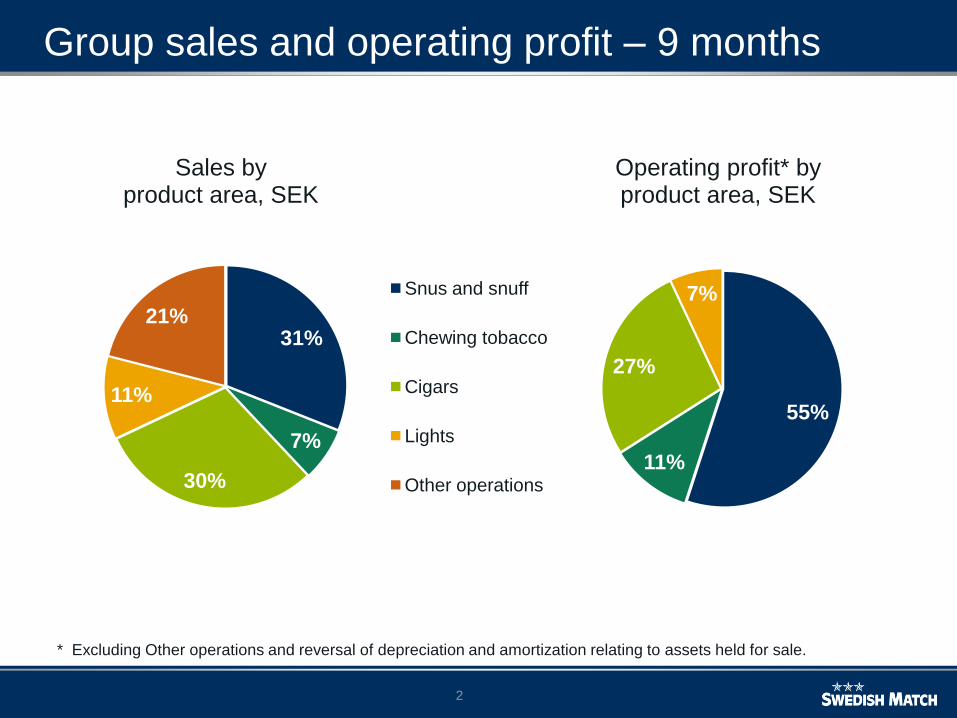
Group sales and operating profit – 9 months
31%
7%
30%
11%
21%
Snus and snuff
Chewing tobacco
Cigars
Lights
Other operations
55%
11%
27%
7%
Sales byproduct area, SEK
Operating profit* byproduct area, SEK
* Excluding Other operations and reversal of depreciation and amortization relating to assets held for sale.
3
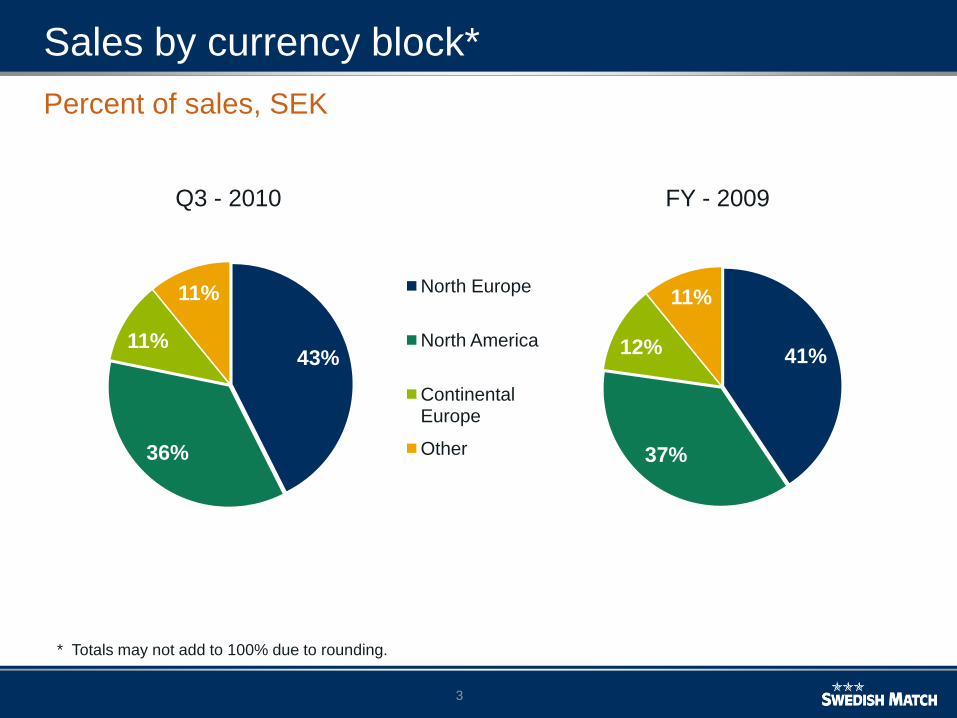
Sales by currency block*
43%
36%
11%
11% North Europe
North America
Continental Europe
Other
41%
37%
12%
11%
* Totals may not add to 100% due to rounding.
Percent of sales, SEK
Q3 - 2010 FY - 2009

44
Group results* - third quarter 2010
Sales amounted to 3,823 MSEK (3,606)
¬ In local currency, sales increased by 7 percent
Operating profit amounted to 1,049 MSEK (874)
¬ Operating profit was 1,017 MSEK (874) including depreciation and
amortization relating to assets held for sale
¬ Operating profit increased by 17 percent in local currencies, including depreciation and amortization relating to assets held for sale
Profit before income tax amounted to 921 MSEK (757)
Profit for the period amounted to 729 MSEK (1,319**)
EPS (basic) was 3.23 SEK (2.53)
* Unless explicitly stated otherwise, figures are from continuing operations.** Includes profit from discontinued operations, net after tax.

55
Conclusions from the third quarter – sales
Sales* up 7% in local currencies, up 6% in SEK
Scandinavian snus sales up 9%, volumes up 1.8 percent
- Volume growth in Sweden, Norway, and Travel Retail
US snuff sales up 6% in USD, on 5% higher volume
Chewing tobacco sales down 1% in USD, down 2% in SEK
Cigar sales were up 10% in local currencies, up 7% in SEK
- US mass market cigar sales up 26% in local currencies, on significantly higher volumes
- US premium cigar sales up 6% in local currency, on somewhat higher volume
- European cigar sales up 6% in local currencies on slightly lower volumes
Lights sales up 1%
* From continuing operations (excludes South African operations).

66
Conclusions from the third quarter – op. profit
Operating profit* up 17% in local currencies, up 16% in SEK
- Snus/Snuff operating margin was 50.4%, vs. 48.8% previous year
- List price increases in the US on May 25 (6.7%), and in Sweden on June 7 (approximately 4%)
- Operating profit for chewing tobacco up 1% in local currencies, up 5% in SEK
- Cigar operating profit was up by 53% in local currencies, up 49% in SEK
- Excluding Q3 2009 restructuring charges, operating profit was up 24% in local currencies
- Continued solid underlying performance for US mass market cigars
- Operating profit up in Europe
- Operating profit up for US premium cigars
- Operating profit for lights down 4%
* From continuing operations, including amortizations and depreciations of assets held for sale.

77
Tax rate for the Group was 21% for the first nine months, and 21% in the third quarter
- Nine month tax rate includes some smaller one time items
- Underlying tax rate was 22%
Solid cash position and limited debt repayments through 2010
- Cash and cash equivalents are 1,376* MSEK vs. 2,530 MSEK as of December 31, 2009
- 600 MSEK of interest bearing debt remained in 2010, paid in October
Share repurchases during the third quarter amounted to 7.7 million shares for 1,323 MSEK
- YTD to September 30, 11.2 million shares repurchased
20 million shares cancelled in May, total registered shares stand at 231.0 million
Conclusions from the third quarter – other items
* Includes cash and cash equivalents in assets held for sale.

88
SM total value market share Aug/Sept in Sweden was 88.0%- 88.1% in June/July 2010 (89.0% in Aug/Sept 2009)
SM total volume market share Aug/Sept in Sweden was 85.7%- 85.9% in June/July 2010 (86.7% in Aug/Sept 2009)
Low price segment is 25.0% in Aug/Sept of Swedish market- 24.8% in June/July 2010 (23.8% in Aug/Sept 2009)
SM share Aug/Sept of low price segment in Sweden was 52.6%- 53.3% in June/July 2010 (55.5% in Aug/Sept 2009)
Swedish snus market down 0.6% (rolling 6 months to Sept)
US snuff market up 10.0% for the YTD ending Oct 2, 2010- SM consumption volume up 1.5% YTD ending Oct 2
Swedish Match market shares in the US- YTD ending Oct 2 was 11.9%, vs. 12.9% YTD 2009
- Longhorn share at 5.4% YTD vs. 5.0% YTD 2009; Timber Wolf share at 5.2% (6.1%); Red Man share at 1.3% (1.8%)
Nielsen snus/moist snuff consumption data*
* Source: Nielsen. Volume basis, unless stated otherwise.

99
Other items
FDA regulations with new labeling requirements and limitations on certain types of marketing, among other things, was in effect as from June 22. Swedish Match is in full compliance with all FDA regulations
On July 14, the Second Circuit Court of Appeals reversed a US District Court ruling in a case with regard to the Cohiba brand, upholding General Cigar’s rights to the brand in the US
After the close of the period, on October 1, Swedish Match and Scandinavian Tobacco Group formed a new company, combining the tobacco businesses of STG with the cigar and pipe tobacco businesses of Swedish Match (excluding US mass market cigars and minority interest in Arnold André)

1010
Financial policy and financing needs
Financial policy
- Dividend policy: 40-60% of earnings per share
- 2009 dividend paid of 4.75 SEK per share, an increase of 16% from the 2008 level of 4.10 SEK/share
- Net debt not to exceed 3 times EBITA
Financing and cash flow
- During the third quarter 1 billion SEK of bonds issued (2015) while 400 MSEK of 2012 bonds were repaid
- 8,775 MSEK of interest bearing debt (excluding retirement benefit obligations) as of September 30, 2010
- 600 MSEK of interest bearing debt remained in 2010, paid in October
- Net debt*/EBITA was 2.4
* Including net financial assets reported as assets and liabilities held for sale.

11
Maturity profile of interest bearing liabilities*
0
500
1000
1500
2000
2500
3000
2010 2011 2012 2013 2014 2015
Fixed
Float
MSEK
600**
542
1,619
2,768
Year
1,250
1,996
As of September 30, 2010
* Includes Swedish (SEK) and Global (EUR) MTN programs.** Paid in October.
12
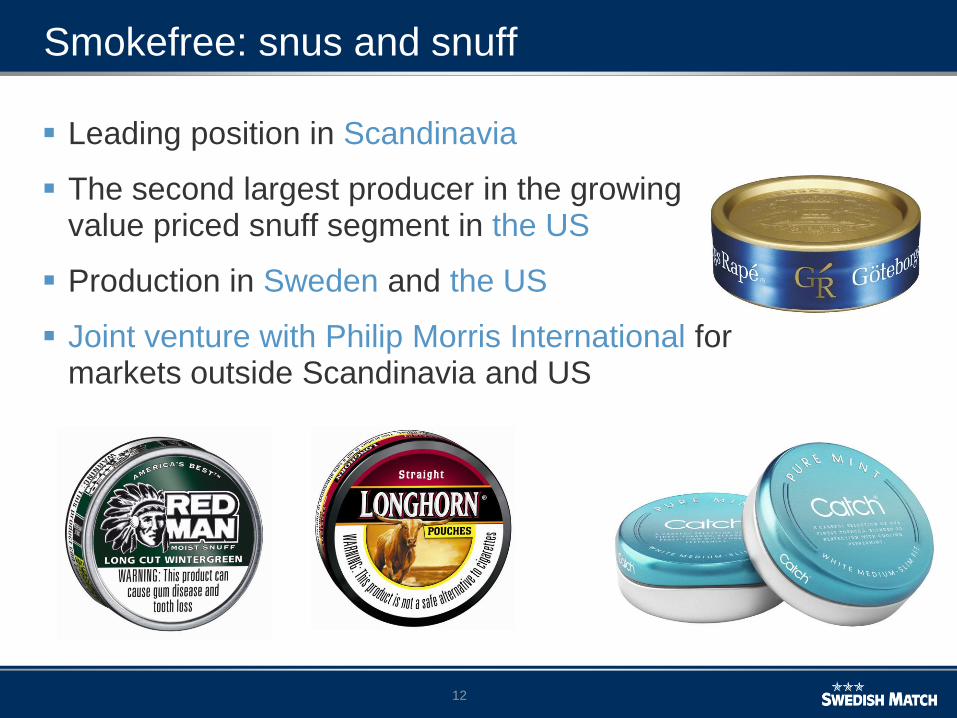
Smokefree: snus and snuff
Leading position in Scandinavia
The second largest producer in the growing value priced snuff segment in the US
Production in Sweden and the US
Joint venture with Philip Morris International for markets outside Scandinavia and US
1313
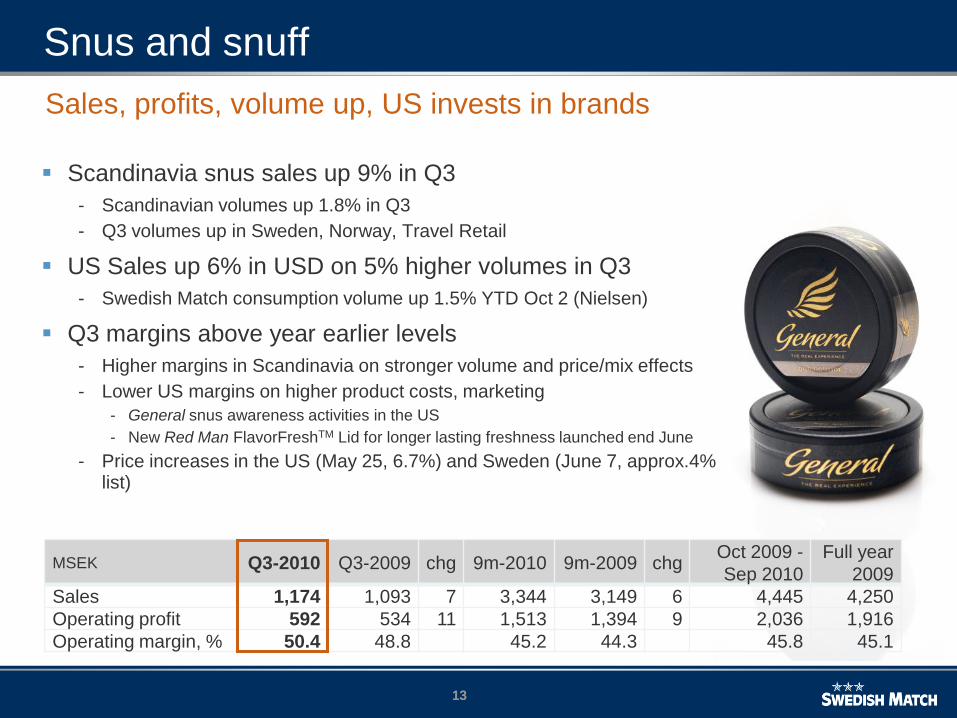
Scandinavia snus sales up 9% in Q3
- Scandinavian volumes up 1.8% in Q3
- Q3 volumes up in Sweden, Norway, Travel Retail
US Sales up 6% in USD on 5% higher volumes in Q3
- Swedish Match consumption volume up 1.5% YTD Oct 2 (Nielsen)
Q3 margins above year earlier levels
- Higher margins in Scandinavia on stronger volume and price/mix effects
- Lower US margins on higher product costs, marketing
- General snus awareness activities in the US
- New Red Man FlavorFreshTM Lid for longer lasting freshness launched end June
- Price increases in the US (May 25, 6.7%) and Sweden (June 7, approx.4% list)
MSEK Q3-2010 Q3-2009 chg 9m-2010 9m-2009 chgOct 2009 -
Sep 2010
Full year
2009
Sales 1,174 1,093 7 3,344 3,149 6 4,445 4,250
Operating profit 592 534 11 1,513 1,394 9 2,036 1,916
Operating margin, % 50.4 48.8 45.2 44.3 45.8 45.1
Snus and snuff
Sales, profits, volume up, US invests in brands

1414
Swedish snus market shares
Volume share in Sweden, rolling 6 months through Sept 2010
2 months Aug/Sepvalue
share
volume
share
Swedish Match 88.0 85.7
BAT (F&L) 7.9 9.4
Imperial (Skruf) 2.4 2.7
JTI 1.6 2.0
All other 0.1 0.2
Rolling 6 months
Swedish Match: 85.8BAT (F&L): 9.4
Imperial (Skruf): 2.6JTI: 2.0
All other: 0.2
Source: Nielsen. Totals may not add to 100% due to rounding.

1515
Volume growth of moist snuff in the US
623 615 622 649 645 615 615 620 630 602 634
141 165 178196
259 340410
480540 587
662
0
100
200
300
400
500
600
700
800
900
1000
1100
1200
1300
2000
2001
2002
2003
2004
2005
2006
2007
2008
2009
2010E
Price Value
Premium
Million cans
Market size estimated by Swedish Match using Nielsen estimates as well as industry data and estimates. Note that the value segment includes competitive “premium brand” line extensions launched at price value level.
US snuff market by segment

1616
US moist snuff market shares
Altria (UST) 56.1%
Reynolds (American Snuff Co)
30.2%
Swedish Match 11.9%
Swisher 1.6%
Source: Nielsen. Totals may not add to 100% due to rounding.
Volume share US, YTD Oct 2

1717
New Red Man, with FlavorFreshTM
FlavorFreshTM Lid means Red Man snuff stays fresh longer
Addresses key consumer demand for freshness
Unique lid, clear positioning
Supported by marketing programs beginning in July
18
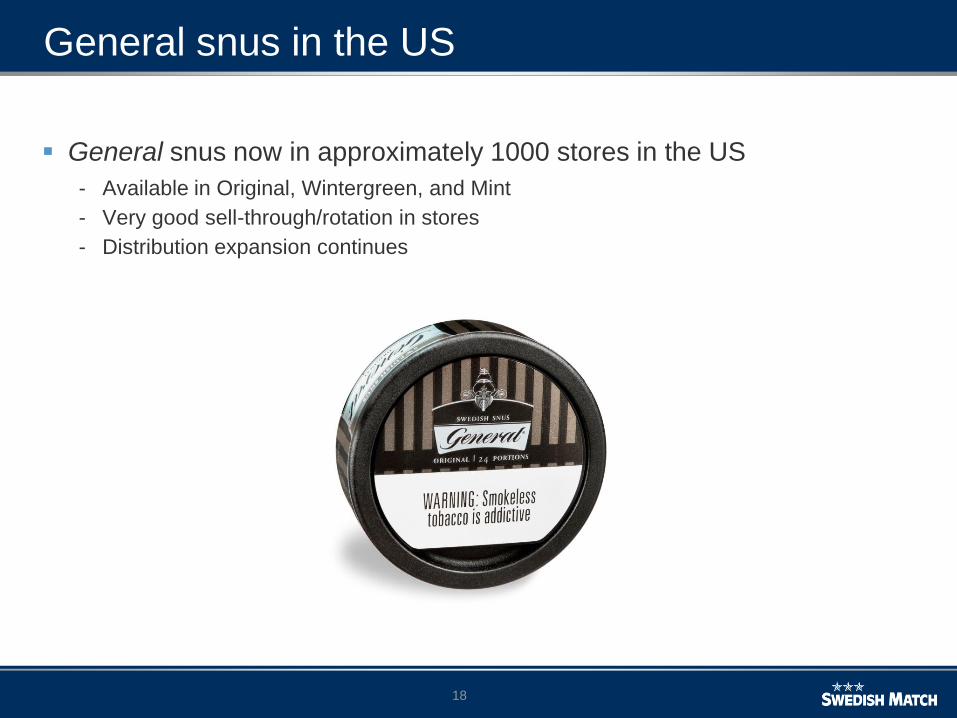
General snus in the US
General snus now in approximately 1000 stores in the US
- Available in Original, Wintergreen, and Mint
- Very good sell-through/rotation in stores
- Distribution expansion continues

1919
Smokefree: chewing tobacco
YTD sales in the US flat in local currency
Nearly all chewing tobacco sales are in the US. Swedish Match is the largest producer and production takes place in Owensboro, KY
The market typically declines by 5-10% per year in volume, down 10.9% YTD 2010 (to October 2)
Q3 US sales down 1%, operating profit up 1% in USD
YTD operating profit includes 10 MSEK charge for closure of Piccanell production in Swedenin Q2
5% price increase from end of December 2009
Market share is 45.6% (YTD to Oct 2) vs. 45.0% YTD prior year
MSEK Q3-2010 Q3-2009 chg 9m-2010 9m-2009 chgOct 2009 -
Sep 2010
Full year
2009
Sales 275 280 -2 814 878 -7 1,047 1,112
Operating profit 113 107 5 296 335 -12 372 411
Operating margin, % 41.0 38.4 36.4 38.1 35.5 36.9

2020
Chewing tobacco
Continued market decline
- 2010 category down 10.9% (Nielsen YTD to October 2, 2010)
- Swedish Match brands down 9.8% according to Nielsen
Shipments to Florida and Texas down significantly (approx. 30%) post state tax increases over the summer 2009, pulling market down
Price increase of 5% end December 2009 (4% increase net of FET increase in April ’09)
Other points:

2121
Cigars
US mass market sales and volumes show strong growth
- Q3 sales up 26% in USD, on 43% higher volume. Operating profit up significantly
- YTD mass market sales up 16% in USD, volumes up 26%
- Restructuring charge of 45 MSEK in Q3 2009 affects operating profit comparisons
US premium volumes up for Internet (Cigars International) and General Cigar in Q3
- Higher demand for smaller cigars
- Q3 premium cigar sales and operating profit up versus prior year
- YTD sales down 3% in USD, operating profit and volumes also down
European cigar sales and operating profit up in Q3 in local currencies
- Improved pricing and mix compensated for modest volume declines
- Market share gains in a number of key focus markets
MSEK Q3-2010 Q3-2009 chg 9m-2010 9m-2009 chgOct 2009 -
Sep 2010
Full year
2009
Sales 1,137 1,065 7 3,225 3,369 -4 4,281 4,426
Operating profit 284 190 49 760 757 - 938 935
Operating margin, % 24.9 17.9 23.6 22.5 21.9 21.1
Operating profit up 24% in local currencies, excl prior year restructuring charge

2222
Cigars
Europe and other non-US:
- 15% market share in Europe
- 5 billion stick market (Europe)
US mass market:
- 11.4% value share (Nielsen, YTD Oct 2)
- 5.5% volume share (Nielsen, YTD Oct 2)
- 8 billion stick market (including littles)
US premium:
- 30% market share
- 230 million stick market
36
31
32
0%
10%
20%
30%
40%
50%
60%
70%
80%
90%
100%
YTD Sept 2010
US premium US mass market Europe/ROW
Sales split (SEK)
Source: Swedish Match estimates for Europe (excluding UK) and US premium cigars.
2323
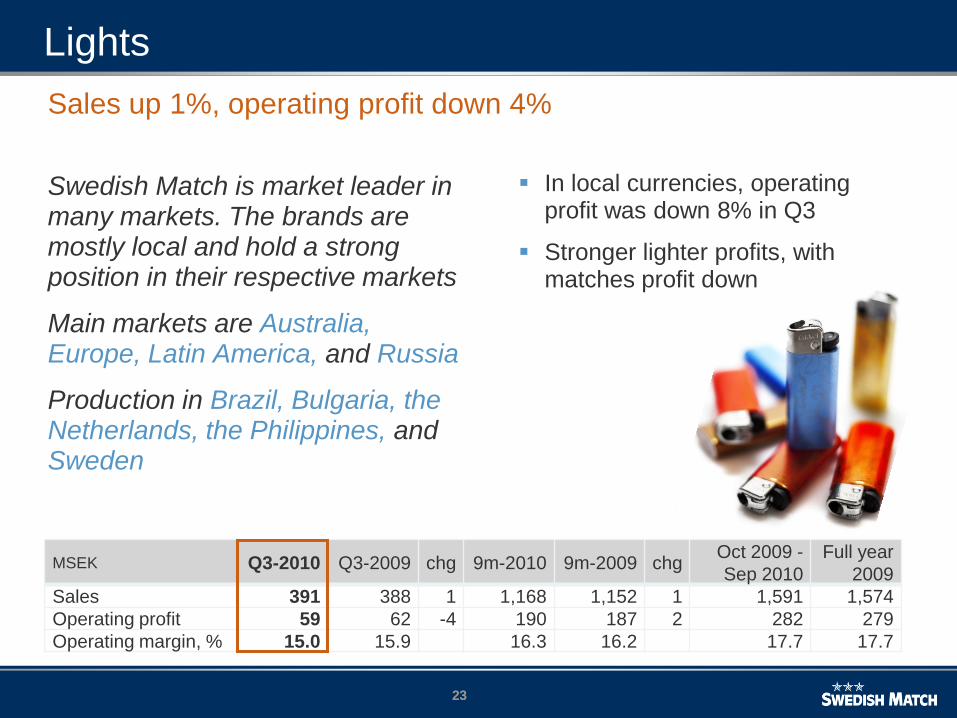
Lights
Swedish Match is market leader in many markets. The brands are mostly local and hold a strong position in their respective markets
Main markets are Australia, Europe, Latin America, and Russia
Production in Brazil, Bulgaria, the Netherlands, the Philippines, andSweden
Sales up 1%, operating profit down 4%
In local currencies, operating profit was down 8% in Q3
Stronger lighter profits, with matches profit down
MSEK Q3-2010 Q3-2009 chg 9m-2010 9m-2009 chgOct 2009 -
Sep 2010
Full year
2009
Sales 391 388 1 1,168 1,152 1 1,591 1,574
Operating profit 59 62 -4 190 187 2 282 279
Operating margin, % 15.0 15.9 16.3 16.2 17.7 17.7
2424
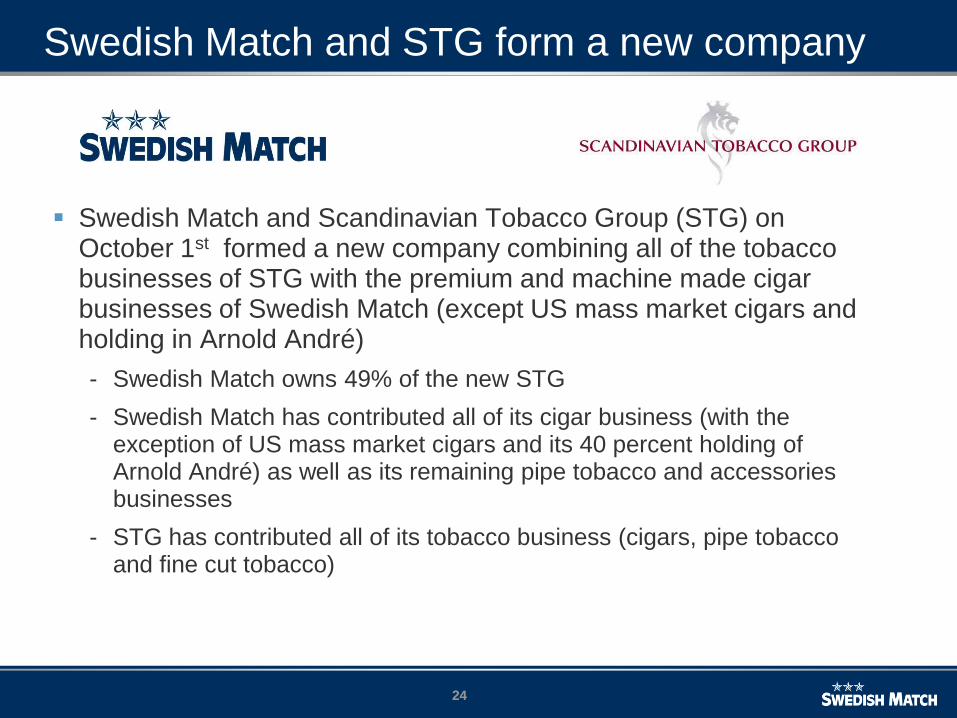
Swedish Match and STG form a new company
Swedish Match and Scandinavian Tobacco Group (STG) on October 1st formed a new company combining all of the tobacco businesses of STG with the premium and machine made cigar businesses of Swedish Match (except US mass market cigars and holding in Arnold André)
- Swedish Match owns 49% of the new STG
- Swedish Match has contributed all of its cigar business (with the exception of US mass market cigars and its 40 percent holding of Arnold André) as well as its remaining pipe tobacco and accessories businesses
- STG has contributed all of its tobacco business (cigars, pipe tobacco and fine cut tobacco)
2525
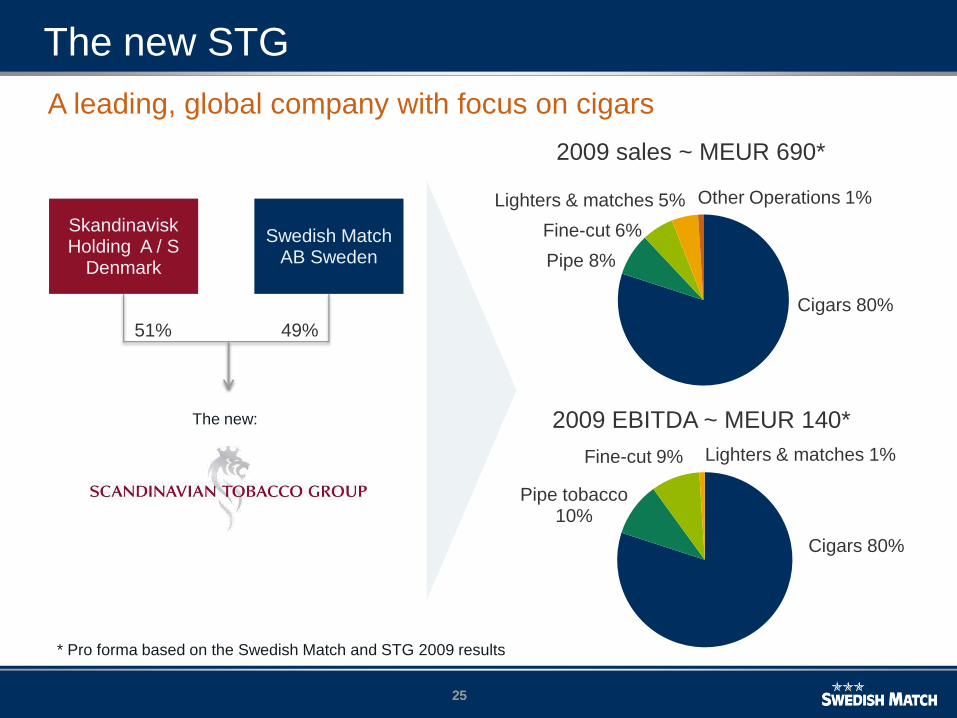
Skandinavisk Holding A / S
Denmark
Swedish Match AB Sweden
51% 49%
Lighters & matches 5%
Fine-cut 6%
Pipe 8%
Cigars 80%
Cigars 80%
Pipe tobacco 10%
Fine-cut 9% Lighters & matches 1%
The new:
* Pro forma based on the Swedish Match and STG 2009 results
Other Operations 1%
2009 EBITDA ~ MEUR 140*
2009 sales ~ MEUR 690*
A leading, global company with focus on cigars
The new STG

2626
Position the Company as the global smokefree leader
- Leverage our unique heritage, technological lead, talented organization,
and brand portfolio globally
- More aggressively pursue growth opportunities on a global basis
- Be the preferred choice by consumers
- Be the most valued partner to the trade
- Remain the industry authority for regulators and opinion makers
Leverage strong platforms to maximize long term profitabilityin Other tobacco products
- Drive profitable growth in US mass market cigars through consumer
driven innovation and strong sales execution
- Capitalize on leading position in the chewing tobacco category and
continuously drive productivity improvements
Continue to focus on operational excellence and profitability in Lights
- Strong market positions
- Efficient supply chain
Realize the potential of STG through active ownership
- Decisively pursue synergy opportunities
- Leverage brand portfolio and scale to drive profitable growth
Group strategy – updated to strengthen focus

27
CORPORATE FUNCTIONS
SM OPERATING UNITS
SMPMI 50%
STG 49%
Strategic partnerships/assoc. companies
President & CEO
Smokefree Division
US Sales Division
Scandinavia Sales Division
Lights
Lights International
Lights Latin America
SM Distribution AB
Group Finance & IT Legal Affairs
Group Human Resources Communications & Sustainability
The new operating structure
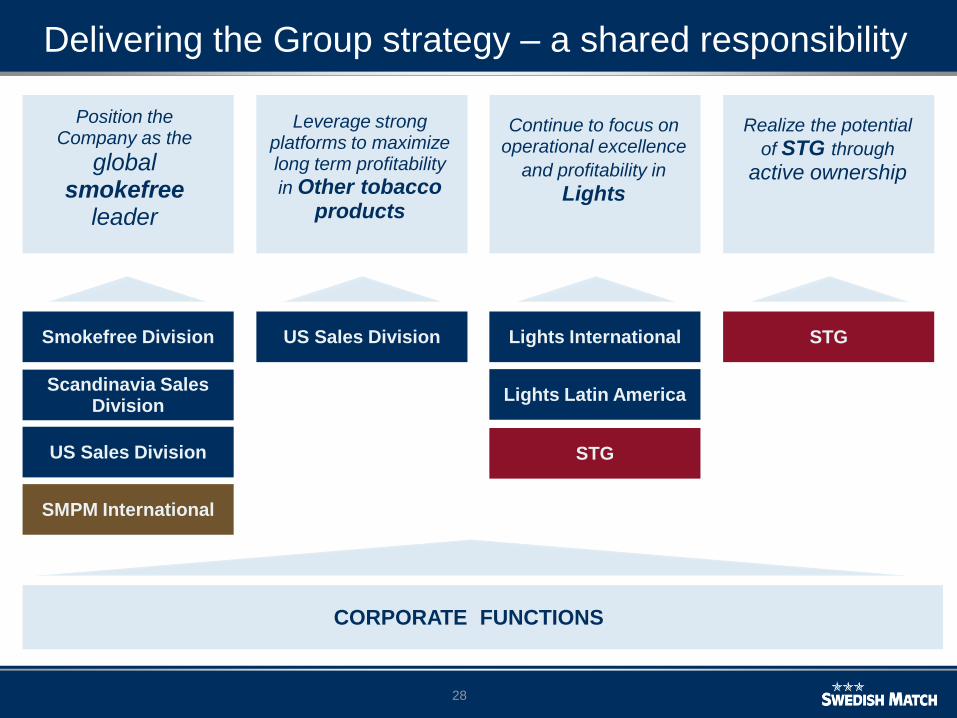
28
Leverage strong platforms to maximize long term profitability
in Other tobacco products
Realize the potential
of STG through
active ownership
Continue to focus on operational excellence
and profitability in
Lights
Lights Latin America
Position the Company as the
global smokefree
leader
CORPORATE FUNCTIONS
Smokefree Division
Scandinavia Sales Division
US Sales Division
SMPM International
US Sales Division Lights International
Lights Latin America
STG
STG
Delivering the Group strategy – a shared responsibility

29
Swedish Match – new reporting segments
Snus and snuff
- Swedish snus in Scandinavia and the US
- US moist snuff
- Income from SMPM International
Other tobacco products (OTP)
- US mass market cigars
- Chewing tobacco
Lights
- Lighters
- Matches
- Fire products
Other operations
- Distribution
- Central costs
30
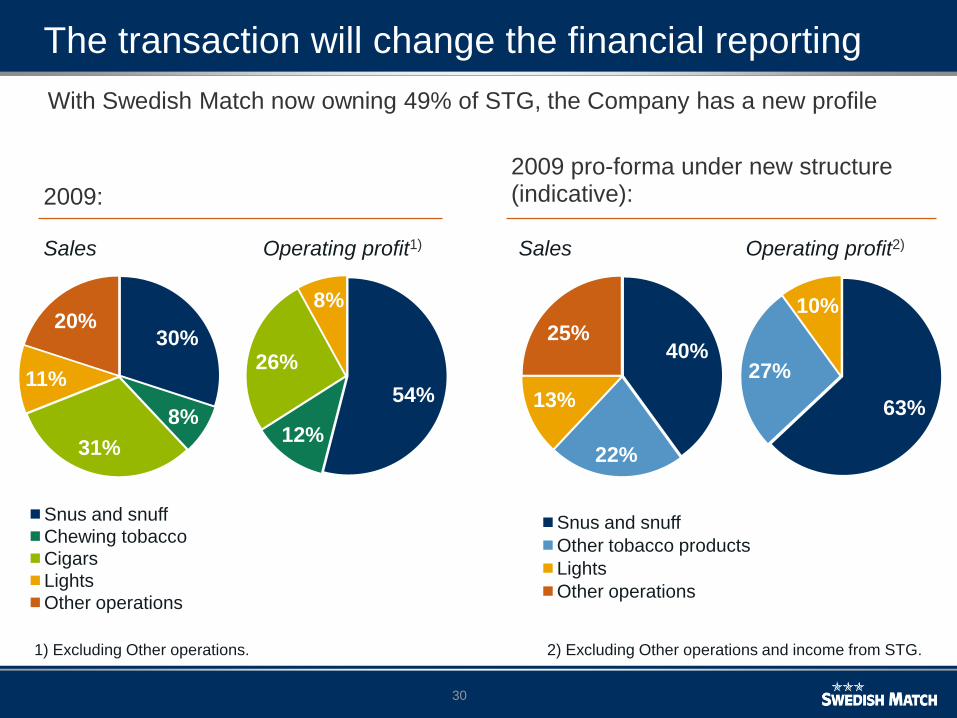
The transaction will change the financial reporting
30%
8%
31%
11%
20%
Snus and snuff
Chewing tobacco
Cigars
Lights
Other operations
54%
12%
26%
8%
40%
22%
13%
25%
Snus and snuff
Other tobacco products
Lights
Other operations
63%
27%
10%
Sales Operating profit1) Sales Operating profit2)
1) Excluding Other operations. 2) Excluding Other operations and income from STG.
With Swedish Match now owning 49% of STG, the Company has a new profile
2009:
2009 pro-forma under new structure(indicative):

31
Pro-forma sales with new segments
1.323
9.402
3.296*
1.873
9.559
3.711
2.689
2008
1.810
1.375
2.663
2007
4%
2.910*
2006
9.451
3.128*
2.076
1.341
2.906*
Snus & snuff
Other tobaccoproducts
Lights
Otheroperations
2009
10.679
4.250
2.337
11%
4%
2%
-3%
7%
1.403
* Adjusted due to hoarding in 2006.
Sales per segment (MSEK)
CAGR 06-09

32
Pro-forma operating profit with new segments
276283
294
312
Snus & snuff
Other tobacco products
Lights
Otheroperations
2009
2,900
1,916
804
-132
2008
2,375
1,667
569
-155
2007
2,173
1,427*
555
-92*
2006
2,328
1,526*
618
-92*
8%
9%
4%8%
Note: Going forward Group operating profit
will also include income from STG
8%
* Adjusted due to hoarding in 2006.
Operating profit per segment (MSEK)
CAGR 06-09

3333
Strategy More aggressively pursue growth opportunities for snus on a global
basis, in US within Swedish Match and globally through the SMPMI JV
Leverage our unique heritage, technological lead, talented
organization and brand portfolio globally
Be the preferred choice by consumers
Be the most valued partner to the trade
Remain the industry authority for regulators and opinion makers
Core focus areas Drive category growth and maintain the leading position in
Scandinavia Strengthen position in the US; take a major role in the
development of the snus category Drive the international expansion of Swedish snus in close
cooperation with SMPM International
Snus and snuff
MSEK Q3-2010 Q3-2009 chg 9m-2010 9m-2009 chgOct 2009 -
Sep 2010
Full year
2009
Sales 1,174 1,093 7 3,344 3,149 6 4,445 4,250
Operating profit 592 534 11 1,513 1,394 10 2,036 1,916
Operating margin, % 50.4 48.8 45.2 44.3 45.8 45.1
3434
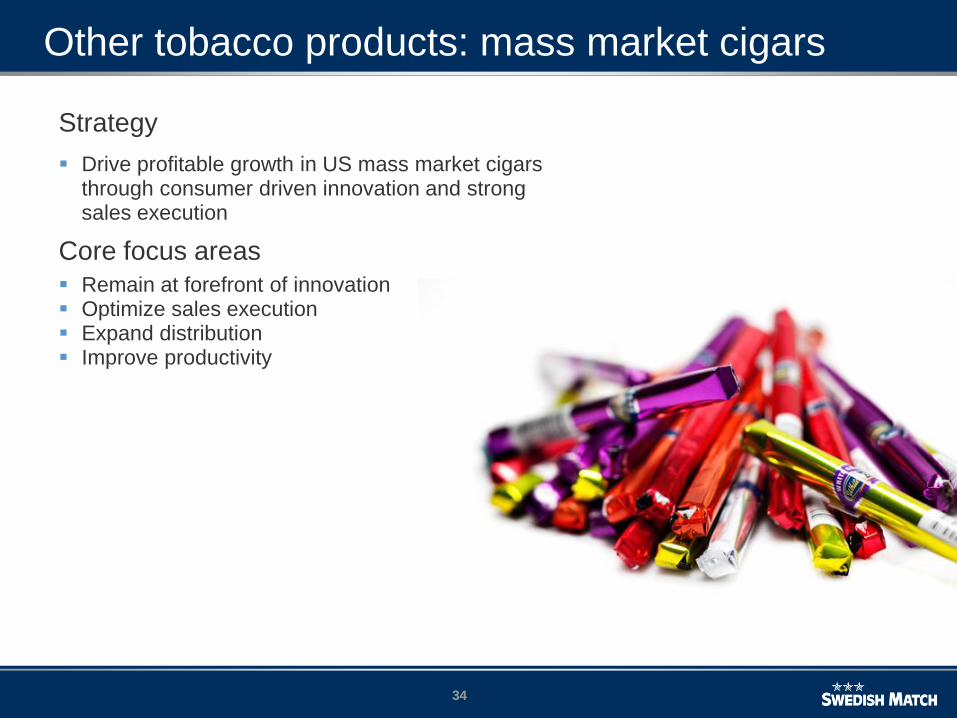
Strategy
Drive profitable growth in US mass market cigars through consumer driven innovation and strong sales execution
Core focus areas
Remain at forefront of innovation Optimize sales execution Expand distribution Improve productivity
Other tobacco products: mass market cigars

3535
Strategy
Capitalize on leading position in the chewing tobacco category and continuously drive productivity improvements
Core focus areas
Maintain strong market position and leading brands Optimize sales execution Efficient pricing strategy Manage volume declines with increased productivity
Other tobacco products: chewing tobacco
USD Q3-2010 Q3-2009 chg 9m-2010 9m-2009 chgOct 2009 -
Sep 2010
Full year
2009
Sales 87 79 10 256 239 7 323 306
Operating profit 36 24 49 100 85 18 120 105
Operating margin, % 41.0 30.3 38.9 35.5 37.2 34.4
MSEK Q3-2010 Q3-2009 chg 9m-2010 9m-2009 chgOct 2009 -
Sep 2010
Full year
2009
Sales 631 571 11 1,883 1,881 0 2,339 2,337
Operating profit 259 169 53 733 667 10 869 804
Operating margin, % 41.0 29.6 38.9 35.5 37.2 34.4
Charts below for all OTP (cigars/chewing tobacco):

3636
Strategy
Continue to focus on operational excellence and profitability in lights
Core focus areas
Focus on key brands Continuously improve productivity Maintain market leading positions Selectively pursue growth opportunities
Lights
MSEK Q3-2010 Q3-2009 chg 9m-2010 9m-2009 chgOct 2009 -
Sep 2010
Full year
2009
Sales 352 341 3 1,050 1,030 2 1,423 1,403
Operating profit 58 72 -21 191 212 -10 291 312
Operating margin, % 16.3 21.3 18.2 20.6 20.4 22.2

3737
P & L summary
Continuing operations
MSEK Q3-
2010
Q3-
2009 chg9m-
2010
9m-
2009 chgOct 2009 -
Sep 2010
Full
year
2009 chg
Sales 3,823 3,606 6 10,806 10,659 1 14,351 14,204 1
Cost of goods sold -1,896 -1,843 -5,325 -5,279 -7,160 -7,114
Gross profit 1,927 1,764 9 5,481 5,379 2 7,191 7,089 1
Sales and administrative
expenses -878 -892 -2,735 -2,821 -3,595 -3,681
Share of profit in
associated companies and
joint ventures 1 3 3 9 3 10
Operating profit 1,049 874 20 2,749 2,568 7 3,598 3,417 5
Finance income 6 35 19 76 30 86
Finance costs -134 -152 -383 -408 -504 -529
Net finance cost -128 -117 -363 -333 -474 -443
Profit before income tax 921 757 22 2,386 2,235 7 3,124 2,974 5
Income tax expense -192 -142 -501 -469 -644 -613
Profit for the period 729 615 19 1,885 1,766 7 2,480 2,361 5
EPS, basic, SEK 3.23 2.53 8.28 7.15 10.79 9.67
EPS, diluted, SEK 3.22 2.52 8.26 7.15 10.77 9.66

3838
Balance sheet in summary
MSEK September 30, 2010 December 31, 2009
Intangible assets 1,115 3,792
Property, plant and equipment 2,090 2,525
Other non-current financial receivables* 1,586 2,193
Current operating assets 2,427 5,296
Other current investments 1 1
Cash and cash equivalents 1,273 2,530
Assets held for sale* 5,501 -
Total assets 13,994 16,337
Equity attributable to equity holders of the Parent -709 899
Non-controlling interests 4 4
Total equity -705 903
Non-current provisions 996 1,301
Non-current loans 7,684 8,252
Other non-current financial liabilities* 1,457 1,440
Current provisions 95 125
Current loans 1,142 1,002
Other current liabilities 2,552 3,313
Liabilities attributable to assets held for sale* 773 -
Total equity and liabilities 13,994 16,337
* For full detail, please refer to notes in the interim report for January-September 2010

3939
Cash flow in summary
MSEK 9m - 2010 9m - 2009
Cash flow from operating activities before changes in working capital 1,986 1,990
Cash flow from changes in working capital 12 -119
Net cash from operating activities 1,997 1,871
Purchase of property, plant and equipment -248 -324
Proceeds from sale of property, plant and equipment 5 4
Purchase of intangible assets -31 -1
Acquisition of subsidiaries, net of cash acquired* - -39
Investments in associated companies and joint ventures* -123 -8
Proceeds from sale of subsidiaries, net of cash disposed of - 1,574
Changes in financial receivables etc. 0 0
Net cash used in investing activities -396 1,205
Changes in loans 207 -527
Dividends paid to equity holders of the Parent -1,089 -1,024
Repurchase of own shares -1,878 -1,368
Stock options exercised 53 51
Other 63 76
Net cash used in financing activities -2,644 -2,793
Net decrease/increase in cash and cash equivalents from discont. op. -1,043 284
Total net decrease/increase in cash and cash equivalents -1,043 459
Cash and cash equivalents at the beginning of the period 2,530 3,178
Effect of exchange rate fluctuations on cash and cash equivalents -111 -38
Less cash and cash equivalents reclassified as assets held for sale -103 -
Cash and cash equivalents at the end of the period 1,273 3,600
* For full detail, please refer to notes in the interim report for January-September 2010
4040
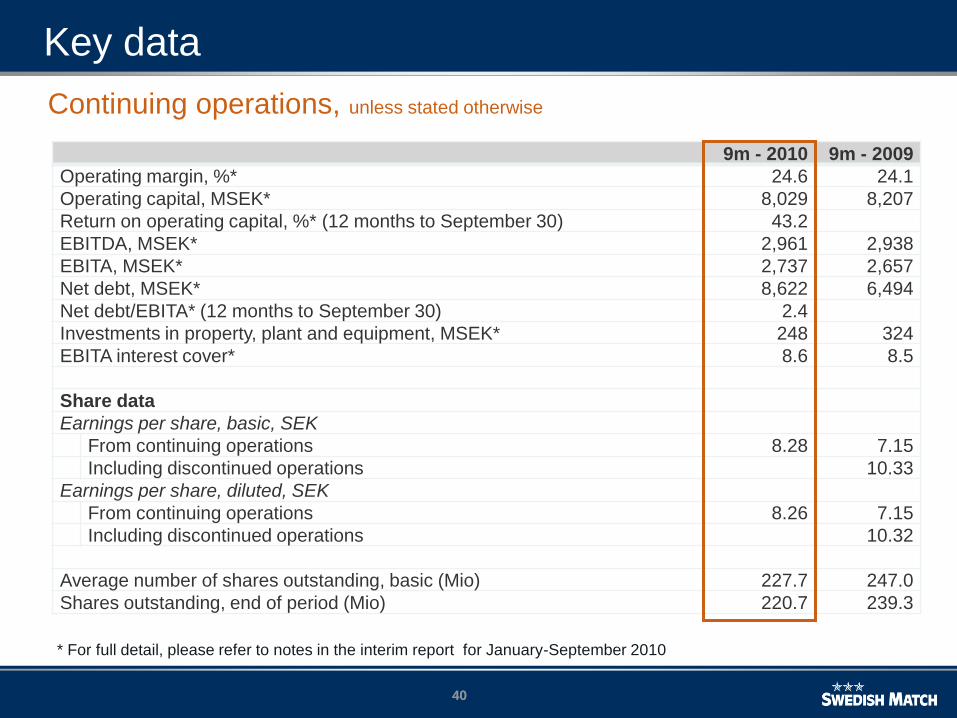
Key data
9m - 2010 9m - 2009
Operating margin, %* 24.6 24.1
Operating capital, MSEK* 8,029 8,207
Return on operating capital, %* (12 months to September 30) 43.2
EBITDA, MSEK* 2,961 2,938
EBITA, MSEK* 2,737 2,657
Net debt, MSEK* 8,622 6,494
Net debt/EBITA* (12 months to September 30) 2.4
Investments in property, plant and equipment, MSEK* 248 324
EBITA interest cover* 8.6 8.5
Share data
Earnings per share, basic, SEK
From continuing operations 8.28 7.15
Including discontinued operations 10.33
Earnings per share, diluted, SEK
From continuing operations 8.26 7.15
Including discontinued operations 10.32
Average number of shares outstanding, basic (Mio) 227.7 247.0
Shares outstanding, end of period (Mio) 220.7 239.3
Continuing operations, unless stated otherwise
* For full detail, please refer to notes in the interim report for January-September 2010
41
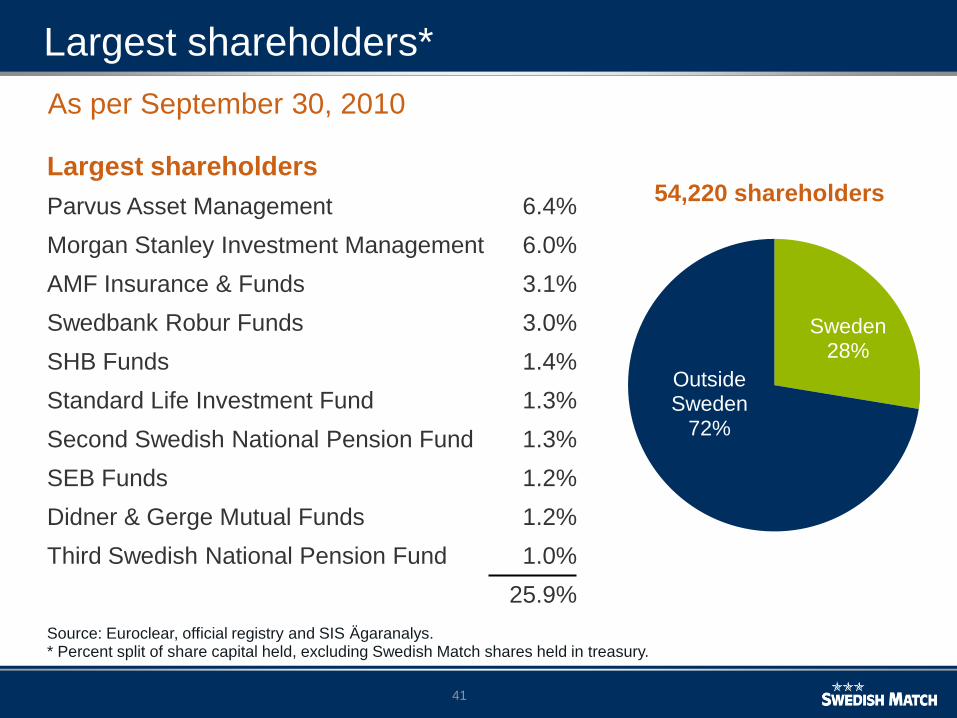
Largest shareholders*
Sweden28%
Outside Sweden
72%
Largest shareholders
Parvus Asset Management 6.4%
Morgan Stanley Investment Management 6.0%
AMF Insurance & Funds 3.1%
Swedbank Robur Funds 3.0%
SHB Funds 1.4%
Standard Life Investment Fund 1.3%
Second Swedish National Pension Fund 1.3%
SEB Funds 1.2%
Didner & Gerge Mutual Funds 1.2%
Third Swedish National Pension Fund 1.0%
25.9%
54,220 shareholders
Source: Euroclear, official registry and SIS Ägaranalys.* Percent split of share capital held, excluding Swedish Match shares held in treasury.
As per September 30, 2010

42
Snus vs. cigarettes in Sweden
0
50
100
150
200
250
0
2000
4000
6000
8000
10000
12000
14000
1965 1968 1971 1974 1977 1980 1983 1986 1989 1992 1995 1998 2001 2004 2007
Snus[Million cans]
Cigarettes [Million pieces]
1961: The monopoly is
abolished
Mid 1960’s: Health alarm on
cigarettes
1967: The round can is introduced
1973: First portion snus
The “prog” years. The culture of the working class becomes popular
1992: EU snus ban
2002: The cancer warning is abolished
2002: First snuscompetitor; Gustavus
1999: Swedish Match sells off the cigarettes
2007-2008 170% tax increase
Cigarettes
Snus
2009
Source: Swedish Match
Sale of snus and cigarettes in Sweden

4343
SM/STG – pro forma
SM 2009 Approximate pro forma 20093)
(MEUR) SM1) SM1)
excl. BD -
approximate
BD STG COMB.
Sales2) 1,337 970 370 320 690
EBIT 322 270 60 50 110
EBITA 333 280 60 60 120
EBITDA 366 300 70 70 140
Operating capital 825 310
1) Amounts exclude Swedish Match South African operations, which were divested in September 2009
2) Swedish Match internal sales to the Business to be Divested (BD) have been eliminated in the sales numbers for Swedish Match (SM), but are included in the sales for Swedish Match excluding the businesses to be divested (SM excl. BD)
3) Normalized numbers, rounded to nearest 10 MEUR


