Download - Investment Opportunity Study

Project Description Report (In conjunction with Main Report)
Department of Industry
Ministry of Economic Affairs
Investment Opportunity Study
2020

Consulting Assignment Background This study titled “Investment Opportunity in Bhutan” was carried out by APECS Consultancy. The assignment was
awarded vide work order No. MoEA/DoI/IDD-13(a)/2019-2020/669 dated 27th January 2020. The assignment was for a
period of 5 months.
Consulting Team
Rohit Adhikari, Team Leader
Novin Darlami, Policy Expert
HN Adhikari, Quality Infrastructure Expert
BN Bhattarai, Supply/Value Chain Expert
Bishnulal Gurung, Financial Expert
Sangay Gyeltshen, GIS and Data Management Expert
Tandin Dorji, Business Analyst
Tashi Dorji, Editor
Official Counterpart and Technical Reviewer/Adviser:
Copyright
Industrial Development Division, Department of Industry, MoEA.
Suggested Citation
Department of Industry (2020). Investment Opportunity Study Bhutan 2020. Thimphu, Bhutan.
Disclaimer
Various statements contained in this document, including those that express a belief, expectation or intention, as well
as those that are not statements of historical fact, are forward-looking statements. The forward-looking statements
have been based on the current expectations and assumptions about future events. These assumptions include,
among others, analysis of operating industries, resources inventory, market trends and demand, investment
opportunities, financial projections.
While it is considered that these expectations and assumptions to be reasonably true, they are inherently subject to
significant business, economic, competitive, regulatory and other risks, contingencies and uncertainties, most of which
are difficult to predict and the actual results with regard to investment opportunities could differ.
This information is not offered as legal or any other advice on any particular matter. The Department and contributing
authors expressly disclaim all liability to any person in respect of anything, and in respect of the consequences of
anything, done or omitted to be done wholly or partly in reliance upon the whole or any part of the contents. No
reader should act or refrain from acting on the basis of any matter contained in this report without first seeking the
appropriate legal or other professional advice on the particular facts and circumstances.
Tashi Dorji (Mr.)
Chief Industries Officer
Dakpa Gyeltsen (Mr.)
Senior Industries Officer
Industrial Development Division
Department of Industry, MoEA

Page | i
Preface
Industrial development is key for
expansion of the economy, creation of
employment opportunities, value addition
to resources and revenue generation
among others. Towards promoting
industrial development, relevant policies
have been realigned and specific programs
such as CSI Flagship Development Program
and development of business infrastructure
are being taken up. To complement the
various programmes that are being
undertaken to foster economic
diversification, the current study was
proposed.
Considering the current
availability of resources and the business
development environment in the country,
this study had become imperative. Further,
the investment opportunities have
considerably changed over the period of
time due to advancement in technology,
methods of production and availability of
resources. This study takes stock of the
resources, assesses business potential and
identifies project ideas to stimulate
investment in the country.
The study is expected to provide
comprehensive information on business
opportunities in the country with the aim to
guide and encourage prospective investors
to take up business activities. The study
contains list of potential activities that
investors could further explore and take up.
The findings of the study will also serve as
a basis for policy recommendations to
promote industrial development.
Jiten Bansal
Retrieved from:
https://www.tripoto.com/trip/my-solo-trek-to-tiger-s-nest-or-paro-taktsang-5965efd268442

Investment Opportunity Study 2020
Page | ii
Acknowledgements
APECS Consultancy would like to
thank the Department of Industry for selecting
the firm to carry out this study. The firm thanks
the Director General, Officiating Director
General, the Specialist of DoI, industry officers
from Industrial Planning and Coordination
Division, Company Registration Division,
Foreign Direct Investment Division, Industrial
Infrastructure Development Division and
Environment Unit for their valuable comments
and suggestions. Further, the Chief Industries
Officer and Project Focal from the executing
agency, the Industrial Development Division,
continuously rendered their support in
procuring relevant data, facilitating meetings
and reviewing the reports; the firm is very
thankful for their support.
The consulting team is also grateful
for all the inputs received from various
business establishments as well as other
government and non-government agencies
who provided us their valuable time, shared
expert opinion and knowledge on investment
climate and opportunities in the country.

Page | iii
Abbreviations
Abbreviation Definition
ADB Asian Development Bank
ADO Asian Development Outlook
BCAA Bhutan Civil Aviation Authority
BDBL Bhutan Development Bank Limited
BHU Basic Health Unit
BICMA Bhutan InfoComm and Media Authority
BLDCL Bhutan Livestock Development Corporation Limited
BTBP Bhutan Telecommunications and Broadband Policy
CBR Crude Birth Rate
CF Community Forest
CFT Cubic Feet
COTI Countries Other Than India
CSI Cottage and Small Industries
CSO Civil Society Organization
DCCL Dungsam Cement Corporation Limited
DGPC Druk Green Power Corporation
DOAT Department of Air Transport
DoFPS Department of Forest and Park Services
EA Economic Activity
ECCD Early Childhood Care and Development
EDP Economic Development Policy
FAO Food and Agriculture Organization
FDI Foreign Direct Investment
FMU Forest Management Unit
FTA Free Trade Agreement
FYP Five Year Plan
G2C Government to Citizen
GDP Gross Domestic Product
GNHCS Gross National Happiness Commission Secretariat
GST Goods and Service Tax
HEP Hydro Electric Plant
HSS Higher Secondary School
ICT Information and Communication Technology
IOS Investment Opportunity Study
ISIC International Standard for Industrial Classification
ISP Internet Service Provider
ITC International Trade Centre
JDWNRH Jigme Dorji Wangchuck National Referral Hospital
KG Kilogram
LDC Least Developed Country
LSS Lower Secondary School
LULC Land Use and Land Cover
M&L Medium and Large
MoAF Ministry of Agriculture and Forest
MoEA Ministry of Economic Affairs
MoH Ministry of Health
MSE Micro and Small Enterprise
MSO Multi-Service Operator

Investment Opportunity Study 2020
Page | iv
Abbreviation Definition
MSS Middle Secondary School
M2 Metre Square
MT Metric Tones
NEC National Environment Commission
n.e.c. Not Elsewhere Classified
NFI National Forest Inventory
NFIS National Financial Inclusion Strategy
NICS National Industrial Classification System of India
NPL Non-Performing Loans
NPV Net Present Value
NRDCL Natural Resources Development Corporation Limited
NWFP Non-wood Forest Product
P&M Production and Manufacturing
PA Protected Area
PHCB Population Housing and Census of Bhutan
PHPA Punatsangchhu Hydroelectric Project Authority
PNH Primary National Highway
PPP Purchasing Power Parity
PPP Public Private Partnerships
PS Primary School
RGoB Royal Government of Bhutan
RICBL Royal Insurance Corporation of Bhutan Ltd.
RMA Royal Monetary Authority
S&C Small and Cottage
SAARC South Asian Association for Regional Corporation
SDG Sustainable Development Goals
SNH Secondary National Highway
SoE State Owned Enterprise
SWOT Strength, Weakness, Threats and Opportunities
TFR Total Fertility Rate
ToR Terms of Reference
UNCTAD United Nation Conference on Trade and Development
UNESCAP United Nation Economic and Social Commission for Asia and the Pacific
WGI Worldwide Governance Indicators
Page | v
Conversions and Units
Currency
1 USD= 76.1 Ngultrum (June 2020)
1 Pound sterling= 94.17 Ngultrum (June 2020)
1 INR= 1 Ngultrum
Measurements
m= metre
ft. = feet
Sq. m= Square meter
Cu. m= Cubic meter
C. ft= Cubic feet
Sq. ft= Square feet
Kg= kilogram
lbs= Pounds
kw= kilowatt
1 m= 3.28 foot
1 Sq. m= 10.76 Sq. ft
1 Decimal= 435.6 Sq. ft
1 kg= 2.20 lbs

Investment Opportunity Study 2020
Page | vi
Contents
Preface……………………………………………………………………………………………………………………….i
Acknowledgement…………………………………………………………………………………………………….ii
Abbreviation……………………………………………………………………………………………………………..iii
Conversion and Units………………………………………………………………………………………………..v
Executive Summary…………………………………………………………………………………………………..vii
Methodology…………………………………………………………………………………………………………….ix
1. Manufacturing of Beauty Care Products ............................................................................... 3
2. Manufacturing of Mouth freshener ....................................................................................... 27
3. Manufacturing of Essential Oil ................................................................................................ 54
4. Manufacturing of Gypsum Board/Panel .............................................................................. 81
5. Manufacturing of Chewing Gum ......................................................................................... 104
6. Manufacturing of Corrugated Paper Board Containers ............................................. 112
7. Manufacturing of Bamboo Toothpick and Ear Buds .................................................... 120
8. Manufacturing of Bio-Liquid and Talc Based Fertilizers ............................................. 128
9. Manufacturing of Prefabricated Wooden Building Components............................ 139
10. Manufacturing of Packaging Aluminium Foil .............................................................. 149
11. Hydroponic Farming ……………………………………………………………………………………….156
12. High Tech Geophysical and Mining Exploration Services ……………………………….179
13. Multi-product Kiosks Services………………………………………………………………………. .209
14. Car Detailing and Resell…………………………………………………………………………………...227
15. Financial Consulting for Investments and Market Research ……………………………236
16. Domestic Tourism Company…………………………………………………………………………….243
17. Outdoor Sporting Organizer…………………………………………………………………………….253
18. Childcare Agency for Children under 3 years……………………………………………………258
19. Branding and Marketing Intermediary Services………………………………………………..268

Page | vii
Executive Summary This report is on Investment Opportunity Study for Bhutan. The study comprises of
analysing the existing economic activities and business establishments, reviewing
available resources in the country under various domains, assessing the 12th Five Year
Plan to incorporate major new developments, identifying the surplus resources for
utilization, analysing accessibility for resources, identification of possible opportunities
under various sub-sectors and in different parts of the country and providing a list of
potential industries under manufacturing and service sectors.
Rationale for the Assignment
The current assignment is an offspring of the statements from the Economic
Development Policy 2016. Few relevant clauses of the Policy are outlined below:
7.3.1 The MoEA shall continue to create an enabling environment by
adopting policies and regulations for promotion of investments in the
country.
7.3.18 National Resource Inventories shall be updated periodically beginning
from 2018 and made available to prospective entrepreneurs to enable
identification of areas of opportunities for investment.
7.3.19 The MoEA shall identify scope of subcontracting/outsourcing
opportunities by large and medium industries to small and cottage
industries and initiate such business linkages and partnerships by 2018.
Objective
The objective of the study is to review national resources and prepare a report on
investment opportunities in the country.
Due to technical issues with regard to report binding, the consultants had to print the
report as two documents. This second document, titled ‘Project Descriptions’ and
contains descriptions of potential investment ideas under Production &
Manufacturing, and Service sector. The background and rationale, market outlook,
equipment and resources requirements, and financial analysis are presented for the
projects.
The first document, titled ‘Main Report’ is to be read in conjunction with this report. It
contains the following Chapters:
Chapter 1: The first chapter describes Bhutan with regard to geography, population,
economy and trade. It is a brief introduction to set the context for this report.
Chapter 2: This chapter describes the operating business establishments in Bhutan as
of March 2020. Based on the data obtained from Department of Industry and
Department of Cottage and Small Industry, a detailed analysis based on the investment
size and classification as per International Standard for Industrial Classification (ISIC)

Investment Opportunity Study 2020
Page | viii
version 3.1 has been prepared. Apart from the description on these two categories, a
separate compendium of all the 280 economic activities Bhutanese establishments are
currently engaged in has also been prepared as a stand-alone document.
Chapter 3: This chapter describes the resources available in Bhutan under the various
topic of Agriculture, Horticulture, Livestock, Forest based products, Minerals,
Education, Health and other infrastructure. Wherever applicable, forecasts have been
made on the growth considering the projections made in the 12th Five Year Plan
document. For resources that were not covered in the document, projection is based
on historical data.
Chapter 4: This chapter is in continuation to the resource inventory and analyses the
availability, consumption and surplus with review of 12th Five Year Plan and salient
features that could result in enhanced connectivity, accessibility and production.
Chapter 5: This chapter presents a detailed Strength, Weakness, Threats and
Opportunities (SWOT) analysis of Bhutan in relation to investment climate and
resources. Comparisons have been made with SAARC countries, lower-middle income
countries and land locked lower middle-income countries where applicable.
Chapter 6: This chapter encompasses the review of relevant policies that impacts
trade and investment in the country to identify possible conflicts and gaps that could
affect investors’ confidence. Recommendations are provided along with the review.
Chapter 7: This chapter assesses investment opportunities under ten sectors of Agro,
Forest, Mineral, ICT and other professional services, Hospitality, Education and Health,
Transport and Logistics, Construction, Finance and Insurance and Energy. The
investment ideas are also accompanied by recommended Dzongkhags for its
establishment.
An action plan for preparation of detailed project reports for these ideas is also
attached.

Page | ix
Methodology In economics literature, there is no universally accepted methodology or tool to be
used for a study of this nature and scope. At the heart of it, it is a scoping study: a
method used to comprehensively map evidence across a range of study designs in an
area, with the aim of informing future research practice, programs and policy.
Several authors such as Myers (1977), Smith and Watts refer investment opportunity
set (or IOS) as the component of firm value resulting from options to make future
investments. Typically, the study on a particular investment opportunity is carried out
by firms for product or the firm diversification while this study has been carried out at
a larger scale i.e. at a national level and information has been considered accordingly.
This study employed reference from various sources of similar nature in order to select
the most appropriate methodology some of which are mentioned in table below:
Sl.
No
Title Country Author Retrieved from
1. Investment
Opportunity Study
Bhutan 2006
Bhutan Ministry of Economic
Affairs, RGoB
https://www.moea.gov.bt/wp-
content/uploads/2017/07/Ch
apters-C-F_Vol_I.pdf
2. Understanding the
Investment Potential
of the Bangladesh
Diaspora
Bangladesh Commonwealth
Secretariat, UK
https://thecommonwealth.org
/sites/default/files/inline/Und
erstanding%20the%20Invest
ment%20Potential%20of%20t
he%20Bangladesh%20Diaspo
ra.pdf
3. Climate Investment
Opportunities in
Cities - 2018
East Asia and the Pacific,
South Asia, Europe and
Central Asia, Middle East
and North Africa, Sub-
Saharan Africa, and Latin
America and the
Caribbean
International Finance
Corporation
http://www.njtod.org/climate-
investment-opportunities-in-
cities/
4. Investment Climate
Assessment
Bhutan World Bank http://siteresources.worldban
k.org/BHUTANEXTN/Resourc
es/306148-
1288813971336/BhutanICAVo
lume1.pdf
5. Investment Guide
Study
Bhutan UNCTAD https://theiguides.org/guides
/bhutan.pdf
6. Investment
opportunity study for
Ethiopia, Kenya,
Mozambique and
Zambia
Ethiopia, Kenya,
Mozambique and Zambia
International Trade
Centre (ITC)
http://www.intracen.org/uplo
adedFiles/intracenorg/Conten
t/Redesign/Projects/PIGA/PIG
A_Investment%20opportunity
%20study_final.pdf
7. Nepal: Market Study
Identifying Foreign
Direct Investment
Opportunities in
Nepal
Nepal Ministry of Foreign
Affairs, The
Netherlands
https://www.rvo.nl/sites/defa
ult/files/2018/10/Nepal-
Market-Study.pdf

Investment Opportunity Study 2020
Page | x
Framework
This study employs a methodology of desk research and field surveys. The desk
research was carried out through review and analysis of the data from published
sources and government database. After thorough research and preliminary
assessment of key areas for investment exploration, further data collection employing
a mix of the quantitative and qualitative questions was used to interview relevant
government, corporate, autonomous, CSOs and private organisations.
Understanding Bhutan’s
Economy
Baseline Study of
Operating Industries
Based on Economic
Activity Based on Scale
Resources Inventory
Agriculture
Livestock
Horticulture
Non-Wood Forest
Products
Education
ICT, Transportation
Health
Human Resources
Minerals
Review of 12th
FYP
Acc
ou
nti
ng
fo
r C
han
ges
Identification of Investment
Opportunities
For Cottage and Small-
Scale Investment
For Medium and Large-
Scale Investment
Overall Longlist based
on Economic Sector
Synopsis Detailed Project Profiles
Policy Recommendations
to foster Investments
Page | xi
The report makes inferences through SWOT matrix for Bhutan. Along with this, a
compendium of the available resources inventory was documented. The third aspect
was listing specific business avenues which was also considered based on the global
and regional demand and forecasts, existing business climate and resources. Using the
multi criteria decision analysis (MCDA) technique, economic activities were selected
for detailed study.
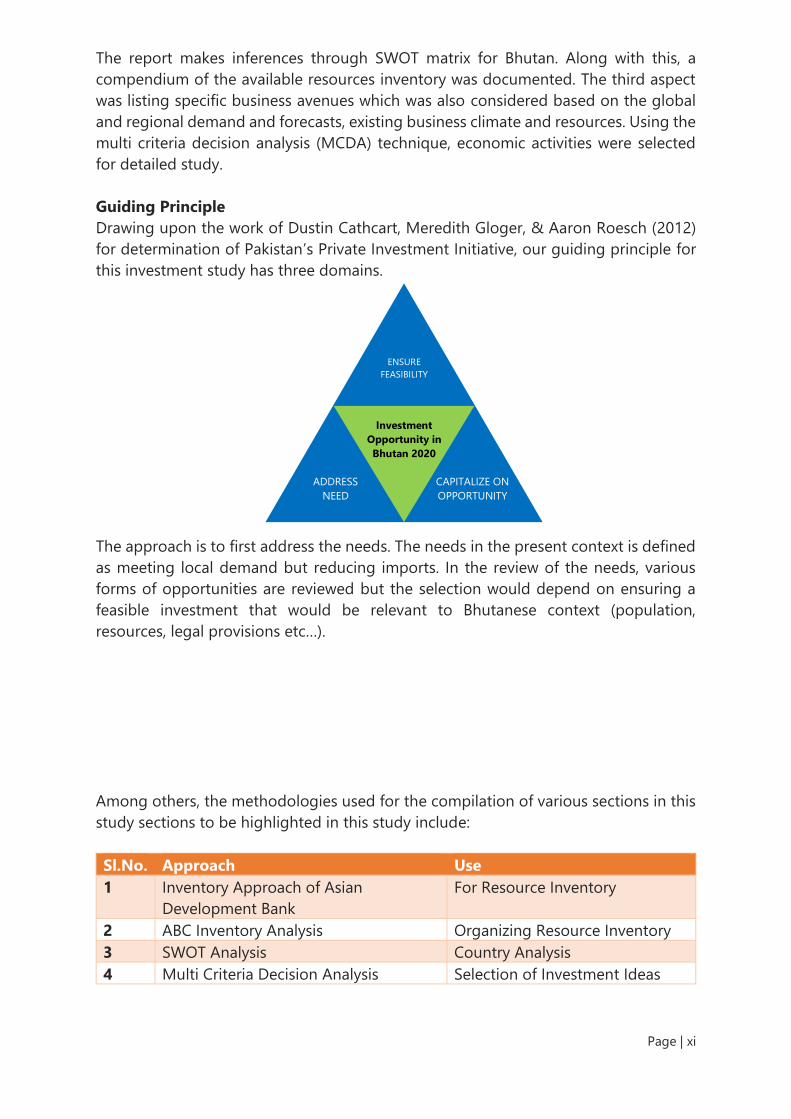
Guiding Principle
Drawing upon the work of Dustin Cathcart, Meredith Gloger, & Aaron Roesch (2012)
for determination of Pakistan’s Private Investment Initiative, our guiding principle for
this investment study has three domains.
The approach is to first address the needs. The needs in the present context is defined
as meeting local demand but reducing imports. In the review of the needs, various
forms of opportunities are reviewed but the selection would depend on ensuring a
feasible investment that would be relevant to Bhutanese context (population,
resources, legal provisions etc…).
Among others, the methodologies used for the compilation of various sections in this
study sections to be highlighted in this study include:
Sl.No. Approach Use
1 Inventory Approach of Asian
Development Bank
For Resource Inventory
2 ABC Inventory Analysis Organizing Resource Inventory
3 SWOT Analysis Country Analysis
4 Multi Criteria Decision Analysis Selection of Investment Ideas
Investment
Opportunity in
Bhutan 2020
ENSURE
FEASIBILITY
ADDRESS
NEED
CAPITALIZE ON
OPPORTUNITY

Investment Opportunity Study 2020
Page | xii
Methodology for investment selection
This approach is developed to systematically select the investment opportunities in a
rationalized manner and employs MCDA at two levels;
• Long-Listing
• Short-Listing
Identification of Economic Activities
Overall, the list of industries is selected from the following sources:
i. List of economic activities mentioned in the National Industrial Classification
System 2008 of India.
ii. Current operational economic activities with less than 5 establishments.
iii. Potential economic activities based on consultant’s knowledge.
iv. Government reports describing economic activities that could substitute
imports.
v. List of top 50 products imported in the country.
Long listing of Economic Activities
The identified economic activities are longlisted based on five criteria as mentioned
below:
i. Relevance to Bhutan: economic activities such as tobacco or drug related
items or complex ideas such as manufacture of aircraft are discarded based
on its irrelevance to Bhutan.
ii. Environmental Friendliness: economic activities that could endanger the
ecology have been discarded in line with Bhutan’s stand for environmental
conservation.
iii. Market Potential: overall ease of marketability of the product at regional and
international market is considered instead of limiting it only to Bhutan.

Page | xiii
iv. Resource Availability: overall ease of purchase of raw material from India
and Bangladesh is also considered along with resource availability within
Bhutan
v. Employment Generation: ideas offering limited or single employment are
discarded.
Rejection Criteria: any economic activity that does not score a full five point is rejected.
Grouping into Sectors
The longlisted ideas are grouped under ten sectors (shown in Table 1) which can be
explored by individuals who may find specific and relevant opportunities for
consideration in the future.
Table 1: Grouping of longlisted economic activities
Production and
Manufacturing
Services Trade
Agro Agro Agro
Forest Forest Forest
Mineral Mineral Mineral
Information Communication
and Technology and
Information
Technology
Information Technology
Hospitality Sector Hospitality Sector Hospitality Sector
Construction Construction Construction
Education and Health Education and Health Education and Health
Finance and Insurance Finance and Insurance Finance and Insurance
Energy Energy Energy
Transport and Logistics Transport and Logistics Transport and Logistics
The above list is also characterized based on the Dzongkhag where it is most
applicable.
Shortlisting of Economic Activities
Shortlisting of economic activities for recommendation was carried out based on the
following criteria: return on investment, market size, main market, new
product/services (value), economic diversification, energy intensive, domestically
available resources, cost of imported raw material, time taken to operationalise, import
substitution, sensitivity of policies and regulations.
Each criterion was scored using a Likert scale of 1-5 with 5 indicating the most
favourable terms with regard to that criteria. The top twenty activities scoring the
highest was chosen for recommendation.

Manufacturing Sectors

Page | 2
Project Title: Manufacturing of
Beauty Care Products
(Soaps, Shampoo and Allied Products)

Investment Opportunity Study 2020 Project Profile-Manufacture of Mouth fresheners
Page | 3
1. Manufacturing of Beauty Care Products
1.1. Background of the Idea The demand for organic cosmetic products is strong. The global natural cosmetics
market size is expected to reach a value of USD 48.04 billion by 2025, increasing by
5.01% from 2019 to 2025, according to a recent report published by Grand View
Research.
A product is considered "natural" when it contains ingredients that are sourced from
nature rather than created synthetically. Given that Brand Bhutan is associated with
organic culture, manufacturing and exporting of organic soaps is quite promising.
1.2. Rationale of the Idea
1.2.1. Local Demand
The beauty care products currently in the market is largely synthetic based. The
imports have been consistent over the past five years accounting to almost Nu 350
million.
Table_ 1: Beauty Care Products Average Import Trends in Bhutan
Items Average Import
in 4 years (Nu. Millions)
Soaps 140
Other agents for washing skin 33
Organic surface-active agents (other than soap) 144
Shampoos 31
Personal Hair and Skin Care 10
Figure_ 1: Import of Beauty Care Products (in Millions)
-
50
100
150
200
2015 2016 2017 2018 2019Soaps
Other agents for washing skin
Organic surface-active agents (other than soap

Investment Opportunity Study 2020 Project Profile-Manufacture of Mouth fresheners
Page | 4
An article in Kuensel covered the story on the successful start-ups manufacturing soaps
in Bhutan1. Firms interviewed expressed the satisfaction with market response to the
products.
However, it must be noted that the cost of production of synthetic products outside
Bhutan is much cheaper owing to economies of scale. Therefore, this business idea
considers only offsetting products worth Nu. 20 million annually.
1.2.2. Export Demand
Bhutan has been making a good progress in the export market with regard to soap.
Exports in the past few years have been increasing at 50% each year. Almost all of the
export is to Germany.
Figure_ 2: Export of Soaps from Bhutan
A research by Centre for the Promotion of Imports mentions of the following key
points:
• European imports of soap increased from €1.4 billion in 2012 to €1.6 billion in
2016. This resulted in an average annual growth rate of 3.8%.
• In the coming years, European imports are expected to keep growing
moderately.
• Developing countries supply around 14% of European soap imports amounting
to €231 million. This share is predicted to be fairly stable in the coming years.
• Germany is Europe’s leading importer of soap by far with €248 million in 2016.
France (€222 million) and the United Kingdom (€203 million) follow.
• When it comes to imports from developing countries, the United Kingdom leads
with €68 million. This is one third of its total soap imports.
• The strong performance of developing country soap suppliers in the United
Kingdom is evidenced further by a €14 million increase between 2012 and 2016.
1 https://kuenselonline.com/handmade-soaps-find-market-in-the-country/
1.46
41.47
60.28
86.30
-
20
40
60
80
100
2015 2016 2017 2018
India COTI

Investment Opportunity Study 2020 Project Profile-Manufacture of Mouth fresheners
Page | 5
Figure_ 3: European Imports of Soaps in £ million
Source 1: Centre for the Promotion of Imports, Netherlands Enterprise Agency
For this business idea, the net import from Bhutan is considered as 1% of the total
import which makes around Nu. 230 million. Assuming a market share of 10% by one
firm, it accounts to Nu. 23 million.
1.2.3. Market Outlook International2
Skincare maintains the top billing in the global organic beauty market and is expected
to emerge as the most attractive segment, closely followed by haircare. This means
that natural and organic skincare, combined with organic haircare, will form half of the
total global organic beauty market3.
The Global Organic Soap market is projected to register a CAGR of 7.2% over the
forecast period (2020-2025).
• The growing concerns regarding the impact of synthetic ingredients such
as parabens and sulphates in synthetic soaps are driving the market for organic
soap.
• Furthermore, awareness towards a sustainable environment, by reducing the
impact of chemicals coupled with the government initiatives to support organic
products are also fuelling the market growth.
1.3. The Concept The strategy to penetrate the beauty products market suggested to offer multiple
products to customers under one brand name to leverage Brand Bhutan. To follow this
2 Information from: https://www.mordorintelligence.com/industry-reports/organic-soap-market and
https://www.statista.com/statistics/673641/global-market-value-for-natural-cosmetics/ 3 https://formulabotanica.com/global-organic-beauty-market-22bn-2024/

Investment Opportunity Study 2020 Project Profile-Manufacture of Mouth fresheners
Page | 6
concept, multiple products manufacturing is suggested which can be started from
making soap and shampoo.
The product group is as follows:
• Herbal and Organic Bathing Soap: 10g, 20gm, 50gm, 75gm, 100gm, 125gm
• Herbal Hair Shampoo: Pouch 5-10 ml, 30ml, 50ml, 100ml, 150ml, 200ml, 400ml
• Body Wash Lotion: 50ml, 100ml, 200ml, 400ml, 1lt
• Skin Moisturizer Cream: 50ml, 100ml, 200ml, 400ml, 1lt
• Hair Conditioners: 20ml, 50ml, 100ml, 150ml, 200ml
• Hair Cream: 50ml and 100ml
1.3.1. Perceptual Mapping
In comparison to the price of a natural organic ingredient-based soap, the price is 5
times higher in the UK. For example, a 100g bar of Bio Soap costs Nu. 1104, a similar
product (based on packaging and ingredients) costs Nu. 512 in the UK5. This provides
an excellent opportunity for Bhutanese products to find a place in the European export
market.
Figure_ 4: Price Changes over the Period (Nu./Kg)
When comparing within the local market, there is stiff competition from imported
products which has been about Nu. 100 per kg, making the price as low as Nu. 10 for
100g. Therefore, this business idea must seek to find a niche market in Bhutan and
concentrate largely on the export market. A Representation of Concept Planning and
Basis is given in figure no. 5 below:
4 https://druksell.bt/search?type=article%2Cpage%2Cproduct&q=soap* 5 https://www.amazon.co.uk/s?k=ginger+soap&ref=nb_sb_noss
0
100
200
300
400
500
600
700
2015 2016 2017 2018 2019
Soap Shampoo Deodrants
Investment Opportunity Study 2020 Project Profile-Manufacture of Mouth fresheners
Page | 7
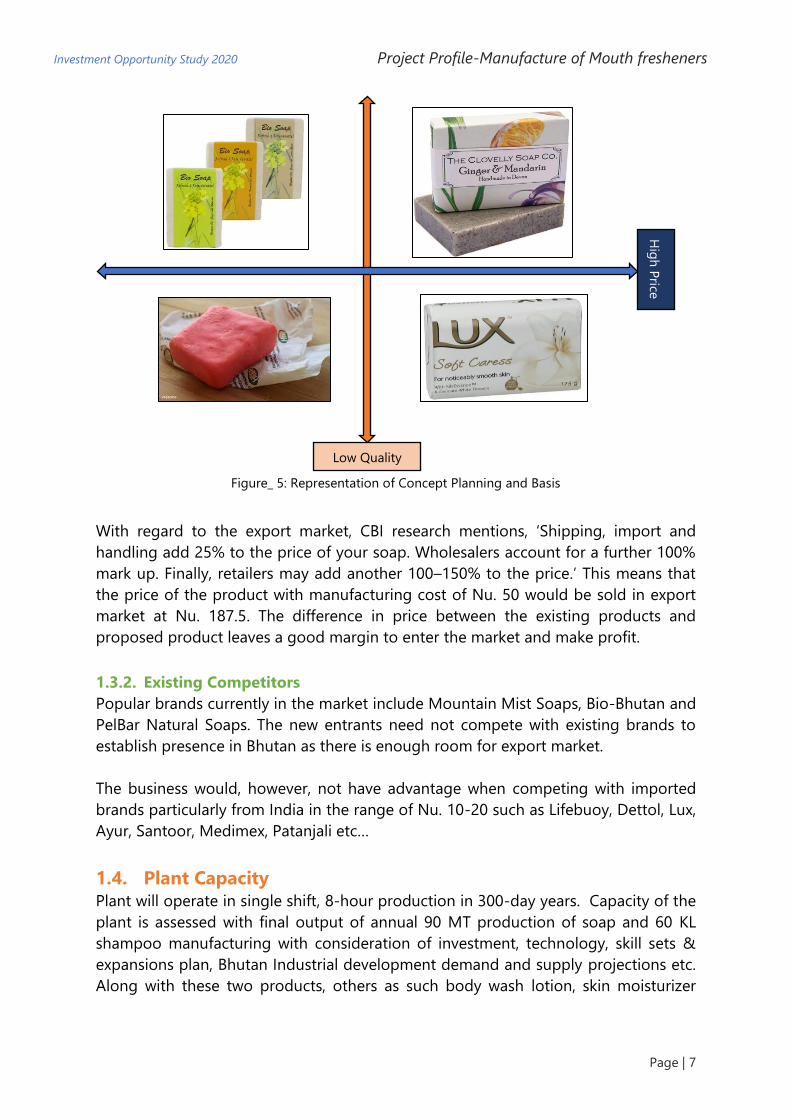
Figure_ 5: Representation of Concept Planning and Basis
With regard to the export market, CBI research mentions, ‘Shipping, import and
handling add 25% to the price of your soap. Wholesalers account for a further 100%
mark up. Finally, retailers may add another 100–150% to the price.’ This means that
the price of the product with manufacturing cost of Nu. 50 would be sold in export
market at Nu. 187.5. The difference in price between the existing products and
proposed product leaves a good margin to enter the market and make profit.
1.3.2. Existing Competitors
Popular brands currently in the market include Mountain Mist Soaps, Bio-Bhutan and
PelBar Natural Soaps. The new entrants need not compete with existing brands to
establish presence in Bhutan as there is enough room for export market.
The business would, however, not have advantage when competing with imported
brands particularly from India in the range of Nu. 10-20 such as Lifebuoy, Dettol, Lux,
Ayur, Santoor, Medimex, Patanjali etc…
1.4. Plant Capacity Plant will operate in single shift, 8-hour production in 300-day years. Capacity of the
plant is assessed with final output of annual 90 MT production of soap and 60 KL
shampoo manufacturing with consideration of investment, technology, skill sets &
expansions plan, Bhutan Industrial development demand and supply projections etc.
Along with these two products, others as such body wash lotion, skin moisturizer
Hig
h P
rice
Low Quality

Investment Opportunity Study 2020 Project Profile-Manufacture of Mouth fresheners
Page | 8
cream, hair conditioners and hair cream will also be produced in the proposed plant.
The detail plant capacity planning is as follows given below:
# Product Plant Capacity Annual Capacity
(MT)
1. Premium Quality Herbal Soap 100Kg per Hr. 90 MT
2. Shampoo 100 Lt per Hr. 60 KL
3. Body Wash Lotion 100 Lt per Hr. 30 KL
4. Skin Moisturizer Cream 50Lt. per Hr. 20 KL
5. Hair Conditioners 50Lt. per Hr. 20 KL
6. Hair Cream 50Lt. per Hr. 20 KL
Table 2: Plant Capacity and Planning
1.5. Manufacturing Process
1.5.1. Soap Manufacturing6
Glycerine is a humectant meaning that it helps retain, or reduce the loss of moisture.
The manufacturing of soap consists preparation of herbs, mixing with glycerine, and
coconut oil with pure potassium hydroxide. After that heating and shaping is done in
moulds. Cooling is done after moulding and soaps are ready for finally sizing and
packaging. The raw ingredients are herbal fats, herbal oils and their fatty acids, soluble
olive oil and cocoa oils, palm, coconut oil, kernel oils etc. Manufacturing process for
soap production is detailed in figure no.5 given below:
The soap manufacturing process follows the following steps:
6 https://www.diynatural.com/how-to-make-glycerin-soap-base-recipe/

Investment Opportunity Study 2020 Project Profile-Manufacture of Mouth fresheners
Page | 9
Step 1: Melt the glycerine
Step 2: Add the herbs (add the minced herbs, citrus zest and two drops of
essential oils (if used) and mixing).
Step 3: Pour the mixture into the mould
Step 4: Cooling, cutting, sizing and packaging
1.5.2. Shampoo Manufacturing7
The ingredients are prepared according the above process. Water is metered into the
process vessel and it is often heated to around 130-140℉ (55-60℃) to aid
dilution/hydration of other ingredients. Conditioners and other ingredients are added.
This solution cooled and packed in PET Bottles.
Figure_ 6: Shampoo Manufacturing Process Flow Chart
Water, surfactants (surface active agents – or cleansing agents), thickeners or viscosity
builders, conditioning agents, foam boosters, preservatives, active ingredients,
fragrance and colour are the main ingredients for shampoo manufacturing.
Body Wash Lotion, Skin Moisturizer Cream, Hair Conditioners and Hair Cream are the
emulsion-based products and mainly mixing, boiling and cooling are the main process
activities. The equipment used for manufacturing these products are mixers, SS vessels
and kettles, filling machines etc. These allied products are also packed in HDPE bottle
shape containers.
7 https://www.slideshare.net/waliseu/shampoo-44457202

Investment Opportunity Study 2020 Project Profile-Manufacture of Mouth fresheners
Page | 10
1.5.3. Equipment Requirement
Equipment used for manufacturing of soap, shampoo and other products mainly
consist of mixtures equipment, SS vessels, and kettles. The required machines and
equipment for this plant can be sourced from Kolkata (West Bengal), Guwahati (Assam)
and Rajkot (Gujarat). The list of equipment suppliers is attached as Annex A.
Some of the required equipment include pre-cleaning machines and mixing
equipment, glycerin soap plant - (MOC SS 316), soap cutting machine – manual,
stamping machine, shampoo making machine (reactor vessel), lotion & cream making
machine, SS vessels and kettles, trays and tanks, soap bar packaging machines,
shampoo/liquid bottle filling machine - bottle manual, body lotion filling and
packaging machine, shampoo pouch filling machine and bottle cap sealing machine,
weighing machine, conveyors and packaging machine etc.
1.5.4. Required Systems and Licenses
• Land requirement: about 1,000 m2 and built up area of about 465 m2 for
production hall, storage, packaging, office and utilities.
• Manpower of 25 people including:
▪ Manager
▪ Accounts and Administration,
▪ Advertising and Marketing
▪ Quality assurance and Lab In-charge
▪ 12 factory front line workers
▪ Support staff (on contract basis)
1.6. Required Licenses and Certification
Table_ 2: Required Licenses and Certification
Quality Management ISO 9001:2015
Environment Management ISO 14001
GMP Certification for Export Good Manufacturing Practice
Products Cover in Indian Act Drugs and Cosmetics Act by the Act 68 of
1982 - 1983
BIS Number – India IS 7669, BIS IS 2888: 2004(R2016)
Bhutan Approval Environment Clearance and Other
Regulatory Act Registration and Certificates
Export Requirement to US & Europe WHO- GMP (Good manufacturing practices)
Export – Import Duty to India Trade between India and Bhutan is not
subject to customs duties
The proposed business idea is based on providing a range of beauty care products.
More details on the process can be found from the following sources and videos for
better understanding.

Investment Opportunity Study 2020 Project Profile-Manufacture of Mouth fresheners
Page | 11
Reading Materials Videos
https://www.diynatural.com/how-to-make-
glycerin-soap-base-recipe/
https://www.youtube.com/watc
h?v=rPckDJP9GLY
http://www.madehow.com/Volume-2/Soap.html https://www.youtube.com/watc
h?v=qSXbZ52r7IY
https://my.msme.gov.in/MyMsmeMob/MsmePro
jectProfile/Pages/2_6.html
https://www.youtube.com/watc
h?v=lQ6fCZgYc8g
1.7. Estimated Project Cost and Financials The total cost of the project has been considered at Nu. 13.5 million. The payback
period is 21 months. D.S.C.R value is 4.51 which show that the project will generate
sufficient income to pay back loans. Other financial trends are as follows:
Table_ 3: Project Trends and Financial Ratio
# Description Amount (Nu. In Lacs)
1. Plant Capacity ▪ 90 MT for Soap
▪ 150KL Shampoo and Other Items
2. Land Area (On Lease) 1000 m2
3. Proposed Location in Bhutan Thimphu, Samtse, Phuentsholing, and
Gelephu
4. Establishment Cost 134.59
5. Cost of Operation at 100%
capacity utilization
2.1 Fixed Cost 78.22
a. Salary & Wages 57.00
b. Overhead Cost 21.22
6. Variable Costs at 100% capacity
utilization
42.63
a. Raw Material 534.60
b. Other Variable
Cost
34.28
7. Break Even Point 52.83%
8. Payback Period 21 Months
9. D.S.C.R. 4.51
10. NPR 14.24%
11. Return on Investment 44.53%

Investment Opportunity Study 2020 Project Profile-Manufacture of Mouth fresheners
Page | 12
1.8. Means of Finance
Table_ 4: Means of Finance
# Particulars Value (Nu. in Lacs)
1. Promoters Equity 37.21
2. Term Loan from Bank 97.40
Total 134.61
3. Margin Money for Working Capital 28.84
4. Working Capital Loan from Bank 49.82
Total 78.66
1.9. Project Cost The cost of project is estimated as a total value of land, building and civil construction,
plant and machinery, MFA, preliminary expenses, pre-operative expenses and
contingency. The required land is around 1000 m2 on lease for 30 years.
The Plant & Machinery shared maximum project cost of around 41.85% with Nu. 5.6
million followed by Building & Civil Construction cost of Nu. 3.8 million constituting
28.19% of the project cost. Margin Money for working capital is not considered as part
of the project cost.
The summary of the project cost is as follows: Table_ 5: Head Wise Project Cost and Sharing Percentage
# Particulars Value (Nu. in Lacs) Cost
Sharing
1. Building & Civil Construction 37.95 28.19%
2. Plant & Machinery 56.34 41.85%
3. Misc. Fixed Assets 14.75 10.96%
4. Preliminary Expenses 1.00 0.74%
5. Pre-operative Expenses 21.30 15.82%
6. Contingencies 3% 3.27 2.43%
Total 134.61 100%
1.9.1. Estimation of Building and Civil Work and Cost
Based on the requirement of processing area, raw material and finished goods store
and office space, the following building area is planned. The building civil construction
cost is considered as per the Bhutan Schedule of Rates (Civil Works)8 - 2018 - issued
by Ministry of Works and Human Settlement, Bhutan. Pre-fabricated building structure
will be used for construction of building amenities.
8 Source: https://www.mowhs.gov.bt/wp-content/uploads/2018/04/BSR-2018-civil.pdf

Investment Opportunity Study 2020 Project Profile-Manufacture of Mouth fresheners
Page | 13
Total estimated building construction cost is Nu.3.8 million which is around 28% of the
total project cost. The detail Building and Civil Work cost estimation is as follows:
Table_ 6: Estimation of Building and Civil Work and Cost
# Particular Dimensions (Mt.)
Area (Sq. Mt.)
Rate (Nu./ Sq. Mt.)
Amount (Nu. in Lacs)
1. Production area -
main shed height
16 feet (5Mt.)
60 50 3000 750 22.50
2. Raw material
storage
25 18 450 600 2.70
3. Packaging section 20 16 320 600 1.92
4. Finished goods
storage
25 18 450 600 2.70
5. Laboratory 20 15 300 600 1.80
6. Office space 20 15 300 600 1.80
7. Facilities + utility +
canteen
20 18 360 600 2.16
8. Security & time
office
10 10 100 600 0.60
9. Boundary wall (130
RM with height of 3m
(10Ft) and 1ft thickness)
412 1 412 150 0.62
10. Parking area 60 30 1800
0.50
11. Green belt
development and
open space
70 50 3500
0.30
12. Entrance gate - 15
feet wide and sign
board
1 35000 0.35
Total 37.95
Investment Opportunity Study 2020 Project Profile-Manufacture of Mouth fresheners
Page | 14
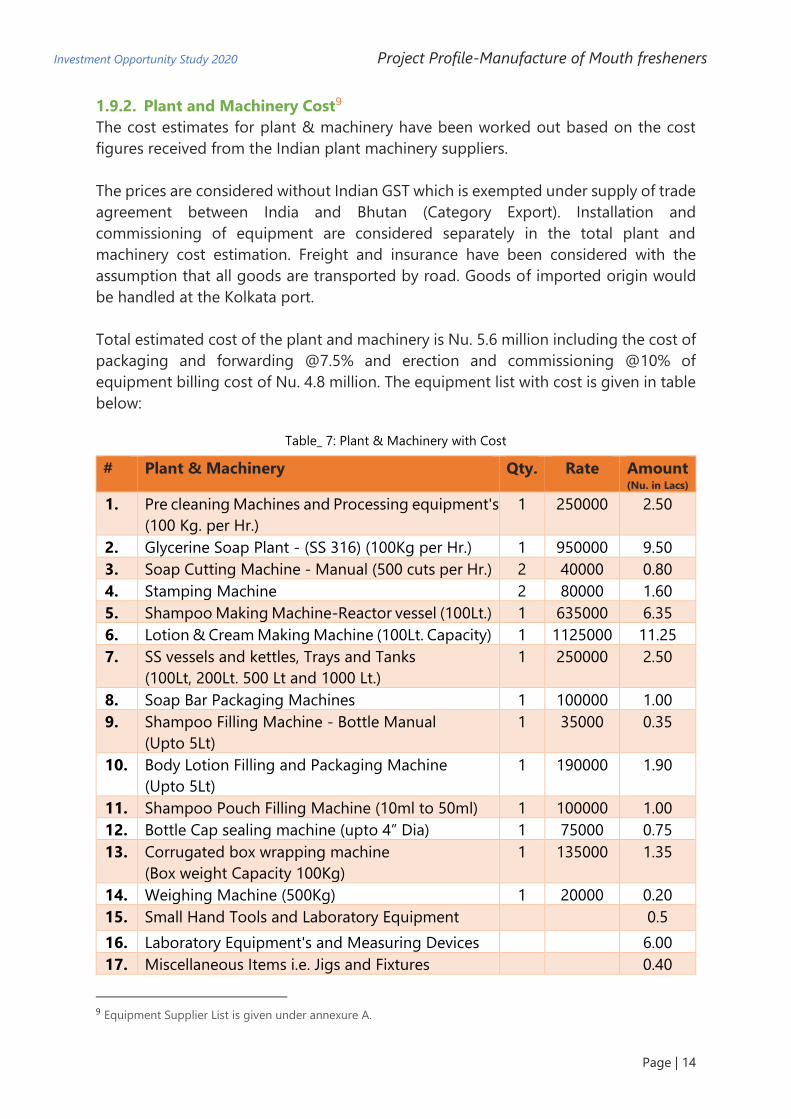
1.9.2. Plant and Machinery Cost9
The cost estimates for plant & machinery have been worked out based on the cost
figures received from the Indian plant machinery suppliers.
The prices are considered without Indian GST which is exempted under supply of trade
agreement between India and Bhutan (Category Export). Installation and
commissioning of equipment are considered separately in the total plant and
machinery cost estimation. Freight and insurance have been considered with the
assumption that all goods are transported by road. Goods of imported origin would
be handled at the Kolkata port.
Total estimated cost of the plant and machinery is Nu. 5.6 million including the cost of
packaging and forwarding @7.5% and erection and commissioning @10% of
equipment billing cost of Nu. 4.8 million. The equipment list with cost is given in table
below:
Table_ 7: Plant & Machinery with Cost
# Plant & Machinery Qty. Rate Amount (Nu. in Lacs)
1. Pre cleaning Machines and Processing equipment's
(100 Kg. per Hr.)
1 250000 2.50
2. Glycerine Soap Plant - (SS 316) (100Kg per Hr.) 1 950000 9.50
3. Soap Cutting Machine - Manual (500 cuts per Hr.) 2 40000 0.80
4. Stamping Machine 2 80000 1.60
5. Shampoo Making Machine-Reactor vessel (100Lt.) 1 635000 6.35
6. Lotion & Cream Making Machine (100Lt. Capacity) 1 1125000 11.25
7. SS vessels and kettles, Trays and Tanks
(100Lt, 200Lt. 500 Lt and 1000 Lt.)
1 250000 2.50
8. Soap Bar Packaging Machines 1 100000 1.00
9. Shampoo Filling Machine - Bottle Manual
(Upto 5Lt)
1 35000 0.35
10. Body Lotion Filling and Packaging Machine
(Upto 5Lt)
1 190000 1.90
11. Shampoo Pouch Filling Machine (10ml to 50ml) 1 100000 1.00
12. Bottle Cap sealing machine (upto 4” Dia) 1 75000 0.75
13. Corrugated box wrapping machine
(Box weight Capacity 100Kg)
1 135000 1.35
14. Weighing Machine (500Kg) 1 20000 0.20
15. Small Hand Tools and Laboratory Equipment 0.5
16. Laboratory Equipment's and Measuring Devices 6.00
17. Miscellaneous Items i.e. Jigs and Fixtures 0.40
9 Equipment Supplier List is given under annexure A.

Investment Opportunity Study 2020 Project Profile-Manufacture of Mouth fresheners
Page | 15
Total 47.95
18. Packaging and Forwarding @7.50% 3.60
19. Erection and Commissioning @10% 4.80
Grand Total 56.34
1.9.3. Misc. Fixed Assets
A miscellaneous fixed asset includes office equipment & furniture, computer and
peripherals, firefighting equipment, vehicle etc. Nu.1.5 million has been estimated
under this head “MFA” and is presented in the below table:
Table_ 8: Misc. Fixed Assets Cost Estimation
# Particulars Qty. Amount (Nu.in lacs)
1. Office Equipment, Laptop, Printer & Software's 1 2.50
2. Furniture & Fixture with Interior Items 1 3.50
3. Fire Fighting Equipment's (1set of 10 pcs each) 1 0.60
4. Ventilation - Exhaust fans 5 0.15
5. Tata Mini Truck 1 8.00
Total 14.75
1.9.4. Preliminary Expenses
Preliminary expenses are those expenses which are incurred before the incorporation
and commencement of the business. This expense is treated as deferred
revenue expenditure. These expenses are marked write off in next ten years in
estimation of profitability.
The Preliminary Expenses details are as follows:
Table_ 9: Preliminary Expenses
# Particular Amount (Nu.in Lacs)
1. Company formation, Approvals and Setup
expenses
1.00
Total 1.05
1.9.5. Pre-operative Expenses
These expenses are incurred prior to commencement of commercial production. A
total of amount Nu. 2.13 million is estimated under this project cost head. It is written
off in the next 10 years and exempted in the first year.
The details are given in the table below:

Investment Opportunity Study 2020 Project Profile-Manufacture of Mouth fresheners
Page | 16
Table_ 10: Pre-operative Expenses
# Particular Amount (Nu.in Lacs)
1. Interest up to production 1.99
2. Insurance during construction period 0.56
3. Electricity charges construction period 1.50
4. Salary during construction period 3.40
5. Marketing launch expenses 2.00
6. Quality, GMP and Environment Management System 5.00
7. Project consultancy fees @5% of project cost 5.45
8. Travelling Expenses for Project Implementation 1.00
9. Registration of Trade Mark and patent 0.40
Total 21.30
1.9.6. Cost of Raw Material
The cost of raw material consists of the cost of the main ingredients, raw material and
cost of packaging. The annual raw material cost is based on the present average
market prices in Bhutan. A total of Nu. 53.46 million has been estimated as raw material
cost. The details are given in the table below:
Table_ 11: Cost of Raw Material
# Raw Material Annual
Requirem
ent
Rate (Nu/Unit )
Total Amount (Nu.in Lacs)
1. Refined Glycerine 73 KL 110 Lt 80.3
2. Coconut oil, fats, olive oil, wax
esters and ester oils, essential
oils etc.
112 KL 140 Lt 156.8
3. Surfactants, Thickeners or
Viscosity Builders,
Conditioning Agents, Foam
Boosters, preservatives, active
ingredients, fragrance and
colour.
25 MT 350 Kg 87.5
4. Herbs Ingredients as such
amla, sweet almond oil, methi,
almonds oil, flowers, Shea,
cocoa, kokum butter etc.
30 MT 600 Lt 180
5. Packaging Material - PP
Sheets, Pouches, HDPE
Bottles, Carton Box,
Packaging's Taps etc.
Set
30
Total Raw Material requirement at 100% capacity Utilisation 534.60
Investment Opportunity Study 2020 Project Profile-Manufacture of Mouth fresheners
Page | 17
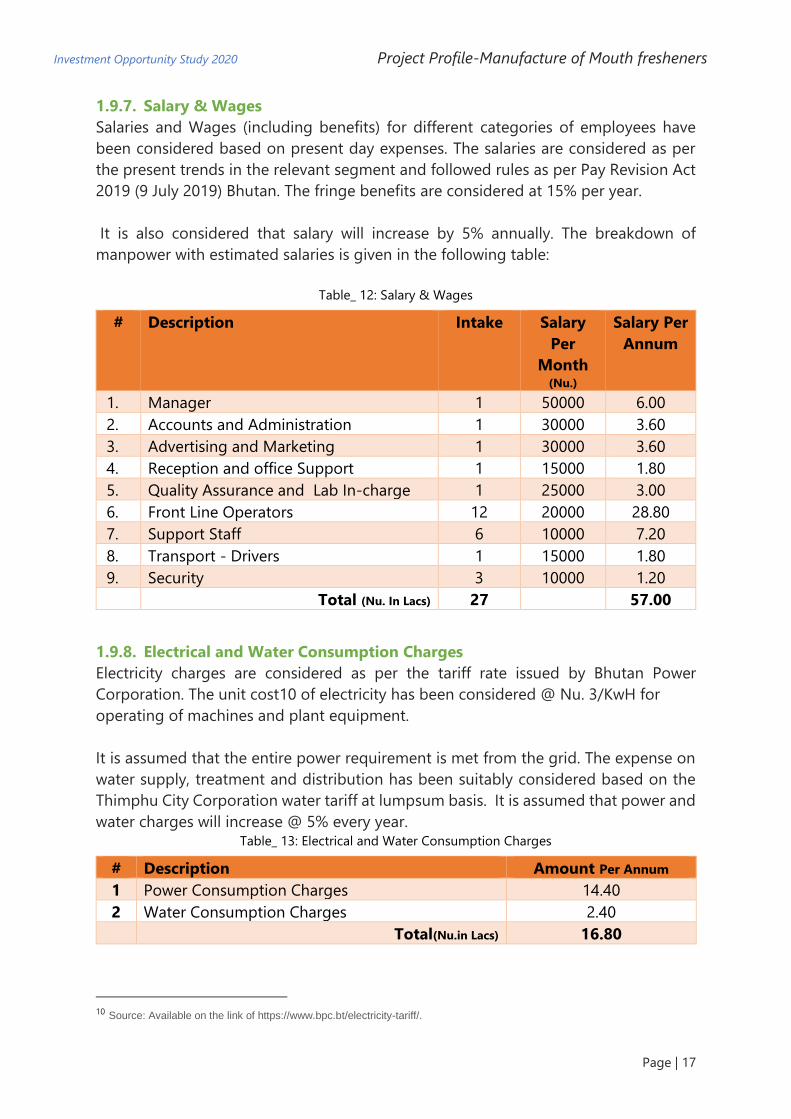
1.9.7. Salary & Wages
Salaries and Wages (including benefits) for different categories of employees have
been considered based on present day expenses. The salaries are considered as per
the present trends in the relevant segment and followed rules as per Pay Revision Act
2019 (9 July 2019) Bhutan. The fringe benefits are considered at 15% per year.
It is also considered that salary will increase by 5% annually. The breakdown of
manpower with estimated salaries is given in the following table:
Table_ 12: Salary & Wages
# Description Intake Salary
Per
Month (Nu.)
Salary Per
Annum
1. Manager 1 50000 6.00
2. Accounts and Administration 1 30000 3.60
3. Advertising and Marketing 1 30000 3.60
4. Reception and office Support 1 15000 1.80
5. Quality Assurance and Lab In-charge 1 25000 3.00
6. Front Line Operators 12 20000 28.80
7. Support Staff 6 10000 7.20
8. Transport - Drivers 1 15000 1.80
9. Security 3 10000 1.20
Total (Nu. In Lacs) 27 57.00
1.9.8. Electrical and Water Consumption Charges
Electricity charges are considered as per the tariff rate issued by Bhutan Power
Corporation. The unit cost10 of electricity has been considered @ Nu. 3/KwH for
operating of machines and plant equipment.
It is assumed that the entire power requirement is met from the grid. The expense on
water supply, treatment and distribution has been suitably considered based on the
Thimphu City Corporation water tariff at lumpsum basis. It is assumed that power and
water charges will increase @ 5% every year. Table_ 13: Electrical and Water Consumption Charges
# Description Amount Per Annum
1 Power Consumption Charges 14.40
2 Water Consumption Charges 2.40
Total(Nu.in Lacs) 16.80
10 Source: Available on the link of https://www.bpc.bt/electricity-tariff/.
Investment Opportunity Study 2020 Project Profile-Manufacture of Mouth fresheners
Page | 18
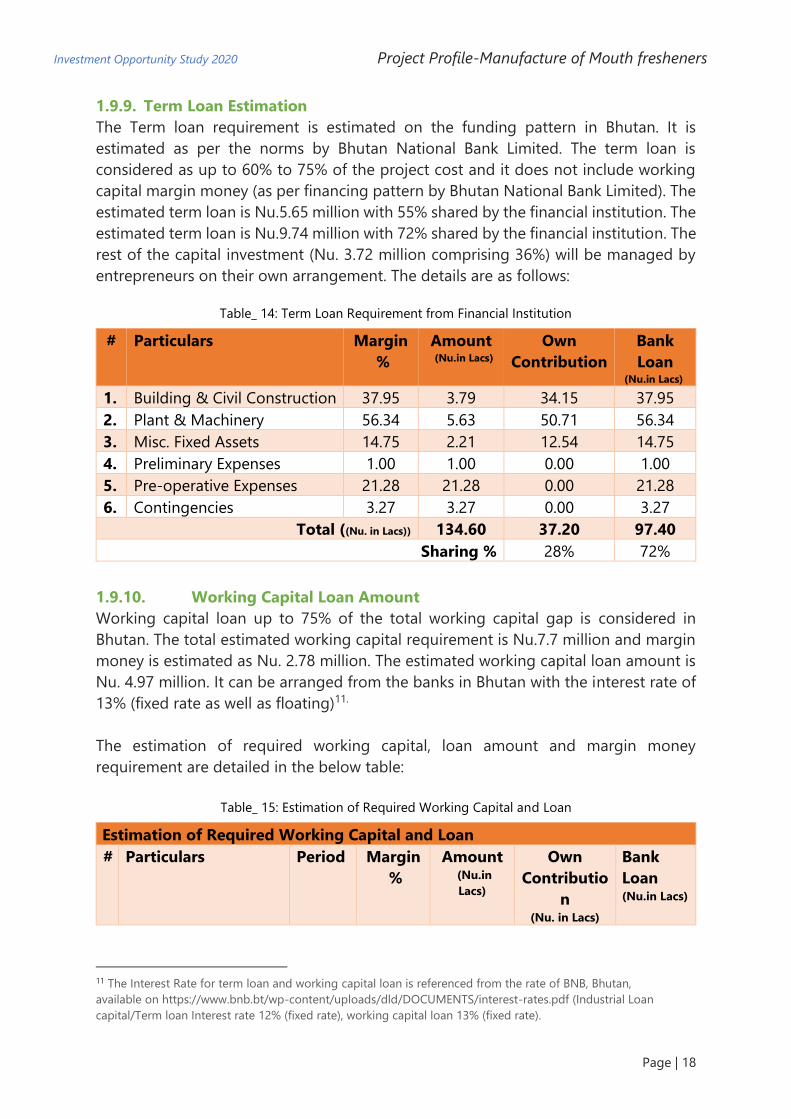
1.9.9. Term Loan Estimation
The Term loan requirement is estimated on the funding pattern in Bhutan. It is
estimated as per the norms by Bhutan National Bank Limited. The term loan is
considered as up to 60% to 75% of the project cost and it does not include working
capital margin money (as per financing pattern by Bhutan National Bank Limited). The
estimated term loan is Nu.5.65 million with 55% shared by the financial institution. The
estimated term loan is Nu.9.74 million with 72% shared by the financial institution. The
rest of the capital investment (Nu. 3.72 million comprising 36%) will be managed by
entrepreneurs on their own arrangement. The details are as follows:
Table_ 14: Term Loan Requirement from Financial Institution
# Particulars Margin
%
Amount (Nu.in Lacs)
Own
Contribution
Bank
Loan (Nu.in Lacs)
1. Building & Civil Construction 37.95 3.79 34.15 37.95
2. Plant & Machinery 56.34 5.63 50.71 56.34
3. Misc. Fixed Assets 14.75 2.21 12.54 14.75
4. Preliminary Expenses 1.00 1.00 0.00 1.00
5. Pre-operative Expenses 21.28 21.28 0.00 21.28
6. Contingencies 3.27 3.27 0.00 3.27
Total ((Nu. in Lacs)) 134.60 37.20 97.40
Sharing % 28% 72%
1.9.10. Working Capital Loan Amount
Working capital loan up to 75% of the total working capital gap is considered in
Bhutan. The total estimated working capital requirement is Nu.7.7 million and margin
money is estimated as Nu. 2.78 million. The estimated working capital loan amount is
Nu. 4.97 million. It can be arranged from the banks in Bhutan with the interest rate of
13% (fixed rate as well as floating)11.
The estimation of required working capital, loan amount and margin money
requirement are detailed in the below table:
Table_ 15: Estimation of Required Working Capital and Loan
Estimation of Required Working Capital and Loan
# Particulars Period Margin
%
Amount (Nu.in
Lacs)
Own
Contributio
n (Nu. in Lacs)
Bank
Loan (Nu.in Lacs)
11 The Interest Rate for term loan and working capital loan is referenced from the rate of BNB, Bhutan,
available on https://www.bnb.bt/wp-content/uploads/dld/DOCUMENTS/interest-rates.pdf (Industrial Loan
capital/Term loan Interest rate 12% (fixed rate), working capital loan 13% (fixed rate).

Investment Opportunity Study 2020 Project Profile-Manufacture of Mouth fresheners
Page | 19
1. Raw Material 15
days
50% 15.40 7.70 7.70
2. Receivable 30
days
25% 55.07 13.77 41.30
3. Cash for Expenses &
Consumables
15days 90% 7.02 6.32 0.70
Net Working Capital Requirement 77.49 27.79 49.70
Margin Money for working Capital Nu. 27.79Lacs
1.9.11. Sales Realisation/Estimated Turnover
Sales Realisation or estimated turnover is based on the sale price at FOB Factory Gate.
The sale price of products is determined as cost competitive with present available
similar product by domestic as well as international supply. The sale price of Premium
Quality Herbal Soap is considered as average 160kg for 10gm to 125gm packing.
The total amount of Nu. 94.4 million is estimated as sales realization (turnover) at 100%
production capacity. The sale price of each item is detailed in the table below with
production capacity:
Table_ 16: Sales Realization/Estimated Turnover
# Product Sale
Quantity
Annual
Rate (Nu. per Unit)
Total Amount
per Annum (Nu. in Lacs )
1. Premium Quality Herbal Soap 90 MT 160 Kg. 144
2. Shampoo 60 KL 350 Lt. 210
3. Body Wash Location 30 KL 700 Lt. 210
4. Skin Moisturizer Cream 20 KL 700 Lt. 140
5. Hair Cream 20 KL 600 Lt. 120
Total 944

Investment Opportunity Study 2020 Project Profile-Manufacture of Mouth fresheners
Page | 20
1.9.12. Estimated Cost of Production and Profitability
As per the above estimated economic parameters, finance can be arranged by sharing
28% by investor and 72% by loan through financial institutions. Working capital mainly
consists of the amount required to purchase raw material. Required margin money for
this project is Nu. 2.72 million. For profitability estimation, analysis of loan repayment
capacity and analysis of financial ratios for this project, the following assumptions and
relevant basis applicable to Bhutan have been considered:
• Industrial land12 in Bhutan is available on lease for up to maximum of 30 years and
could be renewed further. The plots for industrial use are available in the
government developed industrial parks and estates at prominent locations such as
Thimphu, Samtse, Phuentsholing, Gelephu etc. Charges are considered as Nu. 4 per
square feet per annum for the first three years. In the fourth year, the rate is Nu. 6
(i.e. 50% increase). Subsequently, it increases @3% every year.
• The profitability projection has been worked out for 10 years at 70% capacity
utilization to be achieved during the first to the third year and 80% from the fourth
year and 90% from the seventh year and onwards.
• Repair & maintenance have been taken at @1% p.a. on plant & machinery & misc.
fixed assets.
• Bank interest rate13 has been calculated @12% p.a. on term loan & @13% working
capital loan.
• Insurance charges is @ 0.25% on all assets in the first year. Then it is @ 5% decrease
every year.
• Power & water charges are increased @ 5% every year.
• Administrative expenses have been increased @ 5% every year.
• Margin money has been considered @ 40% on building, @ 25% on plant &
machinery and @ 25% on misc. fixed assets.
• Bank loan has been considered for repayment in 7 years with one-year moratorium.
• Preliminary expenditure will be written off every year in the next 10 years.
• Pre-operative expenditure will be written off from the second year.
• Depreciation has been charged on Straight-Line Method.
• Insurance, lease rent & interest has been taken as fixed cost for calculating B.E.P.
• Income tax14 has been charged @ 30% every year as per Bhutan's tax rates.
• DSCR - debt service coverage ratio - is defined as net operating income divided by
total debt service.
12https://www.bhutanenterprise.com/2018/06/03/investment-climate-in-bhutan/#:~:text=Lease%20rate%20for %20Industrial
%20Estate&text=4%20per%20square%20feet%20peri.e%2050%25%20increase%20on%20Nu. 13 The Interest Rate for term loan and working capital loan is referenced from the rate of BNB, Bhutan, available on
https://www.bnb.bt/wp-content/uploads/dld/DOCUMENTS/interest-rates.pdf (Industrial Loan capital/Term loan Interest rate 12%
(fixed rate), working capital loan 13% (fixed rate). 14 Ministry of Finance - https://www.mof.gov.bt/faq/)

Investment Opportunity Study 2020 Project Profile-Manufacture of Mouth fresheners
Page | 21
1.10. Estimation of Project Profitability: (Nu.in Lacs) # Particulars 1st Yr. 2nd Yr. 3rd Yr. 4th Yr. 5th Yr. 6th Yr. 7th Yr. 8th Yr. 9th Yr. 10th Yr.
1 Installed Capacity@100% 944.00 944.00 944.00 944.00 944.00 944.00 944.00 944.00 944.00 944.00
2 Capacity Utilisation 70% 70% 70% 80% 80% 80% 90% 90% 90% 100%
3 Actual Sales (Nu. in Lacs) 660.80 660.80 660.80 755.20 755.20 755.20 849.60 849.60 849.60 944.00
4 Cost of Operation
4.1 Land Lease Charges 5.17 5.17 5.43 7.75 7.98 8.22 8.47 8.72 8.98 9.25
4.2 Raw Material 374.22 374.22 374.22 427.68 427.68 427.68 481.14 481.14 481.14 534.60
4.3 Consumables @ 3% 11.23 11.23 11.23 12.83 12.83 12.83 14.43 14.43 14.43 16.04
4.4 Power and Utility 16.80 17.64 18.52 19.45 20.42 21.44 22.51 23.64 24.82 26.06
4.5 Repair & Maintenance @3% 1.44 1.44 1.44 1.44 1.44 1.44 1.44 1.44 1.44 1.44
4.6 Salary & Wages 57.00 59.85 62.84 65.98 69.28 72.75 76.39 80.20 84.21 88.43
4.7 Fringe Benefits @10% 8.55 8.98 9.43 9.90 10.39 10.91 11.46 12.03 12.63 13.26
4.8 Insurance 0.50 0.45 0.41 0.36 0.33 0.30 0.27 0.24 0.22 0.19
4.9 Administration Expenses 7.00 7.35 7.72 8.10 8.51 8.93 9.38 9.85 10.34 10.86
Total 476.74 481.15 485.80 545.75 550.88 556.28 617.02 622.98 629.24 690.88
5 Marketing Expenses @10%
(Sales)
66.08 66.08 66.08 75.52 75.52 75.52 84.96 84.96 84.96 94.40
6 Cost of Production 542.82 547.23 551.88 621.27 626.40 631.80 701.98 707.94 714.20 785.28
7 Sale (Estimated Turn Over) 660.80 660.80 660.80 755.20 755.20 755.20 849.60 849.60 849.60 944.00
8 Profit Before Interest
and Depp.
117.98 113.57 108.92 133.93 128.80 123.40 147.62 141.66 135.40 158.72
9 Interest on Term Loan @12% 11.69 10.70 8.74 6.77 4.80 2.83 0.88 0.00 0.00 0.00
10 On Working Capital @13 % 6.46 6.46 6.46 6.46 6.46 6.46 6.46 6.46 6.46 6.46
11 Total Interest 18.15 17.16 15.20 13.23 11.26 9.29 7.34 6.46 6.46 6.46
12 Profit Before Depreciation. 99.84 96.40 93.73 120.70 117.54 114.11 140.29 135.20 128.94 152.26
13 Depreciation 11.48 9.91 8.58 7.44 6.47 5.64 4.93 4.32 3.80 3.35
14 Profit After Depreciation 88.36 86.49 85.15 113.27 111.07 108.47 135.36 130.88 125.15 148.91
15 Pre-operative Exp. W. Off 0.00 2.36 2.36 2.36 2.36 2.36 2.36 2.36 2.36 2.36
16 Preliminary Exp. W .Off 0.10 0.10 0.10 0.10 0.10 0.10 0.10 0.10 0.10 0.10
17 Profit before Taxation 88.26 84.03 82.68 110.80 108.61 106.01 132.89 128.42 122.68 146.45
18 Taxation @30% of Net Profit 26.48 25.21 24.81 33.24 32.58 31.80 39.87 38.53 36.80 43.93
19 Accumulated Profit 61.78 120.60 178.48 256.04 332.07 406.27 499.29 589.19 675.06 777.58
20 Profit after Taxation 61.78 58.82 57.88 77.56 76.02 74.20 93.03 89.89 85.88 102.51
21 Add: Depreciation 11.48 9.91 8.58 7.44 6.47 5.64 4.93 4.32 3.80 3.35
22 Add: Interest on Term Loan 11.69 10.70 8.74 6.77 4.80 2.83 0.00 0.00 0.00 0.00
Total (A) 84.95 79.43 75.19 91.77 87.29 82.67 97.95 94.21 89.67 105.86
23 Interest on Term Loan 11.69 10.70 8.74 6.77 4.80 2.83 0.88 0.00 0.00 0.00
24 Repayment on Term Loan 0 16.40 16.40 16.40 16.40 16.40 15.40 0.00 0.00
Total (B) 11.69 27.10 25.14 23.17 21.20 19.23 16.28 0.00 0.00 0.00
Surplus (A) - (B) 73.26 52.33 50.06 68.60 66.09 63.44 81.68 94.21 89.67 105.86
DSCR (A/B) 7.27 2.93 2.99 3.96 4.12 4.30 6.02 0.00 0.00 0.00
Average DSCR 4.51

Investment Opportunity Study 2020 Project Profile-Manufacture of Mouth fresheners
Page | 22
1.11. Calculation of Interest on Term Loan and Repayment (Nu. in
Lacs) # Year Opening Balance Repayment Closing
Balance
Interest
1 1st year 97.40 0 97.40 11.69 11.69
2 2nd year
1st Qtr. 97.40 4.10 93.30 2.86
2nd Qtr. 93.30 4.10 89.20 2.74
3rd Qtr. 89.20 4.10 85.10 2.61
4th Qtr. 85.10 4.10 81.00 2.49 10.70
3 3rd year
1st Qtr. 81.00 4.10 76.90 2.37
2nd Qtr. 76.90 4.10 72.80 2.25
3rd Qtr. 72.80 4.10 68.70 2.12
4th Qtr. 68.70 4.10 64.60 2.00 8.74
4 4th year
1st Qtr. 64.60 4.10 60.50 1.88
2nd Qtr. 60.50 4.10 56.40 1.75
3rd Qtr. 56.40 4.10 52.30 1.63
4th Qtr. 52.30 4.10 48.20 1.51 6.77
5 5th year
1st Qtr. 48.20 4.10 44.10 1.38
2nd Qtr. 44.10 4.10 40.00 1.26
3rd Qtr. 40.00 4.10 35.90 1.14
4th Qtr. 35.90 4.10 31.80 1.02 4.80
6 6th year
1st Qtr. 31.80 4.10 27.70 0.89
2nd Qtr. 27.70 4.10 23.60 0.77
3rd Qtr. 23.60 4.10 19.50 0.65
4th Qtr. 19.50 4.10 15.40 0.52 2.83
7 7th year
1st Qtr. 15.40 4.10 11.30 0.40
2nd Qtr. 11.30 4.10 7.20 0.28
3rd Qtr. 7.20 4.10 3.10 0.15
4th Qtr. 3.10 3.10 0.00 0.05 0.88

Investment Opportunity Study 2020 Project Profile-Manufacture of Mouth fresheners
Page | 23
1.12. Break Even Point
# Particulars
1st
Yr.
2nd
Yr.
3rd
Yr.
4th
Yr.
5th
Yr.
6th
Yr.
7th
Yr.
8th
Yr.
9th
Yr.
10th
Yr.
1 Calculation of B.E.P.
Variable Cost
469.7
7
470.6
1
471.4
9
536.9
2
537.8
9
538.9
1
604.4
9
605.6
1
606.7
9 672.54
Fixed Cost
107.8
4
108.8
7
109.5
9
112.7
7
114.2
2
116.0
4
118.2
2
121.8
3
126.6
5 131.80
2
Break Even Point
(B.E.P.)
56.45
%
57.24
%
57.89
%
51.66
%
52.56
%
53.65
%
48.23
%
49.93
%
52.16
%
48.55
%
Average B.E.P. 52.83%
1.13. Projected Balance Sheet for the Project (10 Year) # Description Construc
tion
Period
Operation Period in Years
0 1st
Yr.
2nd
Yr
3rd
Yr
4th
Yr
5th
Yr
6th
Yr
7th
Yr
8th
Yr
9th
Yr
10th
Yr
1 Liabilities
1.
1 Equity 37.20
37.2
0
37.2
0
37.2
0
37.2
0
37.2
0
37.2
0
37.2
0
37.2
0
37.2
0
37.2
0
1.
2 General reserves 0
61.7
8
120.
60
178.
48
256.
04
332.
07
406.
27
499.
29
589.
19
675.
06
777.
58
1.
3 Debt 97.40
97.4
0
81.0
0
64.6
0
48.2
0
31.8
0
15.4
0 0.00 0.00 0.00 0.00
1.
4 Current Liabilities 0.00 0.46 0.51 0.50 0.50 0.50 0.50 0.50 0.50 0.50 0.50
1.
5
Working Capital
Loan 0.00
49.6
9
49.6
9
49.6
9
49.6
9
49.6
9
49.6
9
49.6
9
49.6
9
49.6
9
49.6
9
Total Liabilities 134.59
246.
53
289.
00
330.
47
391.
63
451.
26
509.
06
586.
69
676.
58
762.
46
864.
97
2 Assets
2.
1 Gross Fixed Assets 112.31
112.
31
112.
31
112.
31
112.
31
112.
31
112.
31
112.
31
112.
31
112.
31
112.
31
2.
2
Accumulated
Depreciation 0
11.4
8
21.3
9
29.9
6
37.4
0
43.8
7
49.5
1
54.4
4
58.7
5
62.5
5
65.9
0
2.
3
Net fixed assets
(2.01-2.02) 112.31
100.
83
90.9
2
82.3
5
74.9
1
68.4
4
62.8
0
57.8
8
53.5
6
49.7
6
46.4
1
2.
4
Preliminary
Expenses 1.00 0.90 0.80 0.70 0.60 0.50 0.40 0.30 0.20 0.10 0.00
2.
5
Pre-Operative
Expenses 21.28
21.2
8
18.9
2
16.5
5
14.1
9
11.8
2 9.46 7.09 4.73 2.36 0.00
2.
6 Current Assets 0.00
14.4
9
16.5
6
16.5
6
16.5
6
16.5
6
16.5
6
16.5
6
16.5
6
16.5
6
16.5
6
2.
7
Profit & Loss
Account 0.00 0.00 0 0 0 0 0 0 0 0 0
2.
8
Cash & Bank
Balance 0.00
109.
03
161.
80
214.
32
285.
38
353.
94
419.
84
504.
86
601.
54
693.
68
802.
00
Total Assets 134.59
246.
53
289.
00
330.
47
391.
63
451.
26
509.
06
586.
69
676.
58
762.
46
864.
97

Investment Opportunity Study 2020 Project Profile-Manufacture of Mouth fresheners
Page | 24
1.14. Environment Consideration Maintaining and sustaining the environment is of paramount importance for this
project. The manufacturing process contains no harmful ingredient. It will not create
any effluent and chemical waste. However, the plant is designed to be environment
friendly and prioritises to maintain neat and clean atmosphere through its industrial
process activities.
It’s an eco-plant and environment management system ISO 14001 will be
implemented and followed strictly to ensure that there is no compromise in
environment management.
1.15. Conclusion Beauty products like soap, shampoo and body care cater to the daily needs of people.
Some entrepreneurs have started manufacturing herbal glycerine-based soap to know
the liking of users “keeping away the chemicals normally used in these products”. The
demand is ample and it has wide scope in the domestic as well as the international
market and the main focus country is Germany. It is covered under small industry
segment and can be managed through technical collaboration with companies from
India and Thailand.
The project is financially viable with Net Profit Ratio of 14.24%. It needs around 25
employees including managerial staff, and skilled and unskilled staff to operate the
plant. The financial ratios are positive during the first 7 years of operation. The average
DSCR is 4.51which implies that the project generates sufficient funds to cover its cost,
including loan repayments and interest payments during the period. This also indicates
that the project can continue making profits even after 7 years.
The required machinery and equipment for the production of soap and allied products
can be imported from India, Thailand and Italy.
Based on the estimation of project cost and financial analysis, the production of Beauty
Care product manufacturing unit is financially viable, profitable with a good rate of
return. It is recommended to entrepreneurs to scale up to industrial level.
Investment Opportunity Study 2020 Project Profile-Manufacture of Mouth fresheners
Page | 25
1.16. Annex A: List of Equipment Suppliers The manufacturing process is covered under engineering sector. The state-of-the-art modern
equipment can be sourced from India. Some of the leading manufacturers of equipment
include (individuals are advised to conduct their own research to look for suppliers, the
following list does not indicate the consultant’s opinion on the choice of supplier and is
provided only for basic information based on first hand search):
▪ RSB Equipment’s Private Limited
Mr. Atanu Sarkar
435, Jessore Rd, Shyam Nagar, Amarpalli,
Dum Dum, Kolkata, West Bengal 700055
Mobile: 098302 78600,
Email: [email protected],
Website: www.rsbpumps.com
▪ Kishori Kripa Enterprises
Mr. Naveen Bhalla
27, Pandit Park, Shivaji Gali
Krishna Nagar, Delhi - 110051, India
Mobile: +91 9811114589
Email: [email protected]
Website: www.kishorikirpa.com
▪ Golden Engineering Co.
Mr. Tarun Preet Singh
63/27, Opposite Lakhbir Complex,
Chd road, Khanna - 141407 (Punjab) India.
Mobile: +91-88721-77000, 08909241371
Email: [email protected]
Website: www.goldenengineeringcompany.com
▪ Adhisakthi Projects Private Limited
Senthil Kannan (CEO)
No. 20/10, Ganesh Nagar Main Road, G. K. Industrial Estate, Alappakkam,
Porur, Chennai - 600116, Tamil Nadu, India
Mobile: +91 9443203221, 9442255639
Email: [email protected]
Website: www.adhisakthi.com
▪ Sakun Engineers
Mr. Hiten (Proprietor)
33/A, New Arbuda Estate, New Ranip
Ahmedabad - 382470, Gujarat, India
Mobile: +91 9443203221, 9442255639
Email: [email protected]
Website: www.sakunengineers.in
References
▪ BhutanTradeStatistics2019260320201.pdf
▪ www.businesswire.com
▪ www.mof.gov.bt
▪ https://www.equitymaster.com/research-it/sector-info/consprds/consprds-
products.html#:~:text=The%20popular%20and%20economy%20segments,at%201%2C100%20gms%20p
er%20annum.
▪ https://my.msme.gov.in/MyMsmeMob/MsmeProjectProfile/Pages/2_6.html
▪ https://www.diynatural.com/how-to-make-glycerin-soap-base-recipe/
▪ http://www.madehow.com/Volume-2/Soap.html

Investment Opportunity Study 2020 Project Profile-Manufacture of Mouth fresheners
Page | 26
Project Title:
Manufacturing of Mouth freshener
(Flavoured Areca nut and Cardamom)
Tobacco Free Product

Investment Opportunity Study 2020 Project Profile-Manufacture of Mouth fresheners
Page | 27
2. Manufacturing of Mouth freshener
2.1. Background of the Idea People consume mouth fresheners for various reasons but mostly for good breath.
Known as ‘Pan Masala’, it is a very popular product in India and could be described as
a Bhutanese equivalent to Doma-pani.
Popular brands in the Bhutanese market include Rajnigandha, Rajnigandha Pearls,
Shakila, Shikar. None of these contain tobacco. The basic composition can vary based
on the brand and product but could consist of a balanced mixture of areca nuts (also
known as supari), catechu, cardamom, lime, flavoring agents and some natural
perfuming materials.
In reference to the Bhutan Trade Statistics, following highlights are presented;
i. Some types of pan masala are produced in Bhutan.
ii. Exports have plummeted possibly on the account of India’s GST.
iii. Import has still increased by 72% in 2019 as compared to 2018 indicating that
either the demand has substantially increased15.
On the supply side, Bhutan is having a rich production of Cardamom and Areca nut.
The southern Dzongkhags of Sarpang and Samtse lead the production. While the
production of Areca nut has been on the rise, cardamom production has been
▪ 15 BhutanTradeStatistics2019260320201.pdf
2014 2015 2016 2017 2018 2019
Imp_Pan masala 21 26 21 23 16 28
Exp_Pan masala 43 20 21 17 3 0
21
26
21 23
16
28
43
20
21
17
3
0 -
5
10
15
20
25
30
35
40
45
50
Imp_Pan masala Exp_Pan masala
Figure_ 7: Trade Statistics of Pan Masala (Nu. in Millions)

Investment Opportunity Study 2020 Project Profile-Manufacture of Mouth fresheners
Page | 28
declining on the account of poor market price (or rather poorer price as compared to
few years ago).
Figure_ 8: Cardamom and Arecanut Production in Bhutan (MT)
2014 2015 2016 2017 2018
Arecanut 7468 9406 9467 9342 11681
Cardamom 1781 2091 2736 2245 1542
0
2,000
4,000
6,000
8,000
10,000
12,000
14,000
Cardamom Arecanut

Investment Opportunity Study 2020 Project Profile-Manufacture of Mouth fresheners
Page | 29
2.2. Market Outlook International16
India is the major producer and consumer of areca nut in the world17. Production is
concentrated in six states, namely Karnataka, Kerala, Assam, Meghalaya, Tamil Nadu
and West Bengal. There is an ever-increasing demand for mouth freshener products.
Among the various types of pan masala available in the Indian market, pan masala
containing tobacco represents the dominating type accounting for more than 50% of
the entire market. Pan masala containing tobacco is followed by plain pan masala and
flavoured pan masala. Exports also represent a major driver of the Indian pan masala
market.
The biggest export market for Indian pan masala is the UAE accounting to one-third
of the total export. UAE is followed by USA, Singapore, Afghanistan, South Africa, Saudi
Arabia and Malaysia.
The majority of the Indian pan masala market is highly disorganised and is surrounded
by few players, namely, DS GROUP, Manikchand Group, Godfrey Phillips India Ltd,
Kothari Product Limited, Trimurti Fragrances Pvt. Ltd, Sugandha Exports, Dharampal
Premchand Limited, and Red Rose Group, among others. Among these players,
Rajnigandha represented the largest manufacturer of pan masala accounting for the
majority of the market share. It was followed by RMD, Pan Vilas, Pan Parag and others.
Factors like its immense popularity, constantly increasing disposable incomes,
convenient packaging, aggressive advertising campaigns by manufacturers and the
large-scale switching of consumers from tobacco products to pan masala are currently
encouraging the growth of pan masala market. The brief market outlook is surmised
below:
▪ Indian pan masala market has reached values worth INR 421,800 million in
2019 growing at a CAGR 8.09% and expected to grow with 9.3% in the next five
years18.
▪ Cardamom is popularly known as the queen of spices and it is the third-most
expensive spice in the world. The Cardamom market is expected to grow by
USD 49.65 million during 2020-2024, progressing at a CAGR of 3% annual19.
16https://www.businesswire.com/news/home/20170221006370/en/Pan-Masala-Market-Global-Industry-Trends-
Share 17 http://www.kerenvis.nic.in/Database/ImportantPlantationCrops_1732.aspx?format=Print#:~:
text=India%20is%20the%20largest%20producer,place%20in%20the%20Indian%20economy. 18 https://www.marketwatch.com/press-release/indian-pan-masala-market-2020-industry-overview-growth-rate-
trends-covid-19-impact-analysis-opportunities-and-forecast-till-2025-2020-05-16 19 https://www.reportlinker.com/p05028436/Global-Cardamom-Market.html

Investment Opportunity Study 2020 Project Profile-Manufacture of Mouth fresheners
Page | 30
▪ The ever-growing demand for areca nut products such as pan, scented supari,
and pan masala in countries such as the U.S., Sri Lanka, Nepal, UAE, Mexico,
Thailand, Singapore, and other countries drives the growth of the areca nut
market.
2.3. The Project Concept Bhutan is a growing market for flavored Areca nut and Cardamom as Mouth freshener
items. Bhutanese are consuming Areca nut and Cardamom flavoured mouth freshers.
Pan masala brands ‘merry supari’ and ‘Raju Supari’ are popular among young
Bhutanese. Rajnighandha Pearls (silver coated seeds) are also popular.
With the growing demand for pan masala in the country and increasing consumption
pattern among the Bhutanese, production processing plant is recommended. The raw
materials are easily available in the country and can be imported from the neighboring
states of Assam and Bengal in India.
2.4. Technical Details
2.4.1. Product Group
Mouth Freshener is a balanced mixture of areca nut, clove, cardamom, mint, essence
and other ingredients packed in small pouches. Supari is a scented soft areca nut
known for its refreshing taste and flavor.
a. Mouth Freshener and Pan Masala
(Packaging - 10gm, 20gm, 50gm, 100gm)
b. Clean Graded Cardamom Pods
(Packaging - 5gm, 10gm, 20gm, 50gm,100gm, 250gm, 500gm)
c. Peppermint Coated Beetle Nut
(Packaging - 10gm, 20gm, 50gm,100gm, 250gm, 500gm)
2.4.2. Plant Capacity and Equipment
The plant will operate in single shift, 8-hour production in 300-day years. Plant capacity
is assessed with final annual output of 105MT with consideration to investment,
technology, skill sets & expansions plan, Bhutan Industrial development demand and
supply projections etc.
2.4.3. Assessment Production Capacity
The plant production estimate are as follows:

Investment Opportunity Study 2020 Project Profile-Manufacture of Mouth fresheners
Page | 31
Figure_ 9: Assessment Production Capacity:
Products
Particulars
Pan Masala Cardamom
Pods
Coated Cuts
Beetle Nut
Production Capacity 50 Kg/Hr. 50 Kg/Hr. 50 Kg/Hr.
Production in a Day 3 Hr. 2 Hr. 2 Hr.
Days in a Year 300 Days 300 Days 300 Days
Total Production in Year 45000 Kg 30000Kg 30000Kg
MT per Year 45MT 30 MT 30 MT
State of the art technology in rust free (mostly MOC SS 316 & 304) equipment is
planned for processing followed by WHO- GMP, ISO 22000 and FSSAI norms for
quality delivery of Mouth freshener flavored Areca nut and Cardamom products.
2.5. Manufacturing Process The manufacturing process of the proposed product is simple and technology can be
sourced from Indian companies under joint collaboration. However, as per available
skill sets, production is feasible in Bhutan. The manufacturing process mainly consists
of cleaning, boiling, drying and mixing of ingredients.
The production process brief is as follows:
2.5.1. Mouth Freshener and Pan Masala Manufacturing Process20
The process includes preparation of raw material, pre-processing, cleaning and
grading of areca nut and cardamom. Preparation of Areca nut consists with softening
process i.e. boiling, sun drying and cutting in small pieces (2-3mm size). It follows
layering of sweetener and menthol on cut pieces of Areca nut for its refreshing taste.
Finally, cardamom, Areca nut and other ingredients are blended with essence as per
the formulation.
The prepared product is packed in bio gradable moisture proof pouches of different
weights and sizes. The bigger packs are in Tin and Paper Boxes. All necessary
information for customers is mentioned on the packaging. Then the product is ready
for supply.
20 https://www.slideshare.net/franchiseconnect/alpha-agro-loooking-for-cf-distributors-for-pan-india

Investment Opportunity Study 2020 Project Profile-Manufacture of Mouth fresheners
Page | 32
Figure_ 10: Manufacturing Process Flow Chart of Pan Masala
2.5.2. Green Cardamom Processing21
Clean & Graded Cardamom Pods processing is covered under Post
Harvested processing. It includes cleaning of pods for removing
dust and dirt. After the first cleaning, it is washed thoroughly to
remove additional dirts from cardamom capsules. Actual processing
starts from curing of wet pods in sodium carbonate (2% w/W) and
dipping in hot water at 40°C for 10 minutes.
This activity provides retention of green colour of cured capsules.
Subsequently sun drying is performed to maintain moisture for 7-
8hr. and after that mechanical dryer is used to make required quality
standard.
These prepared pods are further graded and evenly sorted
according to sizes and weight. The graded product is ready for packaging and supply.
It should be protected from absorption of moisture, or any other kind of unwanted
contamination. Thus, it is stored in gunny bags lined with 300-gauge polyethylene and
sometimes packed in wooden chests lined with moisture proof Kraft paper or
polyethylene.
21 Sweet Scented Supari Manufacturing Businesswww.entrepreneurindia.co
Figure_ 11: Clean & Graded
finest Cardamom Pods
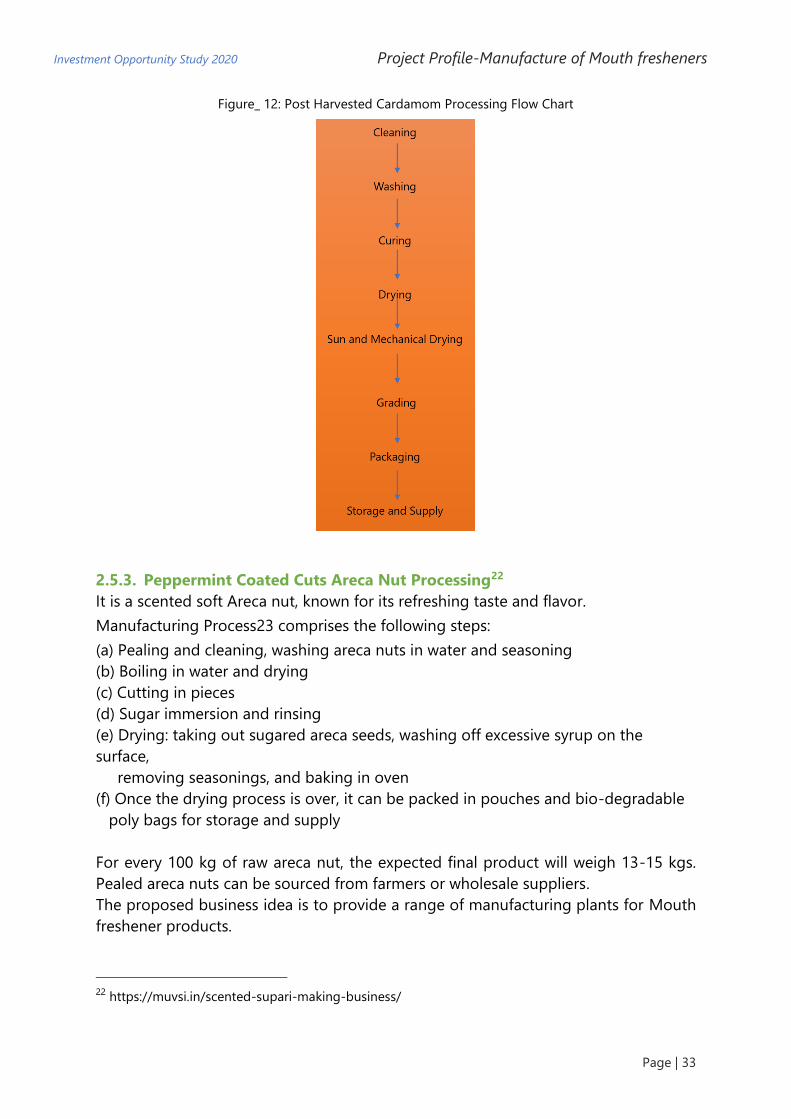
Investment Opportunity Study 2020 Project Profile-Manufacture of Mouth fresheners
Page | 33
Figure_ 12: Post Harvested Cardamom Processing Flow Chart
2.5.3. Peppermint Coated Cuts Areca Nut Processing22
It is a scented soft Areca nut, known for its refreshing taste and flavor.
Manufacturing Process23 comprises the following steps:
(a) Pealing and cleaning, washing areca nuts in water and seasoning
(b) Boiling in water and drying
(c) Cutting in pieces
(d) Sugar immersion and rinsing
(e) Drying: taking out sugared areca seeds, washing off excessive syrup on the
surface,
removing seasonings, and baking in oven
(f) Once the drying process is over, it can be packed in pouches and bio-degradable
poly bags for storage and supply
For every 100 kg of raw areca nut, the expected final product will weigh 13-15 kgs.
Pealed areca nuts can be sourced from farmers or wholesale suppliers.
The proposed business idea is to provide a range of manufacturing plants for Mouth
freshener products.
22 https://muvsi.in/scented-supari-making-business/
Investment Opportunity Study 2020 Project Profile-Manufacture of Mouth fresheners
Page | 34
More details on the process can be found from the following sources and videos for
better understanding:
Figure_ 13: Readable Material
Reading Materials Videos
https://www.entrepreneurindia.co/pro
ject-and-profile-
details/Pan%20Masala
https://www.youtube.com/watch?v=L7ZgX
o_QqyM
https://www.slideshare.net/MDSALM
ANANJUM/processing-of-cardamom
https://www.youtube.com/watch?v=Zrjj0IL
Nee4
https://muvsi.in/scented-supari-
making-business/
https://www.youtube.com/watch?v=wWZl
wOPQn1w
2.6. Raw Material Requirement and Source Areca Nut and Cardamom are the main raw materials for
manufacturing mouth fresheners along with other ingredients like
clove, catechu, cardamom, lime, mint, essence and other flavouring
agents. Cuts of supari are blends with alkaloids and
peppermint/menthol.
Raw material for plant processing will be sourced from India
(Kolkata and Guwahati) and from within Bhutan. As per the
agriculture produce statistics, areca nut production touchedt 9.40
KT in 2018 in Bhutan. This is 5.24% increase from the year before.
Historically, areca nut production in Bhutan reached an all-time
high of 10.5 KT in 2012.
Cardamom plantations in Bhutan covered an area of about
13,880 acres with an annual production of 6,202 MT in 2019. Samtse, Chukha, Dagana,
Tsirang, Sarpang and Trongsa are the major large cardamom growing Dzongkhags in
Bhutan. Thus, areca nut and cardamom are both available in Bhutan for commercial
processing. A list of raw material supplier is attached as “annexure B”.
Details of required raw material is as follows along with the source: Table_ 17: Raw Material Requirement and Source
# Raw Material Source
1. Areca nut Bhutan
2. Cardamom Bhutan
3. Peppermint/menthol India
4. Herbs, addictive, flavors, saffron, sweetener, spices and
pomegranate, cumin, black pepper, dry ginger,
India and Bhutan
Figure_ 14: Glimpse of Raw
Materials for Pan Masala
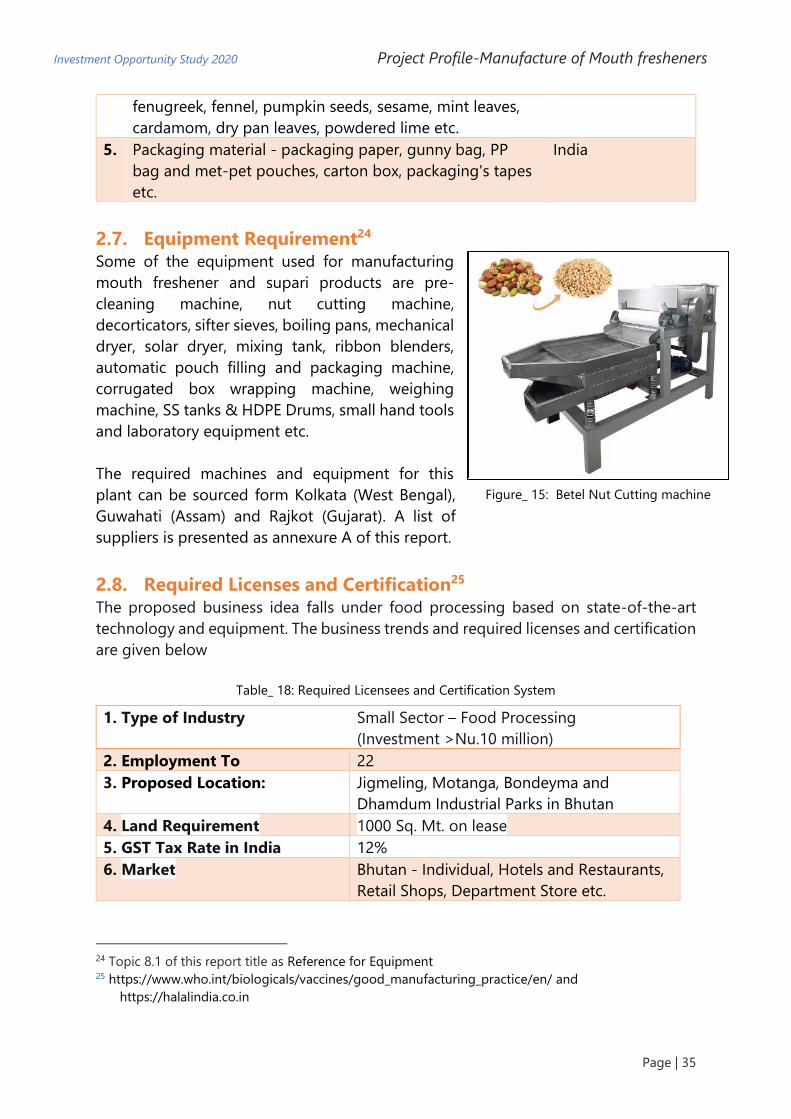
Investment Opportunity Study 2020 Project Profile-Manufacture of Mouth fresheners
Page | 35
fenugreek, fennel, pumpkin seeds, sesame, mint leaves,
cardamom, dry pan leaves, powdered lime etc.
5. Packaging material - packaging paper, gunny bag, PP
bag and met-pet pouches, carton box, packaging's tapes
etc.
India
2.7. Equipment Requirement24 Some of the equipment used for manufacturing
mouth freshener and supari products are pre-
cleaning machine, nut cutting machine,
decorticators, sifter sieves, boiling pans, mechanical
dryer, solar dryer, mixing tank, ribbon blenders,
automatic pouch filling and packaging machine,
corrugated box wrapping machine, weighing
machine, SS tanks & HDPE Drums, small hand tools
and laboratory equipment etc.
The required machines and equipment for this
plant can be sourced form Kolkata (West Bengal),
Guwahati (Assam) and Rajkot (Gujarat). A list of
suppliers is presented as annexure A of this report.
2.8. Required Licenses and Certification25 The proposed business idea falls under food processing based on state-of-the-art
technology and equipment. The business trends and required licenses and certification
are given below
Table_ 18: Required Licensees and Certification System
1. Type of Industry Small Sector – Food Processing
(Investment >Nu.10 million)
2. Employment To 22
3. Proposed Location: Jigmeling, Motanga, Bondeyma and
Dhamdum Industrial Parks in Bhutan
4. Land Requirement 1000 Sq. Mt. on lease
5. GST Tax Rate in India 12%
6. Market Bhutan - Individual, Hotels and Restaurants,
Retail Shops, Department Store etc.
24 Topic 8.1 of this report title as Reference for Equipment 25 https://www.who.int/biologicals/vaccines/good_manufacturing_practice/en/ and
https://halalindia.co.in
Figure_ 15: Betel Nut Cutting machine
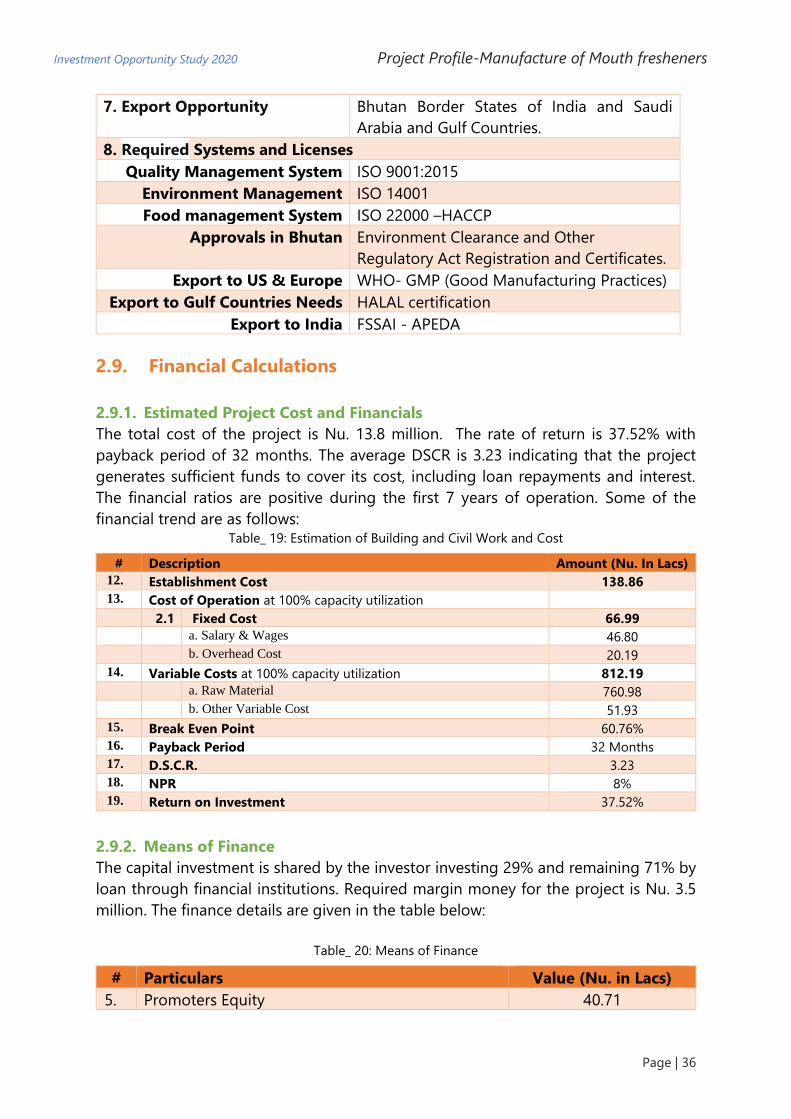
Investment Opportunity Study 2020 Project Profile-Manufacture of Mouth fresheners
Page | 36
7. Export Opportunity Bhutan Border States of India and Saudi
Arabia and Gulf Countries.
8. Required Systems and Licenses
Quality Management System ISO 9001:2015
Environment Management ISO 14001
Food management System ISO 22000 –HACCP
Approvals in Bhutan Environment Clearance and Other
Regulatory Act Registration and Certificates.
Export to US & Europe WHO- GMP (Good Manufacturing Practices)
Export to Gulf Countries Needs HALAL certification
Export to India FSSAI - APEDA
2.9. Financial Calculations
2.9.1. Estimated Project Cost and Financials
The total cost of the project is Nu. 13.8 million. The rate of return is 37.52% with
payback period of 32 months. The average DSCR is 3.23 indicating that the project
generates sufficient funds to cover its cost, including loan repayments and interest.
The financial ratios are positive during the first 7 years of operation. Some of the
financial trend are as follows: Table_ 19: Estimation of Building and Civil Work and Cost
# Description Amount (Nu. In Lacs)
12. Establishment Cost 138.86
13. Cost of Operation at 100% capacity utilization
2.1 Fixed Cost 66.99
a. Salary & Wages 46.80
b. Overhead Cost 20.19
14. Variable Costs at 100% capacity utilization 812.19
a. Raw Material 760.98
b. Other Variable Cost 51.93
15. Break Even Point 60.76%
16. Payback Period 32 Months
17. D.S.C.R. 3.23
18. NPR 8%
19. Return on Investment 37.52%
2.9.2. Means of Finance
The capital investment is shared by the investor investing 29% and remaining 71% by
loan through financial institutions. Required margin money for the project is Nu. 3.5
million. The finance details are given in the table below:
Table_ 20: Means of Finance
# Particulars Value (Nu. in Lacs)
5. Promoters Equity 40.71

Investment Opportunity Study 2020 Project Profile-Manufacture of Mouth fresheners
Page | 37
6. Term Loan from Bank 97.65
Total 138.36
7. Margin Money for Working Capital 34.74
8. Working Capital Loan from Bank 62.26
Total 97.00
2.9.3. Project Cost
The project cost is estimated to include the cost of building and civil construction,
plant and machinery, MFA, preliminary expenses, pre-operative expenses and
contingency. Margin money for working capital is not considered as part of project
cost. The required land for plant set-up is on an area of around 1,000 m2 and it will be
arranged on lease. Estimated cost for building & civil construction is Nu. 3.9 million
which share about 28.15% of the project cost. Plant & Machinery cost is about Nu. 5.9
million consisting 42.59% of the project cost. The project cost is given below:
Table_ 21: Head Wise Project Cost and Sharing Percentage
# Particulars Value (Nu. in Lacs)
Cost Sharing
7. Building & Civil Construction 38.95 28.15%
8. Plant & Machinery 58.93 42.59%
9. Misc. Fixed Assets 14.72 10.64%
10. Preliminary Expenses 1.00 0.72%
11. Pre-operative Expenses 21.39 15.46%
12. Contingencies 3% 3.38 2.44%
Total 138.36 100%
2.10. Estimation of Building and Civil Work and Cost Based on the requirement of processing area, store for raw materials and finished
goods and office space, the following building area is planned. The civil construction
cost of the building is considered as per the Bhutan Schedule of Rates (Civil Works)26
2018 issued by Ministry of Works and Human Settlement, Bhutan. Pre-fabricated
building structure will be used for construction of building amenities. Total estimated
cost for building and civil work is Nu. 3.8 million. 7 The cost components of building
& construction are given below:
26 Source: https://www.mowhs.gov.bt/wp-content/uploads/2018/04/BSR-2018-civil.pdf

Investment Opportunity Study 2020 Project Profile-Manufacture of Mouth fresheners
Page | 38
Table_ 22: Estimation of Building and Civil Work and Cost
# Particular Dimensions (Mt.)
Area (Sq. Mt.)
Rate (Nu. / Sq. Mt.)
Amoun
t (Nu. in
Lacs)
13. Production Area (Main
Shed) height 16 feet (5Mt.)
50 40 2000 750 15.00
14. Raw Material Storage 40 30 1200 600 7.20
15. Packaging Section 20 15 300 600 1.80
16. Finished Goods Storage 25 18 450 600 2.70
17. Laboratory 15 10 150 600 0.90
18. Office Space 18 15 270 600 1.62
19. Facilities + Utility + Pantry 20 15 300 600 1.80
20. Security & Time office 10 10 100 600 0.60
21. Boundary wall (130 RM
with height of 3m (10 Ft.)
and 1Ft. Thick)
412 10 4120 150 6.18
22. Parking Area 40 30 1200 Lump Sump 0.50
23. Space for Sun Drying and
Green Belt Development
70 50 3500 Lump Sump 0.30
24. Entrance Gate - 15 feet
wide and Name Sign
Board
35000 0.35
Total 37.95
2.11. Plant and Machinery Cost27 The cost estimation for plant & machinery has been worked out based on the cost
figures received from the Indian plant machinery suppliers. The prices are considered
without Indian GST tax as it is exempted under supply of trade agreement between
India and Bhutan (Category Export). Installation and commissioning of equipment are
considered separately in the total plant and machinery cost estimation.
Freight and insurance have been considered with the assumption that all goods are
transported by road. Goods of import origin would be handled at the Kolkata port.
Total estimated cost for building and civil works is Nu. 5.9 million and share the highest
percentage (42.59%) of the project cost. The equipment list28 with cost is given in the
table below:
27 Equipment Supplier List is given under annexure A. 28 Details given on Topic 8 of this report title as Additional Reference for Equipment

Investment Opportunity Study 2020 Project Profile-Manufacture of Mouth fresheners
Page | 39
Table_ 23: Plant & Machinery with Cost
# Plant & Machinery Qty. Rate
(in Nu.)
Amount
(Nu. in Lacs)
20. Poly Carbonate Sun Dryer (1MT - 8 Hr) 1 850000 8.50
21. Pre-cleaning Machine Vibrator Type (100 Kg / Hr)
and Accessories
1 450000 4.50
22. Cardamom Washing Machine (100Kg/Hr) 1 85000 0.85
23. Mechanical Dryer for Drying (100 Kg/Hr) 1 900000 9.00
24. Cardamom grading machine (50Kg/Hr) 1 350000 3.50
25. Arecanut Dehusking Machine (100 Kg/hr) 1 180000 1.80
26. Arecanut Decorticators (100 Kg/Hr) 1 250000 2.50
27. Arecanut Nut Cutting Machine (100 Kg /Hr) 1 180000 1.80
28. Vibro Sieves Machine ( 50-70kg/Hr) 2 110000 1.10
29. Boiling Pans -Tilting Type(50Lt.) 1 135000 1.35
30. Motorized Mixture (30 Kg/Hr) 1 100000 1.00
31. Ribbon Blenders for Mixing
(MOC SS, Single Shaft 50-70kg / Hr)
2 570000 5.70
32. Automatic Pouch Filling and Packaging Machine 1 390000 3.90
33. Corrugated box wrapping machine 1 100000 1.00
34. Weighing Machine (Scale 500 Kg) 4 40000 0.40
35. SS Tanks & HDPE Drums 1 135000 1.35
36. Small Hand Tools and Accessories 1 40000 0.40
37. Testing and Monitoring Equipment Set 1.50
Total 50.15
38. Packaging and Forwarding @7.50% 3.76
39. Erection and Commissioning @10% 5.02
Grand Total 58.93

Investment Opportunity Study 2020 Project Profile-Manufacture of Mouth fresheners
Page | 40
2.12. Misc. Fixed Assets Miscellaneous fixed asset includes office equipment & furniture, computer and
peripherals, firefighting equipment, vehicle etc. Nu. 1.5 million has been estimated
under this head “MFA” and is presented in the table below: Table_ 24: Misc. Fixed Assets Cost Estimation
# Particulars Qty. Amount (Nu.in lacs)
6. Office Equipment, Laptop, Printer & Software’s 1 3.50
7. Furniture & Fixture with Interior Items 1 2.50
8. Fire Fighting Equipment's (1set of 10 pcs each) 1 0.60
9. Ventilation - Exhaust fans 5 0.12
10. Tata Mini Truck 1 8.00
Total 14.72
2.13. Preliminary Expenses Preliminary expenses are those that are incurred before the incorporation and
commencement of business. These are treated as deferred revenue expenditure. These
expenses are marked to be written off in the next ten years in profitability estimation.
The Preliminary expense details are given below: Table_ 25: Preliminary Expenses
# Particular Amount (Nu.in Lacs)
2. Company formation, Approvals and Setup expenses 1.00
Total 1.00
2.14. Pre-operative Expenses
These expenses are incurred prior to commencement of commercial production. A
total of Nu. 2.2 million 1is estimated under this cost to be written off in the next 10
years. It is considered as exempted in the first year. The details are given in the table
below:
Table_ 26: Preliminary Expenses
# Particular Amount (Nu.in Lacs)
10. Interest up to production 2.30
11. Insurance during construction period 0.56
12. Electricity charges construction period 1.50
13. Salary during construction period 1.00
14. Marketing launch expenses 2.00
15. Quality and Environment Management Certification Export
Market - GMP
7.00

Investment Opportunity Study 2020 Project Profile-Manufacture of Mouth fresheners
Page | 41
16. Project consultancy fees @5% of project cost 5.63
17. Travelling Expenses for Project Implementation 1.00
18. Registration of Trade Mark and patent 0.40
Total 21.39
2.15. Cost of Raw Material The cost of raw materials consists of the cost of main ingredients, raw materials and
cost of packaging. The annual raw material cost is based on the present average
market prices in Bhutan. A total of Nu. 76 million has been estimated. A list of raw
material supplier is detailed under “Annexure B29”. The details are given in the table
below:
Table_ 27: Salary & Wages
# Raw Material Annual
Requirement
Rate (Nu. Per
Unit)
Total
Amount (Nu.in
Lacs)
1. Areca nut 54Mt 240Kg 129.60
2. Cardamom 37.50 Mt 1000Kg 375.00
3. Peppermint/menthol 0.80 Mt 2000Kg 16.00
4. Herbs, additives, flavors, saffron,
Sweetener, spices and pomegranate,
cumin, black pepper, dry ginger,
fenugreek, fennel (Coated and without
Coated), Pumpkin Seeds, sesame, Mint
leaves, cardamom, dry pan leaves,
powdered lime etc.
29.25 Mt 750Kg 219.38
5. Packaging Material - Packaging Paper,
Gunny Bag, PP Bag and MET-PET
Pouches, Carton Box, Packaging's Taps
etc.
Set
21
Total Raw Material requirement at 100% capacity Utilization 760.98
2.16. Salary & Wages Salaries and wages (including benefits) for different categories of employees have
been considered based on present day expenses. The salaries are considered as per
the present trends in the relevant segment and rules as per Pay Revision Act 2019 (9
July 2019) Bhutan. The fringe benefits are considered at 15% per year. It is also
considered that salary will increase 5% annually.
29 Raw Material Supplier in Bhutan - List is given under “annexure B”.

Investment Opportunity Study 2020 Project Profile-Manufacture of Mouth fresheners
Page | 42
It needs about 24 employees include Manager, Accounts and Administration,
Advertising and Marketing, Reception and Office Support, Skilled Worker, Unskilled
Worker, Driver and security to operate the plant. The breakdown of manpower with
estimated salaries is given in the following table:
Table_ 28: Salary & Wages
# Description Intake Salary Per
Month (Nu.)
Salary Per
Annum (Nu. In Lacs)
10. Manager 1 50000 6.00
11. Accounts and Administration 1 30000 3.60
12. Advertising and Marketing 1 30000 3.60
13. Reception and Office Support 1 15000 1.80
14. Front Line Operators 8 20000 19.20
15. Support Staff 8 10000 9.60
16. Transport - Driver 1 15000 1.80
17. Security 3 10000 1.20
18. Manager 1 50000 6.00
Total 24 46.80
2.17. Electrical and Water Consumption Charges30 Electricity charges are considered as per the tariff rate issued by Bhutan Power
Corporation. The unit cost of electricity has been considered @ Nu. 3/Kwh for
operating of machines and plant operation. It is assumed that the entire power
requirement is met from the grid. The expense on water supply, treatment and
distribution has been suitably considered based on the Thimphu City Corporation
water tariff on a lumpsum basis. It is assumed that power and water charges will
increase @ 5% every year. The expenses under this head are as follows: Table_ 29: Electrical and Water Consumption Charges
# Description Amount Per Annum
1 Power Consumption Charges 26.40
2 Water Consumption Charges 1.20
Total (Nu.in Lacs) 27.60
2.18. Term Loan Estimation The term loan requirement is estimated on the funding pattern in Bhutan. It is
estimated as per the norms by Bhutan National Bank Limited. The term loan is
considered as up to 60% to 75% of the project cost and it does not include working
capital margin money (as per financing pattern by Bhutan National Bank Limited). The
estimated term loan is Nu.9.8 million of which 71% will come as loan from financial
30 Source: Available on the link of https://www.bpc.bt/electricity-tariff/.

Investment Opportunity Study 2020 Project Profile-Manufacture of Mouth fresheners
Page | 43
institution. The rest of the capital investment (Nu. 4 million consisting 29%) will be
managed by entrepreneurs on their own.
The term loan details are as follows: Table_ 30: Term Loan Requirement from Financial Institution
# Particulars Margin
%
Amount
(Nu.in
Lacs)
Own
Contribution
(Nu. in Lacs)
Bank Loan
(Nu.in
Lacs)
7. Building & Civil Construction 37.95 38.95 3.90 35.06
8. Plant & Machinery 56.34 58.93 8.84 50.09
9. Misc. Fixed Assets 14.75 14.72 2.21 12.51
10. Preliminary Expenses 1.00 1.00 1.00 0.00
11. Pre-operative Expenses 21.28 21.39 21.39 0.00
12. Contingencies 3.27 3.38 3.38 0.00
Total 138.36 40.71 97.65
Sharing % 29% 71%
2.19. Working Capital Loan Amount Working capital loan up to 75% of the total working capital gap is considered in
Bhutan. The total estimated working capital requirement is Nu. 9.7 million and margin
money is estimated as Nu. 3.5 million. Rest of the amount to form the working capital
loan amount is Nu. 6. 3 million. It can be arranged from the banks in Bhutan at the
interest rate31 of 13% (fixed rate as well as floating). Working capital requirements
have been worked out in the following table: Table_ 31: Working Capital Loan Amount
# Particulars Period Margin
%
Amount
(Nu.in Lacs)
Own
Contribution
(Nu. in Lacs)
Bank Loan
(Nu.in
Lacs)
4. Raw Material 15 days 50% 21.92 10.96 10.96
5. Receivable 30 days 25% 67.38 16.84 50.53
6. Cash for Expenses
& Consumables
15days 90% 7.73 6.95 0.77
Net Working Capital Requirement 97.02 34.76 62.26
Margin Money for working Capital Nu. 34.76 Lacs
2.20. Sales Realization/Estimated Turnover Sales realization or estimated turnover is based on the sale price at FOB Factory Gate.
The sale price of products is determined as cost competitive with presently available
similar product whether supply is from domestic market or international.
The sale price of Pan Masala is considered as Nu. 800 a kg, Peppermint Coated Cuts
Areca Nut sale price is at Nu. 900 kg and the sale price of clean & graded finest
cardamom pods kept at Nu. 1,750 a kg. Based on these prices, a total of Nu. 94.5
31 The Interest Rate for term loan and working capital loan is referenced from the rate of BNB, Bhutan,
available on https://www.bnb.bt/wp-content/uploads/dld/DOCUMENTS/interest-rates.pdf (Industrial
Loan capital/Term loan Interest rate 12% (fixed rate), working capital loan 13% (fixed rate).

Investment Opportunity Study 2020 Project Profile-Manufacture of Mouth fresheners
Page | 44
million is estimated as sales realization (at 100% production capacity). The details are
as follows:
Table_ 32: Sales Realization/Estimated Turnover
# Product for Sale Sale
Quantity
Annual
Rate (Nu. per Unit)
Total Amount
per Annum (Nu. in Lacs)
6. Mouth Freshener – Pan Masala 45 MT 800Kg. 360
7. Peppermint Coated Cuts Beetle
Nut
30 MT 900Kg. 270
8. Clean & Graded finest
Cardamom Pods
30 MT 1750Kg. 525
Total Sale/Turnover 105MT Rs.1155/-
2.21. Estimated Cost of Production and Profitability As per the above estimated economic parameters, the capital investment can be
shared between the investor (29%) and the remaining 71% as loan from a financial
institution. Working capital mainly consists of amount required to purchase raw
materials. Required margin money for this project is Nu. 3.5 million. For profitability
estimation, analysis of loan repayment capacity, and analysis of financial ratios for this
project, the following assumptions and relevant basis applicable to Bhutan have been
considered:
• Industrial Land32 in Bhutan is available on lease for up to maximum 30 years and
could be further renewed. The plots for industrial use are available in the
government developed industrial parks and estates at prominent locations as
such Thimphu, Samtse, Phuentsholing, Gelephu etc. Charges are considered at
Nu. 4 per square feet per annum for the first three years. In the fourth year the
rate is Nu. 6.00 (i.e. 50% increase). Subsequently, it increases @ 3% every year.
• The profitability projection has been worked out for 10 years at 70% capacity
utilization to be achieved during the first year till the third year and 80% from
the fourth year and 90% from the seventh years onwards up to 100% in the 10th
year.
• Repairs & maintenance have been taken at @ 3% per annum on plant &
machinery & misc. fixed assets.
• Bank interest rate33 has been calculated @ 12% per annum on term loan @ 13%
working capital loan.
32
https://www.bhutanenterprise.com/2018/06/03/investment-climate-in-bhutan/#:~:text=Lease%20rate%20for
%20Industrial %20Estate&text=4%20per%20square%20feet%20peri.e%2050%25%20increase%20on%20Nu. 33 The Interest Rate for term loan and working capital loan is referenced from the rate of BNB, Bhutan, available on
https://www.bnb.bt/wp-content/uploads/dld/DOCUMENTS/interest-rates.pdf (Industrial Loan capital/Term loan
Interest rate 12% (fixed rate), working capital loan 13% (fixed rate).

Investment Opportunity Study 2020 Project Profile-Manufacture of Mouth fresheners
Page | 45
• Insurance charges is @ 0.25% on all assets in first year and then decreases @ 5%
every year.
• Power & water charges are increased @ 5% every year.
• Administrative expenses have been increased @ 5% every year.
• Term loan has been considered @ 10% on building, @ 15% on plant &
machinery and @15% on misc. fixed assets.
• Bank loan has been considered for repayment in 7 years with one-year
moratorium.
• Preliminary expenses will be written off every year in the next 10 years.
• Pre-operative expenses will be written off beginning the second year.
• Depreciation has been charged using the Straight-Line Method.
• Insurance, lease rent & interest has been taken as fixed cost for calculating B.E.P.
• Income tax34 has been charged @ 30% every year as per Bhutan's tax rates.
• DSCR - debt service coverage ratio - is defined as net operating income divided
by total debt service.
34 Ministry of Finance - https://www.mof.gov.bt/faq/)

Investment Opportunity Study 2020 Project Profile-Manufacture of Mouth fresheners
Page | 46
2.22. Estimation of Project Profitability: (Nu.in Lacs)
Table_ 33: Estimation of Project Profitability
# Particulars 1st Yr. 2nd Yr. 3rd Yr. 4th Yr. 5th Yr. 6th Yr. 7th Yr. 8th Yr. 9th Yr. 10th Yr.
1 Installed Capacity@100% 1155.00 1155.00 1155.00 1155.00 1155.00 1155.00 1155.00 1155.00 1155.00 1155.00
2 Capacity Utilization 70% 70% 70% 80% 80% 80% 90% 90% 90% 100%
3 Actual Sales in lacs Nu. 808.50 808.50 808.50 924.00 924.00 924.00 1039.50 1039.50 1039.50 1155.00
4 Cost of Operation
4.1 Land Lease Charges 5.17 5.17 5.17 7.75 7.98 8.22 8.47 8.72 8.98 9.25
4.2 Raw Material 532.68 532.68 532.68 608.78 608.78 608.78 684.88 684.88 684.88 760.98
4.3 Consumables @ 3% 15.98 15.98 15.98 18.26 18.26 18.26 20.55 20.55 20.55 22.83
4.4 Power and Utility 27.60 28.98 30.43 31.95 33.55 35.23 36.99 38.84 40.78 42.82
4.5 Repair & Maintenance @3% 1.50 1.50 1.50 1.50 1.50 1.50 1.50 1.50 1.50 1.50
4.6 Salary & Wages 46.80 49.14 51.60 54.18 56.89 59.73 62.72 65.85 69.14 72.60
4.7 Fringe Benefits @15% 7.02 7.37 7.74 8.13 8.53 8.96 9.41 9.88 10.37 10.89
4.8 Insurance 1.00 1.00 1.00 1.00 1.00 1.00 1.00 1.00 1.00 1.00
4.9 Administration Expenses 7.00 7.35 7.72 8.10 8.51 8.93 9.38 9.85 10.34 10.86
Total 639.59 644.01 648.65 731.91 737.02 742.40 826.42 832.34 838.56 923.48
5 Marketing Expenses @10% (Sales) 80.85 80.85 80.85 92.40 92.40 92.40 103.95 103.95 103.95 115.50
6 Cost of Production 720.44 724.86 729.50 824.31 829.42 834.80 930.37 936.29 942.51 1038.98
7 Sale ( Estimated Turn Over) 808.50 808.50 808.50 924.00 924.00 924.00 1039.50 1039.50 1039.50 1155.00
8 Profit Before Interest and Depp. 88.06 83.64 79.00 99.69 94.58 89.20 109.13 103.21 96.99 116.02
9 Interest on Term Loan @12% 11.72 10.73 8.77 6.80 4.83 2.86 0.91 0.00 0.00 0.00
10 On Working Capital @13 % 8.09 8.09 8.09 8.09 8.09 8.09 8.09 8.09 8.09 8.09
11 Total Interest 19.81 18.83 16.86 14.89 12.92 10.96 9.00 8.09 8.09 8.09
12 Profit Before Depreciation. 68.25 64.81 62.14 84.80 81.65 78.25 100.13 95.11 88.89 107.93
13 Depreciation 11.80 10.20 8.84 7.67 6.67 5.82 5.09 4.46 3.93 3.46
14 Profit After Depreciation 56.45 54.61 53.30 77.13 74.98 72.42 95.04 90.65 84.97 104.47
15 Pre-operative Exp. W. Off 0.00 2.38 2.38 2.38 2.38 2.38 2.38 2.38 2.38 2.38
16 Preliminary Exp. W .Off 0.10 0.10 0.10 0.10 0.10 0.10 0.10 0.10 0.10 0.10
17 Profit before Taxation 56.35 52.13 50.82 74.65 72.50 69.95 92.56 88.17 82.49 101.99
18 Taxation @30% of Net Profit 16.90 15.64 15.25 22.40 21.75 20.98 27.77 26.45 24.75 30.60
19 Accumulated Profit 39.44 75.94 111.51 163.77 214.52 263.49 328.28 390.00 447.74 519.13
20 Profit after Taxation 39.44 36.49 35.58 52.26 50.75 48.96 64.79 61.72 57.74 71.39
21 Add : Depreciation 11.80 10.20 8.84 7.67 6.67 5.82 5.09 4.46 3.93 3.46
22 Add: Interest on Term Loan 11.72 10.73 8.77 6.80 4.83 2.86 0.00 0.00 0.00 0.00
Total (A) 62.96 57.43 53.18 66.73 62.26 57.65 69.88 66.18 61.67 74.85

Investment Opportunity Study 2020 Project Profile-Manufacture of Mouth fresheners
Page | 47
23 Interest on Term Loan 11.72 10.73 8.77 6.80 4.83 2.86 0.91 0.00 0.00 0.00
24 Repayment on Term Loan 0 16.40 16.40 16.40 16.40 16.40 15.65 0.00 0.00
Total (B) 11.72 27.13 25.17 23.20 21.23 19.26 16.56 0.00 0.00 0.00
Surplus (A) - (B) 51.25 30.30 28.01 43.53 41.03 38.39 53.32 66.18 61.67 74.85
DSCR (A/B) 5.37 2.12 2.11 2.88 2.93 2.99 4.22 0.00 0.00 0.00
Average DSCR 3.23
2.23. Calculation of Interest on Term Loan and Repayment (Nu. in Lacs): Table_ 34: Calculation of Interest on Term Loan and Repayment (Nu. in Lacs)
# Year Opening
Balance
Repayment Closing
Balance
Interest
1 1st year 97.65 0 97.65 11.72 11.72
2 2nd year
1st Qtr. 97.65 4.10 93.55 2.87
2nd Qtr. 93.55 4.10 89.45 2.75
3rd Qtr. 89.45 4.10 85.35 2.62
4th Qtr. 85.35 4.10 81.25 2.50 10.73
3 3rd year
1st Qtr. 81.25 4.10 77.15 2.38
2nd Qtr. 77.15 4.10 73.05 2.25
3rd Qtr. 73.05 4.10 68.95 2.13
4th Qtr. 68.95 4.10 64.85 2.01 8.77
4 4th year
1st Qtr. 64.85 4.10 60.75 1.88
2nd Qtr. 60.75 4.10 56.65 1.76
3rd Qtr. 56.65 4.10 52.55 1.64
4th Qtr. 52.55 4.10 48.45 1.52 6.80
5 5th year
1st Qtr. 48.45 4.10 44.35 1.39
2nd Qtr. 44.35 4.10 40.25 1.27
3rd Qtr. 40.25 4.10 36.15 1.15
4th Qtr. 36.15 4.10 32.05 1.02 4.83
6 6th year

Investment Opportunity Study 2020 Project Profile-Manufacture of Mouth fresheners
Page | 48
1st Qtr. 32.05 4.10 27.95 0.90
2nd Qtr. 27.95 4.10 23.85 0.78
3rd Qtr. 23.85 4.10 19.75 0.65
4th Qtr. 19.75 4.10 15.65 0.53 2.86
7 7th year
1st Qtr. 15.65 4.10 11.55 0.41
2nd Qtr. 11.55 4.10 7.45 0.29
3rd Qtr. 7.45 4.10 3.35 0.16
4th Qtr. 3.35 3.35 0.00 0.05 0.91
2.24. Break Even Point: Table_ 35: Break Even Point
# Particulars 1st Yr. 2nd Yr. 3rd Yr. 4th Yr. 5th Yr. 6th Yr. 7th Yr. 8th Yr. 9th Yr. 10th Yr.
1 Calculation of B.E.P.
Variable Cost 658.62 660.00 661.45 752.90 754.50 756.17 847.86 849.71 851.66 943.63
Fixed Cost 98.60 99.06 98.92 101.72 102.51 103.62 105.06 107.86 111.86 116.16
2 Break Even Point (B.E.P.) 65.79% 66.71% 67.27% 59.45% 60.48% 61.74% 54.83% 56.83% 59.55% 54.96% Average B.E.P. 60.76%
2.25. Projected Balance Sheet for the Project (10 Year): Table_ 36: Projected Balance Sheet
# Description Construction
Period
Operation Period in Years
0 1st Yr. 2nd Yr 3rd Yr 4th Yr 5th Yr 6th Yr 7th Yr 8th Yr 9th Yr 10th Yr
1 Liabilities
1.1 Equity 40.71 40.71 40.71 40.71 40.71 40.71 40.71 40.71 40.71 40.71 40.71
1.2 General reserves 0 39.44 75.94 111.51 163.77 214.52 263.49 328.28 390.00 447.74 519.13
1.3 Debt 97.65 97.65 81.25 64.85 48.45 32.05 15.65 0.00 0.00 0.00 0.00
1.4 Current Liabilities 0.00 0.46 0.51 0.50 0.50 0.50 0.50 0.50 0.50 0.50 0.50
1.5 Working Capital Loan 0.00 62.26 62.26 62.26 62.26 62.26 62.26 62.26 62.26 62.26 62.26
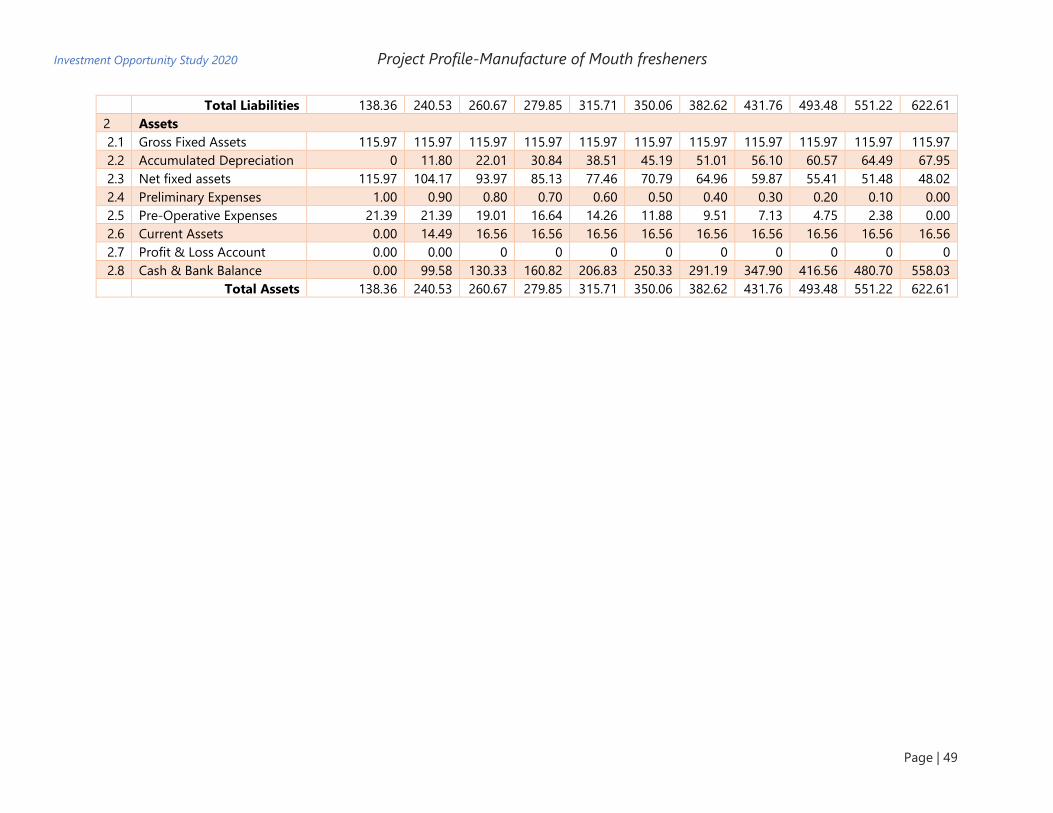
Investment Opportunity Study 2020 Project Profile-Manufacture of Mouth fresheners
Page | 49
Total Liabilities 138.36 240.53 260.67 279.85 315.71 350.06 382.62 431.76 493.48 551.22 622.61
2 Assets
2.1 Gross Fixed Assets 115.97 115.97 115.97 115.97 115.97 115.97 115.97 115.97 115.97 115.97 115.97
2.2 Accumulated Depreciation 0 11.80 22.01 30.84 38.51 45.19 51.01 56.10 60.57 64.49 67.95
2.3 Net fixed assets 115.97 104.17 93.97 85.13 77.46 70.79 64.96 59.87 55.41 51.48 48.02
2.4 Preliminary Expenses 1.00 0.90 0.80 0.70 0.60 0.50 0.40 0.30 0.20 0.10 0.00
2.5 Pre-Operative Expenses 21.39 21.39 19.01 16.64 14.26 11.88 9.51 7.13 4.75 2.38 0.00
2.6 Current Assets 0.00 14.49 16.56 16.56 16.56 16.56 16.56 16.56 16.56 16.56 16.56
2.7 Profit & Loss Account 0.00 0.00 0 0 0 0 0 0 0 0 0
2.8 Cash & Bank Balance 0.00 99.58 130.33 160.82 206.83 250.33 291.19 347.90 416.56 480.70 558.03
Total Assets 138.36 240.53 260.67 279.85 315.71 350.06 382.62 431.76 493.48 551.22 622.61

Investment Opportunity Study 2020 Project Profile-Manufacture of Mouth fresheners
Page | 50
2.26. Environment Consideration Maintaining and sustaining the environment is of paramount importance for this project.
The manufacturing process contains no harmful ingredient. It will not create any effluent
and chemical waste. However, the plant is designed to be environment friendly and
prioritises to maintain neat and clean atmosphere through its industrial process activities.
It’s an eco-plant and environment management system ISO 14001 will be implemented
and followed strictly to ensure that there is no compromise in environment management.
Mostly husk of the areca nut will be generated which can be used as fuel. Other small
disposal of any effluent will be recycled to ensure that these does not cause hazard at the
vicinity of the site.
2.27. Conclusion Bhutan can serve as a domestic market and while the foreign markets include India,
Bangladesh, Sri Lanka and Nepal. Mouth fresheners are traditionally popular in these
countries. A large regional population along with rising disposable incomes makes the
region an ideal market for Mouth Freshener products.
Moreover, high quality product, affordable price, convenient packaging, easy availability,
competitive marketing as well as the shift from tobacco to tobacco-free products offers
the potential to create a good market for Mouth Freshener products.
The suggestive products will be available in hygienic and attractive foil packets (sachets)
and tins which are easy to store and carry.
Working capital mainly consists of amount required to purchase raw materials. The capital
investment can be arranged by the investor investing 29% with the remaining coming as
loan from banks. The required margin money for this project is Nu. 3.5million with a rate
of return at 37.52% with a payback period of 32 months.
It needs about 24 employees include managerial staff, skill and unskilled staff to operate
the plant. The Financial ratios are positive during the first 7 years of operation. The average
DSCR is 3.23 indicating the project to generate sufficient funds to cover its cost, including
loan repayments and its interest.
Based on the estimation of project cost and financial analysis, production of mouth
freshener (flavored Areca nut and Cardamom) unit is financially viable, and profitable with
a good rate of return.
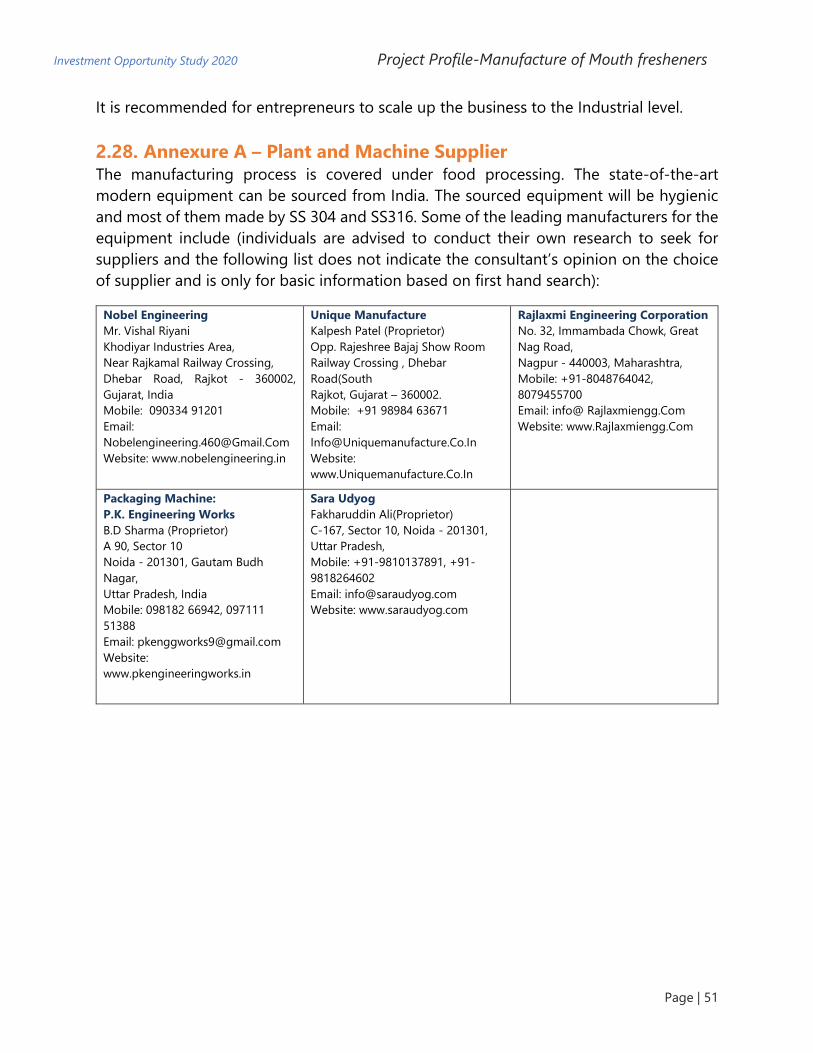
Investment Opportunity Study 2020 Project Profile-Manufacture of Mouth fresheners
Page | 51
It is recommended for entrepreneurs to scale up the business to the Industrial level.
2.28. Annexure A – Plant and Machine Supplier The manufacturing process is covered under food processing. The state-of-the-art
modern equipment can be sourced from India. The sourced equipment will be hygienic
and most of them made by SS 304 and SS316. Some of the leading manufacturers for the
equipment include (individuals are advised to conduct their own research to seek for
suppliers and the following list does not indicate the consultant’s opinion on the choice
of supplier and is only for basic information based on first hand search):
Nobel Engineering
Mr. Vishal Riyani
Khodiyar Industries Area,
Near Rajkamal Railway Crossing,
Dhebar Road, Rajkot - 360002,
Gujarat, India
Mobile: 090334 91201
Email:
Website: www.nobelengineering.in
Unique Manufacture
Kalpesh Patel (Proprietor)
Opp. Rajeshree Bajaj Show Room
Railway Crossing , Dhebar
Road(South
Rajkot, Gujarat – 360002.
Mobile: +91 98984 63671
Email:
Website:
www.Uniquemanufacture.Co.In
Rajlaxmi Engineering Corporation
No. 32, Immambada Chowk, Great
Nag Road,
Nagpur - 440003, Maharashtra,
Mobile: +91-8048764042,
8079455700
Email: info@ Rajlaxmiengg.Com
Website: www.Rajlaxmiengg.Com
Packaging Machine:
P.K. Engineering Works
B.D Sharma (Proprietor)
A 90, Sector 10
Noida - 201301, Gautam Budh
Nagar,
Uttar Pradesh, India
Mobile: 098182 66942, 097111
51388
Email: [email protected]
Website:
www.pkengineeringworks.in
Sara Udyog
Fakharuddin Ali(Proprietor)
C-167, Sector 10, Noida - 201301,
Uttar Pradesh,
Mobile: +91-9810137891, +91-
9818264602
Email: [email protected]
Website: www.saraudyog.com

Investment Opportunity Study 2020 Project Profile-Manufacture of Mouth Fresheners
Page | 52
2.29. Annexure “B” Raw Material Supplier in Bhutan • Food Corporation of Bhutan
Post Box No.80
Phuentsholing, Bhutan
Tel : 00-975-5-252241 / 252429
www.fcbl.bt
• Tashi Commercial Corporation
Post Box No. 78
Phuentsholing, Bhutan
Tel : +975 17 60 61 99
• C. Dorji Enterprise
Post Box No. 803
Thimphu, Bhutan
Contact : Mr. Chencho Dorji
Tel : +975-2-323371
• Sonam Rinchen Tshongkhang
Post Box No. 337
Thimphu, Bhutan
Contact : Mr. Jochu Dukpa
Tel : 00-975-2-322942
• Gyaltshen Trading Corporation
Post Box No. 310
Thimphu, Bhutan
Contact : Mr. Tshewang Dorji
Telefax : +975-2-324226
• Bhutan Fruit Products Ltd.
Samtse, Bhutan
Tel : +975-5-365294
• Phoju Tshongkhang
Post Box No. 320
Thimphu, Bhutan
Contact Mr. Phoju
Tel : +975-2-322887
• Ugyen C. Tshongkhang
Thimphu, Bhutan
Contact : Mr. Gayiey Nima
Tel : +975-2-325161
• Rinzin Tshongkhang
Thimphu, Bhutan
Contact : Mr. Tempa
Tel : +975-2-322968
• Phub Dorji Tshongkhang
Thimphu, Bhutan
Contact : Mr. Phub Dorji
Tel : +975-2-323650 / 321771
• Ugyen Tshongkhang
Thimphu, Bhutan
Contact : Mr. Ugyen
Tel : +975 17 83 29 55
• Chapchap Dorgan Enterprise
Upper Market
Phuentsholing, Bhutan
Contact : Mr. Thinley Dorji
Tel : +975-5-252167
• Lhaki Group Organization
Post Box No. 179
Thimphu, Bhutan
Contact : General Manager
Tel : 00-975-2-322570
Bhutan Agro Industries Ltd.
P.O. Box No. 329
Thimphu, Bhutan
Tel : +975-2-351078 /357081
E-mail : [email protected]
Additional Reference: www.mof.gov.bt
a. Reference for Equipment
https://www.indiamart.com/siddhapuraengineeringrepairing/sizer.html
https://www.indiamart.com/aayushengineeringworks/cardamom-washing-machine.html
https://www.indiamart.com/proddetail/automatic-betel-nut-cutting-machine-10863301612.html
b. Salary References
http://www.salaryexplorer.com/salary-survey.php?loc=25&loctype=1&job=226&jobtype=3
https://www.nationalcouncil.bt/assets/uploads/docs/download/2015/Wage_Rates_Eng.pdf
https://www.payscale.com/research/BT/Location=Thimphu/Salary
c. Raw Material Source:
https://www.flipkart.com/veg-e-wagon-pan-masala-200-gm-mouth-freshener/p/itmf3uhas2vpb66y
https://www.bigbasket.com/pb/chandan/mukhwas/
https://www.commodityonline.com/market-place/cardamom-sell-
leads/130#:~:text=We%20are%20selling%20cardamom%20in,1800%2D2500%2Fkg.

Investment Opportunity Study 2020 Project Profile-Manufacture of Essential Oils
Page | 53
Project Title: Manufacturing Plant of Essential
Oils
(Ginger & Cardamom)
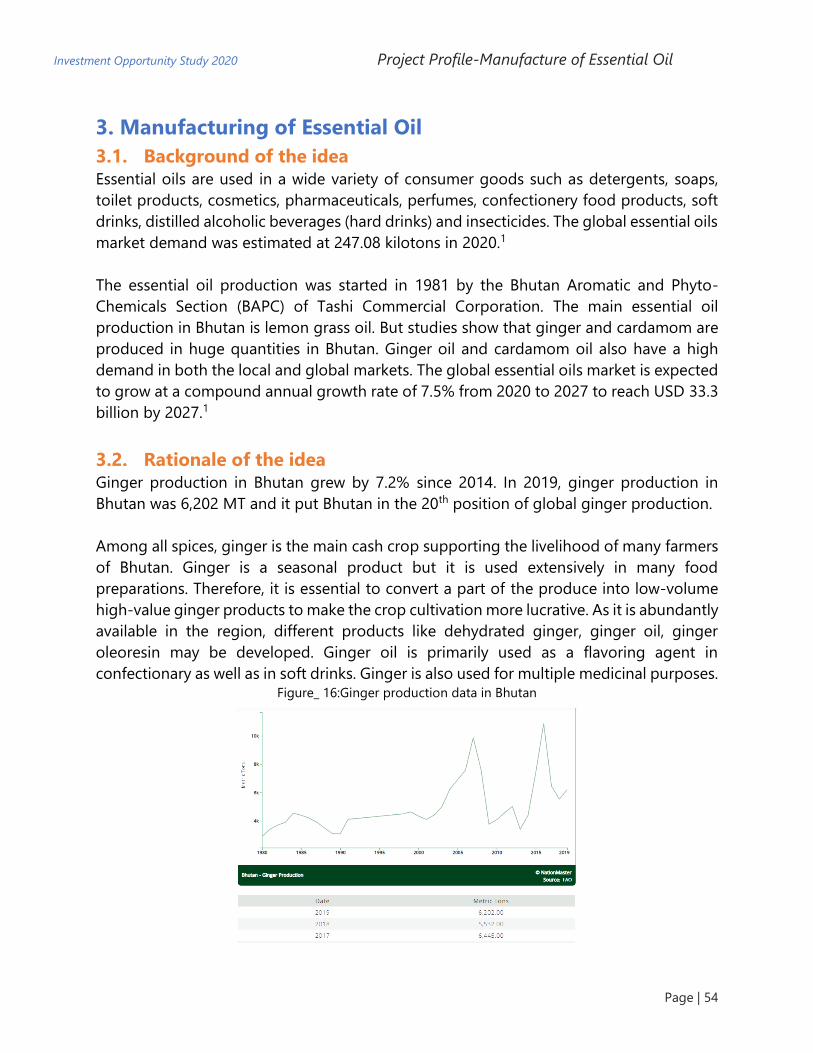
Investment Opportunity Study 2020 Project Profile-Manufacture of Essential Oil
Page | 54
3. Manufacturing of Essential Oil
3.1. Background of the idea Essential oils are used in a wide variety of consumer goods such as detergents, soaps,
toilet products, cosmetics, pharmaceuticals, perfumes, confectionery food products, soft
drinks, distilled alcoholic beverages (hard drinks) and insecticides. The global essential oils
market demand was estimated at 247.08 kilotons in 2020.1
The essential oil production was started in 1981 by the Bhutan Aromatic and Phyto-
Chemicals Section (BAPC) of Tashi Commercial Corporation. The main essential oil
production in Bhutan is lemon grass oil. But studies show that ginger and cardamom are
produced in huge quantities in Bhutan. Ginger oil and cardamom oil also have a high
demand in both the local and global markets. The global essential oils market is expected
to grow at a compound annual growth rate of 7.5% from 2020 to 2027 to reach USD 33.3
billion by 2027.1
3.2. Rationale of the idea Ginger production in Bhutan grew by 7.2% since 2014. In 2019, ginger production in
Bhutan was 6,202 MT and it put Bhutan in the 20th position of global ginger production.
Among all spices, ginger is the main cash crop supporting the livelihood of many farmers
of Bhutan. Ginger is a seasonal product but it is used extensively in many food
preparations. Therefore, it is essential to convert a part of the produce into low-volume
high-value ginger products to make the crop cultivation more lucrative. As it is abundantly
available in the region, different products like dehydrated ginger, ginger oil, ginger
oleoresin may be developed. Ginger oil is primarily used as a flavoring agent in
confectionary as well as in soft drinks. Ginger is also used for multiple medicinal purposes. Figure_ 16:Ginger production data in Bhutan

Investment Opportunity Study 2020 Project Profile-Manufacture of Essential Oil
Page | 55
Large cardamom (Amomum Subulatum) is a traditional spice with global production
largely limited to eastern Himalayan region spread over Northeast India, Eastern Nepal
and South-West Bhutan. Large cardamom is a subtropical crop grown in sloppy and moist
areas of these region sharing similar climatic conditions making production suitable.
Large cardamom is one of the major export commodities of Bhutan. The Bhutanese
produce is known for its high natural qualities containing 2-3% essential oil which is its
most desired flavoring property. It also has other properties like carminative, stomachic,
diuretic, cardiac stimulant and antiemetic.
Cardamom plantation in Bhutan covers an area of about 13,880 acres with an annual
production of 6,202 MT in 2019. Samtse, Chukha, Dagana, Tsirang, Sarpang and Trongsa
are the major large cardamom growing Dzongkhags. Large cardamom is grown only in
India, Nepal and Bhutan which lie in the sub-Himalayan region in south-east Asia. Bhutan
is third after Nepal and India in production of large cardamom in the world3.
Cardamom oil is an essential spice oil. It has very good flavor and has a major use in the
pharmaceutical industry, cosmetic industry, food industries etc.
For the production of oil, a steam distillation apparatus is required. It is used in biscuits,
bakery, canning, chewing gum, confectionery, perfumery, cosmetics, soaps and soft drink
industries. There is a very good domestic and export market for cardamom oil. Any
entrepreneur can enter in the field of manufacture of cardamom oil to be successful as
the rate of return is 137% as per the project costing.
Table_ 37: Quantity of cardamom procured through buyback and marketed1
# Dzongkhag Volume (Kg.) Amount (Nu) Av. Production
Per Kg.
No. of
producers
benefited
1. Trongsa 3,009.14 305,043.25 433.69 33
2. Zhemgang 7,494.08 3,164,348.45 422.25 74
3. Chhukha 1,928.60 819,871.50 425.22 7
4. Samtse 1,637.20 699,179.50 427.06 16
5. Sarpang 3,127.30 1,327,284.50 424.42 45
6. Samdrupjongkhar 5,648.92 2,282,339.90 404.03 68
7. Tsirang 6,514.00 2,771,203.30 425.42 114
8. Dagana 20,666.80 8,371,673.50 405.08 192
Total 50,026.04 20,740,943.90 414.60 459

Investment Opportunity Study 2020 Project Profile-Manufacture of Essential Oil
Page | 56
According to the Bhutan Trade Statistics 2019 Report, Bhutan has imported essential oils
and resinoids; perfumery, cosmetic or toilet preparation, worth of Nu. 475 million. In 2017,
imports were worth of Nu. 365 million. It shows an increase in the imports of essential oil
by Nu 110 million between 2017 and 2019. It would also trigger in getting a higher value
in the export market. Ginger and cardamom essential oils have a great potential and offers
a new segment for investment opportunity in Bhutan.
3.3. Market Analysis The global essential oils market demand was estimated at 247.08 kilotons in 2020 and is
expected to grow at a compound annual growth rate (CAGR) of 7.5% from 2020 to 202735.
The market is expected to be driven by increasing demand from major end-use industries,
such as food and beverage, personal care and cosmetics, and aromatherapy. Several
health benefits related to essential oils are projected to drive their demand in
pharmaceutical and medical applications.
Unlike most of the conventional medicines and drugs, essential oils have no major side
effects. Such traits of essential oils are projected to be the major factor for market growth.
In addition, rising prevalence of health problems, such as cardiovascular problems,
Alzheimer’s, and bronchitis, is creating more demand for beneficial essential oils in
aromatherapy applications.
Table_ 38: Essential Oils Business Trade, Bhutan
Description India Other Countries
Export 7,297,244 6,596,306
Import 349,563,462 125,799,232
Year 2019 - Value in Nu.
Using above data from the Bhutan Trade Statistics 2019, there is a huge import of
essential oils and resinoids as compared to exports. There is a phenomenal possibility for
import substitution. Bhutan imports huge amount of essential oil and resinoids from
India and other countries.
3.3.1. Bhutan Essential Oil – Market Scenario4
“Kingdom Essences” a.k.a K. Essences promotes natural/indigenous healing through the
use of pure, essential oils extracted from medicinal and aromatic plants. The Kabab
Organic Farm in Trongsa was started with the vision to produce natural food products,
create employment and improve rural livelihoods.
35 https://www.grandviewresearch.com/industry-analysis/essential-oils-market

Investment Opportunity Study 2020 Project Profile-Manufacture of Essential Oil
Page | 57
3.3.2. Demand and Supply
Bhutan's production and trade of lemon grass oil was introduced and initially carried out
by the Aromatic and Phytochemicals Section of Tashi Commercial Corporation in 1983
and 1984. The oil was processed by steam distillation using a low-cost, cottage-type
distillery made from second-hand petrol drums.
Tashi Commercial Corporation now has a large distilling unit at Kurizampa and has sold
large number of smaller units to the farmers from whom the company now buys the oils.
The company also buys lemon grass collected from the wild and delivered to road sides.
According to the Bhutan Trade Statistics 2019, Annual Report, Bhutan imported Essential
oils and resinoids; perfumery, cosmetic or toilet preparation worth of Nu. 475 million.
In 2017, Bhutan imported essential oils worth of Nu. 365 million indicating an increase in
imports. Bhutan’s export is very less compared to imports.
Therefore, it is clear from the above information that the demand for essential oils are
very high nationally and internationally.
3.4. The Concept The penetration strategy for ginger and cardamom essential oils is to target customers
under one brand name like Brand Bhutan. Essential oils are used in a wide variety of
consumer goods such as detergents, soaps, toilet products, cosmetics, pharmaceuticals,
perfumes, confectionery food products, soft drinks, distilled alcoholic beverages and
insecticides.
Phase First:
• Ginger and Cardamom Oils: 15ml, 30ml, 50ml

Investment Opportunity Study 2020 Project Profile-Manufacture of Essential Oil
Page | 58
3.5. Process Technology of Essential Oils (Ginger & Cardamom):
Figure_ 17:Process Technology of Essential Oils
SELECTION OF FRESH GINGER RHIZOMES
WASHING TO REMOVE THE ADHERING IMPURITIES
PEELING/TREATING IN LIME WATER SOLUTION
SLICING
DRYING
PULVERISING OF DRIED GINGER
STEAM DISTILLATION FOR EXTRACTION OF OIL
FILTERING AND PACKING

Investment Opportunity Study 2020 Project Profile-Manufacture of Essential Oil
Page | 59
3.5.1. Ginger Oil36
Dry ginger is pulverized using grinder to get the
required mesh size. Steam distillation is the
preferred method for all essential oils produced in
large quantities. The steam, produced in a boiler is
introduced into an evaporation vessel which
contains the ginger powder and water. The ginger
powder is located on a grid placed at a certain
distance above the water level which fills the
bottom of the vessel. The water is vaporized
indirectly, by steam flowing in a pipe coil
submerged under water. The water vapor plus the
distilled oil coming from the evaporator vessel is
recovered in a separate water-cooled condenser.
This mixture flowing out of the condenser is separated by decantation in a Florentine
Flask. The essential oil is collected at the top and distilled water is left at the bottom of
the flask. As the water still contains some soluble parts of the oil, it is sent back to the
evaporator vessel to recover the soluble components by means of second distillation
process.
3.5.2. Cardamom oil extraction process37
The essential oil of cardamom is extracted by steam distillation from the seeds of the fruit
gathered just before they are ripe. The yield is 1-5 %. Extraction of essential oils from
cardamom is carried out by solvent extraction and steam distillation methods.
3.5.3. Steam Distillation Extraction
The grounded powder (150 g) and 500ml
distilled water are mixed in round bottomed
flask and heated for 5.0 hours to yield essential
oil. The collected extract is separated using a
separating funnel by holding it for 10 minutes in
order to separate the essential oil.
3.5.4. Solvent Extraction
The coarse powdered sample is extracted with
petroleum ether and kept in Soxhlet apparatus
bottom flask in 1:2 w/v, ratio for 24 hours. The
36 https://www.nedfi.com/sites/default/files/Project_Profile/Ginger%20Processing.pdf 37 http://www.chemijournal.com/archives/2018/vol6issue2/PartAM/6-2-296-678.pdf
Figure_ 18:Ginger Essential Oil
Figure_ 19: Cardamom Essential Oil

Investment Opportunity Study 2020 Project Profile-Manufacture of Essential Oil
Page | 60
collected extract is concentrated in hot air oven at 40°C. The essential oil obtained is
weighed and kept at 4°C until further analysis.
3.6. Plant Capacity and Parameters Plant capacity is assessed with final output manufacturing of annual 4.01 million litres
production of essential oil considering investment, technology, skill sets and expansion
plan, Bhutan industrial development demand and supply projections etc.
Plant will operate in single shift 8-hour production cycle in 300-day years. The detailed
plant capacity planning is as follows: Table_ 39: Estimated Plant Capacity
Product Plant Capacity Per Month Annual Capacity
Start Up Plan
Ginger essential oil 350 Liters / Month 4200 Liters
Cardamom essential oil 150 Liters / Month 1800 Liters
3.7. Plant Equipment’s Equipment used for manufacturing of essential oil include Solar Cabinet Dryer- 200 Skin
Peeling Machine, Steam Distillation Unit, Baby Boiler, Steam Jacketed Kettle, Aluminum
Top Working Tables, Sealing Machine, Gas Burners, Washing Tanks, SS Utensils, Weighing
Scales, Aluminum Trays, Plastic Tubs and Laboratory Equipment Weighing Machine etc.
The required machines and equipment for this plant can be sourced from Maharashtra,
Dhanbad, New Delhi, Surat etc.
3.8. Equipment Cost and Financial Trends: Essential Oil Manufacturing The proposed business idea is based to provide a range of essential oils. After the suitable
establishment of market network, additional products can be planned in second phase
for manufacturing.
The project is suggested to be under small industries. The required land for this
manufacturing plant is 1,000 m2 with two halls for production process, quality control,
store room, office etc. It can be arranged on a lease basis. The equipment cost and
financial trends are presented below:
Table_ 40: Plant Standards
# Type of Industry Large Scale (>Nu. 10 million)
1. Employment Size 22
2. Land (1,000 m2) and Building On lease
3. Building & Construction Nu. 38.95 Lacs

Investment Opportunity Study 2020 Project Profile-Manufacture of Essential Oil
Page | 61
4. Equipment and Machinery Cost: Nu. 58.75 Lacs
5. Raw Material Cost Nu. 575.89 Lacs
6. Break Even Point (BEP) 29 Months
7. Average Return on Investment 40.80%
8. GST Tax Rate in India 18%
9. Market Biscuits, Bakery, Canning, Chewing Gum,
Confectionery, Perfumery, Cosmetics,
Soaps, Soft Drink industries and
Pharmaceutical Companies etc.
10. Export Opportunity Bhutan Border States of India and Saudi
Arabia and Gulf Countries.
11. Required Systems and Licenses
12. Quality Management ISO 9001:2015
13. Environment Management ISO 14001
14. GMP Certification for Export Good Manufacturing Practice
15. Products Cover in Indian Act Drugs and Cosmetics act by the Act 68
of 1982 - 1983
16. BIS Number – India IS 7669, BIS IS 2888: 2004(R2016)
17. Bhutan Environment Clearance and Other
Regulatory Act Registration and
Certificates.
18. Export Requirement to US & Europe WHO- GMP (Good manufacturing
practices)
19. Export to Gulf Countries Needs HALAL certification
20. Export to India FSSAI – APEDA
21. Export – Import Duty to India Trade between India and Bhutan is not
subjected to customs duties.
The total investment requirement is estimated at about Nu. 14.1 million out of which Nu.
5.9 million is required for plant and machinery including laboratory and R& D equipment
for manufacturing of essential oil.
This plant can be operated in 1,000 m2 land area with a storage area (for raw materials as
well as to store finished goods), processing and packaging. It can be arranged on a lease
basis. Working capital is mainly consists of the amount required to purchase raw material.
The financial burden can be shared with the investor bearing 36% and the remaining
around 64% as loan from financial institutes. Required margin money for this project is
Nu. 3.4 million. Rate of return is 40.80% with BEP of 29 months.

Investment Opportunity Study 2020 Project Profile-Manufacture of Essential Oil
Page | 62
It needs around 22 employees including Manager, Accounts and Administration,
Advertising and Marketing, Reception and Office Support, Skilled Worker, Unskilled
Worker, Drivers, and Security to operate the plant.
3.9. Estimated Project Cost and Financials The total cost of the project has been considered at Nu. 14.13 million. The break-even
months are 29, and the D.S.C.R value is 3.48 showing that the project will generate enough
to pay loans. Other details are as follows:
Table_ 41: Financial Trends
# Description Amount (Nu. In Lacs)
1. Establishment Cost 141.37
2. Cost of Operation
2.1 Fixed Cost 64.99
a. Salary & Wages 46.80
b. Overhead Cost 18.19
2.2 Variable Costs 615.91
a. Raw Material 575.89
b. Other Variable Cost 40.02
3. Break Even Point 54.75%
4. Payback Period 29 Months
5. D.S.C.R. 3.48
6. NPR 18.59%
7. Return on Investment 40.80%
3.10. Project Cost The cost of project is estimated as a total value of land, building and civil construction,
plant and machinery, MFA, preliminary expenses, pre-operative expenses and
contingency. The required land is around 1,000 m2. Estimated cost for building and civil
construction is Nu. 3.9 million which is about 27.55% of the project cost. Plant and
Machinery cost is around Nu. 5.9 million which is about 41.5% of the project cost. Margin
money for working capital is not considered as part of project cost. The summary of the
project cost is given below:
Table_ 42: Head Wise Project Cost and Sharing Percentage
# Particulars Value (Nu. in Lacs)
Cost Sharing
1. Building & Civil Construction 38.95 27.55%
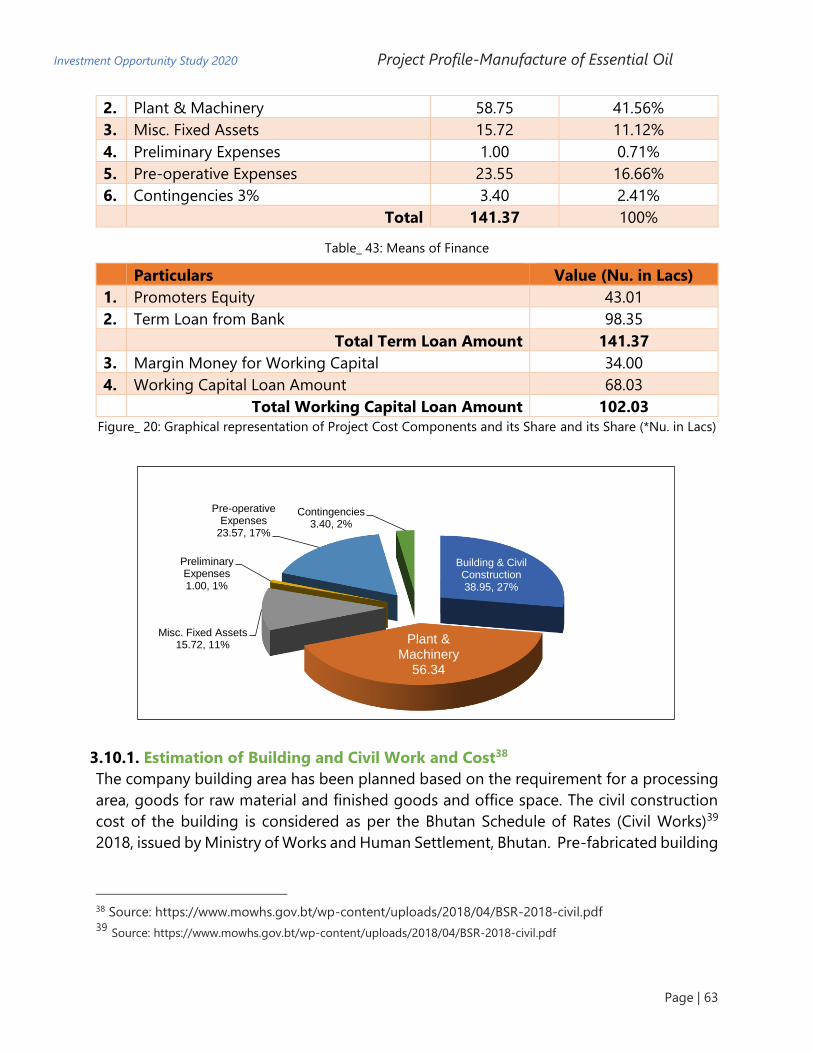
Investment Opportunity Study 2020 Project Profile-Manufacture of Essential Oil
Page | 63
2. Plant & Machinery 58.75 41.56%
3. Misc. Fixed Assets 15.72 11.12%
4. Preliminary Expenses 1.00 0.71%
5. Pre-operative Expenses 23.55 16.66%
6. Contingencies 3% 3.40 2.41%
Total 141.37 100%
Table_ 43: Means of Finance
Particulars Value (Nu. in Lacs)
1. Promoters Equity 43.01
2. Term Loan from Bank 98.35
Total Term Loan Amount 141.37
3. Margin Money for Working Capital 34.00
4. Working Capital Loan Amount 68.03
Total Working Capital Loan Amount 102.03
Figure_ 20: Graphical representation of Project Cost Components and its Share and its Share (*Nu. in Lacs)
3.10.1. Estimation of Building and Civil Work and Cost38
The company building area has been planned based on the requirement for a processing
area, goods for raw material and finished goods and office space. The civil construction
cost of the building is considered as per the Bhutan Schedule of Rates (Civil Works)39
2018, issued by Ministry of Works and Human Settlement, Bhutan. Pre-fabricated building
38 Source: https://www.mowhs.gov.bt/wp-content/uploads/2018/04/BSR-2018-civil.pdf 39 Source: https://www.mowhs.gov.bt/wp-content/uploads/2018/04/BSR-2018-civil.pdf
Building & Civil Construction 38.95, 27%
Plant & Machinery
56.34
Misc. Fixed Assets 15.72, 11%
Preliminary Expenses1.00, 1%
Pre-operative Expenses
23.57, 17%
Contingencies 3.40, 2%

Investment Opportunity Study 2020 Project Profile-Manufacture of Essential Oil
Page | 64
structure will be used for construction building amenities. The details of Building and
Construction is given below:
Figure_ 21: Table 8: Building and Civil Work
# Particular Dimensions (Mt.)
Area (Sq. Mt.)
Rate Per (Nu. /Sq.
Mt.)
Amount (Nu.in Lacs)
1. Production Area
(Main Shed) height 16 feet (5Mt.)
50 40 2000.00 750 15.00
2. Raw Material Storage 40 30 1200.00 600 7.20
3. Packaging Section 20 15 300.00 600 1.80
4. Finished Goods Storage 25 18 450.00 600 2.70
5. Laboratory 15 10 150.00 600 0.90
6. Office Space 18 15 270.00 600 1.62
7. Facilities + Utility + Pantry 20 15 300.00 600 1.80
8. Security & Time office 10 10 100.00 600 0.60
9. Boundary wall (130 Rm with
height of 3m (10 ft) and 1 ft
Thick).
412 10 4120.00 150.00 6.18
10. Parking Area 40 30 1200.00
0.50
11. Space for Sun Drying 70 50 3500.00
0.30
12. Green Belt Development 35 25 882.00
13. Entrance Gate - 15 feet wide and
Name Sign Board
Entrance Gate - 15 feet wide and Name Sign
Board
1 35000 0.35
Grand Total 3400 38.95
3.10.2. Plant and Machinery Cost
The cost estimates for plant and machinery have been worked out based on the cost
figures received from the Indian plant machinery suppliers. The prices are considered
without Indian GST tax as it is exempted under supply of trade agreement between India
and Bhutan (Category Export). Installation and commissioning of equipment are
considered separately in the total plant and machinery cost estimation. Freight and
insurance have been considered with the assumption that all goods are transported by
road. Goods of import origin would be handled at the port in Kolkata. The equipment list
with cost is given in the table below:
Table_ 44: Table 9: Plant & Machinery with Cost
# Plant & Machinery Qty. Rate Amount

Investment Opportunity Study 2020 Project Profile-Manufacture of Essential Oil
Page | 65
(Nu. in Lacs)
1. Polycarbonate solar dryer (Size 9m*15m) 1 650000 6.50
2. Garlic Peeler (30 to 100 kg/Hr.) 1 350000 3.50
3. Cardamom Peeling Plant (100 kg - 200 kg/Hr.) 1 300000 3.00
4. Essential Oil Distillation Unit, Automation
Grade: Semi-Automatic (Capacity: 100- 1000
Liters /Day)
2 535000 10.70
5. Boiler (Capacity: Up to 500 Kg/hr. with safety
equipment's and Accessories)
1 500000 5.00
6. Stainless Steel Jacketed Kettle (50 Lt.) 4 250000 10.00
7. Industrial Working Table (MOC Aluminum) 5 20000 1.00
8. Glass Bottle Filling Sealing Machine 1 370000 3.70
9. Industrial Gas Burners 4 15000 0.60
10. Washing Tanks, SS Utensils, Weighing Scales,
Aluminum Trays, Plastic Tubs and Laboratory
Equipment
1 300000 3.00
11. Laboratory and testing Equipment 1 300000 3.00
Total 50.00
12. Packaging and Forwarding @7.5% 3.75
13. Erection and Commissioning @10% 5.00
Grand Total 58.75
3.10.3. Misc. Fixed Assets
A miscellaneous fixed asset includes office equipment and furniture, computer and
peripherals, firefighting equipment, vehicle etc. Nu. 1.6 million has been estimated under
this head “MFA” and presented in the table below:
Table_ 45: Misc. Fixed Assets
# Particulars Qty. Rate (Nu.in Lacs)
Amount (Nu.in lacs)
1. Office Equipment, Laptop, Printer &
Software's, CCTV Camera and Systems
1 4.00 4.00
2. Furniture & Fixture with Interior Items 1 3.00 3.00
3. Fire Fighting Equipment's 1 0.60 0.60
4. Ventilation - Exhaust fans 4 0.03 0.12
5. Tata Mini Truck 1 8.00 8.00
Total 15.72

Investment Opportunity Study 2020 Project Profile-Manufacture of Essential Oil
Page | 66
3.10.4. Preliminary Expenses
Preliminary expenses are those expenses which are incurred before the incorporation and
commencement of the business. These are treated as deferred revenue expenditure.
These expenses are marked written off in the next ten years in estimation of profitability.
The preliminary Expenses details are as follows:
Table_ 46: Preliminary Expenses
# Particular Amount (Nu.in Lacs)
1. Company formation expenses (ROC) and formalities 1.00
Total 1.00
3.10.5. Pre-operative Expenses
These are expenses incurred prior to the commencement of commercial production. A
total of Nu. 2.4 million is estimated under this project. The details are given in the table
below:
Table_ 47: Preliminary Expenses
# Particular Amount (Nu.in Lacs)
1. Interest up to production for 1 Year on term loan 4.32
2. Insurance during construction period (0.25% of factory assets) 0.56
3. Electricity charges construction period 1.50
4. Salary during construction period 1.00
5. Marketing launch expenses 2.00
6. Quality and Environment Management Certification Export Market -
GMP
7.00
7. Project consultancy fees @5% of project cost 5.67
8. Travelling Expenses for Project Implementation 1.10
9. Registration of Trade Mark and Patent 0.40
Total 23.55
3.10.6. Cost of Raw Material
The cost of raw material consists of the cost of the main ingredients, raw material and
cost of packaging. The annual raw material cost is based on the present average market
prices in Bhutan. A total of Nu. 57.6 million has been estimated as raw material cost. The
details are given in the table below:
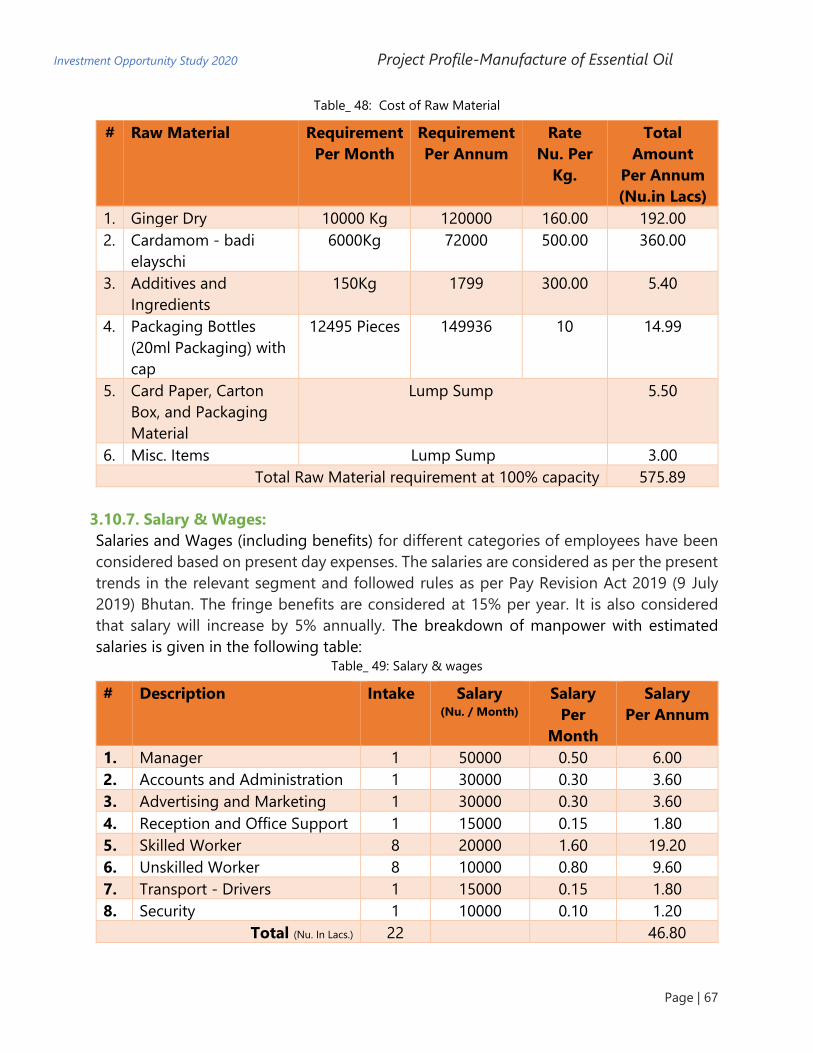
Investment Opportunity Study 2020 Project Profile-Manufacture of Essential Oil
Page | 67
Table_ 48: Cost of Raw Material
# Raw Material Requirement
Per Month
Requirement
Per Annum
Rate
Nu. Per
Kg.
Total
Amount
Per Annum
(Nu.in Lacs)
1. Ginger Dry 10000 Kg 120000 160.00 192.00
2. Cardamom - badi
elayschi
6000Kg 72000 500.00 360.00
3. Additives and
Ingredients
150Kg 1799 300.00 5.40
4. Packaging Bottles
(20ml Packaging) with
cap
12495 Pieces 149936 10 14.99
5. Card Paper, Carton
Box, and Packaging
Material
Lump Sump 5.50
6. Misc. Items Lump Sump 3.00
Total Raw Material requirement at 100% capacity 575.89
3.10.7. Salary & Wages:
Salaries and Wages (including benefits) for different categories of employees have been
considered based on present day expenses. The salaries are considered as per the present
trends in the relevant segment and followed rules as per Pay Revision Act 2019 (9 July
2019) Bhutan. The fringe benefits are considered at 15% per year. It is also considered
that salary will increase by 5% annually. The breakdown of manpower with estimated
salaries is given in the following table: Table_ 49: Salary & wages
# Description Intake Salary (Nu. / Month)
Salary
Per
Month
Salary
Per Annum
1. Manager 1 50000 0.50 6.00
2. Accounts and Administration 1 30000 0.30 3.60
3. Advertising and Marketing 1 30000 0.30 3.60
4. Reception and Office Support 1 15000 0.15 1.80
5. Skilled Worker 8 20000 1.60 19.20
6. Unskilled Worker 8 10000 0.80 9.60
7. Transport - Drivers 1 15000 0.15 1.80
8. Security 1 10000 0.10 1.20
Total (Nu. In Lacs.) 22
46.80

Investment Opportunity Study 2020 Project Profile-Manufacture of Essential Oil
Page | 68
3.10.8. Electrical and Water Consumption Charges40
Electricity charges are considered as per the tariff rate issued by Bhutan Power
Corporation. The unit cost of electricity has been considered @ Nu. 3/KwH for
operating of machines and plant equipment. It is assumed that the entire power
requirement is met from the grid. The expense on water supply, treatment and
distribution has been suitably considered based on the Thimphu City Corporation water
tariff at lumpsum basis. It is assumed that power and water charges will increase @ 5%
every year.
Table_ 50: Electrical and Water Consumption Charges
# Description Amount
Per Annum (Nu.in Lacs)
1. Power Consumption Charges 26.40
2. Water Consumption Charges 0.60
Total 27.00
3.10.9. Term Loan Estimation:
The term loan requirement is estimated on the funding pattern in Bhutan. It is estimated
as per the norms by Bhutan National Bank Limited. The term loan is considered as up to
60% to 75% of the project cost and it does not include working capital margin money (as
per financing pattern by Bhutan National Bank Limited). The estimated term loan is Nu.
9.8 million with 70% shared by the financial institution. The estimated term loan is Nu.9.74
million with 72% shared by the financial institution. The rest of the capital investment (Nu.
4.3 million comprising 30%) will be managed by entrepreneurs on their own arrangement.
The details are as follows:
Table_ 51: Term Loan Requirement from Financial Institution
# Particulars Margin
%
Amount
(Nu.in
Lacs)
Own
Contribution
(Nu. in Lacs)
Bank Loan
(Nu.in
Lacs)
1. Land (On Lease) 50% 0.00 0.00 0.00
2. Building & Civil
Construction
10% 38.95 3.90 35.06
3. Plant & Machinery 15% 58.75 8.81 49.94
4. Misc. Fixed Assets 15% 15.72 2.36 13.36
5. Preliminary Expenses 100% 1.00 1.00 0.00
40 Source: Available on the link of https://www.bpc.bt/electricity-tariff/.
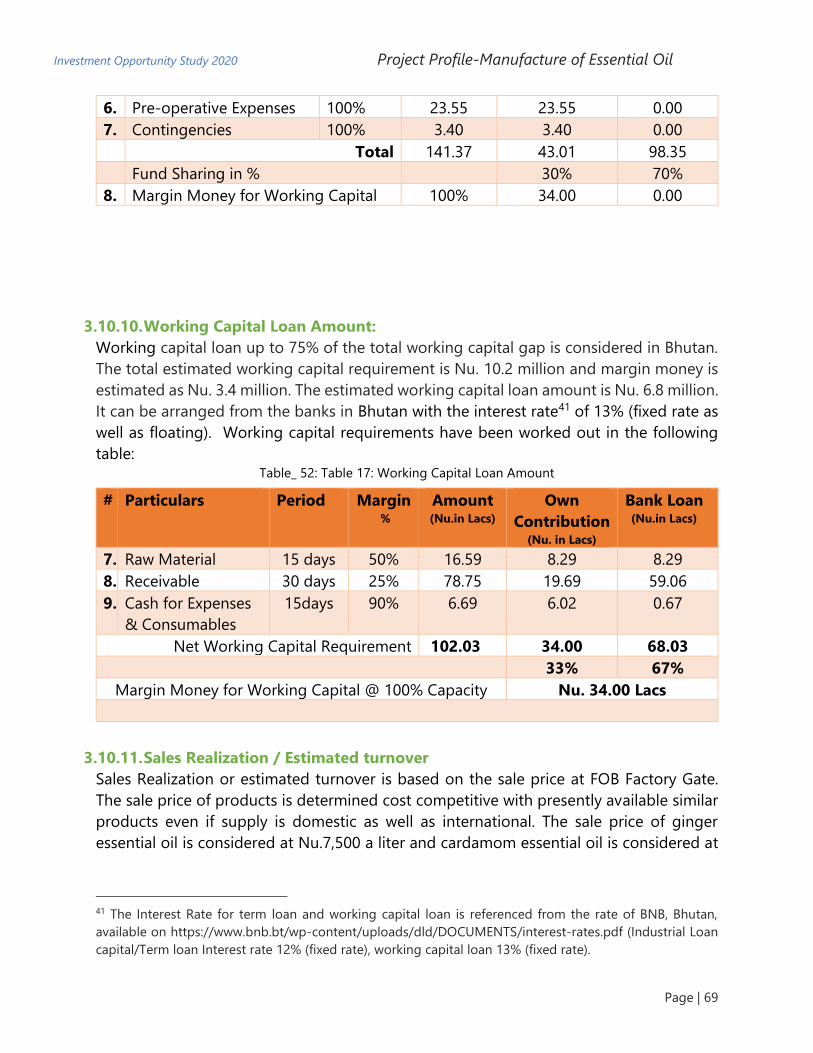
Investment Opportunity Study 2020 Project Profile-Manufacture of Essential Oil
Page | 69
6. Pre-operative Expenses 100% 23.55 23.55 0.00
7. Contingencies 100% 3.40 3.40 0.00
Total 141.37 43.01 98.35
8 Fund Sharing in %
30% 70%
8. 8 Margin Money for Working Capital 100% 34.00 0.00
3.10.10. Working Capital Loan Amount:
Working capital loan up to 75% of the total working capital gap is considered in Bhutan.
The total estimated working capital requirement is Nu. 10.2 million and margin money is
estimated as Nu. 3.4 million. The estimated working capital loan amount is Nu. 6.8 million.
It can be arranged from the banks in Bhutan with the interest rate41 of 13% (fixed rate as
well as floating). Working capital requirements have been worked out in the following
table: Table_ 52: Table 17: Working Capital Loan Amount
# Particulars Period Margin %
Amount (Nu.in Lacs)
Own
Contribution (Nu. in Lacs)
Bank Loan (Nu.in Lacs)
7. Raw Material 15 days 50% 16.59 8.29 8.29
8. Receivable 30 days 25% 78.75 19.69 59.06
9. Cash for Expenses
& Consumables
15days 90% 6.69 6.02 0.67
Net Working Capital Requirement 102.03 34.00 68.03 33% 67%
Margin Money for Working Capital @ 100% Capacity Nu. 34.00 Lacs
3.10.11. Sales Realization / Estimated turnover
Sales Realization or estimated turnover is based on the sale price at FOB Factory Gate.
The sale price of products is determined cost competitive with presently available similar
products even if supply is domestic as well as international. The sale price of ginger
essential oil is considered at Nu.7,500 a liter and cardamom essential oil is considered at
41 The Interest Rate for term loan and working capital loan is referenced from the rate of BNB, Bhutan,
available on https://www.bnb.bt/wp-content/uploads/dld/DOCUMENTS/interest-rates.pdf (Industrial Loan
capital/Term loan Interest rate 12% (fixed rate), working capital loan 13% (fixed rate).

Investment Opportunity Study 2020 Project Profile-Manufacture of Essential Oil
Page | 70
Nu. 35,000 a liter. A total of Nu. 94.5 million is estimated as sales realization at 100%
production capacity. The details are as follows:
Table_ 53: Sales Realization/Estimated turnover
# Product Production
Per month (in Ltr.)
Annual Production (in Ltr.)
Rate (Nu. per Ltr.)
Total Amount
Per Annum (Nu in Laces)
1 Ginger oil 350 Ltrs. 4200 7500 315.00
2 Cardamom
oil
150 Ltrs. 1800 35000 630.00
Total 500 Ltrs. 6000 945.00
Table_ 54: Estimated Production Capacity Details
k.1 Assumption: Production Details
Production Capacity 8 Hr
Item Ginger & Cardamom Essential Oil
Total Production in
year
4200 Ltr. Ginger Oil & 1800 Ltr. Cardamom Oil
Current Price Nu. 7500/Ltr Ginger essential oil and Nu. 35000/Ltr.
Cardamom essential oil
After three years 10% hike after every three years
3.10.12. Estimated Cost of Production and Profitability As per above estimated economic parameters, finance can be arranged by sharing 30%
by investor and 70% by loan through financial institutions. Working capital mainly consists
of the amount required to purchase raw Materials. Required margin money for this project
is Nu. 3.4 million. For profitability estimation, analysis of loan repayment capacity and
analysis of financial ratios for this project, the following assumptions and relevant basis
applicable to Bhutan have been considered:
• Industrial Land42 in Bhutan is available on Lease for up to maximum 30 years and
could be renewed further. The plots for industrial use are available in the government
developed industrial parks and estates at prominent locations as such Thimphu,
Gelephu, Samtse, Samdrup Jongkhar etc. Charges are considered as Nu. 7,500 per
litre for ginger essential oil and Nu. 3,500 per litre for cardamom essential oil for the
first three years. Subsequently it increases @ 3% every year.
42https://www.bhutanenterprise.com/2018/06/03/investment-climate-in-
bhutan/#:~:text=Lease%20rate%20for%20Industrial%20Estate&text=4%20per%20square%20feet%20peri.
e%2050%25%20increase%20on%20Nu.

Investment Opportunity Study 2020 Project Profile-Manufacture of Essential Oil
Page | 71
• The profitability projection has been worked out for 10 years at 70% capacity
utilization to be achieved during first three years and 80% in fourth to sixth year.
• Repairs & maintenance have been taken as @ 3% per annum on plant & machinery
& misc. fixed assets.
• Bank interest rate43 has been calculated @12% per annum on term loan & @ 13%
working capital loan.
• Insurance charges is @ 0.25% on all assets in the first year and then @ 5% decrease
every year.
• Power & water charges are increased @ 5% every year
• Administrative expenses have been increased @ 5% every year
• Margin money has been considered @ 40% on building @ 25% on plant & machinery
and @ 25% on misc. fixed assets.
• Bank loan has been considered for repayment in 7 years with one-year moratorium.
• Preliminary expenditure will be written off @ 10% every year in the next 10 years.
• Pre-operative expenditure will be written off from the second year @ 10% every year
in the next 10 years.
• Depreciation has been charged using Straight-Line Method.
• Insurance, lease rent & interest has been taken as fixed cost for calculating B.E.P.
• 44Income tax has been charged @ 30% every year as per Bhutan's tax rates.
• DSCR - debt service coverage ratio - is defined as net operating income divided by
total debt service.
43 The Interest Rate for term loan and working capital loan is referenced from the rate of BNB, Bhutan,
available on https://www.bnb.bt/wp-content/uploads/dld/DOCUMENTS/interest-rates.pdf (Industrial Loan
capital/Term loan Interest rate 12% (fixed rate), working capital loan 13% (fixed rate). 44 Source: Ministry of Finance - https://www.mof.gov.bt/faq/)

Investment Opportunity Study 2020 Project Profile-Manufacture of Essential Oil
Page | 72
3.11. Estimation of Project Profitability (Nu.in Lacs)
Table_ 55: Estimated Production Capacity Details
S. No. Particulars 1st Yr. 2nd Yr. 3rd Yr. 4th Yr. 5th Yr. 6th Yr. 7th Yr. 8th Yr. 9th Yr. 10th Yr.
1 Installed Capacity @100% 945.00 945.00 945.00 945.00 945.00 945.00 945.00 945.00 945.00 945.00
2 Capacity Utilization 70% 70% 70% 80% 80% 80% 90% 90% 90% 100%
3 Actual Sales in lacs Nu. 661.50 661.50 661.50 756.00 756.00 756.00 850.50 850.50 850.50 945.00
4 Cost of Operation
4.1 Land Lease Charges 5.17 5.16672 5.16672 0.72 0.74 0.76 0.79 0.81 0.83 0.86
4.2 Raw Material 403.12 403.12 403.12 460.71 460.71 460.71 518.30 518.30 518.30 575.89
4.3 Consumables @2% 8.06 8.06 8.06 9.21 9.21 9.21 10.37 10.37 10.37 11.52
4.4 Power 27.00 28.35 29.77 31.26 32.82 34.46 36.18 37.99 39.89 41.89
4.5 Repair & Maintenance @3% 1.50 1.50 1.50 1.50 1.50 1.50 1.50 1.50 1.50 1.50
4.6 Salary & Wages 46.80 49.14 51.60 54.18 56.89 59.73 62.72 65.85 69.14 72.60
4.7 Fringe Benefits @15% 7.02 7.37 7.74 8.13 8.53 8.96 9.41 9.88 10.37 10.89
4.8 Insurance 1.00 1.00 1.00 1.00 1.00 1.00 1.00 1.00 1.00 1.00
4.9 Administration Expenses 5.00 5.25 5.51 5.79 6.08 6.38 6.70 7.04 7.39 7.76
Total 499.51 503.80 508.30 571.77 576.74 581.96 646.18 651.93 657.96 723.04
5 Marketing Expenses @10% (Sale) 66.15 66.15 66.15 75.60 75.60 75.60 85.05 85.05 85.05 94.50
6 Cost of Production 565.66 569.95 574.45 647.37 652.34 657.56 731.23 736.98 743.01 817.54
7 Sale (Estimated Turn Over) 661.50 661.50 661.50 756.00 756.00 756.00 850.50 850.50 850.50 945.00
8 Profit Before Interest and Depp. 95.84 91.55 87.05 108.63 103.66 98.44 119.27 113.52 107.49 127.46
9 Interest on Term Loan @12% 11.80 10.82 8.85 6.88 4.91 2.95 0.98 0.00 0.00 0.00
10 On Working Capital @13 % 8.84 8.84 8.84 8.84 8.84 8.84 8.84 8.84 8.84 8.84
11 Total Interest 20.65 19.66 17.69 15.73 13.76 11.79 9.82 8.84 8.84 8.84
12 Profit Before Depreciation. 75.20 71.89 69.35 92.90 89.90 86.65 109.45 104.68 98.64 118.61
13 Depreciation 11.96 10.33 8.94 7.75 6.74 5.88 5.14 4.50 3.96 3.49
14 Profit After Depreciation 63.24 61.56 60.41 85.14 83.16 80.77 104.32 100.18 94.69 115.13
15 Pre-Operative Exp. W. Off 0.00 2.62 2.62 2.62 2.62 2.62 2.62 2.62 2.62 2.62
16 Preliminary Exp. W. Off 0.10 0.10 0.10 0.10 0.10 0.10 0.10 0.10 0.10 0.10
17 Profit before Taxation 63.14 58.85 57.70 82.43 80.44 78.06 101.60 97.46 91.97 112.41
18 Taxation @30% of Net Profit 18.94 17.65 17.31 24.73 24.13 23.42 30.48 29.24 27.59 33.72

Investment Opportunity Study 2020 Project Profile-Manufacture of Essential Oil
Page | 73
19 Accumulated Profit 44.20 85.39 125.78 183.48 239.79 294.43 365.55 433.77 498.15 576.84
20 Profit after Taxation 44.20 41.19 40.39 57.70 56.31 54.64 71.12 68.22 64.38 78.69
21 Add: Depreciation 11.96 10.33 8.94 7.75 6.74 5.88 5.14 4.50 3.96 3.49
22 Add: Interest on Term Loan 11.80 10.82 8.85 6.88 4.91 2.95 0.00 0.00 0.00 0.00
Total (A) 67.96 62.34 58.18 72.34 67.97 63.47 76.26 72.73 68.34 82.17
23 Interest on Term Loan 11.80 10.82 8.85 6.88 4.91 2.95 0.98 0.00 0.00 0.00
24 Repayment on Term Loan 0 16.40 16.40 16.40 16.40 16.40 16.35 0.00 0.00
Total (B) 11.80 27.22 25.25 23.28 21.31 19.35 17.33 0.00 0.00 0.00
Surplus (A) - (B) 56.16 35.12 32.93 49.05 46.65 44.12 58.92 72.73 68.34 82.17
DSCR (A/B) 5.76 2.29 2.30 3.11 3.19 3.28 4.40 0.00 0.00 0.00
Average DSCR 3.40
3.12. Calculation of Interest on Term Loan (Nu. in Lacs)
Table_ 56: Calculation of Interest on Term Loan
# Year Opening Balance Repayment Closing Balance Interest
1 1st year 98.35 0 98.35 11.80 11.80
2 2nd year
1st Qtr. 98.35 4.10 94.25 2.89
2nd Qtr. 94.25 4.10 90.15 2.77
3rd Qtr. 90.15 4.10 86.05 2.64
4th Qtr. 86.05 4.10 81.95 2.52 10.82
3 3rd year
1st Qtr. 81.95 4.10 77.85 2.40
2nd Qtr. 77.85 4.10 73.75 2.27
3rd Qtr. 73.75 4.10 69.65 2.15
4th Qtr. 69.65 4.10 65.55 2.03 8.85
4 4th year
1st Qtr. 65.55 4.10 61.45 1.91
2nd Qtr. 61.45 4.10 57.35 1.78
3rd Qtr. 57.35 4.10 53.25 1.66
4th Qtr. 53.25 4.10 49.15 1.54 6.88

Investment Opportunity Study 2020 Project Profile-Manufacture of Essential Oil
Page | 74
5 5th year
1st Qtr. 49.15 4.10 45.05 1.41
2nd Qtr. 45.05 4.10 40.95 1.29
3rd Qtr. 40.95 4.10 36.85 1.17
4th Qtr. 36.85 4.10 32.75 1.04 4.91
6 6th year
1st Qtr. 32.75 4.10 28.65 0.92
2nd Qtr. 28.65 4.10 24.55 0.80
3rd Qtr. 24.55 4.10 20.45 0.68
4th Qtr. 20.45 4.10 16.35 0.55 2.95
7 7th year
1st Qtr. 16.35 4.10 12.25 0.43
2nd Qtr. 12.25 4.10 8.15 0.31
3rd Qtr. 8.15 4.10 4.05 0.18
4th Qtr. 4.05 4.05 0.00 0.06 0.98
3.13. Break Even Point
Table_ 57: Break Even Point
# Particulars 1st Yr. 2nd Yr. 3rd Yr. 4th Yr. 5th Yr. 6th Yr. 7th Yr. 8th Yr. 9th Yr. 10th Yr.
1 Calculation of B.E.P.
Variable Cost 505.84 507.19 508.60 578.28 579.85 581.49 651.40 653.21 655.11 725.29
Fixed Cost 97.59 97.92 97.65 93.29 93.74 94.50 95.57 97.92 101.54 105.44
2 Break Even Point (B.E.P.) 62.69% 63.45% 63.87% 52.49% 53.21% 54.15% 48.00% 49.63% 51.97% 47.99%
Average B.E.P. 54.75%

Investment Opportunity Study 2020 Project Profile-Manufacture of Essential Oil
Page | 75
3.14. Projected Balance Sheet for the Project (10 Year) (Nu.in Lacs)
Table_ 58: Projected Balance Sheet for the Project
# Description Construction
Period
Operation Period
0 1st Yr. 2nd Yr. 3rd Yr. 4th Yr. 5th Yr. 6th Yr. 7th Yr. 8th Yr. 9th Yr. 10th Yr.
1 Liabilities
1.1 Equity 43.01 43.01 43.01 43.01 43.01 43.01 43.01 43.01 43.01 43.01 43.01
1.2 General reserves 0 44.20 85.39 125.78 183.48 239.79 294.43 365.55 433.77 498.15 576.84
1.3 Debt 98.35 98.35 81.95 65.55 49.15 32.75 16.35 0.00 0.00 0.00 0.00
1.4 Current Liabilities 0.00 0.46 0.51 0.50 0.50 0.50 0.50 0.50 0.50 0.50 0.50
1.5 Working Capital Loan 0.00 68.03 68.03 68.03 68.03 68.03 68.03 68.03 68.03 68.03 68.03
Total Liabilities 141.37 254.05 278.90 302.88 344.18 384.09 422.33 477.10 545.32 609.70 688.39
2 Assets
2.1 Gross Fixed Assets 116.82 116.82 116.82 116.82 116.82 116.82 116.82 116.82 116.82 116.82 116.82
2.2 Accumulated Depreciation 0 11.96 22.28 31.22 38.98 45.72 51.60 56.73 61.24 65.19 68.68
2.3 Net fixed assets (2.01-2.02) 116.82 104.87 94.54 85.60 77.85 71.10 65.23 60.09 55.59 51.63 48.14
2.4 Preliminary Expenses 1.00 0.90 0.80 0.70 0.60 0.50 0.40 0.30 0.20 0.10 0.00
2.5 Pre-Operative Expenses 23.55 23.55 20.93 18.31 15.70 13.08 10.47 7.85 5.23 2.62 0.00
2.6 Current Assets 0.00 14.49 16.56 16.56 16.56 16.56 16.56 16.56 16.56 16.56 16.56
2.7 Profit & Loss Account 0.00 0.00 0 0 0 0 0 0 0 0 0
2.8 Cash & Bank Balance 0.00 110.25 146.07 181.71 233.48 282.85 329.68 392.30 467.74 538.79 623.68
Total Assets 141.37 254.05 278.90 302.88 344.18 384.09 422.33 477.10 545.32 609.70 688.39

Investment Opportunity Study 2020 Project Profile-Manufacture of Essential Oil
Page | 76
3.15. Quality Control and Standards
3.15.1. BSI: The Bureau of Indian Standards has formulated the following specifications
for dehydrated ginger. Ginger whole & ground - IS: 1908-1980 (First Revision). The quality
should conform to standards laid down in the PFA Act. However, for better marketing of
this product, standards may be maintained as per "AGMARK" and BIS specifications.
3.15.2. FSSAI License: FSSAI License is issued by the Food Safety and Standards Authority
of India (FSSAI), Ministry of Family Health & Welfare, Government of India. Application to
commence a food business must be made to the FSSAI in the prescribed format. Based on
the application and supporting documents, FSSAI will accord approval. The Food Safety
and Standards (Licensing and Registration of Food Businesses) Regulations 2011
introduced to improve the hygiene and quality of food has brought about tremendous
changes in the food industry. As per the Act, no person shall commence or carry on any
food business except under a FSSAI license or FSSAI registration. Therefore, any food
manufacturing or processing or packaging or distributing entity is now required to obtain
a FSSAI License or Registration.
3.15.3. Pollution Control: There is no major pollution problem associated with this
industry except for disposal of waste which should be managed appropriately. However,
waste water resulting from washing of ginger and lime, treated ginger water may be safely
dispersed over a large area of land for irrigation purpose. The promoter is advised to take
"No Objection Certificate" from the State Pollution Control Board.
3.15.4. Effluent Disposal: Disposal of any effluent out of the project unit should be
treated with recycling facility or dumped in such a way that these does not cause hazard
in the vicinity of the site.
3.15.5. Energy Conversation: Proper care should be taken in running the machineries and
equipment to avoid overrun and high electricity consumption. The machineries selected
for the plant should be energy efficient for economical production.
3.16. Conclusion: Essential oils are the natural volatile compounds having loveable odor. The essential oils
are isolated mostly from the hydro distillation method which is more suitable for this
process and easy to carry. Whole parts of the plants are used for the extraction of plants.
Steam distillation method is expensive than the hydro distillation, so it is less preferred.

Investment Opportunity Study 2020 Project Profile-Manufacture of Essential Oil
Page | 77
Essential oils have good medicinal applications and are used in the treatment of different
diseases including infectious diseases, depression, anxiety, act as the antifungal,
antimicrobial, anticancer, and help in wound healing. They are also used in cosmetics and
perfume industries.
In the field of heath, essential oils mostly applied to the external body parts to relieve
pain. In the field of fragrance, essential oils are used in the perfume industry and due to
attractive odor, the essential oils are mostly used in this industry. It is used worldwide and
due to its wide usage, the world essential oil market is growing rapidly and getting more
importance day by day.

Investment Opportunity Study 2020 Project Profile-Manufacture of Essential Oils
Page | 78
Overall, it can be concluded that extraction of essential oil from spices can be done by
using solvent extraction and steam distillation method. The solvent extraction method
showed better efficiency of extraction compared to steam distillation method for
essential oil extraction.
3.17. Other Bhutan Essential Oils Suppliers and Manufacturers 1. Bhutan Cordyceps And Herbs, Bhutan
Supplier: Wintergreen oil
2. Yeshi, Bhutan
Supplier: essential lemon grass oil
3. Bhutan Natural Products, Thimphu, Bhutan
Supplier: Lemongrass oil
4. Organic Lemon Grass Oil Industry, Mongar, Bhutan
Supplier: Organic lemon grass oil
5. Bhutan Agarwood, Zhemgang, Bhutan
Supplier: Agarwood wood chips & agarwood oil
6. Delek Builder Export, Thimphu, Bhutan
Supplier: Agarwood log and oil
7. Indra Import and Export Business Line, Phuentsholing 1100, Chhukha, Bhutan
Supplier: Mineral water, soya chunks, Bhutan beer, lemon, grass oil, cordyceps,
silica fumes, white quartzite, quartz, silicate, kyanite, river stone, coal, iron ore.
3.18. Source of Technology: The manufacturing process is covered under food processing. The state-of-the-art
modern equipment will be sourced from India like Hyderabad (Telangana), Mohali
(Punjab) and Ahmedabad (Gujarat) etc. Some equipment and machines suppliers
include:
▪ Dhopeshwar Engineering Private Limited
Mr. Shirish Dhopeshwar (Chief Executive Officer)
Plot A 16, Co - Operative Industrial Estate,
Balanagar Hyderabad - 500037, Telangana, India
Mobile: +(91)-9391058963; +(91)-9652158908
Email: [email protected]
Website: https://www.dhopeshwar.in/
▪ Best Engineering Technology
Mr. M. Sesha Sai (Partner), Mr. Gautam
Plot No. 4, Survey No. 174 &176, IDA Bollaram Village Gram Panchayat
Hyderabad – 502325, Telengana, India
Mobile: +91-8043046080

Investment Opportunity Study 2020 Project Profile-Manufacture of Essential Oils
Page | 79
Website: https://www.bestengineeringtechnologies.com/essential-oil-plants.html
▪ GAK Equipments & Technologies
Mr. Karam Singh (Proprietor)
Plot No 54, Sector 82, JLPL, JLPL Industrial Area,
Mohali - 160062, Punjab, India
Mobile: 08042966611
Website: https://www.gakequipment.com
▪ Abster Equipments
24/A, Laxmi Industrial Estate, Nr. Mathurmaster Estate,
Amraiwadi, Ahmedabad-380026. Gujarat, INDIA.
Mobile: +91-79-22748046; +91 – 9879091953; +91 - 9427554374
Email: [email protected]; [email protected]
Website: http://www.abfindia.co.in/index.html
References:
Raw material resources https://www.indiamart.com/proddetail/solar-crop-dryers-7038385762.html
https://www.indiamart.com/proddetail/garlic-peeler-19163785233.html
https://www.exportersindia.com/sunny-solly-machines-pvt/elaichi-peeler-cum-sifter-3818202.htm
https://www.indiamart.com/proddetail/essential-oil-distillation-unit-22351700088.html
https://www.indiamart.com/proddetail/baby-boiler-9337649355.html
https://www.indiamart.com/proddetail/jacketed-kettle-22256980373.html
https://www.indiamart.com/proddetail/industrial-aluminium-table-11812978430.html
https://www.indiamart.com/proddetail/glass-bottle-filling-sealing-machine-22017174655.html
Others: • BhutanTradeStatistics2019260320201.pdf
• Department of Agriculture Annual Report 2018-19
• www.mof.gov.bt

Investment Opportunity Study 2020 Project Profile-Manufacture of Gypsum Board
Page | 80
Project Title: Manufacturing of Gypsum
Board/Panel

Investment Opportunity Study 2020 Project Profile-Manufacture of Gypsum Board
Page | 81
4. Manufacturing of Gypsum Board/Panel
4.1. Background of the Idea Minerals are an important resource for Bhutan. Gypsum, dolomite and limestone
deposits are widely available in the country. For captive processing units, all these
minerals are available on lease for use in any suitable industry proposed by the private
sector.
Dolomite is a common rock-forming mineral. It is a calcium magnesium carbonate with
a chemical composition of (CaMg(CO3)2). It is used as a source of magnesia (MgO), a
feed additive for livestock, a sintering agent and flux in metal processing, and as an
ingredient in the production of glass, bricks, and ceramics.
Limestone is a sedimentary rock composed primarily of calcium carbonate (CaCO3) in
the form of the mineral calcite. It is used as a crushed stone for road base and railroad
ballast. It is used as an aggregate in concrete.
It is fired in a kiln with crushed shale to make cement. Powdered limestone is used as
filler in paper, paint, rubber, and plastics. Crushed limestone is used as a filter stone in
on-site sewage disposal systems. Powdered limestone is also used as a sorbent (a
substance that absorbs pollutants) at many coal-burning facilities.
Gypsum is a soft sulfate mineral composed of calcium sulfate dihydrate, with the
chemical formula CaSO4·2H2O. It is widely mined and is used in manufacturing of
wallboard, plaster of Paris, soil conditioning and hardening retarder in Portland
cement. Gypsum mines are located in Pemagatshel area proper, Khothakpa and Uri
Chu, Pemagatshel Dzongkhag with 56.45 MT proved to exist as deposits at Khothakpa
and 13.60 MT estimated in Uri Chu and Khar as per the data by department of Geology
and Mining, Bhutan. As per the report and data (year 2009 to year 2013) presented by
Asia Trade Hub Research Company and the information by Department of Geology
and Mines, Bhutan produces an average annual quantity of 350,000 MT of gypsum.
Dolomite and Limestone are widely used in cement, glass and paper manufacturing as
ingredient or catalyst. The raw rocks and lumps are crushed and used. Bhutan Ferro
Alloys Ltd., Penden Cement, Lhaki Cement, and Dungsam Cement are the main users
of dolomite and Limestone for manufacturing purpose. Bhutan is also exporting
dolomite and limestone to India and Bangladesh.
About eight companies in Bhutan are involved in Mining of Dolomite / Manufacturing
of Calcanei Dolomite / Crushing / dolomite powdering and three companies are
mining Gypsum as per the trade statistics of Bhutan. Druk Satair Corporation Ltd, State
Mining Corporation Limited, RSA Private Limited, Jigme Mining Corporation Limited
and SD Eastern Bhutan Pvt. Ltd are the prominent organizations working in this area.

Investment Opportunity Study 2020 Project Profile-Manufacture of Gypsum Board
Page | 82
Druk Gyp products & Chemicals Ltd. is a prominent company, based in Nganglam,
Pemagatshel, which is manufacturing Plaster of Paris (by Gypsum). Gypsum is exported
to North Eastern parts of India, West Bengal, eastern Bihar in India, the south east of
Nepal and the western parts of Bangladesh. It has declined substantially in the last year
due to increasing of 5% import duty by Bangladesh and import from Oman. Thus,
Gypsum is predominantly available in Khotakpa area of Pemagatshel.
As per above scenario, gypsum-based product
manufacturing units can be further explored. A
setting of gypsum board ceiling tiles is
predicted feasible in Bhutan looking at the
domestic and also for supply to the Indian
Market. The feasible locations for this plant are
suggested to be in Mongar, Gelephu and
Samdrup Jongkhar. Gypsum is in high demand
in the neighboring markets due to higher rate
of building construction and commercial mall
development. The proposed project does not
have any significant adverse impact on the
environment.
4.2. Market Scenario As per the Gypsum Board Market Size & Share, Industry Report, 2020-2027 by a U.S.
based market research company known as Grand View Research45: “the global
gypsum board market size was estimated at USD 40.87 billion in 2019 and is expected
to expand at a CAGR of 11.9% in terms of revenue, from 2020 to 2027”. In addition,
growing innovative construction applications of gypsum board are likely to provide
growth opportunities.
Prominent players in gypsum board manufacturing include Saint-Gobain Gyproc,
Knauf, Gulf Gypsum Co., USG Corporation, National Gypsum, Lafarge Holcim, and
Georgia pacific. The companies are focused on technological collaboration with
smaller companies to extend the production capacity, enhance the product portfolio,
and extend the geographical reach.
4.2.1. India Market
As per the study conducted by Hexa Research, New Delhi, Gypsum Board is expected
to reach about 333.64 million m2 by 2021 from 221.75 million m2 in 2016, registering
a Compounded Annual Growth Rate (CAGR) of 8.51% during the analysis period, 2020-
2025. A number of small and medium units have been manufacturing gypsum panels
with different designs and textures.
45 https://www.grandviewresearch.com/industry-analysis/gypsum-board-market
Figure_ 22: Gypsum Mining Area

Investment Opportunity Study 2020 Project Profile-Manufacture of Gypsum Board
Page | 83
4.2.2. Bhutan Market
Bhutan is now experiencing a big construction boom in the past few years with a
notable peak construction year in 2019. The construction industry plays an important
role in the national economy. Its contribution to the GDP is significant. In 2017, it
contributed 15.87% to the GDP making up 0.99 percentage points to the GDP growth.
A big part of this construction boom is in Thimphu fueled by a strong demand for
rental apartments, apartments to buy, office space, shops and hotels which has led to
a record number of ongoing construction projects. This could offer ample demand for
Gypsum celling board with advantages noted as follows:
• Wood has been extensively used in the construction of buildings in Bhutan for
flooring, paneling, insulation and various other purposes. Presently, wood is
increasingly becoming scarce and costly.
• Some of the applications of wood viz for insulation, ceiling, partition, paneling,
etc. need to be replaced by Gypsum boards. The use of Gypsum boards also
provides a modern look to interior designing and it can be reused. The cost of
gypsum board is relatively much lower compared to wood and their installation
is also quite easy.
• Gypsum ceiling board market is also growing in Bhutan owing to persuading
characteristics including enhancing aesthetics value, low maintenance cost and
lightweight.
• Gypsum board is a much more residential and offers a cleaner, more consistent
look and can be painted. Compared to PVC board, it is safer from fire hazard
and quite hard to install which also provides better thermal insulation. The
Gypsum board is around 40% to 50% cheaper comparison to PVC board.
Comparison to wood board, it is cheaper and safer to fire hazards.
Construction of schools & colleges, hotels, hospitals, government offices, private
offices, service sector offices, shopping complexes are the target markets for use of
gypsum boards. The product marketing can be routed through Building construction
companies, building contractors, private house owners, infrastructure development
companies, home designers, architects and interior contractors.
4.3. The Concept Gypsum board (also known as plasterboard, wallboard, gypsum panel, sheet rock, or
drywall) is a panel made of calcium sulfate dihydrate (gypsum) with or without
additives and normally pressed between a facer and a backer (typically thick sheets of
paper). It is used to make interior walls and ceilings. The plaster is mixed with fiber
(typically paper and/or fiberglass), plasticizer, foaming agent, and various additives
that can decrease mildew, increase fire resistance, and lower water absorption.

Investment Opportunity Study 2020 Project Profile-Manufacture of Gypsum Board
Page | 84
Gypsum building materials are used in all construction types (residential, non-
residential, new or refurbished), ranging from complex high-tech systems to easy-to-
install products adapted for use by the general public.
Gypsum board is widely used for internal walls and ceilings by the construction
industry, and is a material of growing importance in the do it yourself sector. Gypsum
board is also a common fire barrier used in house and general building construction.
Commonly gypsum boards used in walls and ceilings, in moist areas, in exterior
applications, for fire resistance and area separation and special systems.
4.4. Product Description Gypsum boards are the ultimate solution for today's buildings. Along with aesthetic
appeal, they are lightweight and also offer high levels of performance in terms of fire
rating, acoustic insulation and thermal insulation as compared to POP sheets. The
physical properties of Gypsum are as follows: Table_ 59: Physical Properties of Gypsum
Due to its inherent fire resistance, gypsum board, commonly known as drywall, is the
premier building material for wall, ceiling, and partition systems in residential,
institutional and commercial structures.
Designed to provide a monolithic surface when joints and fastener heads are covered
with a joint treatment system, gypsum products also provide sound control, economy,
versatility, quality, and convenience.
These gypsum boards and panel are widely used in offices, schools, hospitals and
factories for wall and ceiling. It is a kind of environmentally friendly and corrosion-
resistant decorative ceiling board. Gypsum based putty; gypsum wall blocks and
gypsum tiles can be produced in the product series. Gypsum board/Panel
specifications are as follows:
# Property Details
1. Chemical Classification Sulfate
2. Color Clear, colorless, white, gray, yellow, red, brown
3. Streak White
4. Luster Vitreous, silky, sugary
5. Cleavage Perfect
6. Mohs Hardness 2
7. Specific Gravity 2.3
8. Diagnostic Properties Cleavage, specific gravity, low hardness
9. Chemical Composition Hydrous calcium sulfate, CaSO4.2H2O
10. Crystal System Monoclinic
11. Product Uses Used to manufacture dry wall, plaster, joint
compound. An agricultural soil treatment.

Investment Opportunity Study 2020 Project Profile-Manufacture of Gypsum Board
Page | 85
Table_ 60: Gypsum board/Panel Specifications
# Property Details
1. Material Natural Gypsum
2. Surface Fire Retardant PVC Film
3. Color White Pink, and Blue
4. Size 595mm X 595mm
5. Thickness 08 mm
6. Edge Construction Square Edge
7. Light Reflectance 0.75 - 0.85 (Certified)
8. Moisture Content <2.0%
9. Fire Resistance BS-476-4:1970
10. Humidity Resistance (RH) 95%
11. NRC ≥0.50
Gypsum boards having characteristics of thermal insulation and sound barrier could
replace wood in many applications. Similarly, the cost of bricks especially red bricks is
very high in Bhutan and gypsum board could be an alternative as it is economically
used for inner partitions.
Gypsum boards are hundred percent green products and the entire manufacturing
process itself is environmentally friendly.
4.5. Manufacturing Process 46 Plaster of Paris is raw gypsum that is chemically altered by heat to remove much of the
water contained in the gypsum molecule and then hydrated to make it useable as a
plastering material.
Gypsum that has been crushed and heated to remove 75% of its water content is
known as plaster of Paris. When water is added to this fine white powder, the resulting
material is easily molded into any desired shape. Upon drying, the reconstituted
gypsum regains its rock-like qualities while retaining the desired shape.
Fabrication of drywall consists of placing the gypsum core material between two layers
of paper, drying the product, and finishing it into panels of standard size. Depending
on the variety of wallboard being produced, certain additives are blended with the
plaster of Paris that will form the core of the drywall. The boards are dried in the dryers
(35-40 minutes) and cooled. Humidity and temperature are carefully controlled in the
dryer.
46 http://www.innogyps.com/gypsum_board_training.php
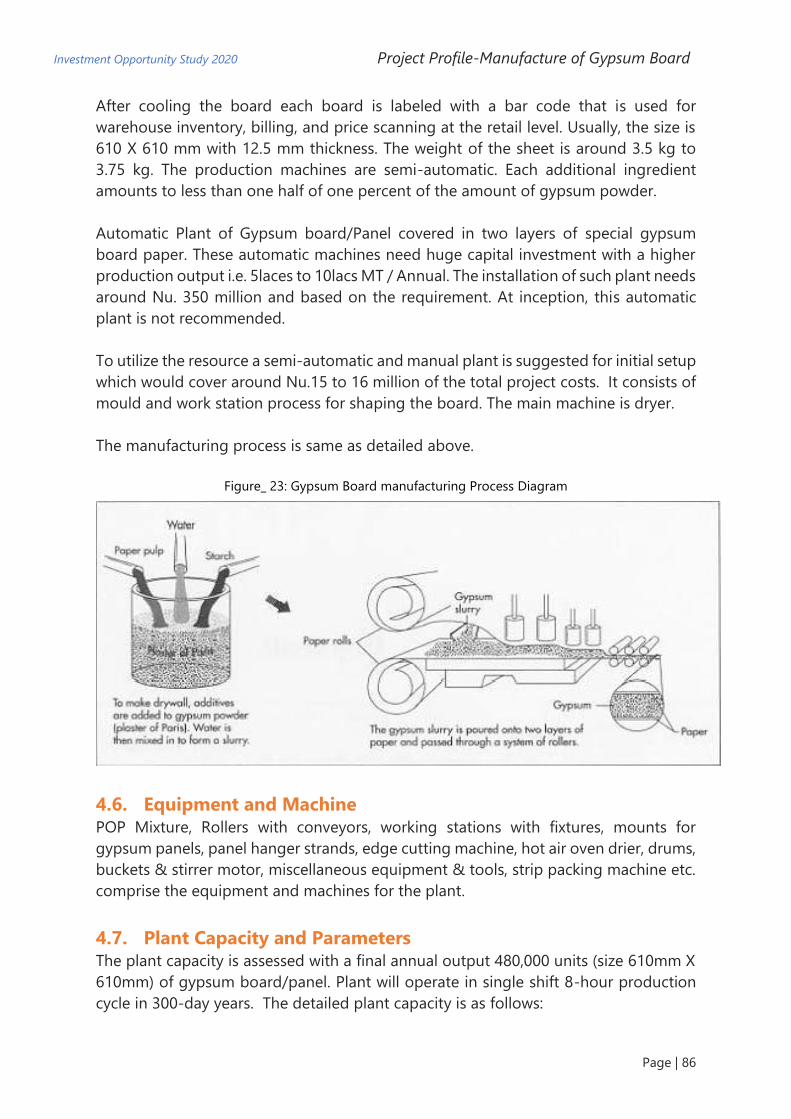
Investment Opportunity Study 2020 Project Profile-Manufacture of Gypsum Board
Page | 86
After cooling the board each board is labeled with a bar code that is used for
warehouse inventory, billing, and price scanning at the retail level. Usually, the size is
610 X 610 mm with 12.5 mm thickness. The weight of the sheet is around 3.5 kg to
3.75 kg. The production machines are semi-automatic. Each additional ingredient
amounts to less than one half of one percent of the amount of gypsum powder.
Automatic Plant of Gypsum board/Panel covered in two layers of special gypsum
board paper. These automatic machines need huge capital investment with a higher
production output i.e. 5laces to 10lacs MT / Annual. The installation of such plant needs
around Nu. 350 million and based on the requirement. At inception, this automatic
plant is not recommended.
To utilize the resource a semi-automatic and manual plant is suggested for initial setup
which would cover around Nu.15 to 16 million of the total project costs. It consists of
mould and work station process for shaping the board. The main machine is dryer.
The manufacturing process is same as detailed above.
Figure_ 23: Gypsum Board manufacturing Process Diagram
4.6. Equipment and Machine POP Mixture, Rollers with conveyors, working stations with fixtures, mounts for
gypsum panels, panel hanger strands, edge cutting machine, hot air oven drier, drums,
buckets & stirrer motor, miscellaneous equipment & tools, strip packing machine etc.
comprise the equipment and machines for the plant.
4.7. Plant Capacity and Parameters The plant capacity is assessed with a final annual output 480,000 units (size 610mm X
610mm) of gypsum board/panel. Plant will operate in single shift 8-hour production
cycle in 300-day years. The detailed plant capacity is as follows:

Investment Opportunity Study 2020 Project Profile-Manufacture of Gypsum Board
Page | 87
Table_ 61: Plant Capacity and Parameters
American Society for Testing and
Materials
ASTM C1396
Plant Capacity - Gypsum panels, reinforced
with glass fiber
4,80,000 Units annual
Dimensions of Gypsum Baseboards Thickness: 9mm
Size: 610mm X 610mm,
Density: 520 Kg/m3
Land and Building Requirement 1000-1500Sq. Mt. with Shed.
Gypsum plaster boards – Specification BIS IS 2095-1: 2011
Test IS 2542 (Part 2/Sec 1 to 8)
Employment Size 19
Land (1500Sq. Mt.) On lease
GST Tax Rate in India 18%
Market Construction Sites
Export Opportunity India Border States
Required Systems and Licenses
Quality Management ISO 9001:2015
Environment Management ISO 14001
Environment Clearance in Bhutan Environment Clearance and Other
Regulatory Act Registration and
Certificates.
Export – Import Duty to India Trade between India and Bhutan is
not subjected to customs duties.
4.8. Estimated Project Cost and Financials The project is suggested under the M&L manufacturing category (Investment above
Nu. 10 million). The required land for this manufacturing plant is around 1,500 m2. It
will be arranged on lease basis for 30 years to be renewed further. Process building,
raw material yard, finished goods storage and office will be constructed through pre-
fabricated structure.
The total cost of the project has been estimated as Nu. 15.6 million. The Break-Even
months is 40 and D.S.C.R value is 3.07 showing that the project will generate sufficient
to pay loans. Gypsum as raw material is easily available in Bhutan. A list of plant and
machinery supplier is given under the topic “1.11 suppliers” for first ready reference.
Financial trends related to manufacturing plant of gypsum board are as follows:
Table_ 62: Plant Capacity and Parameters
# Description Amount (Nu. In Lacs)
20. Establishment Cost 155.66
21. Cost of Operation

Investment Opportunity Study 2020 Project Profile-Manufacture of Gypsum Board
Page | 88
2.1 Fixed Cost 60.63
a. Salary & Wages 43.20
b. Overhead Cost 17.43
22. Variable Costs 42.63
a. Raw Material 83.28
b. Other Variable Cost 8.96
23. Break Even Point 61.91%
24. Payback Period 40 Months
25. D.S.C.R. 3.07
26. Rate of Return 30%
27. NPR 25.32%
4.8.1. Project Cost
The cost of project is estimated as a total value of land, building and civil construction,
plant and machinery, MFA, preliminary expenses, pre-operative expenses and
contingency. The required land is around 1500 m2 to be taken on lease followed by
Building & Civil Construction comprising 43.69% of project cost and Plant & Machinery
to comprise 33.03% of the project cost. Margin Money for working capital is not
considered as part of project cost. The summary of the project cost is as follows:
Table_ 63: Head Wise Project Cost and Sharing Percentage
# Particulars Value (Nu. In
Lacs)
Cost Sharing
13. Land 1500 sq. meters (Size 50Mtr. *30Mtr.) On Lease
14. Building & Civil Construction 68.01 43.69%
15. Plant & Machinery 51.41 33.03%
16. Misc. Fixed Assets 13.14 8.44%
17. Preliminary Expenses 1.00 0.64%
18. Pre-operative Expenses 18.12 11.64%
19. Contingencies 3% 3.98 2.55%
Total 155.66 100%
4.8.2. Means of Finance Table_ 64: Means of Finance
# Particulars Value (Nu. in Lacs)
9. Promoters Equity 56.24 36%
10. Term Loan from Bank 99.42 64%
Total 155.66 100%
3. Margin Money for Working Capital 8.52 38%
4. Working Capital Loan from Bank 14.15 62%

Investment Opportunity Study 2020 Project Profile-Manufacture of Gypsum Board
Page | 89
Total 22.67 100%
4.9. Estimation of Building and Civil Work and Cost Based on the requirement of processing area, store for raw materials and finished
goods and office space, the project would require an area of around 1,500 m2. Around
9,000 Sq. Ft area will be constructed by pre-fabricated building structure. The building
civil construction cost is considered as per the 47Bhutan Schedule of Rates (Civil Works)
- 2018 issued by Ministry of Works and Human Settlement, Bhutan.
Total estimated building construction cost is Nu.6.8 million which is around 43.69% of
the total project cost. The details of building and civil work cost estimation are as
follows:
Table_ 65: Estimation of Building and Civil Work Cost
# Particular Dimensions
(Mt.)
Area
(Sq. Mt.)
Rate
(Nu. /Sq.
Mt.)
Amount
(Nu. in
Lacs)
1. Production Area
(Main Shed)
height 16 feet (5Mt.)
80 60 4800 750 36.00
2. Raw Material Storage 40 30 1200 600 7.20
47 Source: https://www.mowhs.gov.bt/wp-content/uploads/2018/04/BSR-2018-civil.pdf
Building & Civil Construction
44%
Plant & Machinery 56.34, 33%
Misc. Fixed Assets 13.14, 8%
Preliminary Expenses, 1.00, 1%
Pre-operative Expenses, 18.12,
12%
Contingencies , 3.98, 2%
Figure_ 24: Fig. 3 Graphical representation of Project Cost Components and its Share *Nu. in Lacs

Investment Opportunity Study 2020 Project Profile-Manufacture of Gypsum Board
Page | 90
3. Finished Goods Storage 60 30 1800 600 10.80
4. Laboratory & Quality
Assurance Section
15 10 150 600 0.90
5. Office Space 18 15 270 600 1.62
6. Facilities + Utility + Pantry 20 15 300 600 1.80
7. Security & Time office 10 11 110 600 0.66
8. Boundary wall (165) Rm
with height of 3m (10 ft)
and 1 ft Thick)
510 1 510 1350 6.88
9. Parking Area 40 25 1000
0.50
10. Green Belt Development
and Open Space
100 30 3000
0.30
11. Entrance Gate - 15 feet
wide and name sign
board
1 35000 0.35
12. Misc. Civil Construction as
Water Tank
1.00
68.01
4.10. Plant and Machinery Cost 48 The cost estimates for plant & machinery have been worked out based on the cost
figures received from the Indian plant machinery suppliers. The prices are considered
without Indian GST tax as it is exempted under supply of trade agreement between
India and Bhutan (Category Export). Installation and commissioning of equipment are
considered separately in the total plant and machinery cost estimation. Freight and
insurance have been considered with the assumption that all goods are transported
by road. Goods of import origin would be handled through the Kolkata port. The
equipment list with cost is given in table below:
Table_ 66: List of Plant & Machinery with Cost
# Plant & Machinery Qty. Rate Amount
(Nu. in Lacs)
1. Ribbon Blenders (Single Shaft 100kg / Hr.) 2 185000 3.70
2. Drum Buckets & Stirrer Motor 1 350000 3.50
3. Working Stations with Fixtures 25 3500 0.88
4. Silicon Mould (Size 610mm*610mm) 400 2887.5 11.55
5. Panel Hanger Strands 50 4000 2.00
6. Edge Cutting Machine 2 120000 2.40
48 Plant and Machine Supplier List is given on the topic of 1.12 of this profile under title “Plant Machine Supplier”.

Investment Opportunity Study 2020 Project Profile-Manufacture of Gypsum Board
Page | 91
7. Hot Air Oven - Vertical Down Airflow
(500kg/hr., 100KWH)
1 1800000 18.00
8. Material Handling Equipment - rollers table,
conveyor, hand carts
1 250000 2.50
9. Small Hand Tools and Packaging Machines 1 50000 0.50
10. Testing Equipment and Accessories 1.50
Total Amount 46.53
11. Packaging & Forwarding 7.5% 3.49
12. Erection and Commissioning - Oven 3% 1.40
Grand Total 51.41
4.11. Misc. Fixed Assets A miscellaneous fixed asset includes Office Equipment & Furniture, computer and
peripherals, firefighting equipment, vehicle etc. Nu. 1.4 million has been estimated
under this head “MFA” and presented in the below table:
Table_ 67: Misc. Fixed Assets Cost Estimation
# Particulars Qty. Amount
(Nu.in
lacs)
11. Office Equipment, Laptop, Printer, CCTV Camera and Systems 1 3.50
12. Furniture & Fixture with Interior Items 1 1.50
13. Fire Fighting Equipment's 1 0.02
14. Ventilation - Exhaust fans 4 0.12
15. Tata Mini Truck 1 8.00
Total 13.40
4.12. Preliminary Expenses Preliminary expenses are those expenses which are incurred before the incorporation
and commencement of the business. These are treated as deferred
revenue expenditure. These expenses are marked to be written off in the next ten years
in estimation of profitability. The Preliminary Expenses details are as follows:
Table_ 68: Preliminary Expenses
# Particular Amount (Nu.in Lacs)
3. Company formation expenses (roc) and setup approvals 1.00
Total 1.00

Investment Opportunity Study 2020 Project Profile-Manufacture of Gypsum Board
Page | 92
4.13. Pre-operative Expenses These expenses are incurred prior to commencement of commercial production. A
total of Nu. 1. Million is estimated under this cost to be written off in the next 10 years
and exempted in the first year. The details are given in the table below:
Table_ 69: Preliminary Expenses
# Particular Amount
(Nu.in Lacs)
19. Interest up to production 1.80
20. Insurance during construction period 0.00
21. Electricity charges construction period 0.30
22. Salary during construction period 1.00
23. Marketing launch expenses 2.00
24. Quality and Environment Management Certification 5.00
25. Project consultancy fees @5% of project cost 6.63
26. Travelling Expenses for Project Implementation 1.00
27. Registration of Trade Mark and Patent 0.40
Total 18.12
4.14. Cost of Raw Material The cost of the raw material consists of the cost of the main ingredients, raw material
and cost of packaging. The annual raw material cost is based on the present average
market prices in Bhutan. The supplier49 for Gypsum Powder (POP) is available in
Bhutan. A total of Nu. 8.3 million has been estimated as raw material cost at 100%
capacity. The details are as follow given in the table below: Table_ 70: Cost of Raw Material
# Raw Material Annual
Requirement
Unit Rate
(Nu.
per)
Unit Total
Amount
1. Fine Grade POP 1584 MT 4.50 Kg 71.28
2. Reinforcing fiber / glass fiber 1 MT
2.00
3. Mould release agent, and other
chemicals
5 MT 100 Kg 5.00
4. Misc. Items
2.00
5. Packaging Material -Clippers, Plastic
Strips
3.00
Total Raw Material requirement at capacity 100% 83.28
4.15. Salary & Wages Salaries and Wages (including benefits) for different categories of employees have
been considered based on present day expenses. The salaries are considered as per
49 Raw Material Supplier: https://www.indiamart.com/proddetail/home-ceiling-plaster-of-paris-
19271110248.html
Druk Gypproducts & Chemicals Ltd,
https://www.exportersindia.com/druk-gypproducts-chemicals-ltd/products.htm

Investment Opportunity Study 2020 Project Profile-Manufacture of Gypsum Board
Page | 93
the present trends in the relevant segment and followed rules as per Pay Revision Act
2019 (9 July 2019) Bhutan. The fringe benefits are considered at 15% per year. It is also
considered that salary will increase by 5% annually. The breakdown of manpower with
estimated salaries is given in the following table: Table_ 71: Salary & Wages
# Description Intake Salary Per Month
(Nu.)
Salary Per Annum
(Nu. In Lacs)
1. Manager 1 50000 6.00
2. Accounts and Administration 1 30000 3.60
3. Marketing and Advertising 1 30000 3.60
4. Production Supervisor 1 25000 3.00
5. Front Line Operators 7 20000 16.80
6. Support Staff 6 10000 7.20
7. Transport - Drivers 1 15000 1.80
8. Security 3 10000 1.20
Total 21 43.20
A dedicated Post Graduate Marketing Executive is required to manage marketing,
supply chain management and revenue collection.
4.16. Electrical and Water Consumption Charges Electricity charges are considered as per the tariff rate issued by Bhutan Power
Corporation. The unit cost of electricity50 has been considered @ Nu. 3/KwH for
operating of machines and plant operation. It is assumed that the entire power
requirement is met from the grid.
The expense on water supply, treatment and distribution has been suitably considered,
based on the Thimphu City Corporation water tariff on a Lumpsum basis. It is assumed
that power and water charges will increase @5% every year. The expenses under this
head are as follows: Table_ 72: Electrical and Water Consumption Charges
# Description Amount
Per Annum (Nu.in Lacs)
1 Power Consumption Charges 4.80
2 Water Consumption Charges 1.20
Total 6.00
The details of electrical installations for power distribution have been considered
commensurate with power load and process control requirements.
50 Source: Available on the link of https://www.bpc.bt/electricity-tariff/.

Investment Opportunity Study 2020 Project Profile-Manufacture of Gypsum Board
Page | 94
4.17. Term Loan Estimation The term loan requirement is estimated on the funding pattern in Bhutan. It is
estimated as per the norms by Bhutan National Bank Limited. The term loan is
considered as up to 60% to 75% of the cost of the project and it does not include
working capital margin money (As per financing pattern by Bhutan National Bank
Limited).
The estimated term loan is Nu.9.9 million and with 64% to come as loan from financial
institution. The rest of the capital investment (Nu. 5.6 million comprising 36% of project
cost) to be invested by entrepreneurs. The details are as follows:
Table_ 73: Term Loan Requirement from Financial Institution and Investor Contribution
# Particulars Margin
%
Amount
(Nu.in
Lacs)
Own
Contribution
(Nu. in Lacs)
Bank Loan
(Nu.in Lacs)
13. Land On Lease
14. Building & Civil
Construction
25% 68.01 17.00 51.01
15. Plant & Machinery 25% 51.41 12.85 38.56
16. Misc. Fixed Assets 25% 13.14 3.29 9.86
17. Preliminary Expenses 100% 1.00 1.00 0.00
18. Pre-operative Expenses 100% 18.12 18.12 0.00
19. Contingencies 100% 3.98 3.98 0.00
Total 155.66 56.24 99.42
Sharing % 36% 64%
4.18. Working Capital Loan Amount Working capital loan up to 75% of the total working capital gap is considered in
Bhutan. The total estimated working capital requirement is Nu. 2.3 million and Margin
money is estimated as Nu. 876,000. The estimated working capital loan amount is Nu.
1.4 million. It can be arranged from the banks in Bhutan with the interest rate51 of 13%
(fixed rate as well as floating).
Working capital requirement has been worked out in the table given below:
51 The Interest Rate for term loan and working capital loan is referenced from the rate of BNB, Bhutan,
available on https://www.bnb.bt/wp-content/uploads/dld/DOCUMENTS/interest-rates.pdf (Industrial
Loan capital/Term loan Interest rate 12% (fixed rate), working capital loan 13% (fixed rate).

Investment Opportunity Study 2020 Project Profile-Manufacture of Gypsum Board
Page | 95
Table_ 74: Estimation of Working Capital Loan Amount
# Particulars Period Margin
%
Amoun
t
(Nu.in
Lacs)
Own
Contribution
(Nu. in Lacs)
Bank
Loan
(Nu.in
Lacs)
10. Raw Material 15 days 50% 2.40 1.20 1.20
11. Receivable 30 days 25% 16.80 4.20 12.60
12. Cash for Expenses &
Consumables
15days 90% 3.73 3.36 0.37
Net Working Capital Requirement 22.93 8.76 14.17
Margin Money for Working Capital @ 100% Capacity Nu. 4.58 Lacs
4.19. Sales Realization / Estimated turnover Sales Realization or estimated turnover is based on the sale price at FOB Factory Gate.
The sale price of products is determined to be cost competitive with presently available
similar product whether supply is domestic or international. The sale price of Gypsum
Board/Panel is considered as Nu. 60/- per board (2x2 sq. ft.) The total of Nu. 28.8
million is estimated with sales realization at 100% production capacity. The details are
as follows:
Table_ 75: Sales Realization/Estimated Turnover
# Product Annual
Producti
on
(Nos.)
Rate Total
Amount
Per Annum
(Nu. in
Lacs)
1. Gypsum panels, reinforced with glass
fiber
(4sq Ft - 610mm*610mm, 9mm thick)
4,80,000 Nu. 60
per Nos.
288
Total 480000 Nu. 288 Lacs
Table_ 76: Estimated Production Capacity Details
Assumption: Production Details
Gypsum Board Size 4sq Ft - 610mm*610mm, 9mm thick
Production Capacity 200 Board per Hr.
Production in a Day 8 Hr.
Days in a Year 300 Days
Total Production in Year 4,80,000 Nos. Annual
Current Price Nu. 60 per Nos.

Investment Opportunity Study 2020 Project Profile-Manufacture of Gypsum Board
Page | 96
4.20. Estimated Cost of Production and Profitability: As per above estimated economic parameters, finance modality could be shared with the
investor putting 36% and remaining 64% as loan through financial institutions. Working
capital mainly consists of amount required to purchase raw materials. Required margin
money for this project is Nu. 852,000. For profitability estimation, analysis of loan
repayment capacity, and analysis of financial ratios for this project, the following
assumptions and relevant basis applicable to Bhutan have been considered:
• Industrial Land52 in Bhutan is available on lease for up to maximum 30 years and could
be further renewed. The plots for industrial use are available in the government
developed industrial parks and estates at prominent locations as such Thimphu,
Samtse, Phuentsholing, Gelephu etc. Charges are considered at Nu. 4 per square feet
per annum for the first three years. In the fourth year the rate is Nu. 6.00 (i.e. 50%
increase). Subsequently, it increases @ 3% every year. Bhutan is available on lease for
up to maximum 30 years and could be further renewed.
• The profitability projection has been worked out for 10 years at 80% capacity utilization
to be achieved during the first year and onwards till the third year and 90% from the
fourth year.
• Repairs & maintenance have been taken at @ 1% per annum on plant & machinery &
misc. fixed assets.
• Bank interest53 rate has been calculated @ 12% per annum on term loan & @ 13%
working capital loan.
• Insurance charges @ 0.25% on all assets in first year, then decreases @ 5% every year.
• Power & water charges are increased @ 5% every year
• Administrative expenses increases @ 5% every year.
• Margin money has been considered @ 40% on building, @ 25% on plant & machinery
and @ 25% on misc. fixed assets.
• Bank loan has been considered for repayment in 7 years with one-year moratorium.
• Preliminary exp. will be written off every year in next 10 years.
• Pre-operative exp. will be written off from second year.
• Depreciation has been charged using the Straight-Line Method
• Insurance, lease rent & interest has been taken as fixed cost for calculating B.E.P.
• Income tax54 has been charged @ 30% every year as per Bhutan's tax rates.
• DSCR - debt service coverage ratio - is defined as net operating income divided by
total debt service.
52https://www.bhutanenterprise.com/2018/06/03/investment-climate-in-
bhutan/#:~:text=Lease%20rate%20for%20Industrial%20Estate&text=4%20per%20square%20feet%20per,i.e%205
0%25%20increase%20on%20Nu.
53 The Interest Rate for term loan and working capital loan is referenced from the rate of BNB, Bhutan,
available on https://www.bnb.bt/wp-content/uploads/dld/DOCUMENTS/interest-rates.pdf (Industrial
Loan capital/Term loan Interest rate 12% (fixed rate), working capital loan 13% (fixed rate).
54 Source: Ministry of Finance - https://www.mof.gov.bt/faq/)

Investment Opportunity Study 2020 Project Profile-Manufacture of Gypsum Board
Page | 97
I.1 Estimation of Project Profitability (Nu.in Lacs) Table_ 77: Estimation of Project Profitability
Sl.
No.
Particulars 1st
Yr.
2nd
Yr.
3rd
Yr.
4th
Yr.
5th
Yr.
6th
Yr.
7th
Yr.
8th
Yr.
9th
Yr.
10th
Yr.
1 Installed Capacity 100% 288.0
0
288.0
0
288.0
0
288.0
0
288.0
0
288.0
0
288.0
0
288.0
0
288.0
0
288.00
2 Capacity Utilization 80% 80% 80% 90% 90% 90% 100% 100% 100% 100%
3 Actual Sales in lacs Nu. 230.4
0
230.4
0
230.4
0
259.2
0
259.2
0
259.2
0
288.0
0
288.0
0
288.0
0
288.00
4 Cost of Operation
4.1 Land Lease Charges 7.75 7.75 7.75 11.62 11.97 12.33 12.70 13.08 13.47 13.88
4.2 Raw Material 66.62 66.62 66.62 74.95 74.95 74.95 83.28 83.28 83.28 83.28
4.3 Consumables @ 3% 2.00 s 2.00 2.25 2.25 2.25 2.50 2.50 2.50 2.50
4.4 Power and Utility 6.00 6.30 6.62 6.95 7.29 7.66 8.04 8.44 8.86 9.31
4.5 Repair & Maintenance @1% 0.47 0.47 0.47 0.47 0.47 0.47 0.47 0.47 0.47 0.47
4.6 Salary & Wages 43.20 45.36 47.63 50.01 52.51 55.14 57.89 60.79 63.83 67.02
4.7 Fringe Benefits @15% 6.48 6.80 7.14 7.50 7.88 8.27 8.68 9.12 9.57 10.05
4.8 Insurance 0.20 1.00 1.00 1.00 1.00 1.00 1.00 1.00 1.00 1.00
4.9 Administration Expenses 3.00 3.15 3.31 3.47 3.65 3.83 4.02 4.22 4.43 4.65
Total 127.9
7
129.7
0
134.7
8
146.6
0
149.9
9
153.5
6
165.8
8
169.8
1
173.9
4
178.28
5 Marketing Expenses @10% 23.04 23.04 23.04 25.92 25.92 25.92 28.80 28.80 28.80 28.80
6 Cost of Production 151.0
1
152.7
4
157.8
2
172.5
2
175.9
1
179.4
8
194.6
8
198.6
1
202.7
4
207.08
7 Sale (Estimated Turn Over) 230.4
0
230.4
0
230.4
0
259.2
0
259.2
0
259.2
0
288.0
0
288.0
0
288.0
0
288.00
8 Profit before Interest and
Depp.
79.39 77.66 72.58 86.68 83.29 79.72 93.32 89.39 85.26 80.92

Investment Opportunity Study 2020 Project Profile-Manufacture of Gypsum Board
Page | 98
9 Interest on Term Loan @12% 11.93 10.92 8.91 6.89 4.87 2.86 0.86 0.00 0.00 0.00
10 On Working Capital @13 % 1.84 1.84 1.84 1.84 1.84 1.84 1.84 1.84 1.84 1.84
11 Total Interest 13.77 12.76 10.75 8.73 6.71 4.70 2.70 1.84 1.84 1.84
12 Profit Before Depreciation. 65.62 64.90 61.83 77.96 76.57 75.02 90.62 87.55 83.42 79.09
13 Depreciation 12.43 10.89 9.56 8.43 7.45 6.60 5.87 5.23 4.68 4.20
14 Profit After Depreciation 53.20 54.01 52.27 69.53 69.13 68.42 84.75 82.31 78.74 74.88
15 Pre-Operative Exp. W. Off 0.00 2.01 2.01 2.01 2.01 2.01 2.01 2.01 2.01 2.01
16 Preliminary Exp. W. Off 0.10 0.10 0.10 0.10 0.10 0.10 0.10 0.10 0.10 0.10
17 Profit before Taxation 53.10 51.89 50.15 67.41 67.01 66.31 82.63 80.20 76.62 72.77
18 Taxation @30% of Net Profit 15.93 15.57 15.05 20.22 20.10 19.89 24.79 24.06 22.99 21.83
19 Accumulated Profit 37.17 73.49 108.6
0
155.7
9
202.7
0
249.1
2
306.9
6
363.1
0
416.7
4
467.68
20 Profit after Taxation 37.17 36.33 35.11 47.19 46.91 46.42 57.84 56.14 53.64 50.94
21 Add: Depreciation 12.43 10.89 9.56 8.43 7.45 6.60 5.87 5.23 4.68 4.20
22 Add: Interest on Term Loan 11.93 10.92 8.91 6.89 4.87 2.86 0.00 0.00 0.00 0.00
Total (A) 61.52 58.14 53.58 62.51 59.23 55.88 63.71 61.37 58.32 55.14
23 Interest on Term Loan 11.93 10.92 8.91 6.89 4.87 2.86 0.86 0.00 0.00 0.00
24 Repayment on Term Loan 0 16.80 16.80 16.80 16.80 16.80 15.42 0.00 0.00 0.00
Total (B) 11.93 27.72 25.71 23.69 21.67 19.66 16.29 0.00 0.00 0.00
Surplus (A) - (B) 49.59 30.41 27.87 38.82 37.56 36.22 47.43 61.37 58.32 55.14
DSCR (A/B) 5.16 2.10 2.08 2.64 2.73 2.84 3.91 0.00 0.00 0.00
Average DSCR 3.07

Investment Opportunity Study 2020 Project Profile-Manufacture of Gypsum Board
Page | 99
4.21. Calculation of Interest on Term Loan (Nu. in Lacs) Table_ 78: Repayment of Interest on Term Loan
# Year Opening
Balance
Repayment Closing
Balance
Interest
1 1st year 99.42 0 99.42 11.93 11.93
2 2nd year
1st Qtr. 99.42 4.20 95.22 2.92
2nd Qtr. 95.22 4.20 91.02 2.79
3rd Qtr. 91.02 4.20 86.82 2.67
4th Qtr. 86.82 4.20 82.62 2.54 10.92
3 3rd year
1st Qtr. 82.62 4.20 78.42 2.42
2nd Qtr. 78.42 4.20 74.22 2.29
3rd Qtr. 74.22 4.20 70.02 2.16
4th Qtr. 70.02 4.20 65.82 2.04 8.91
4 4th year
1st Qtr. 65.82 4.20 61.62 1.91
2nd Qtr. 61.62 4.20 57.42 1.79
3rd Qtr. 57.42 4.20 53.22 1.66
4th Qtr. 53.22 4.20 49.02 1.53 6.89
5 5th year
1st Qtr. 49.02 4.20 44.82 1.41
2nd Qtr. 44.82 4.20 40.62 1.28
3rd Qtr. 40.62 4.20 36.42 1.16
4th Qtr. 36.42 4.20 32.22 1.03 4.87
6 6th year
1st Qtr. 32.22 4.20 28.02 0.90
2nd Qtr. 28.02 4.20 23.82 0.78
3rd Qtr. 23.82 4.20 19.62 0.65
4th Qtr. 19.62 4.20 15.42 0.53 2.86
7 7th year
1st Qtr. 15.42 4.20 11.22 0.40
2nd Qtr. 11.22 4.20 7.02 0.27
3rd Qtr. 7.02 4.20 2.82 0.15
4th Qtr. 2.82 2.82 0.00 0.04 0.86

Investment Opportunity Study 2020 Project Profile-Manufacture of Gypsum Board
Page | 100
4.22. Break Even Point Table_ 79: Yearly Estimated Break Even Point
# Particulars 1st Yr. 2nd Yr. 3rd Yr. 4th Yr. 5th Yr. 6th Yr. 7th Yr. 8th Yr. 9th Yr. 10th Yr.
1 Calculation of B.E.P.
Variable Cost 98.13 96.43 98.74 110.53 110.88 111.24 123.08 123.49 123.91 124.35
Fixed Cost 86.82 87.71 87.14 90.76 91.16 91.86 92.87 95.28 98.83 102.64
2 Break Even Point (B.E.P.) 65.64% 65.47% 66.19% 61.05% 61.46% 62.09% 56.31% 57.92% 60.23% 62.72% Average B.E.P. 61.91%
4.23. Projected Balance Sheet for the Project (10 Year) Table_ 80: Yearly Estimated Break-Even Point
# Description Construction
Period
Operation Period in Years
0 1st Yr. 2nd Yr 3rd Yr 4th Yr 5th Yr 6th Yr 7th Yr 8th Yr 9th Yr 10th Yr
1 Liabilities
1.1 Equity 56.24 56.24 56.24 56.24 56.24 56.24 56.24 56.24 56.24 56.24 56.24
1.2 General reserves 0 37.17 73.49 108.60 155.79 202.70 249.12 306.96 363.10 416.74 467.68
1.3 Debt 99.42 99.42 82.62 65.82 49.02 32.22 15.42 0.00 0.00 0.00 0.00
1.4 Current Liabilities 0.00 0.46 0.51 0.50 0.50 0.50 0.50 0.50 0.50 0.50 0.50
1.5 Working Capital Loan 0.00 14.15 14.15 14.15 14.15 14.15 14.15 14.15 14.15 14.15 14.15
Total Liabilities 155.66 207.44 227.01 245.32 275.71 305.82 335.43 377.85 433.99 487.63 538.57
2 Assets
2.1 Gross Fixed Assets 136.54 136.54 136.54 136.54 136.54 136.54 136.54 136.54 136.54 136.54 136.54
2.2 Accumulated Depreciation 0 12.43 23.31 32.88 41.30 48.75 55.35 61.22 66.46 71.14 75.34
2.3 Net fixed assets 136.54 124.11 113.23 103.66 95.24 87.79 81.19 75.32 70.08 65.40 61.20
2.4 Preliminary Expenses 1.00 0.90 0.80 0.70 0.60 0.50 0.40 0.30 0.20 0.10 0.00
2.5 Pre-Operative Expenses 18.12 18.12 16.11 14.10 12.08 10.07 8.05 6.04 4.03 2.01 0.00
2.6 Current Assets 0.00 14.49 16.56 16.56 16.56 16.56 16.56 16.56 16.56 16.56 16.56
2.7 Profit & Loss Account 0.00 0.00 0 0 0 0 0 0 0 0 0
2.8 Cash & Bank Balance 0.00 49.81 80.32 110.30 151.23 190.90 229.23 279.64 343.13 403.56 460.81
Total Assets 155.66 207.44 227.01 245.32 275.71 305.82 335.43 377.85 433.99 487.63 538.57

Investment Opportunity Study 2020 Project Profile-Manufacture of Gypsum Board
Page | 101
4.24. Environment Consideration Maintaining and sustaining the environment is of paramount importance of this
project. The manufacturing process contains no harmful ingredient. It will not create
any effluent and chemical waste. However, the plant is designed to be environment
friendly and prioritises to maintain neat and clean atmosphere through its industrial
process activities.
A large part of used gypsum board is recycled for production of fresh gypsum boards.
It’s an eco-plant and environment management system ISO 14001 will be
implemented and followed strictly to ensure that there is no compromise in
environment management.
4.25. Conclusion Gypsum board is a relatively new product for construction industry in Bhutan.
However, keeping in view the international trend for promotion of green materials of
traction and the strong emphasis of Bhutan government on protection of environment
and sustainable development, opportunity for production of gypsum board in Bhutan
is feasible. India is going to be big market for gypsum board in future and if a unit can
be set up for production of gypsum board in Bhutan, it could cater to a large part of
Indian market also.
The proposed gypsum board plant is a viable project in terms of availability of gypsum
which is locally available in Bhutan. The project needs to use electricity to operate dryer
and equipment which is abundantly available. The cost of electricity in Bhutan is lower
comparison to neighboring Indian states. Manufacturing process of gypsum board is
environment friendly and generates no impact on the environment. These advantages
provide opportunity to make the gypsum board in Bhutan and export to Indian market.
Gypsum board is able to reduce the use of wood in constriction for ceiling wall
paneling, insulation and various other purposes with low prices and modern look with
similar effect of insulation. Gypsum board is a recyclable and therefore, termed as
green material of construction.
The project is financially viable with Net Profit Ratio of 25.32%. It needs around 19
employees include managerial staff, skill and unskilled staff to operate the plant. The
financial ratios are positive during the first 5 years of operation. The average DSCR is
3.07 which implies that the project would generate sufficient funds to cover its cost,
including loan repayments and interest payments during the period. This also indicates
that the project can continue making profits even after 5 years.
Based on the estimation of project cost and financial analysis, production of Gypsum
board manufacturing unit is financially viable, profitable with high rate of return.
Investment Opportunity Study 2020 Project Profile-Manufacture of Gypsum Board
Page | 102
It is recommended to entrepreneurs to scale the business up to Industrial level.
4.26. Source of Technology The manufacturing process is covered under engineering sector. The state-of-the-art
modern equipment can be sourced from India. Some of the leading manufacturers for
the equipment include the following (individuals are advised to conduct their own
research to seek suppliers and the following list does not indicate the consultant’s
opinion on the choice of supplier and is only for basic information based on first hand
search): Some of equipment and machines suppliers are as follows:
Vogue Marketing Technologies
Chandra Sekhar (Managing Director)
Address: No. 3, 2nd Floor, 5th Cross, P & T Layout, Horamavu, Kalyan Nagar Post,
Bengaluru, Karnataka - 560 043, India
Phone: +91-8042126294
Mobile+91-9663367255, 9845380695
Website: www.indiamart.com/vogue-marketing
Libran Engineering and Services
Address: C-33, First Floor, Malviya Nagar near HDFC Bank,
New Delhi, Delhi - 110 017, India
Phone: + 91-11-26681175
Mobile: + (91)-9811055650
Website: https://www.indiamart.com/libran-engineerinew-delhi/- and
libranengineering.com
Reference:
• Plant Machine Supplier
http://geodrytech.com/ribbon-blender.html
https://gzglory.en.alibaba.com/product/60403242797-
802684861/Silicone_mold_for_gypsum_ceiling_tiles.html
https://www.indiamart.com/proddetail/small-edge-cutting-machine-14346794097.html
https://www.indiamart.com/proddetail/industrial-ovens-16813685497.html
https://www.despatch.com/drying.html
• https://s3-us-west-2.amazonaws.com/prd-wret/assets/palladium/production/mineral-
pubs/country/2006/myb3-2006-bt-np.pdf
• Note: Land Area Measurement - 1 Decimal = 40.46 Sq. Mt.

Investment Opportunity Study 2020 Project Profile-Manufacturing of Chewing Gum
Page | 103
Project Title:
Manufacturing of Chewing Gum

Investment Opportunity Study 2020 Project Profile-Manufacturing of Chewing Gum
Page | 104
5. Manufacturing of Chewing Gum
5.1. Background of the Idea Chewing gum is a sweetened, flavoured confection composed primarily of latex, both
natural and artificial55. Organic latex, a milky white fluid produced by a variety of seed
plants, is best known as the principle component of rubber. Used as a snack, gum has
no nutritive value, and, when people have finished chewing, they generally throw it
away rather than swallow it. Chewing gum base consists either of natural latex or a
synthetic substitute.
Natural latex such as chicle is harvested by making large X-marks on rubber trees and
then collecting the substance as it runs down the tree. After grinding the base to form
a coarse meal, the mixture is dried for a day or two.
The chewing gum segment is the fastest growing segment of confectionery industry
is growing at a CAGR of approximately 7% for past few years due to mouthful of
benefits as per market research article published on buisnesswire.com (A leading
market research company)56. It is said to relieve stress, helps in weight management,
increases alertness and focus.
All these factors result in the increasing demand of chewing gum in people of every
age group. Innovation in chewing gum is another important driver of this industry.
Different flavours, flexibility and variety in gum attract consumers and the current
trends suggest consumers prefer gum with natural colours and avoid usage of
synthetic and azo colours.
5.2. Rationale of the Idea As per the ground survey reports, monthly import of chewing gums is about Nu. 12
million of which about Nu. 8 million worth is imported by Tashi Commercial
Corporation (TCC) alone. As per the Bhutan Trade Statistics57 (2015-2019) the import
of chewing gum and the price chart is as per the figure below.
Increased economic activities particularly under Production and Manufacturing Sector
has led to such an accelerated demand for chewing gum that it is expected to grow
with the given trend.
55https://www.encyclopedia.com/sports-and-everyday-life/food-and-drink/food-and-
cooking/chewing-gum#:~:text=Chewing%20sticks. 56https://www.businesswire.com/news/home/20100113006086/en/Research-Markets-Chewing-Gum-
Market---Growing 57 https://www.mof.gov.bt/publications/reports/bhutan-trade-statistics/

Investment Opportunity Study 2020 Project Profile-Manufacturing of Chewing Gum
Page | 105
Figure 1: Import of Chewing Gum in Bhutan
5.3. Market Outlook International Global Chewing Gum Market was valued at US$ 16.75 billion in 2017, and is expected
to reach US$ 19.642 billion by 2026 at a CAGR of 2.01% during the forecast period58.
This can be attributed to the growing importance of oral health and fitness concerns
among the millennials. However, the consistent product modifications coupled with
the rising preference for functional ingredients results in increasing demand for sugar-
free products over the forecast period.
Figure 2: Fig 2. Global Chewing Gum Market by Region (2019-2027)
This industry is also driven by the modern age sugar-free chewing products which aid
oral hygiene and weight management. Rising consumer awareness about the health
benefits of sugar-free products such as caffeinated products is used to boost the
energy levels and metabolism rate. The market is growing due to increasing consumer
interest in healthy and sugar-free products.
58 https://www.maximizemarketresearch.com/market-report/global-chewing-gum-market/27775/
83,793,754
13,656,622
87,192,591
61,307,397
16,643,329
0
10,000,000
20,000,000
30,000,000
40,000,000
50,000,000
60,000,000
70,000,000
80,000,000
90,000,000
100,000,000
Amount in Nu. (Millions)
2015 Chewing Gum 2019 Chewing Gum 2016 Chewing Gum 2017 Chewing Gum 2018 Chewing Gum

Investment Opportunity Study 2020 Project Profile-Manufacturing of Chewing Gum
Page | 106
Moreover, increasing fitness concerns among people renders a shift towards low-
calorie chewing products. This is a major driving factor for the growth of sugar- free
chewing product.
5.4. The Concept The concept of this investment idea is not to invest in large scale manufacturing plant
but in a small-scale plant with large raw material of sourcing of latex, gum base and
sweeteners. Price in the local market based on interviews with the retailers and
shopkeepers is around Nu. 330 per kg when sold in Bhutan.
Although Chewing gum sourcing from India can be the most desired option, statistics
from BTS59 shows the price at around Nu. 199 per kg which would render the overall
cost of production high.
Figure 3: Import Price of Chewing Gum
The financial estimates and size of the plan is determined with the following
assumptions:
• Raw material sourcing
• The cost of raw materials
• The selling prices
5.5. Existing Competitors Apart from importers, today there is no manufacturer of chewing gum in Bhutan.
Although a good market scope has been highlighted as it is very popular with the
common people.
59 https://www.mof.gov.bt/publications/reports/bhutan-trade-statistics/
0
50
100
150
200
250
Chewing Gum Chewing Gum Chewing Gum Chewing Gum Chewing Gum
2015 2016 2017 2018 2019
Price in Nu. Per KGM Price in Nu. Per KGM

Investment Opportunity Study 2020 Project Profile-Manufacturing of Chewing Gum
Page | 107
5.6. Raw Material Requirements and Sourcing
The following major raw material details are provided considering a production
volume of 1,000 kg per day. The raw material details with costing are as follows:
Table 1: Cost of Raw Material
# Particular Requirement
Per day (Kg.)
Requirement
Per Annum ( Kg.)
Rate Nu. Per Kg.
Total
Amount
Per Annum (Nu.in Lacs)
1. Gum Base60 300 90000.00 200.00 180.00
2. Sweeteners61 400 120000.00 435.00 522.00
3. Glycerin62 80 24000.00 100.00 24.00
4. Softener/Plasticizer63 20 6000.00 60.00 20.00
5. Flavors 15 4500.00 350.00 15.75
6. Colors 5 1500.00 1000.00 15.00
7. Polyol Coating 10 3000.00 140.00 4.20
Total 234000.00 780.95
5.7. Equipment Requirements64
Following plant, machinery and equipment are required for the proposed project.
Table 2: Cost of Equipment
# Particular Qty
.
Rat
e
Valu
e (Nu. In Lacs)
1. Fully Automatic Chewing Gum Production Line 150-
300kg/hr.
1 25.5 25.50
2. This production line is professional for producing dragee
chewing gum with high capacity. It is composed of the
sugar mill, gum base oven, mixer, extruder, cooling tunnel,
roller and forming machine, cooling breaking drum, dragee,
machine, packaging machine. The processing line is an
advanced equipment for making square shape sugar shell
coated chewing –gums.
60 https://dir.indiamart.com/impcat/sweetener.html 61 https://dir.indiamart.com/impcat/gum-ester.html 62 https://dir.indiamart.com/impcat/plasticizers.html 63http://www.sinofude.net/fully-automatic-chewing-gum-production-line-
2534057.html#:~:text=This%20production%20line%20is%20professional,dragee%2C%20machine%2C
%20packaging%20machine. 64http://www.sinofude.net/fully-automatic-chewing-gum-production-line-
2534057.html#:~:text=This%20production%20line%20is%20professional,dragee%2C%20machine%2C
%20packaging%20machine.
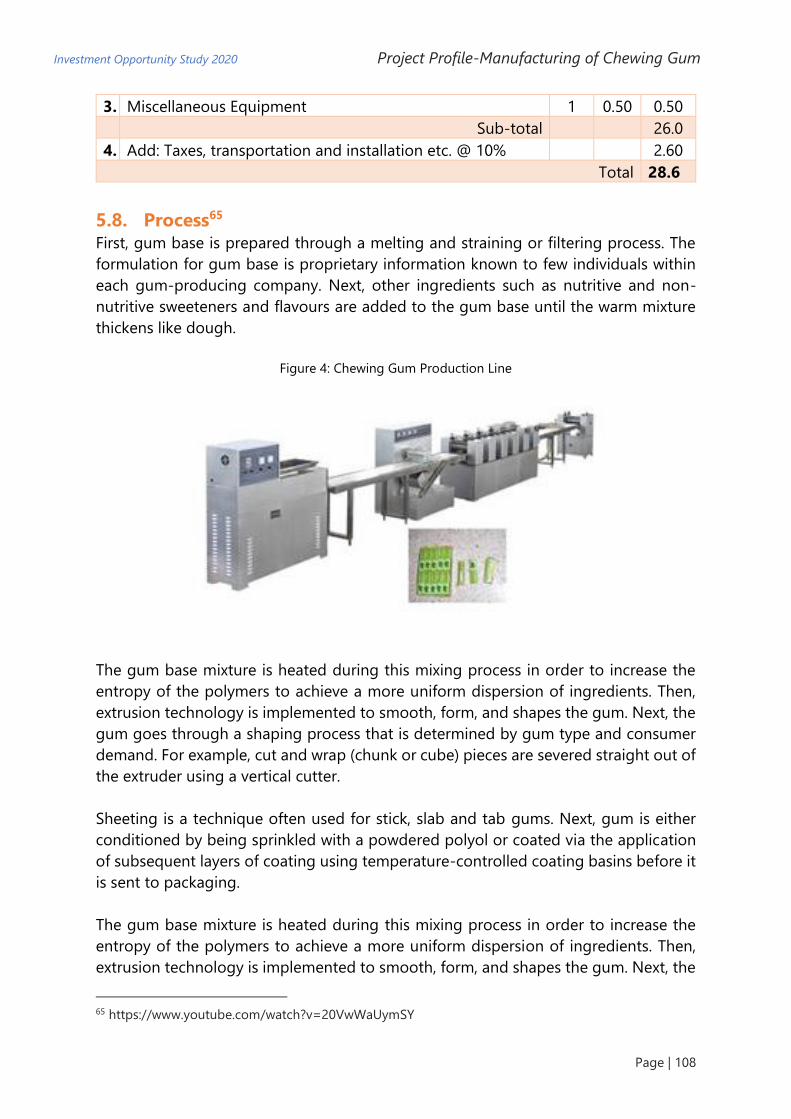
Investment Opportunity Study 2020 Project Profile-Manufacturing of Chewing Gum
Page | 108
3. Miscellaneous Equipment 1 0.50 0.50
Sub-total
26.0
4. Add: Taxes, transportation and installation etc. @ 10%
2.60
Total 28.6
5.8. Process65 First, gum base is prepared through a melting and straining or filtering process. The
formulation for gum base is proprietary information known to few individuals within
each gum-producing company. Next, other ingredients such as nutritive and non-
nutritive sweeteners and flavours are added to the gum base until the warm mixture
thickens like dough.
Figure 4: Chewing Gum Production Line
The gum base mixture is heated during this mixing process in order to increase the
entropy of the polymers to achieve a more uniform dispersion of ingredients. Then,
extrusion technology is implemented to smooth, form, and shapes the gum. Next, the
gum goes through a shaping process that is determined by gum type and consumer
demand. For example, cut and wrap (chunk or cube) pieces are severed straight out of
the extruder using a vertical cutter.
Sheeting is a technique often used for stick, slab and tab gums. Next, gum is either
conditioned by being sprinkled with a powdered polyol or coated via the application
of subsequent layers of coating using temperature-controlled coating basins before it
is sent to packaging.
The gum base mixture is heated during this mixing process in order to increase the
entropy of the polymers to achieve a more uniform dispersion of ingredients. Then,
extrusion technology is implemented to smooth, form, and shapes the gum. Next, the
65 https://www.youtube.com/watch?v=20VwWaUymSY

Investment Opportunity Study 2020 Project Profile-Manufacturing of Chewing Gum
Page | 109
gum goes through a shaping process that is determined by gum type and consumer
demand. For example, cut and wrap (chunk or cube) pieces are severed straight out of
the extruder using a vertical cutter.
Sheeting is a technique often used for stick, slab and tab gums. Next, gum is either
conditioned by being sprinkled with a powdered polyol or coated via the application
of subsequent layers of coating using temperature-controlled coating basins before it
is sent to packaging.
5.9. Other Requirements • Land: About 500-800 m2
• Manpower of 10 people which includes Supervisor, Accounts and
Administration, two support staffs (technician and driver) and 6 factory front
line workers.
5.10. Basic Financial Calculations The calculation is based on fairly conservative values of production of 30,000 kgs
(300MT) of chewing gum per annum, employing 10 people, purchasing of raw material
as mentioned in the cost of raw material in table 1. The selling price is proposed at Nu.
330 per kg which may vary on the quality and flavours. The production will be done
on single shift basis (8 hr.) and 300 days in a year. Some financial trends are as follows:
Table 3: Basic Financial Trends
Particulars Description Amount
(Nu. in Lacs)
Establishment Cost 42.50
Operation Cost 836
Fixed Cost 36
Salaries (10 people) 30
Overhead Cots (20%) including
utility bills
6
Variable Costs 800
Raw Material Cost 780
Misc. 20
Profit Margin( Revenue
Generation)
Production 300MT annual and
sale Price Nu.330 per Kg.
990
Break Even Units
(Production)
261MT
Break Even Months 23 Months
Annual PAT after BEP 111.50
Annual PBT after BEP 78.05
• The BEP in months is 23 months

Investment Opportunity Study 2020 Project Profile-Manufacturing of Chewing Gum
Page | 110
5.11. Conclusion The demand for chewing gum is only growing both in the local and the international
market. The Establishment Cost is around Nu. 2.6 million which can be managed by
entrepreneur’s investment and by capital loan through financial institutions.
It will generate direct employment as well as indirect employment on multiplier basis
for provision of support services for the plant. Maintaining and sustaining the
environment is of paramount importance of this project. It will not create any effluent
byproduct. The project is recommended to be a viable project under domestic
investment along with marketing and technology collaboration with International
Companies. Before commencement, a detailed feasibility is recommended for the
proposed business Idea.
5.12. Chewing Gum Production Line Supplier Leading manufacturers 66 for the chewing gum production line equipment include
(individuals are advised to conduct their own research to seek suppliers. The following
list does not indicate the consultant’s opinion on the choice of supplier and is only for
basic information based on first hand search):
Shanghai Fude Machinery Manufacturing Co.,
Ltd.
Mr Victor Yin (Manager)
No 329, Huayuan Cun,
Huqiao Town, Fengxian, Shanghai
Prc, Shanghai - 201417, China
Phone :86-21-57416165
Mobile: +8613917870833
Website: www.sinofude.net
Shri Verai Engineering
Mr. Rajubhai I. Prajapati
41-42, Bhagirath Estate, Part-2, B/H. Swastik
Textile Industries,Gulabnagar, Amraiwadi,
Ahmedabad - 382426, Gujarat, India
919426545369, + 919898036414
www.shriveraiengineering.com
5.13. Other References: ▪ BhutanTradeStatistics2019260320201.pdf
▪ www.businesswire.com
▪ www.mof.gov
▪ https://www.youtube.com/watch?v=qt03qI0fS_I
▪ https://dir.indiamart.com/impcat/chewing-gum-making-plant.html
66 Image from
https://www.trekearth.com/gallery/Asia/Bhutan/West/Paro/Paro_Festival/photo1261163.htm

Investment Opportunity Study 2020 Project Profile-Manufacturing of Corrugated Paper Board Containers
Page | 111
Project Title:
Manufacturing Plant of Corrugated
Paper Board Containers

Investment Opportunity Study 2020 Project Profile- Manufacturing of Corrugated Paper Board Containers
Page | 112
6. Manufacturing of Corrugated Paper Board Containers
6.1. Background of the Idea Packaging plays a very important role in a country's economy. Till recently, only the
developed countries cared about proper packaging. However, now, even developing
countries like India have changed their outlook towards packaging and in the last few
years increasing focus has been laid to improve and provide proper packaging. In fact,
today, packaging is as important as the product itself.
Corrugated Kraft Paper Board Box, technically called Corrugated Fibre Board Box, is
the most popular shipping container used today. The box is manufactured from
corrugated board which consists of 3 or more layers of kraft paper. The middle-fluted
layer is pasted with two flat parallel sheets of paper. The boxes find their number of
applications in the packaging of chemicals & drugs, tobacco, engineering goods,
canned & bottled goods, food products, lamps, electrical appliances, glass wares etc.
6.2. Rationale of the Idea67 The import of corrugated cartoon boxes has increased in Bhutan by 178% in the past
five years. Data from Bhutan Trade Statistics (2015-2019) shows that the import in 2019
reached at all time high of Nu 92.66 million.
Increased economic activities particularly under Production and Manufacturing Sector
has led to such an accelerated demand for cartoon boxes and is expected to grow
given the current trend.
Figure 5: Import of Cartoon Boxes in Bhutan
67 https://www.mof.gov.bt/publications/reports/bhutan-trade-statistics/
48
50
52
54
56
58
60
62
64 -
10
20
30
40
50
60
70
80
90
100
2015 2016 2017 2018 2019
Am
ou
nt
in N
u.
Am
ou
nt
in N
u. (M
illi
on
s)
Corrugated Non-corrugated Price Per Kg Corrugated

Investment Opportunity Study 2020 Project Profile- Manufacturing of Corrugated Paper Board Containers
Page | 113
6.3. Market Outlook International The corrugated and paperboard boxes market has experienced an enormous growth
over the past years, and as per the prediction, the global corrugated and paperboard
boxes market is likely to grow at a rapid pace over the forecast period. The rising
population and growing per capita income are the major growth driver for the
corrugated and paperboard boxes market.
• The packaging industry is growing at 14-15% annually. This growth rate is
expected to double in the next two years.
• According to the Indian Packaging Institute, Indian Packaging industry is USD
14 billion and growing at more than 15% per annum. These figures indicate
towards a change in the industrial and consumer set up.
• The flexible packaging segment is estimated to be growing at over 35%
annually.
• The industry is comprised of a large number of manufacturers of basic materials,
converted packages, machinery and ancillary materials.
• Currently, India is ranked 15th in the world for its paper and paperboard
consumption and is expected to improve its rank in the future.
• Indian packaging machinery imports are worth USD 125 million.
6.4. The Concept68 The concept of this investment idea is not to invest in large scale manufacturing plant
but in a small-scale plant with large raw material of sourcing of used cartoon boxes.
Price in the local market based on interviews with the waste collectors is around Nu.
10 per kg when sold in the bordering town of Jaigaon.
Although the Kraft Paper which can be sourced from India is the most desired option,
statistics from BTS shows the price at around Nu. 27 per kg, it would render the overall
cost of production high.
The financial estimates and size of the plan is determined with the following
assumptions:
• Raw Material sourcing from waste cardboards souring up to 10% of the
imported materials i.e. 150,000 kgs annually
• The cost of raw materials at Nu. 10 per kg (based on current prices)
• The selling price assuming Nu. 50 per kg (i.e. Nu. 12 lesser than the prevailing
rates of imported cartoon boxes)
68 https://www.mof.gov.bt/publications/reports/bhutan-trade-statistics/

Investment Opportunity Study 2020 Project Profile- Manufacturing of Corrugated Paper Board Containers
Page | 114
Figure 6; Price Fluctuations for Import of Corrugated Cardboard (Nu./ kg)
6.5. Existing Competitors Apart from importers, there are three registered establishments of corrugated cartoon
boxes. Although they highlighted good market scope, the contradictory directives of
the government on the use of single use plastics for bottled water packaging is now
fast replacing cartoon boxes and it has been highlighted as an issue.
6.6. Raw Material Requirements and Sourcing
Sl. no. Raw Material
1 Kraft Paper (various grammage)69
2 Printing Ink70
3 Stitching Wire71
4 Binding Cloth72
5 Adhesives73
7 Misc. Consumable Stores
8 Packing Materials
69 https://www.indiamart.com/proddetail/kraft-paper-corrugated-box-16827561312.html 70 https://www.indiamart.com/proddetail/corrugated-box-printing-inks-12487821762.html 71 https://www.indiamart.com/royalwireindustries/corrugated-box-stitching-wire.html 72 https://www.indiamart.com/shaktiudyog-delhi/binding-cloth.html 73 https://www.starchdextrinadhesives.com/corrugated-box-adhesives.htm
58
53
63
57
62
50
55
60
65
2015 2016 2017 2018 2019
Price Fluctuations for Import of Corrguated Cardboard (Nu./ kg)

Investment Opportunity Study 2020 Project Profile- Manufacturing of Corrugated Paper Board Containers
Page | 115
The following major raw material details are provided considering a production
volume of 2,000 cartoon boxes per day of 150 gsm quality and 30cmx30cmx40cm
dimension.
Table 4: Cost of Raw Material
# Particular Requirement
Per day
(Kg.)
Requirement
Per Annum
( Kg.)
Rate
Nu.
Per
Kg.
Total
Amount
Per
Annum
(Nu.in
Lacs)
1 Kraft Paper (various
grammage)
1500 450000.00 40.00 180.00
2 Glue (Starch) 145 43500.00 30.00 13.05
3 Stitching Wire 28 8400.00 45.00 3.78
Total 501,900.00 196.83
Note: Cost of Raw material for first three months is Nu. 4.9 million.
6.7. Equipment Requirements Following plant, machinery and equipment are required for the proposed project:
Table 5: List of Required Equipment
Description Qty. Rate (Nu.) Amount (Nu.)
A. Corrugating Unit
Single Face Corrugating M/c 1 300,000 300,000
Slitting Attachment with cutter 1 18,000 18,000
Board Cutter (62” x 62”) 1 26,000 26,000
Sheet Pasting Machine 1 44,000 44,000
B. Box Making Unit
Bar Rotary Cutting &Creasing M/c (95”) 1 195,000 195,000
Eccentric Slotter (42”) 1 195,000 195,000
Partition Slotter (42”) 1 45,000 45,000
Stitching Machine (30”) 1 25,000 25,000
Stitching Machine (36”) 1 30,000 30,000
Vertical Bending Machine,(72”) 1 140,000 140,000
Single Slotting Machine (12”) 1 15,000 15,000
C. Printing Unit
Multi-colour Offset Printing M/c1 1 1,000,000 1,000,000
Screen Printing Equipment 1 50,000 50,000
D. Testing Equipment
Bursting Strength Factor Tester 1 30,000 30,000
Grammage Tester 1 5,000 5,000
Compression Strength Tester 1 150,000 150,000
Puncture Resistance Strength M/c 1 30,000 30,000
Cost of Equipment 2,298,000
Cost of installation, erection, commissioning 20% 459,600
Taxes, Freight Insurance etc. 10% 229,800
Total 2,987,400

Investment Opportunity Study 2020 Project Profile- Manufacturing of Corrugated Paper Board Containers
Page | 116
6.8. Process The manufacturing process is described below with the flow chart.
6.8.1. Based on use of Recycled Paper74
1.7.2 Based on Kraft Paper75
74https://www.alibaba.com/product-detail/Carton-box-paper-testliner-cardboard-
paper_60300847050.html 75 http://www.corrugated-box-machine-china.top/the-process-from-pulp-to-corrugated-box.html

Investment Opportunity Study 2020 Project Profile- Manufacturing of Corrugated Paper Board Containers
Page | 117
6.9. More Details More details on the process can be found from the following sources and videos for
better understanding:
Table 6: Link for more Details
Reading Materials Videos
http://www.madehow.com/Volume-
1/Corrugated-Cardboard.html
https://www.youtube.com/watch?v=
C5nNUPNvWAw
http://202.241.100.15/data/000007638.pdf https://www.youtube.com/watch?v=
ybGr0IWL0BE
https://www.dcmsme.gov.in/reports/Corrug
ated%20boxes.htm
https://www.youtube.com/watch?v=
yRT0gXyc3n0
6.10. Other Requirements • Land: About 1.000 m2
• Manpower of 12 people which includes Manager, Accounts and Administration,
two support staffs (technician and driver) and 8 factory front line workers.
6.11. Basic Financial Calculations The calculation is based on fairly conservative values of production of 150,000 kgs
using waste materials, employing 10 people, purchasing of raw material at Nu. 20 per
kg and additional Nu.5 per kg for other items such as glue. The selling price is
proposed at Nu. 50 per kg which is lower than the imported products.
Some financial trends are as follows: Table 7: Basic Financial Trends
# Particulars Details Amount in Nu.
1. Equipment Cost
2,987,400
2. Fixed Cost
3,210,000
Salaries (10 people) 2,400,000
Overhead Cots (15%) 810,000
3. Variable Costs
3,750,000
Raw Material Cost (Nu. 20/kg) 3,000,000
Other materials Cost (Nu. 5/kg) 750,000
4. Selling Price Nu. 50 per kg 7,500,000
5. Break Even Units
247,896
6. Break Even Months
20
7. Annual PAT after BEP
540,000
8. Annual PBT after BEP
378,000
• The BEP in months is 20 months

Investment Opportunity Study 2020 Project Profile- Manufacturing of Corrugated Paper Board Containers
Page | 118
• Although the annual income is less, it does not account for increase in
production and selling price. For example, if the capacity is increased from
150,000 kgs to 165,000 kgs the PBT increases to Nu. 850,000.
6.12. Annex A: List of Equipment Suppliers Some of the leading manufacturers for the equipment include (Individuals are advised
to conduct their own research to seek suppliers. The following list does not indicate
the consultant’s opinion on the choice of supplier and is only for basic information
based on first hand search):
Bandma Packaging76
Natraj Corrugating Machinery
Company77
Sun-Up78
Bandma House
E – 36 A, New Multan Nagar,
Near Paschim Vihar Metro Station,
Rohtak Road, New Delhi – 110056
+91 11-45518758
Rishi Nagpal (CEO)
Plot No. 22-23, Village: Mithrol
Tehsil: Hodal,
Palwal – 121006,
Haryana, India
Mobile: +91-9810275497
Fax: +91-129-4109400
Sun-upindia
1, Suyog Industrial Estate,
Opp. Vitrum Glass Factory,
L.B.S. Marg, Vikhroli (W),
MUMBAI – 400083
+91 9821093645
76 https://bandmainfo.com/contact-us/ 77 https://natrajmachinery.co.in/contact/ 78 http://www.sun-upindia.com/contact.asp

Investment Opportunity Study 2020 Project Profile- Manufacturing of Toothpicks and Ear Buds
Page | 119
Project Title:
Manufacturing Bamboo Toothpick and Ear Buds

Investment Opportunity Study 2020 Project Profile- Manufacturing of Toothpicks and Ear Buds
Page | 120
7. Manufacturing of Bamboo Toothpick and Ear Buds
7.1. Background of the Idea Bamboo is a versatile non-wood forest product. It is often considered to be a
replacement of wood and used in both modern industrial and traditional cottage
sectors such as furniture, hut constructions, support in civil construction activities,
household’s items, handicraft and decorative items, etc.
The bamboo handicraft is one of the oldest crafts known in Bhutan. It’s called “Tsharzo”
in Bhutanese. It is one of the highly renewable resources in the Bhutanese socio-
economic-cultural-ecological-climatic-functional context. It has broad range of rural
and semi urban cottage industries that provide livelihood for the villagers in Bhutan.
Looking at the importance of bamboo and skill sets that are available, a project to
manufacture toothpick and ear buds from Bamboo has been recommended. Bhutan
has good bamboo repository and it makes the unit viable as there is also a good
market in Bhutan and in India and other countries.
7.2. Rationale of the Idea Toothpick and cotton ear buds are one of the daily consumable items which are used
in almost all the household and hotels. Being consumable items, the demand is
continuous. Factors such as rising population, increasing hygiene awareness, and
increasing per capita expenditure of consumers are identified as major demand drivers
in the market.
The side effects of traditional plastic cotton buds are also triggering a rise in the
demand of bamboo and wood-based cotton buds market. Johnson & Johnson and
tulip are the leading manufacturer of cotton buds as well as toothpicks.
Several Indian manufacturers have already introduced environment friendly cotton
buds manufactured from chemical free organic cotton and rolled on bamboo and
paper rolled stick. Consumers are shifting towards natural products or plastic free
items.
In Bhutan, hotels and restaurants are in regular demand of these items which make up
a readily available market for these “Made in Bhutan” ear buds and toothpicks. Two
licenses have been issued for manufacturing of bamboo toothpicks in Bhutan.
7.3. Product Group
7.3.1. Toothpick
Toothpick is a small thin stick of wood, plastic, bamboo, metal, bone or other material
with at least one and sometimes two pointed ends to insert between teeth to remove
detritus, usually after a meal. Toothpicks are also used for festive occasions to hold or
Investment Opportunity Study 2020 Project Profile- Manufacturing of Toothpicks and Ear Buds
Page | 121
spear small appetizers (like cheese cubes, fruits or olives) or as a cocktail stick79.
▪ Specification: Diameter 2.2mm and length 65mm.
7.3.2. Ear buds
Ear bud is a small wad of cotton wool rolled on a short, thin stick made by wood or
bamboo or plastic used for cleaning the ears and for cosmetic purposes. They are
most commonly used for ear cleaning, although this use is not recommended by
physicians.
Specification:
• No. of cotton swabs per stem - 2
• Diameter of cotton swabs tips - 5mm to 10mm
• Overall swab length of cotton bud – 70 to 78mm
• Diameter of stick: 2.7mm
The market of cotton buds is, however, dominated by some national brands. But local
manufacturers still have a huge market to explore due to the low cost of technology
and high growing market demand for quality products.
7.4. 1.3 Market Outlook International80 If produced with elegant quality and convenient packaging, the market of bamboo ear
buds and toothpick is readily available in Bhutan as well as the international arena
including India, Europe and MENA Countries.
There are about 10,157 licensed81 hotel, bar, restaurant, beauty parlors operational in
Bhutan. These are the ready markets.
A report by a market research company called Euromonitor International stated: “India
ear buds market is estimated to grow by a 6% retail volume CAGR and 2% value CAGR
at constant 2014 prices over the forecast period till 202082. Tulips and Johnson &
Johnson (India) are dominating this market and other small-scale brands i.e. Bela, Bliss,
Flice, Femiss, Felcon, Qtips etc. are also performing well.”
As per businesswire.com, a global market research web portal, “The global cotton ear
buds market accounted for a volume of 543.75 billion units in 2017, expected to
expand at a CAGR of 3.4% from 2018 to 2026”.
79 https://en.wikipedia.org/wiki/Toothpick 80 Cotton Buds Market | Extruded Plastics. http://www.plastemart.com/news-plastics-
information/cotton-buds-market-is-expected-to-grow-at-the-cagr-of-3-4-during-2018-2026/48684 81 As per report “nic_2004_struc_detail.pdf”(Bhutan). 82 https://www.euromonitor.com/cotton-wool-buds-pads-in-india/report

Investment Opportunity Study 2020 Project Profile- Manufacturing of Toothpicks and Ear Buds
Page | 122
Factors such as rising population, increasing hygiene awareness, and increasing per
capita expenditure of consumers are identified as major drivers triggering a growth in
demand in the market. However, two entrepreneurs have been licensed. Nonetheless,
there is still good scope for new and established entrepreneurs to start a toothpick
and ear buds manufacturing unit under cottage industry segment.
7.5. The Concept As per the RNR statistics, in 201783, 119,288 numbers of bamboos were harvested in
Bhutan making the manufacture of ear buds and toothpick possible. The government
of Bhutan may provide necessary support and intervention to enhance production of
these ecofriendly bamboo products.
7.5.1. Plant Capacity
1. Bamboo ear buds = 20,000 per day = 6 million per year
2. Bamboo toothpicks = 20,000 per day = 6 million per year.
7.5.2. Packaging Scale
a. Bamboo Ear Buds – 1, 12, 24, 48,100, 200 nos. per packaging.
b. Bamboo Toothpicks – 4, 10, 24, 50,100, 200, 500 nos. per packaging.
7.5.3. Availability of Raw Material
There are three basic raw materials required for the manufacture of toothpick and ear
buds i.e.
i. Bamboo (spindle or stick)
ii. Cotton - rayon (absorbent material) and
iii. Recyclable packaging material (paper, PET transparent wide mouth containers
and card board boxes).
Zhemgang, Mongar, Trongsa, Dagana, Trashigang and Sarpang are the major bamboo
production Dzongkhags in Bhutan84. The other raw material such as cotton, plastic
containers can be easily sourced from adjoining Indian cities.
7.5.4. Proposed Location for Plant
Jigmeling in Sarpang and Motanga Industrial Parks Samdrup Jongkhar.
83 https://drive.google.com/file/d/1WIIyqR7csLPQSH5-Kirg7sSUy4r6OMMr/view 84 http://www.dofps.gov.bt/wp-content/uploads/2016/03/FFF-2018.pdf

Investment Opportunity Study 2020 Project Profile- Manufacturing of Toothpicks and Ear Buds
Page | 123
7.6. Manufacturing Process The proposed plant will produce Toothpick and Bamboo Cotton Swabs (Ear buds)
made by biodegradable bamboo and soft cotton and bamboo Toothpicks. After
usage, these can be disposed off in organic waste or compost.
7.6.1. Ear Buds Manufacturing process
Making ear buds entails a series of processing activities like spindle making, applying
of adhesive materials, wrapping of cotton around the glue coated spindle end
(approximately 0.05 to 1 gram of cotton), compressions, chemical coating (cellulose
polymer) etc. After completion of this process cotton buds are ready for packaging
and supply. These are packed in the polyethene pouch and carton box.
Spindle are made from bamboo through the state-of-the-art bamboo processing
machines such as bamboo sawer, splitter machine, dissection machine, flaker machine
and further processed by sawing machine, bamboo filament shaping machine as per
required length and diameter.
Figure 7: Ear Buds Making Machine
7.6.2. Toothpicks Manufacturing
It is basically a conversion of bamboo into fine quality small toothpicks sticks. The
process entails collection of original bamboo - cutting bamboo stick – section open
piece of fixed width into silk, bleaching, drying, cutting, pointing and packaging.
The raw bamboo processing equipment’s for both products are same and simple in
operation. Equipment can easily be sourced from India (Assam and Kolkata). Automatic
and semi-automatic machines are used to produce cotton buds. Packaging machines
are used to pack the beds in pouches.

Investment Opportunity Study 2020 Project Profile- Manufacturing of Toothpicks and Ear Buds
Page | 124
Figure 8: Toothpick Making Process and Equipment’s
7.7. Equipment and Machinery The initial bamboo processing is same for both products and equipment used include
raw bamboo sawer, dissection machine, flaker, filament shaping machine, polishing
machine stick set-size machine, and finishing machine. The end product is produced
through specific machines like toothpick sharpened machine and ear buds making
machine. Simple pouch sealing machine and corrugated wrapping machine is used for
packaging. Equipment suppliers are listed in “annexure A”.
7.8. More Details More details on the process can be found from the following sources and videos for
better understanding: Table 8: Addition Sources and Videos for Further Reference
Reading Materials Videos
https://en.wikipedia.org/wiki/Toothpick https://www.youtube.com/watch?
v=oxNMXdsO48Y
https://www.businesswire.com/news/home/20180615005229/e
n/Global-Cotton-Buds-Market-2018-Size-ShareThe%20
https://www.youtube.com/watch?
v=o_nPzMt0KW4
Cotton Buds Market | Extruded Plastics.
http://www.plastemart.com/news-plastics-information/cotton-
buds-market-is-expected-to-grow-at-the-cagr-of-3-4-during-
2018-2026/48684
https://www.youtube.com/watch?
v=lxcXQx54tFo
7.9. Basic Financial Calculations The financial calculation is based on fairly conservative values of production of 20,000
toothpick per day @ Nu 0.35, and 20,000 ear buds per day @ Nu.0.55 with the plant
operational for 300-day work year.

Investment Opportunity Study 2020 Project Profile- Manufacturing of Toothpicks and Ear Buds
Page | 125
The production targets are considered at production of 6 million toothpick and ear
bud each annually. The sale price is considered as Nu. 0.35 per toothpick and 0.55 per
ear bud.
Basic financial calculations are detailed in the table below:
Table 9: Basic Financial Calculations
Particulars Description Value
Establishment Cost Nu. 2,350,000
Operation Cost Nu. 1,998,100
Fixed Cost Nu. 1,656,000
Salaries (9 people) Nu. 1,440,000
Overhead Cots (15%) including
utility bills
Nu. 216,000
Variable Costs Nu. 342,100
Raw Material Nu. 311,000
Misc. Nu. 31,100
Profit Margin (Revenue
Generation)
Tooth Pick 20000 per day @
Nu0.35, Ear Bud 20000 per day
@ Nu.0.55 (300 Days Year)
Nu. 5,400,000
Break Even Units
(Production)
95 Lacs (Nos.)
Break Even Months 10 Months
Annual Profit Before Tax Nu. 1,051,900
Annual Profit After Tax Nu. 736,330
A total of 400 m2 land are is enough to set up the plant and the land could be procured
on lease from the government. The build-up requirement is for a production hall and
packaging area. Raw bamboo storage, cutting, as well as stick manufacturing section
can be done in shaded area as well. Around 9 people each will be employed for each
of the two projects.
7.10. Conclusion Commercial production of bamboos is not a common trend in Bhutan but it is cut
down for making furniture, basket agriculture equipment, houses construction etc. the
good news is the easy availability of bamboos in the country. Through sustainable
bamboo farming, a regular supply and ecological balance could be maintained
A manufacturing plant each for toothpick and ear buds from bamboo is highly
recommended and it does not require high technical skill set. Bamboo processing
equipment are easily available from Kolkata and Guwahati. These are easy to use and
needs investment of around Nu. 2.4 million. It can be managed by individual
investment or by capital loan through financial institutions.
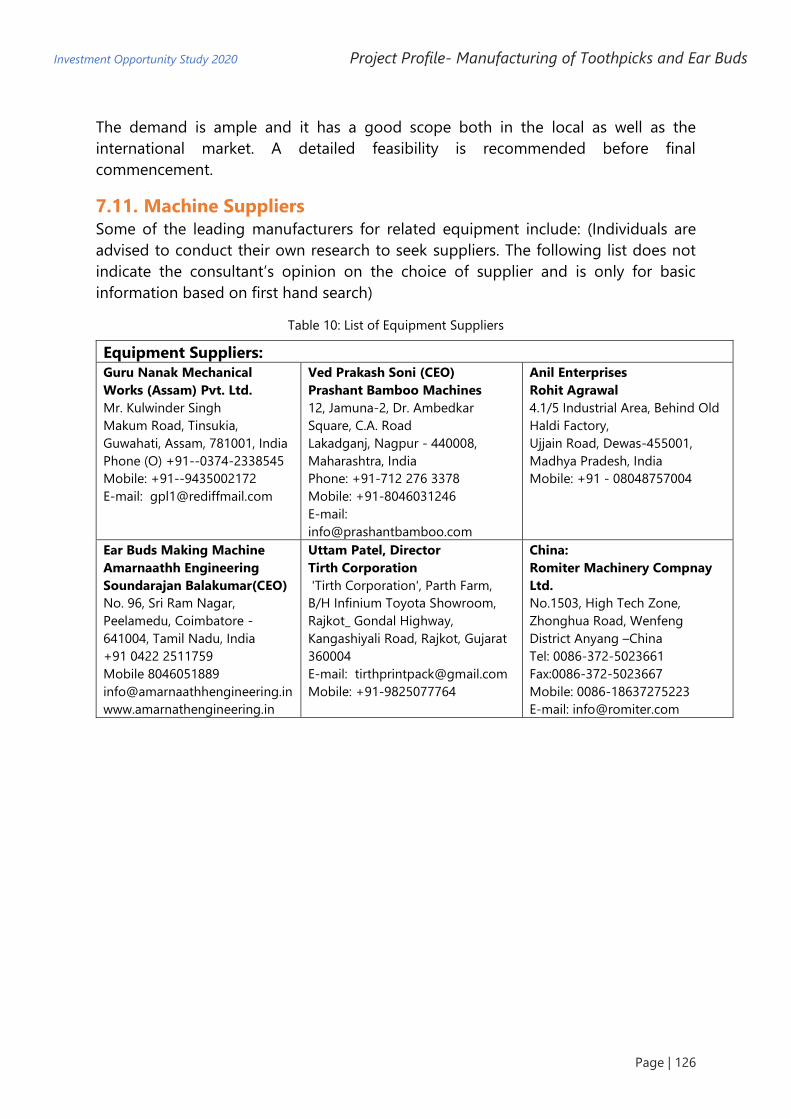
Investment Opportunity Study 2020 Project Profile- Manufacturing of Toothpicks and Ear Buds
Page | 126
The demand is ample and it has a good scope both in the local as well as the
international market. A detailed feasibility is recommended before final
commencement.
7.11. Machine Suppliers
Some of the leading manufacturers for related equipment include: (Individuals are
advised to conduct their own research to seek suppliers. The following list does not
indicate the consultant’s opinion on the choice of supplier and is only for basic
information based on first hand search)
Table 10: List of Equipment Suppliers
Equipment Suppliers:
Guru Nanak Mechanical
Works (Assam) Pvt. Ltd.
Mr. Kulwinder Singh
Makum Road, Tinsukia,
Guwahati, Assam, 781001, India
Phone (O) +91--0374-2338545
Mobile: +91--9435002172
E-mail: [email protected]
Ved Prakash Soni (CEO)
Prashant Bamboo Machines
12, Jamuna-2, Dr. Ambedkar
Square, C.A. Road
Lakadganj, Nagpur - 440008,
Maharashtra, India
Phone: +91-712 276 3378
Mobile: +91-8046031246
E-mail:
Anil Enterprises
Rohit Agrawal
4.1/5 Industrial Area, Behind Old
Haldi Factory,
Ujjain Road, Dewas-455001,
Madhya Pradesh, India
Mobile: +91 - 08048757004
Ear Buds Making Machine
Amarnaathh Engineering
Soundarajan Balakumar(CEO)
No. 96, Sri Ram Nagar,
Peelamedu, Coimbatore -
641004, Tamil Nadu, India
+91 0422 2511759
Mobile 8046051889
www.amarnathengineering.in
Uttam Patel, Director
Tirth Corporation
'Tirth Corporation', Parth Farm,
B/H Infinium Toyota Showroom,
Rajkot_ Gondal Highway,
Kangashiyali Road, Rajkot, Gujarat
360004
E-mail: [email protected]
Mobile: +91-9825077764
China:
Romiter Machinery Compnay
Ltd.
No.1503, High Tech Zone,
Zhonghua Road, Wenfeng
District Anyang –China
Tel: 0086-372-5023661
Fax:0086-372-5023667
Mobile: 0086-18637275223
E-mail: [email protected]
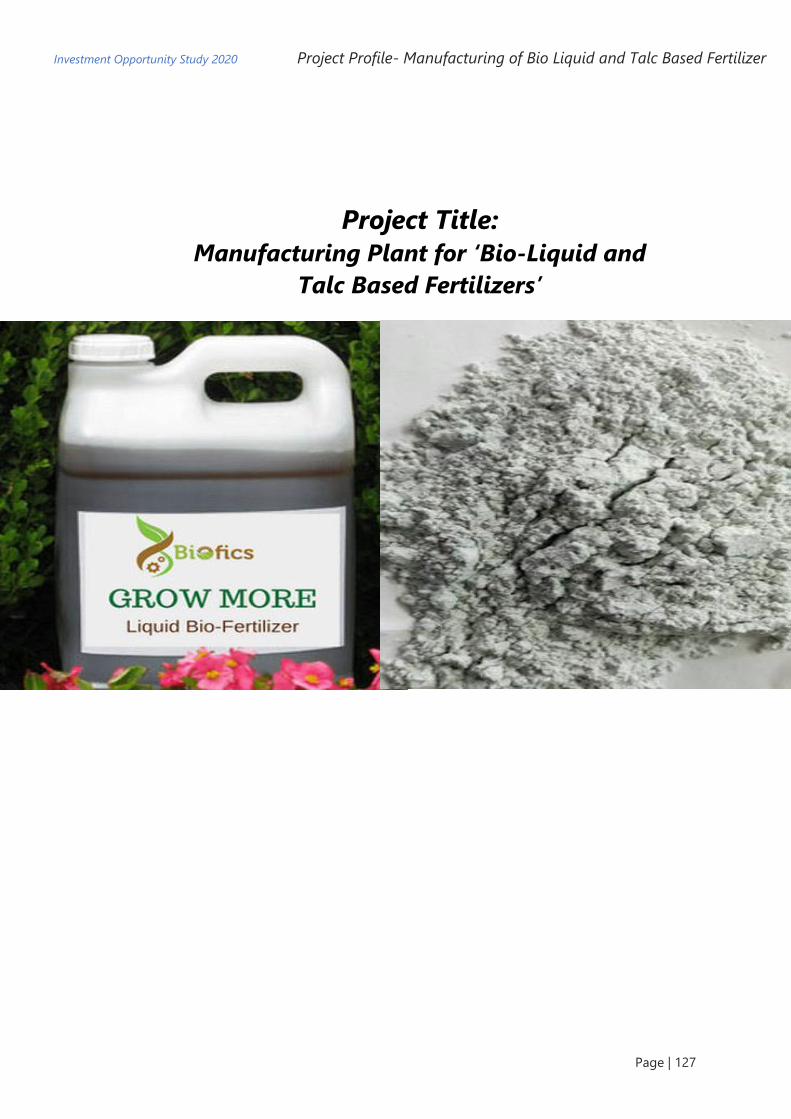
Investment Opportunity Study 2020 Project Profile- Manufacturing of Bio Liquid and Talc Based Fertilizer
Page | 127
Project Title:
Manufacturing Plant for ‘Bio-Liquid and
Talc Based Fertilizers’

Investment Opportunity Study 2020 Project Profile- Manufacturing of Bio Liquid and Talc Based Fertilizer
Page | 128
8. Manufacturing of Bio-Liquid and Talc Based Fertilizers
8.1. Background of the Idea Bhutan is popular for its organic products. Farming is fundamental to the Bhutanese
economy. As in any other farming system, soil fertility is fundamental to the
productivity and sustainability of farming in Bhutan. The country is characterized by
considerable diversity in agricultural soil quality. To improve productivity, Urea is the
main fertilizer used in Bhutan since early 1990s.
Presently, due to increased awareness and notable adverse impact on farm soil fertility
and seed germination, the use of Urea is declining. Farmers are using organic compost.
However, farming has also been constrained by the mountainous topography and
rapid changes in environmental variability.
An innovative development of Bio-Fertilizers85 can play a vital role in the Bhutanese
agriculture industry. It will enhance productivity and provide a major boost to farmers.
Some of the benefits include longer shell life (up to 24 Months), no contamination,
better survival rate of seed and soil, easier usability for farmer, harmless, eco-friendly
low cost agro-input, will add nutrients to the soil facilitating market and import
substitution.
8.2. Rationale of the Idea Farmers have been producing food crops using simple forest litter and farm yard
manure86. There is potential to increase productivity of these traditional farming
systems by adopting ‘bio-fertilizers’, which include development of farming systems
applicable to the local soil and agro-climatic conditions.
From the total farm holding in the country, 94.84% use farmyard manure or compost,
followed by chemical fertilizer with 25.32% as major source of soil nutrients for crop
production.
85 Bio Fertilizers are the fertilizers which promote and enhance agro-ecosystem health, including biodiversity,
biological cycles and soil biological activity. 86 http://www.moaf.gov.bt/rnr-census-report-2019

Investment Opportunity Study 2020 Project Profile- Manufacturing of Bio Liquid and Talc Based Fertilizer
Page | 129
Figure 9: Proportion of Fertilizer Inputs being used by the Framers
Urea is the main chemical fertilizer which is imported from India to the quantity tune
of 1,517 MT87 with a value of Nu. 2.5 million in 2019. Superphosphate was the next
highest imported fertilizer with 1,333 MT valued at Nu. 38.8 million. The below graph
depicts the import of Urea and Superphosphate in the past five years. These trends
offer newer opportunity for development of bio-fertilizers Market in Bhutan.
Figure 10: Fig.2: Import of Urea and Superphosphate Chemical Fertilizers in Bhutan
8.2.1. 1.2.1 Bio-Fertilizers Versus Organic Fertilizers88
Bio-fertilizers are microbial inoculants consisting of living cells of micro-organism like
bacteria, algae and fungi alone or in combination which help in increasing crop
productivity. Biological activities are markedly enhanced by microbial interactions in
the rhizosphere of plants.
87 https://www.mof.gov.bt/wp-content/uploads/2020/03/BhutanTradeStatistics2019260320201.pdf 88 https://www.researchgate.net/figure/Mechanisms-of-plant-growth-promoting-bacteria-
PGPB_fig1_271237100
1518
2110
1196
2935
2142
1,3341,061
2,046
1,772
2,889
0
500
1000
1500
2000
2500
3000
3500
2019 2018 2017 2016 2015
Nu
, in
Lacs
Years
Urea
Superphosphate
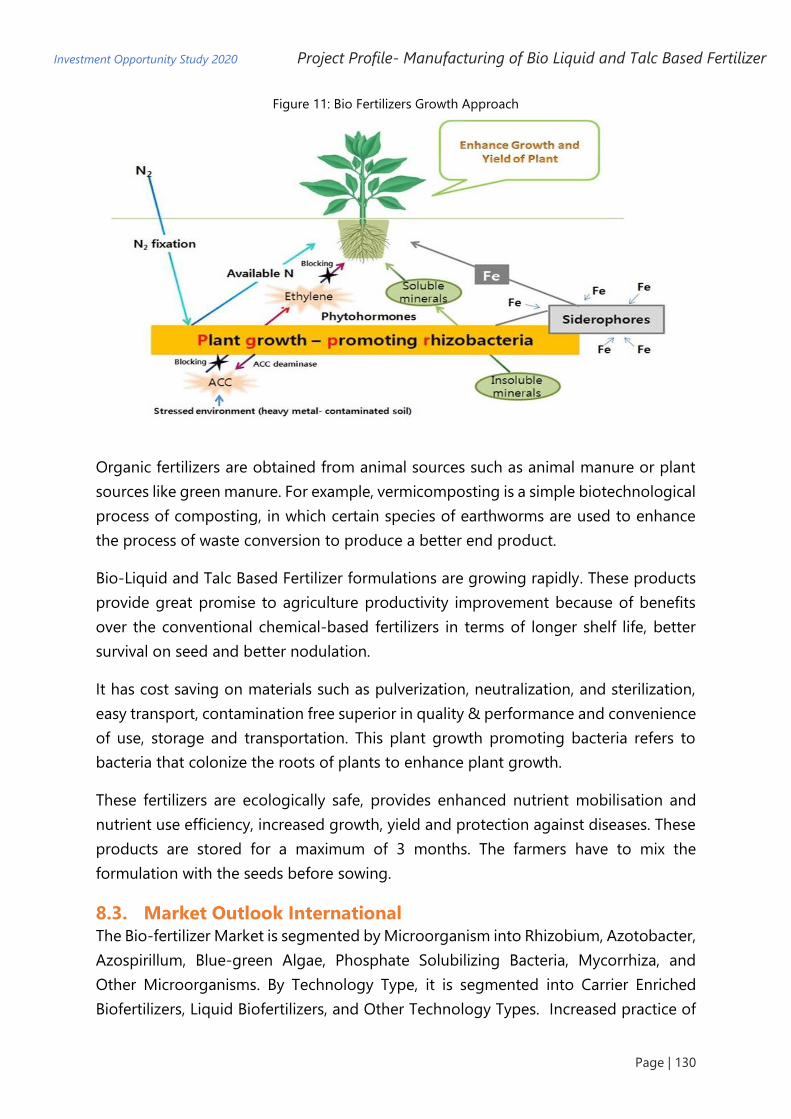
Investment Opportunity Study 2020 Project Profile- Manufacturing of Bio Liquid and Talc Based Fertilizer
Page | 130
Figure 11: Bio Fertilizers Growth Approach
Organic fertilizers are obtained from animal sources such as animal manure or plant
sources like green manure. For example, vermicomposting is a simple biotechnological
process of composting, in which certain species of earthworms are used to enhance
the process of waste conversion to produce a better end product.
Bio-Liquid and Talc Based Fertilizer formulations are growing rapidly. These products
provide great promise to agriculture productivity improvement because of benefits
over the conventional chemical-based fertilizers in terms of longer shelf life, better
survival on seed and better nodulation.
It has cost saving on materials such as pulverization, neutralization, and sterilization,
easy transport, contamination free superior in quality & performance and convenience
of use, storage and transportation. This plant growth promoting bacteria refers to
bacteria that colonize the roots of plants to enhance plant growth.
These fertilizers are ecologically safe, provides enhanced nutrient mobilisation and
nutrient use efficiency, increased growth, yield and protection against diseases. These
products are stored for a maximum of 3 months. The farmers have to mix the
formulation with the seeds before sowing.
8.3. Market Outlook International The Bio-fertilizer Market is segmented by Microorganism into Rhizobium, Azotobacter,
Azospirillum, Blue-green Algae, Phosphate Solubilizing Bacteria, Mycorrhiza, and
Other Microorganisms. By Technology Type, it is segmented into Carrier Enriched
Biofertilizers, Liquid Biofertilizers, and Other Technology Types. Increased practice of

Investment Opportunity Study 2020 Project Profile- Manufacturing of Bio Liquid and Talc Based Fertilizer
Page | 131
organic farming, need for improving soil organic matter, and favorable regulatory
structure are the major factors driving the market.
Following are the main trends:
▪ A market research report by a B2B Market research company
“MarketsandMarket89” states: “The global biofertilizers market is estimated to
be valued at USD 2.3 billion in 2020 and is projected to reach USD 3.9 billion by
2025, recording a CAGR of 11.6% during the forecast period”. North America
cornered the largest share of around 27.7% in the global market.
▪ As per buisnesswire.com, the Indian fertilizer market was worth INR 5,437 billion
in 2018. Looking forward, the market is projected to reach INR 11,116 billion by
2024, growing at a CAGR of 12.3% during 2019-2024.
▪ The global players in the industry are Monsanto BioAg, Kiwa Bio-Tech Products
Group Corporation, Lallemand Inc., Camson Biotechnologies Limited, and
Agrinos AS, Italpollina S.p.A., Tata Chemicals Ltd. etc.
▪ The increasing usage of bio-fertilizers signifies potential for sustainable farming
method and food safety. The increasing concern with regard to food safety is
expected to drive the industry growth over the forecast period. The Government
of India has introduced several schemes to promote the usage of the product
in the country.
8.4. 1.4 The Concept
Looking at the growth in of organic manure business, entrepreneurs are showing
interest to setup units in this segment. For example, Farmer PB Ghalley, 6,3 at Ramitey
in Phuentsholing produces bio-slurry compost – an organic fertilizer that is made from
bye-product waste of bio gas which is composted and sold as fertilizer. Most of his
product goes to Thimphu and some to the local market in Phuentsholing. The farmer
sells about 5 MT of compost annually in the capital. He is also supported by a team of
Bhutan Biogas Project and National Organic Program (NOP). And with the business
becoming successful, he says he now wants to increase his market size and take it all
over the country.
89 https://www.marketsandmarkets.com/Market-Reports/compound-biofertilizers-customized-
fertilizers-market-856.html

Investment Opportunity Study 2020 Project Profile- Manufacturing of Bio Liquid and Talc Based Fertilizer
Page | 132
This is a good example towards declining use of chemical fertilizers. A news article was
published about his business entitled “Organic Business in Bhutan”90 in Business
Bhutan newspaper.
The concept of this investment idea is not to invest in large scale manufacturing plant
but in a small-scale plant with the capacity to produce more than one product using
simple technology so that demand-based products could be developed. The most
important aspect of this unit is that it should not adversely impact the environment.
All the raw material used in production has to be approved as safe and reliable.
The liquid bio-fertilizer formulation is produced through eco-friendly technology and
based on state-of-the-art technology in rust free (mostly MOC SS 316 & 304)
equipment. This project is suitable as per the working condition, benefits, demand and
strengths of Bhutan.
Some are highlighted below:
Table 11: Parameter in Respect to Bhutan
1. Product Bio-Liquid and Talc Based bio Fertilizers
2. Brand Support Bhutan – An organic country.
3. Market Potential Domestic as well as export – India, African
Countries etc.
4. Raw materials
4.1 Beneficial microorganisms One Time Sourcing – from Technology Indian
Research Institute – CSIR, NRDC etc.
4.2 Water Available
4.3 Talc Available
4.4 Packaging Material HDPP Bottles and Bio gradable PP Bags. Can
be sourced.
4.5 Electrical Power Available in Bhutan
4.6 Manpower Available in Bhutan
Product Mix and Packaging:
Table 12: Product mix and Packaging
Product Packaging Range
Bio-Liquid Fertilizer 500ml, 1Lt. 5Lt, & 20 Lt.
Talc Carrier Based Fertilizer 1 kg, 5 kg, 10 kg,25 kg, 50kg
90 https://www.businessbhutan.bt/2018/03/21/a-farmer-finds-success-in-organic-fertilizer-business/

Investment Opportunity Study 2020 Project Profile- Manufacturing of Bio Liquid and Talc Based Fertilizer
Page | 133
8.5. Plant Capacity The optimum production capacity is designed after assessment of key investment,
available facilities, and market demand and is assessed at annual production of 4,800
MT in one 8-hour shift. It is just 5% of the total import of Urea from India. The
suggested plant capacity is as follows:
Table 13: PGPR – Proposed Production Capacity
Product Formulation Monthly
Production
Products Production
Annual Production
Liquid Bio Fertilizers 1,500 Lt per Month 18,000Lt.(18KL)
Talc Based Bio Fertilizers 20,00Kg per Month 24,000 Kg. (24MT)
*(Liquid 1Lt= 1Kg) Total 32,000Kg (32MT)
8.6. 1.6 Manufacturing Process91 Manufacturing process involves fermentation of variety of media, using commercially
available microbial cultures. It develops bulk culture and talc is used as carrier material
mixed with inert compound and binding agents. DM water is used for culture
preparation. After air drying, the products are packed and ready for supply.
A short product scenario is outlined below:
Table 14: Product Specification and Properties
Product - Product Specification
Bio-Liquid Fertilizers
Spread: 107 to 109CFU/ml
pH : 5 To 7.5
Colour : light brown
Physical Shape – Liquid
Talc Carrier Based Bio-Fertilizer
Spread: 107 to 109CFU/g
pH : 6.8 to 7.4
Colour – White
Physical Shape – Solid Powder form
91 https://www.slideshare.net/roshnimohan4/biofertilizers-production-and-their-applications

Investment Opportunity Study 2020 Project Profile- Manufacturing of Bio Liquid and Talc Based Fertilizer
Page | 134
Figure 12: Production Cycle of Bio Fertilizer
8.7. Plant Equipment The manufacturing section consists of machineries i.e. industrial fermenters, talc
mixing equipment, packaging machines, SS storage tanks, & material handling
equipment etc. In addition, supportive and accessories equipment such as boilers,
demineralizing plant, air compressor, cooling towers, pumps & vacuum pumps are also
deployed. Fermenter is the main equipment for the production of culture formulation.
Figure 13: Fermenter –Main Equipment

Investment Opportunity Study 2020 Project Profile- Manufacturing of Bio Liquid and Talc Based Fertilizer
Page | 135
It is a large vessel in which the organism is kept at the required temperature, pH,
pressure, dissolved oxygen concentration, and substrate concentration.
Manufacturing bio-fertilizers does not require any interlocking processes between
machines. Every machine is equipped with its own control and instrumentation
consists of PLC based control and display mechanism etc.
All the machineries are manufactured in India. Some of the suppliers are from Gujarat,
Maharashtra and Chennai providing equipment installation on turnkey basis. A list of
equipment suppliers is mentioned in “Annexure A”.
8.7.1. Required Raw Material
It includes Talc, Sticking Agents and Ingredient, Inert Compound, Biding Agent, Other
Additives and Laboratory Chemicals
8.7.2. Standards
Processing followed by norms under THE FERTILISER (CONTROL) ORDER 1985
No.11-3/83-STU, Government of India.
8.8. More Details More details on the process can be found from the following sources and videos for
better understanding:
Reading Materials Videos https://www.slideshare.net/roshnimohan4/biofertil
izers-production-and-their-applications
https://www.youtube.com/watch?v=O1FfEbpaiHw
https://www.alliedmarketresearch.com/liquid-
fertilizers-market
https://www.youtube.com/watch?v=fBHMigFahZ4
https://www.ias.ac.in/article/fulltext/reso/018/03/0
275-0281
https://www.holganix.com/blog/5-facts-about-the-
organic-marketing-for-fertilizer-users-infographic
Table 5: Addition sources and videos for further reference
8.9. Basic Financial Calculations A total of 500 m2 of land area is enough to develop manufacturing facility for this plant.
It will be arranged on lease basis. The production area is under closed type building
and consists mainly three sections - culture preparation, manufacturing as well as
packaging, and storage section.
The financial calculation is based on fairly conservative values of annual production of
32 MT of bio-fertilizer which is estimated at only 2% of total Urea import in Bhutan
(Average Urea import was 1,517 MT 2019). The annual production targets are
considered at 18,000 lt for liquid bio-fertilizer formulation and 24,000 kg for talc-based
bio-fertilizer.
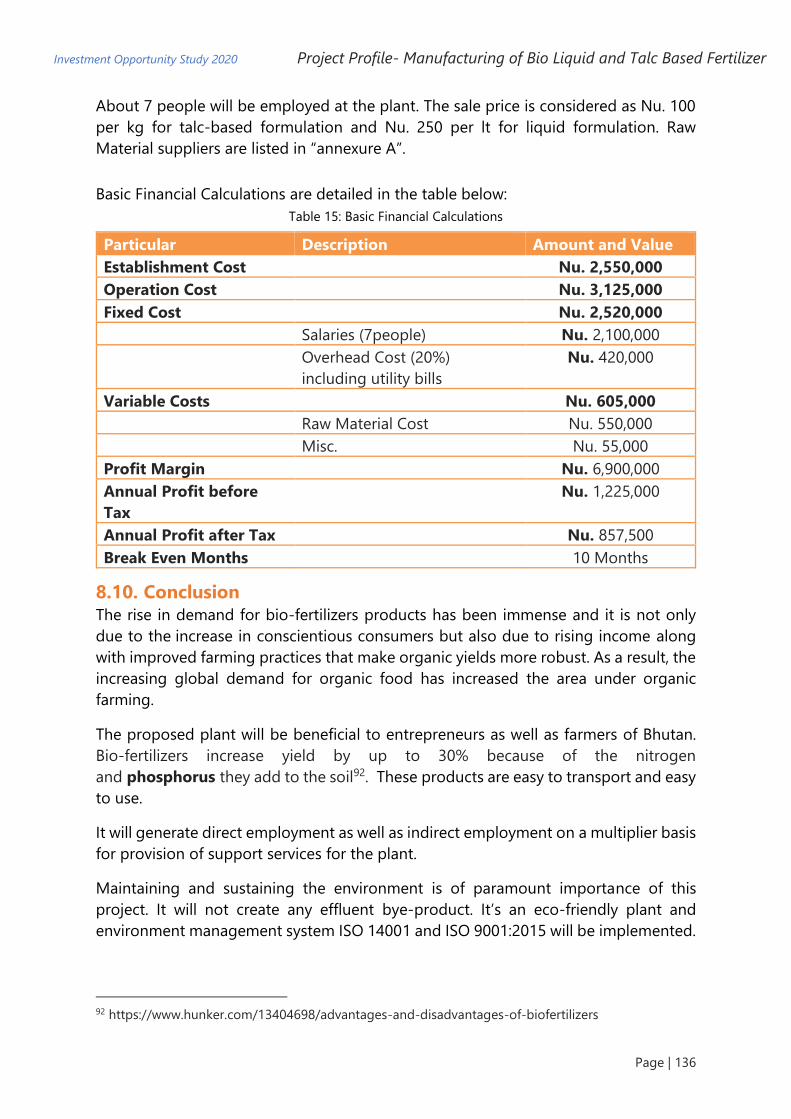
Investment Opportunity Study 2020 Project Profile- Manufacturing of Bio Liquid and Talc Based Fertilizer
Page | 136
About 7 people will be employed at the plant. The sale price is considered as Nu. 100
per kg for talc-based formulation and Nu. 250 per lt for liquid formulation. Raw
Material suppliers are listed in “annexure A”.
Basic Financial Calculations are detailed in the table below:
Table 15: Basic Financial Calculations
Particular Description Amount and Value
Establishment Cost Nu. 2,550,000
Operation Cost Nu. 3,125,000
Fixed Cost Nu. 2,520,000
Salaries (7people) Nu. 2,100,000
Overhead Cost (20%)
including utility bills
Nu. 420,000
Variable Costs Nu. 605,000
Raw Material Cost Nu. 550,000
Misc. Nu. 55,000
Profit Margin Nu. 6,900,000
Annual Profit before
Tax
Nu. 1,225,000
Annual Profit after Tax Nu. 857,500
Break Even Months 10 Months
8.10. Conclusion The rise in demand for bio-fertilizers products has been immense and it is not only
due to the increase in conscientious consumers but also due to rising income along
with improved farming practices that make organic yields more robust. As a result, the
increasing global demand for organic food has increased the area under organic
farming.
The proposed plant will be beneficial to entrepreneurs as well as farmers of Bhutan.
Bio-fertilizers increase yield by up to 30% because of the nitrogen
and phosphorus they add to the soil92. These products are easy to transport and easy
to use.
It will generate direct employment as well as indirect employment on a multiplier basis
for provision of support services for the plant.
Maintaining and sustaining the environment is of paramount importance of this
project. It will not create any effluent bye-product. It’s an eco-friendly plant and
environment management system ISO 14001 and ISO 9001:2015 will be implemented.
92 https://www.hunker.com/13404698/advantages-and-disadvantages-of-biofertilizers

Investment Opportunity Study 2020 Project Profile- Manufacturing of Bio Liquid and Talc Based Fertilizer
Page | 137
With easy availability of raw materials and the growing market demand, the
manufacturing plant of liquid bio-fertilizer and talc-based bio-fertilizer is highly
recommended as a viable business Idea in Bhutan. A Detailed Feasibility Study is
recommended before commencement of the project.
8.11. Annex A - List of Equipment Suppliers
Some of the leading manufacturers for the equipment include (individuals are advised
to conduct their own research to seek suppliers. The following list does not indicate
the consultant’s opinion on the choice of supplier and is only for basic information
based on first hand search.):
Equipment Suppliers:
Napro Scientific
6,Vaidehi Residency, MIT
College Road, Rambaug
Colony, Kothrud, Pune -
411038, INDIA
Tel./Fax: +91 20 25460214
Email : [email protected]
[email protected]/naproindia@g
mail.com
Shree Biocare Solution Pvt. Ltd.
Mr. BhadreshPankhaniya (CEO)
No. 28, Hariom Nagar - 1, Motera
Road,
Sabarmati, Ahmedabad, Gujarat -
380 005, India
Email :[email protected]
Mobile :+(91)-9033025502/
9898999146
Fax:+(91)-(91)-88660004776
Bionics Scientific Technologies
(P) Ltd.
AN ISO 9001:2008 Certified
Laboratory Equipment
Manufacturing Company
314 3rd Floor, Vardhman Capital
Mall. LSC-10, Sindhora Kalan,
Delhi 110 052, India
Mobile: +91-9971934500, +91-
9910788555
Tele:+91-11- 23652000 / 7000
Stericox Sterilizer Systems
India
A 100/1, Street No. 15, Gamri
Extn.
Delhi 110053. India
Gamri Extn, Delhi 110053
Tel: 8130134164
E-mail: [email protected]
www.stericox.com
Raw Material Supplier
Gujarat State Fertilizers &
Chemicals Ltd. for Culture
P.O. Fertilizernagar -391 750,
Dist. Vadodara, Gujarat, India
Phone +91-265-2242051, 2242451,
2242651, 2242751
Fax +91-265-2240966, 2240119
E-mail [email protected]
www. gsfcltd.com
PGPR Strains:
Peak Chemicals Industries
Mr. DaipayanSen
Sevoke Road, 2nd Mile
Siliguri, West Bengal - 734 001,
Telephone: +(91)-(353)-2543875/
+(91)-(33)-24192117
Mobile: +(91)-9831067280/
Preci-techindia.com
207, Bhanu Enclave, Opp ICICI
Bank, Dr.A.S.Rao Nagar,
Secunderabad, Telangana
Call Us: 040 40119970
Sales: +91
9966611444,9966611888
Email: [email protected]
Shree Biocare Solution Pvt. Ltd.
Mr. BhadreshPankhaniya (CEO)
No. 28, Hariom Nagar - 1, Motera
Road,
Sabarmati, Ahmedabad, Gujarat -
380 005, India
Email :[email protected]
Mobile :+(91)-9033025502/
9898999146
Fax:+(91)-(91)-88660004776
Hi Therm Boilers
A-102, Oshiwara Industrial Estate,
New Link Road,
Goregaon (W), Mumbai –
400104,
Maharashtra, INDIA
Mobile: +91- 9819515555
Phone:+91- 22- 40024444

Investment Opportunity Study 2020 Project Profile- Manufacturing of Prefabricated Wooden Building Components
Page | 138
Project Title:
Manufacturing Plant of Prefabricated Wooden Building
Components

Investment Opportunity Study 2020 Project Profile- Manufacturing of Prefabricated Wooden Building Components
Page | 139
9. Manufacturing of Prefabricated Wooden Building
Components
9.1. Background of the Idea Owing to limitations in the transport infrastructure, cost of timber transportation
between Dzongkhags is high and therefore timber is mostly processed in its area of
origin, i.e. hardwood in hardwood areas, softwood in softwood areas.
The growth in the wood structure products industry is highly correlated with the
progression in the construction sector. It contributes about 15.87% to the country’s
GDP (Year 2017) making up 0.99 percentage points to the GDP growth93. Wood makes
to to around 25-28% of a construction cost of a house as per Bhutan Architectural
Design. Upcoming construction and infrastructure projects in Bhutan are likely to act
as an opportunity in the coming years given the required proportionate wood work.
Rapid urbanization has created shortage of housing in towns and cities. Pre-fabricated
buildings can be a cost and time efficient alternative to housing as these can be reused
or shifted if required. Thus, Bhutan has the market potential and availability of raw
material within the country and this offers an ideal opportunity for a manufacturing
unit of prefabricated building components to aid import substitution.
There is no unit specialized in manufacturing pre-fabricated building component with
modern machineries as required to urban as well rural construction sector. Looking at
potential opportunities in the wood processing segment, a manufacturing plant of
prefabricated wooden building components is highly recommended.
9.2. Rationale of the Idea As per Bhutan Trade Statistics94, the wood industrial segment covers cottage industries
and mainly comprises 168 sawmills, 500 small furniture houses, few licenses in
plywood, cardboard and flush doors manufacturers in Bhutan. Around 12 companies
are working in making structural wooden items such as doors/windows components
frames and joinery.
The wood processing technologies in the country are still rudimentary relying on
traditional equipment and often on hand tools for sizing and shaping the timber
structures. This is not only resulting in huge wastages but also poor quality of
workmanship. For instance, the use of power chain saws, band saws and mobile
sawmills result in losses as high as 30% to 40% of the total volume. This loss is further
exacerbated by the lack of technology to utilize undersized timbers and off-cuts.
93 https://kuenselonline.com/an-insight-into-the-construction-industry-of-bhutan-part-
i/#:~:text=Despite%20the%20relative%20slow%20progress,points%20to%20the%20GDP%20growth. 94 nic_2004_struc_detail, Bhutan

Investment Opportunity Study 2020 Project Profile- Manufacturing of Prefabricated Wooden Building Components
Page | 140
Despite the vast forests covering Bhutan’s territory, only 5% of the total forest area is
currently under commercial management. Around 2 to 3 million CFT of wood is
converted from logs to saw timber in Bhutan. Considering an average recovery rate of
70% of log around 0.6 to 0.9 million CFT of wood goes to waste as saw dust. Only
some part of this wood waste is used as fire fuel.
Some timber trends in Bhutan are as follows:
• Timber wastage is high during the processing in the form of sawdust and off-cuts.
A study to assess recovery percentage of timbers for different wood processing
technologies in Bhutan show that 99% of sawmills do not have the required
modern technology to reduce and make use of the wastes. Furthermore, continued
use of conventional sawing technologies like band saw, mobile sawmills and power
chainsaws have recorded losses as high as 30 to 40%.
• Traditional structures constructed mainly from natural timber without any form of
treatment and processing are easily susceptible to damage, thus entailing frequent
replacement.
• Lack of know-how and technology to process timber from young trees and utilize
undersized timber results in harvesting of old matured trees and huge wastages.
• Timber for the constructions of massive structure like Dzongs and bridges require
longer beams and larger pillars which are now getting difficult to manage due to
scarcity and involves substantial amount of manpower and cost. Solid wood
columns with rotted centre (heart) has become common much to the ire of people
working on the wood. This damage will result in severe radial cracks. Differential
seasoning will also result in crack on the surface, which are often quite deep and
would require remedy incurring further cost and time.
• With the growth in the number of constructions every year, the supply of timber is
not able to meet the demands, thus leading to a huge rise in the cost of timber.
When timber becomes expensive and there are no other readily available
construction materials, the shortage also fuels black-market of wood making
timber extraction unsustainable.
9.3. The Concept With rapid developmental activities taking place, the demand for forest products,
particularly timber, is growing every year giving enormous pressure to limited stock of
timber in the forests with commercial value. However, on the other hand, there is a
huge amount of waste generated due to out dated timber processing methods and
conventional technology.
On the other hand, the wood-based industries have limited market opportunity and
most wood industries don’t invest in new equipment. Lack of technological
advancement in wood processing means the choice of wood and timber products is

Investment Opportunity Study 2020 Project Profile- Manufacturing of Prefabricated Wooden Building Components
Page | 141
also limited. The general statement that consumers will not pay higher prices for semi-
processed timber as far as cheap raw-timbers are available may not be valid since there
is already a trend of importing semi-finished timber as raw materials in few of the
successful wood-based industries in the country.
In prefabricated construction, the manufacturer can order the building component
requirement in customised designs and anabling bulk production of materials as it is
fabricated in factories. This results in lower prices from suppliers and reduces the
number of labourers and transportation costs.
This concept is based on the use of modern wood processing machineries along with
the available saw dust and lumber, which is also manufacturing of prefabricated
wooden building components. It will provide viable market opportunities with price
advantages and time saving benefits to users.
Such wood-based building component manufacturing plants is recommended in
Bhutan with state-of-the-art manufacturing technology sourced from India or
Malaysia. The unit can be established independently or under the technological
support from established brand companies in India.
9.3.1. Product Group
Bhutan has the potential for making quality prefabricated wood items. Types of
prefabricated wood product group components are as follows:
i. Wood Frame for Window and Doors,
ii. Doors and Window, Walls and Roofing,
iii. Flooring and Stairs,
iv. Porch and Column’s etc.
9.3.2. Types of Timber Processing95
The different types of timber processing include:
i. Cross-Laminated,
ii. Nail-Laminated,
iii. Glue-Laminated and
iv. Dowel-Laminated Timber
9.4. 1.3 Market Outlook International Pre-fabricated Buildings Parts: It consists of factory-made components or units that
are transported and assembled on-site to form the complete building. Bhutanese
manufacturers use hard wood, steel, plywood, softwood and cane as raw materials to
make fabricate building parts.
95 https://continuingeducation.bnpmedia.com/courses/think-wood/designing-sustainable-
prefabricated-wood-buildings/3/

Investment Opportunity Study 2020 Project Profile- Manufacturing of Prefabricated Wooden Building Components
Page | 142
As per the study entitled ‘Report on Import Substitution Opportunities by Ministry of
Economic Affairs, Bhutan – Year 201996’ illustrated in the graph below, the total value
of import was recorded at Nu. 168.64 million from 2014 to 2018 with an average
increase of 41.26 %. Currently, there are 168 domestic fabrication industries. However,
few industries are into fabrication of building parts.
Figure 14: Building parts Import Trend (2014-2018)
Bhutan is experiencing a big construction boom in the past few years. Structural
framing, windows, doors, floors are made by wood. As traditional Bhutanese architect
is mostly timber based, timber will continue to be used in the construction and
maintenance of all existing and forthcoming structures. Increasing demand of timber
for these structures will apparently come to face constraints in supply of timber in
future due to factors such as scarcity of special and quality timber.
Presently, at construction sites, be it private or government, individual carpenters and
contractors are making structural door, windows and other Items with freshly sawn
timbers which consumes time and accounts a higher cost. Similar to the case of saw
dust, the leftover wooden parts are not utilized except when it is used as firewood.
Import value of wood particle board from India was Nu 133.5 million in 2018 as per
the data published by Bhutan Trade Statistics 2019. An analysis of the data show
particle board and other wood items has increased by 76% in 2018 compared to the
year before. It shows the increasing scope of the wood-based product in Bhutan .
There is no unit specialized in manufacturing pre-fabricated building components with
modern machineries as is required in the urban construction sector and this makes the
scope all the more lucrative.
96 Report On Import Substitution Opportunities by Ministry of Economic Affairs, Bhutan – Year 2019

Investment Opportunity Study 2020 Project Profile- Manufacturing of Prefabricated Wooden Building Components
Page | 143
9.5. More Details More details on the process can be found from the following sources and videos for
better understanding:
Table 16: Addition Sources and Videos for Further Reference
Reading Materials Videos
http://www.fao.org/3/ag335e/AG335E09.ht
m
https://www.youtube.com/watch?v=
MFWxGqGPxzI
https://www.thinkwood.com/wp-
content/uploads/2018/07/Designing-
Sustainable-Prefabricated-Wood-
Buildings_Think-Wood-CEU.pdf
https://www.youtube.com/watch?v=
mNFO3fWh55k
https://www.slideshare.net/FarahSham/pref
abricated-timber-framing-system
https://www.treehugger.com/lightwe
ight-prefab-wood-framing-system-
goes-together-without-nails-
4856601
9.6. Manufacturing Process Prefabrication is the practice of assembling wood and components of a structure in
a factory or other manufacturing site, and transporting complete assemblies or sub-
assemblies to the construction site where the structure is to be built.
Prefabrication may also reduce the exposure of building components to wet weather.
That being said, efficient construction can only be achieved when sequencing and
project scheduling are determined up front and managed appropriately.
Manufacturing of prefabricated wood includes cutting of lumber in parts as per design,
surface flattening and straitening, cutting, joint making, gluing and sand finishing.
After these steps, the products are ready for final use.
A brief manufacturing process of prefabricated Wooden Building Components is
detailed on topic 1.7.1, which needs careful machining of wood in sophisticated
manner.

Investment Opportunity Study 2020 Project Profile- Manufacturing of Prefabricated Wooden Building Components
Page | 144
Figure 15: Manufacturing Process and List of Machineires
1.7.1 Manufacturing Process and List of Machineires
a. Process b. Equipment1 Equip. Image
Band Saw Machine A band saw is a power saw with a long, sharp blade consisting of a continuous band of toothed metal stretched between two or more wheels to cut wood.
Jig saw Machine Jigsaw is one of the most important and extremely useful power tools that are required for performing curved lines and shapes.
Wood turning Lathe Wood turning is used to cut a shape that is symmetrical around the axis of rotation. Surface Planer & Cutting This is universal wood processing machine with high precision & quality. Its multi functionality machine and performs number of wood cutting activities.
Thickness planer It is a machine to trim boards to a consistent thickness from end-to-end.
[ Auto Mould Machine This machine is used for process of profiling concave and other curved surface along the length of a piece of wood.
Other Equipment: High Speed Router, Small Hand Tool pedestal Grinder, Hand Cutter, hand carts etc.
Saw Tooth
Grinder
Sand Cleaning
1 https://www.jaiindustries.com/solid-wood.
Preliminary Cutting
4–side Surface Flattening and Thickening
Pre-mill - Length formatting and Contour Shaping
Corner Joints and Gluing Pasting
Pressing, Drilling Hole and Boring for enclosures
Wood Surface Sanding
Finishing and Clean up.
Ready for use at Site
Manufacturing Prefabricated Wooden Building Components

Investment Opportunity Study 2020 Project Profile- Manufacturing of Prefabricated Wooden Building Components
Page | 145
9.7. Basic Financial Calculations Around 1,000 m2 of land is required for setting up prefabricated building component
manufacturing unit. Including built up area, it can be arranged on a lease basis. The
required manpower is around 10 people which includes Supervisor (1), Accounts and
Administration (1), Site Engineer and Draft man (1), Marketing and Resale Section,
Carpenter and Skilled Machine Operator (4), Helping Hands (2).
The calculation is based on fairly conservative values of 50 completed construction
projects in a year with a minimum profit margin of Nu. 100,000 per project. This is a
realistic amount as per the Bhutan Schedule of Rates – 202097 the Teak/Sal wood work
construction rate is Nu. 22,712 per CuM. Looking at benefits of time saving and high
yield, saving in transportation cost and labor fitment the sale price of prefabricated
components has been considered at Nu. 17,500 per CuM for Teak/Sal wood work. The
salaries are considered as @ Nu. 25,000 per position for ten people. The overhead cost
is 15% of the salaries. No variable cost is taken as it would depend largely on the
project estimates and work volume. No cost on purchase is taken as the production
will be order driven and customers will order in advance.
Basic financial calculations are detailed in the table below:
Table 17: Basic Financial Calculations
Particulars Description Value
Establishment Cost Nu.4,500,000
Fixed Cost Nu.3,450,000
Salaries (10 people) Nu.3,000,000
Overhead Cots (15%) Nu.450,000
Variable Costs NA
Cannot be determined as it
will depend on project to project basis
Profit Margin Assuming 50 cars with
Nu. 1,00,000 profit margin
Nu.5,000,000
Break Even Units 80 Projects
Break Even Months 19 Months
Annual PAT after BEP Nu.1,550,000
Annual PBT after BEP Nu.1,085,000
97 Department of Engineering Services, www.mowhs.gov.bt

Investment Opportunity Study 2020 Project Profile- Manufacturing of Prefabricated Wooden Building Components
Page | 146
9.8. Conclusion Building Construction activities are increasing by the day in Bhutan and wood use is
also growing in the form of the use of furniture, structural framing, modular kitchen,
patrician, doors and windows. Thus, domestic market is available along with export
market opportunities to India (Kolkata, Assam, Jalpaigudi, and Northern States of
India), including Bangladesh, Sri Lanka and Nepal.
Reducing cost and time are major anxieties for both consumers and manufacturers
while processing pre-fabricated artifacts. In a prefabricated construction system, the
phases of site preparation and construction of the modules can be run simultaneously,
while in conventional construction, the construction phase happens after the site
preparation phase.
When compared to conventional construction methods, the prefabricated
construction system provides significant reductions in both cost and time.
After implementation of this unit, sawdust from saw mills can be put to effective use.
It will generate direct employment as well as indirect employment on a multiplier basis
for provision of support services for the plant.
It will not create any effluent byproducts. It is run mechanically powered by electricity.
The power rates in Bhutan are much lower compared to neighboring India. The
suggested business is covered under cottage industry and it is highly recommended
for entrepreneurs.

Investment Opportunity Study 2020 Project Profile- Manufacturing of Prefabricated Wooden Building Components
Page | 147
9.9. Annex A - List of Equipment Suppliers Some of the leading manufacturers for the equipment include: (individuals are advised
to conduct their own research to seek suppliers. The following list does not indicate
the consultant’s opinion on the choice of supplier and is only for basic information
based on first hand search)
Equipment Suppliers:
Jai Industries Woodtech Shree Umiya Machine
Nr. Ajit Mill Cross Rd., Rakhial -
Odhav Main Road, B/s Flyover,
Rakhial, Ahmedabad-380 023.
Gujarat, INDIA.
Mobile: +91 9227578426
www.jaiindustries.com
#31/2, Nadakerappa Industrial
Estate, Andhrahalli Main Road,
Near Peenya II stage,
Vishwaneedam Post, Bangalore
- 560091
+91 080 28364584 / 85
Email: [email protected]
www.woodtech.in
3/C, Shiv Estate, Opp. Radhika
Society, NH - 8, near Baroda
Express Way, Ahmedabad, Gujarat
382445
+91 99255 19009
Email: [email protected]
www.shreeumiya.com/
Table 4: List of Equipment Suppliers
9.10. Other References: • http://www.dofps.gov.bt/wp-content/uploads/2016/03/Sawmill_inside.pdf
• http://documents.worldbank.org/curated/en/118821562700584327/pdf/Bhuta
n-Forest-Note-Pathways-for-Sustainable-Forest-Management-and-Socio-
equitable-Economic-Development.pdf
• https://top-machinery.en.made-in-china.com/product/rSXxHfbuaaRy/Chin

Investment Opportunity Study 2020 Project Profile- Manufacturing of Packaging Aluminium Foil
Page | 148
Project Title: Manufacturing of Packaging
Aluminium Foil

Investment Opportunity Study 2020 Project Profile- Manufacturing of Packaging Aluminium Foil
Page | 149
10. Manufacturing of Packaging Aluminium Foil
10.1. Background of the Idea Packaging plays a very important role in a country’s economy. Owing to strong
economic growth and increasing middle class with growing disposable income,
consumption of Aluminium foil is growing fast in Bhutan. The change in lifestyle
triggers changes in food habits and it has led to increased demand for foil packaging.
The growing demand for ready-to-eat confectionaries and pharmaceutical products is
another major growth drivers for Aluminium foils industry.
Aluminium foil is a sheet of super-thin metal. As such it can be an absolute barrier to
moisture, gases, odors, bacteria and moulds. The high reflectivity of Aluminium
ensures good protection against radiant heat, whilst its opacity is important in
preventing deterioration of a very large range of foods and drinks which are affected
by light. It is used primarily for packaging.
This industry has seen a major growth in the recent past owing to the growing
application of foil in a variety of products. India is one of the key producers of
Aluminium foil in the region. Over 70% of Aluminium foil used in India is for packaging
applications.
Presently, almost all required Aluminium foil packaging is imported from India. Thus,
Bhutan has the market potential for Aluminium Foil manufacturing unit and it will also
help in import substitution.
10.2. Rationale of the Idea The import of Aluminium Foil (whether or not printed or backed with paper,
paperboard, plastics or similar backing materials) of a thickness (excluding any
backing) not exceeding 0.2mm in the last five years has been consistent.
Data from Bhutan Trade Statistics (2015-2019) shows that the import in 2018 reached
at all time high with a worth of Nu. 214 million.
Increased economic activities particularly under Production and Manufacturing Sector
has led to such an accelerated demand for Aluminium Foil and is expected to grow
given the observed trend.

Investment Opportunity Study 2020 Project Profile- Manufacturing of Packaging Aluminium Foil
Page | 150
Figure 16: Packaging Aluminium Foil - Import Quantity from India
Figure 17: Packaging Aluminum Foil - Import Value From India
10.3. Market Outlook International The demand in the global aluminum foil packaging market is anticipated to increment
at a CAGR of 4.8% during the forecast period of 2017 to 202598. This prosperity of the
market for aluminum foil packaging is a reflection of a number of factors, such as high
preference for convenience packaging, growing demand for extended shelf-life of
packaged food, popularity of ready-to-eat meals and processed food, and growing
usage in pharmaceutical products and confectionaries.
98 https://packagingnewsblog.wordpress.com/2017/09/06/aluminum-foil-packaging-market-global-
industry-analysis-size-share-growth-trends-and-forecast-2017-2025/
1734021433
26716
49473
26595
0
10000
20000
30000
40000
50000
60000
2015 2016 2017 2018 2019
Qty
. in
KG
M
Years
98
154167
214
184
0
50
100
150
200
250
2015 2016 2017 2018 2019
Nu
. in
Lacs
Years
Investment Opportunity Study 2020 Project Profile- Manufacturing of Packaging Aluminium Foil
Page | 151
Robust economic growth along with rising middle population with inclining personal
disposable income is anticipated to intensify the growth of global Aluminium foil
packaging market during the forecast period. The change in life style which includes
changed food habits has led to increasing demand for packaging. Besides this, robust
demand for Aluminium foil packaging in snacks and chocolate industry are also
strengthening the growth of Aluminium foil packaging market all across the globe.
Some of the major opportunities in global Aluminium foil packaging market includes
technological development to enhance the product quality, reduction in plant losses,
inclination in the obtainability of foils in different forms for crucial mass consumption
usages and progress in the exportability of Aluminium foils.
Global Aluminium Foil Demand by Type
• Rapid industrialisation coupled with heavy air conditioner usage in India, Egypt,
Iran, and UAE boost the need for industrial aluminum foils
• Blister foil is the major application in the pharmaceutical industry and the
medical industry boom in emerging economies foster demand for aluminum
foils
• Rolled Aluminium Foil: it is primarily consumed by packaging, transportation,
and construction sectors.
• The packaging industry took the largest share, approximately 41% during 2016,
followed by transportation.
• It is projected that global rolled foil consumption might increase by 4.8% CAGR
from 2017 to 2025 with the transportation industry being the largest market
• Backed Aluminum Foil: this include laminated, embossed, backed with paper,
plastics and adhesives.
• Developed regions are expected to show moderate growth for backed
aluminum foil used in industrial purposes, especially from the electricity sector
that uses such foils for insulation purposes
The market can be segmented into packaging applications and non-packaging
applications. Packaging applications involve protecting the food from climatic,
chemical and physical hazards. Non-packaging applications which utilize the property
of conductivity of this foil include cable and capacitors wraps, the heat exchanging
tube fins for air conditioners.

Investment Opportunity Study 2020 Project Profile- Manufacturing of Packaging Aluminium Foil
Page | 152
Figure 18: Market for Aluminium Packaging in Percentage99
Due to high availability of substitutes in the food & beverages industry, packaging and
quality of product have always been the key competitive factors. Also, this is one of
the major reasons that why food and beverages manufacturers invest more than 11%
of the revenue on packaging.
Dry foods, like aromatic herbs and spices, are best preserved when packed in
Aluminium packaging medium. Lined cartons are the most favorable packaging
method for many dry food products. Latest innovations in packing, like cylindrical
design for an easy-to-open packaging mechanism, protective membranes under a
plastic re-closable lid for repeated usage, and perforated top seam for easy opening,
are revolutionizing Aluminium foil packaging in the food industry.
10.4. The Concept Packaging in today’s world has emerged as an integral part of brand promotion. Owing
to modern-day lifestyle coupled with today’s fast-paced life, customers’ inclination
towards convenience packaging has increased.
Aluminium plays a major role in the modern world through its innumerable forms of
applications - from kitchenware to electric conductors and from railway wagon to
Appollo spacecraft. Because of its intrinsic and versatile properties of lightness,
strength to weight ratio, corrosion resistance, electrical and thermal conductivity, non-
toxicity etc., a wide range of uses has opened up for this metal. Aluminium as a
packaging material is unmatched owing to its light weight, hygienic and non-
contamination which eventually results in longer shelf-life of end products.
99https://www.entrepreneurindia.co/Document/Download/How%20to%20Start%20Food%20Packagin
g%20Foil%20Manufacturing%20Business-776402-.pdf

Investment Opportunity Study 2020 Project Profile- Manufacturing of Packaging Aluminium Foil
Page | 153
Growing emphasis on ecofriendly packaging and foray by the investors/start-ups in
the emerging economies is expected to open new opportunities in the aluminum foil
packaging market in Bhutan.
10.4.1. Plant Capacity
Aluminium foil = 150 kg per day = 45MT per year
10.4.2. Availability of Raw Material
The raw materials for Aluminium foil packaging is produced utilizing Aluminium sheets
and it is a part of stretchable packaging material. The cost of the Aluminium rolls is
around Nu.300 a kg.
10.5. 1.5 Manufacturing Process100 As the foil sheets come through the rollers, they are trimmed and slit with circular or
razor-like knives installed on the roll mill. Trimming refers to the edges of the foil, while
slitting involves cutting the foil into several sheets. These steps are used to produce
narrow coiled widths, to trim the edges of coated or laminated stock, and to produce
rectangular pieces. The main required aluminum foil equipment are automatically
controlled rewinding machine, grinding machine, weighing machine etc.
Figure 19: Plant Machineries
10.6. Product Standards Aluminum packaging foil
• Width: Width:45cm (450mm 18 inch)
• Length: 8m
• Thickness: 10-20 micron (range 0.01mm to 0.02mm)
• Net of Aluminium foil: 60g-97g /Roll (without paper core and package)
• Card Paper packed and labelled
100 http://www.madehow.com/Volume-1/Aluminum-Foil.html#ixzz6T6CkU6vB

Investment Opportunity Study 2020 Project Profile- Manufacturing of Packaging Aluminium Foil
Page | 154
10.7. More Details: More details on the process can be found from the following sources and videos for
better understanding:
Table 18: Addition Sources and Videos for Further Reference
Reading Materials Videos
https://www.lahootipapernapkinmachine.com/aluminium-foil-
machine.html
https://www.youtube.com/watch?
v=w58MAyI1qxg
https://www.entrepreneurindia.co/Document/Download/pdfan
ddoc-29120-.pdf
https://www.entrepreneurindia.co/Document/Download/How
%20to%20Start%20Food%20Packaging%20Foil%20Manufactur
ing%20Business-776402-.pdf
1.8 Basic Financial Calculations
The financial calculation is based on fairly conservative values of production of 100 kg
per day, the raw material cost is @ Nu. 300 per kg of Aluminium rolls. The production
targets are considered at an annual production of 30 MT. The sale price is considered
as Nu. 500 per kg.
Basic financial calculations are detailed in the table below:
Table 19: Basic Financial Calculations
Particulars Description Value
Establishment Cost Nu.1,500,000
Operation Cost Nu.13,005,00
0
Fixed Cost Nu.3,105,000
Salaries (9 people) Nu.2,700,000
Overhead Cots (15%) including
utility bills
Nu.405,000
Variable Costs Nu.9,900,000
Raw Material Nu.9,000,000
Misc. Nu.900,000
Profit Margin (Revenue
Generation)
30000 Kg @ Nu.500/kg Nu.15,000,000
Break Even Units
(Production)
29 MT
Break Even Months 11 Months
Annual Profit Before Tax Nu.1,995,000
Annual Profit After Tax Nu.1,396,500

Investment Opportunity Study 2020 Project Profile- Manufacturing of Packaging Aluminium Foil
Page | 155
A total of 400 m2 land is sufficient to establish the manufacturing plant. Including the
constructed area, the land can be procured on lease. The built-up requirement is for
production hall and packaging area. Aluminium rolls storage, cutting, as well as stick
manufacturing section can be done in shaded area as well. The plant will employ 9
people.
Assumptions: Table 20: Basic Financial Calculations
Production per day 100 Kg
Annual Production 30,000 kg (30MT)
Cost of Aluminium Roll (Raw Material) Nu. 300 per Kg
Selling Price Nu. 500 per Kg
Yearly Revenue Nu. 19.95 (in Lacs)
10.8. Conclusion Manufacturing Plant of Aluminium foil does not require high technical skill set.
Aluminium Foil Rolls and manufacturing machine are available from India. These are
easy to use and needs investment of around Nu. 1.5 million. It can be managed by
individual investment or by capital loan through financial institutions.
The demand is aplenty and it offers a wide scope in both the local and the international
market. It will not create any hazardous bye-product. The project is highly viable. A
detailed feasibility is recommended before final commencement.
10.9. Machine Suppliers Leading manufacturer for the equipment includes (Individuals are advised to conduct
their own research to seek suppliers. The following list does not indicate the
consultant’s opinion on the choice of supplier and is only for basic information based
on first hand search):
Lahooti Printech Private Limited
Mohammad Sabir (Director)
Shed No. 34, Scheme 2, DSIDC Complex, Phase 2,
Okhla Industrial Area,
New Delhi - 110020, Delhi, India
Mobile No.: +918048555838
Web Site:
https://www.lahootipapernapkinmachine.com
Viva Engineering
Mr Vaman Thacker
(Proprietor)
27, Shrinathji Estate,
Opposite Kailash Estate
Phase 1,
GIDC vatva, Ahmedabad -
382445,
Dist. Ahmedabad, Gujarat
Mobile : +918045800575
Email : info@ vivaengg.in
Web Site: http://www.vivaengg.in
Friends Engineering
Overseas Exports Manjit Singh (Proprietor) J- 126-B, Vishnu Garden New Delhi - 110018, Delhi, India Phone: 011 2598 4953 Email: sales@ friendsengineering.in

Service Sectors

Investment Opportunity Study 2020 Project Profile- Hydroponic Farming, Bhutan
Page | 156
Project Title: Hydroponic Farming, Bhutan

Investment Opportunity Study 2020 Project Profile- Hydroponic Farming, Bhutan
Page | 157
1. Hydroponic Farming Service
Background of the Idea
Bhutan possesses a considerable array of opportunities and strengths in promoting
organic farming. It is exploring opportunities to develop local organic crop produces
for organic horticulture products. It has an opportunity to promote healthy lifestyle
and sustainable use of resources and “yes” economic development.
Bhutan has many opportunities primarily due to growing interest and awareness in
organic produce. Current market trends show that markets for organic produce are
available across the globe and demand is increasing for healthy food coupled with the
growing scare of environmental pollution and damage which is pushing the growth of
organic farming worldwide. The growing demand for organic food is manifested in the
total global area under organic farming.
The Himalayan country of Bhutan is typically an agrarian country with about 57% of
the people depending on agriculture. However, farming has been constrained by the
mountainous topography and rapid changes in environmental variability. With climate
change, agricultural production and food security is likely to face one of the biggest
challenges in the twenty-first century. The country has already been experiencing some
impacts of climate change, such as crop loss to unusual outbreaks of diseases and
pests, erratic rainfalls, windstorms, hail storms, droughts, flash floods and landslides
annually.
Because of the nature of subsistence farming with low productivity and small land
holding, the food production in Bhutan does not meet the entire food demand of the
country and the income of rural farming households remains at a low level. Under
those circumstances, promotion of “Hydroponic Farming” plays an important role in
agricultural development.
Rationale of the Idea
1.2.1. Local Demand
The country’s climatic and altitudinal variability allows cultivation of many crops,
including year-round production. The main cereal crops cultivated by the farmers
include rice, maize, wheat, barley, buckwheat and millet. Among the fruit crops, the
two most important ones are apples and mandarin, and farmers cultivate almost all
kinds of vegetable crops due to the large climatic variability across the agroecological
zones. However, the country continues to import close to 30% of its food from outside,
mostly from India.

Investment Opportunity Study 2020 Project Profile- Hydroponic Farming, Bhutan
Page | 158
The country’s total geographical size is 38,394 km2, of which cultivable land accounts
for just 2.93% of its entire area. It shows that the country has a limited cultivable land
due to the geographical and topographic features.
Hydroponics plants grow in water, without any use of soil. Though a continuous supply
of water is used, it conserves water hence reducing water shortage problems. It is 100%
organic as it uses compost and manure as its nutrient source.
This process takes place in a very versatile and intensive hydroponic growing unit
where only water and nutrients are used to produce a grass and root combinations
that is very lush and high in nutrients. These green products are extremely high in
protein and metabolizable energy, which is highly in demand. In short - it reduces
water usage, marginal land use, constant food supply, reduced growth time, reduced
labor requirement, cost effective, high nutritional value, and is completely natural.
Currently, the Agriculture Research and Development Centre in Mongar is carrying
field research on growing high-value Hydroponics Maize Fodder using the
Hydroponics technology and previously hydroponic fodder is successfully
implemented in Rekhey and Marthang Chewog under Dewathang Gewog, Samdrup
Jongkhar.
List of plants cultivated using Hydroponic Farming
The list of plants mentioned here are the ones that can be easily grown in hydroponic
system. The root plants are difficult to be cultivated in a hydroponic system. The list is
not limited to these vegetables.
• Greens: Spanish, chard, cabbage, lettuce, celery, mint etc.
• Vining plants: tomatoes, cucumbers, peas etc.
• Root plants: potatoes, carrots, radish etc.
• Fruits: raspberries, strawberries, small papaya, peppers, blue berries etc.
• Herbs: basil, parsley, rosemary, chives, sweet marjoram, watercress, dill etc.

Investment Opportunity Study 2020 Project Profile- Hydroponic Farming, Bhutan
Page | 159
Market Outlook International1
A report by Mr. Sarah Smith, Research Advisor at Reportbuyer.com estimates that
overall hydroponics system market is projected to grow from USD 8.1 billion in 2019
to USD 16.0 billion by 2025, at a CAGR of 12.1%.
Hydroponic systems provide higher yield compared to traditional agricultural
techniques, owing to the increase in harvest cycles. Furthermore, hydroponic systems
eliminate the use of artificial ripening agents and pesticides, which helps in creating
nutritionally superior vegetable produce.
The market for hydroponics is fragmented at the global level, with multiple innovative
start-ups and emerging companies entering the hydroponics market. Worldwide,
major companies have been trying to enter in this space, either by developing
hydroponic components or by investing in the technology for crop cultivation.
The Concept
The soilless farming technique which is gaining popularity these days is called
hydroponic farming. This technique makes use of water-soluble nutrient mixture for
growing fruit, vegetable or flowering plants. Generally, in conventional farming
technology the soil soaks store the nutrients that are supplied and the plants in turn
take the nutrients from the soil. But in hydroponic method of farming, plant roots get
in direct contact with the water-soluble nutrient content and this helps in faster
absorption and growth. The idea of hydroponic farming is believed to serve two
purposes – one, it can be practiced by people to grow fruits and vegetable where the
soil condition is not suitable for conventional farming, second, it is a solution for
satisfying sustainable food requirements in urban areas where the land for
conventional farming is not good and fertile.
Hydroponic farming is being considered as a revolution in the farming and agriculture
industry because of its capability to produce surplus food. This farming technique is
environment friendly as there is not much use of chemicals in the form of pesticides
and insecticides. Growing plants hydroponically needs an environment which can be
controlled as per the requirement. This kind of controlled set up for the cultivation of
crops eliminates the danger of critical warm climatic conditions on agriculture.
The greenhouse hydroponic farming is a perfect one-stop solution to all farming and
food relates problems. The commercial hydroponic farming systems will give good
1. https://www.prnewswire.com/news-releases/the-hydroponics-market-is-estimated-at-usd-8-1-billion-in-2019-and-
projected-to-grow-at-a-cagr-of-12-1-to-reach-usd-16-0-billion-by-2025--300855444.html

Investment Opportunity Study 2020 Project Profile- Hydroponic Farming, Bhutan
Page | 160
profits. In conventional farming, the farmer has to work on the ground, plant seeds,
and grow plants.
The farmer is heavily depended on natural resources and nature’s mercy. However, in
hydroponics, the farmer takes complete control on plant farming. The farmer takes
control on quantity of water, oxygenating the water, and adding right nutrients at
required amounts depending on growing plants.
In this way, a farmer can solve most of the problems faced in conventional farming
such as quality, gathering farm yard manure, water, and pests and insects that come
through ground. Hydroponic Farming follows two general methods of farming.
1. Plants roots are directly suspended in nutrient rich waters. The root system
avails oxygen and nutrients easily.
2. The roots are supported in growing medium such as clay rocks, rock wool
while plants are stabilized to grow in a proper direction.
Types of Hydroponic Farming
There are six basic types of hydroponic farming systems. The good thing in acquiring
best hydroponics is by combining different types into one hybrid hydroponic system
to get the rich nutrient solution to the plants. The following are the list of hydroponic
farming that one can choose accordingly to space, finance and production vermiculite,
yield:
a) Wick Systems
b) Drip Systems
c) Nutrient Film Technique
d) Deep Water Culture
e) Ebb and Flow or Flood and drain
f) Aeroponics
In Bhutan, mainly two types of technologies are used for Hydroponic Farming:
1.6.1. Hydroponic Farming – Nutrient Film Technique (NFT):
Nutrient Film Technique (NFT) is growing of plants bare-rooted supported by a netted pot in long
channels down which flows a shallow water full of minerals required to grow plants healthy. In
continuous-flow solution culture, the nutrient solution constantly flows past the roots. It is much easier
to automate than the static solution culture because sampling and adjustments to the temperature, pH,
and nutrient concentrations can be made in a large storage tank that has potential to serve thousands
of plants.
Figure_ 1: Nutrient Film Technique (NFT)

Investment Opportunity Study 2020 Project Profile- Hydroponic Farming, Bhutan
Page | 161
In NFT, a very shallow stream of water containing all the dissolved nutrients required for plant growth
is recirculated past the bare roots of plants in a watertight thick root mat, which develops in the bottom
of the channel and has an upper surface that, although moist, is in the air. Subsequent to this, an
abundant supply of oxygen is provided to the roots of the plants. A properly designed NFT system is
based on using the right channel slope, the right flow rate, and the right channel length.
The main advantage of the NFT system over other forms of hydroponics is that the plant roots are
exposed to adequate supplies of water, oxygen, and nutrients. In all other forms of production, there is
a conflict between the supply of these requirements, since excessive or deficient amounts of one result
in an imbalance of one or both of the others. NFT, because of its design, provides a system where all
three requirements for healthy plant growth can be met at the same time, provided that the simple
concept of NFT is always remembered and practiced. The result of these advantages is that higher yields
of high-quality produce are obtained over an extended period of cropping. A downside of NFT is that
it has very little buffering against interruptions in the flow (e.g., power outages). But, overall, it is
probably one of the more productive techniques.
1.6.2. Hydroponic Farming – Ebb and Flow or Flood and Drain
Flood and Drain (Ebb and Flow) systems are very popular among home hydroponic growers or
hydroponic farming. It is easy to build and can use almost any material laying around, so growers don’t
need to spend much money to start growing hydroponic plants. Also, it can be built to fit in any available
space in the backyard or in terrace gardening.
The working method of hydroponic flood and drain system is simple. The container that plants are
growing is the main part in this system. There is a tray above a reservoir of nutrient solution.

Investment Opportunity Study 2020 Project Profile- Hydroponic Farming, Bhutan
Page | 162
Figure_ 2: Ebb and Flow or Flood and drain
At regular intervals, a simple timer causes a pump to fill the upper tray with nutrient
solution, after which the solution drains back down into the reservoir. This keeps the
medium regularly flushed with nutrients and air. Once the upper tray fills past the drain
stop, it begins recirculating the water until the timer turns the pump off, and the water
in the upper tray drains back into the reservoirs.
Plants like tomatoes, cucumber, peppers, and strawberries, celery that have deep roots
and need support are preferable to grow in Ebb and Flow systems.
Advantages of Hydroponic Farming Systems
Hydroponics can be initiated in a small area and gets adapted to the conditions of
urban areas. This method favors the people in the following ways:
• Isolation from the soil and cultivation at a convenient level.
• Water along with low cost substrates such as sand, rice, husk and pumice etc.
are used.
• Balconies, kitchen gardens, rooftops are the places that can be used for
simplified hydroponics.
• Recycling of water is done so that the environment doesn’t get polluted.
• Any disease or pest is controlled by natural herbal treatments. No chemical used.
• Higher yield in less time and multiple harvest results in greater output.
• Easy to understand methods and less technological involvements.
• Use of recycled materials.
• Source of income to the family.
• Safe food for consumption with high biological and dietary value.
Investment Opportunity Study 2020 Project Profile- Hydroponic Farming, Bhutan
Page | 163
• Household food needs are achieved by fresh and nutritious food.
• Shade net (shade to sun ratio) and polythene sheet can be used to protect the
plants from sun and rain respectively.
Equipment required for Hydroponic Farming
There are various techniques or types of deploying a hydroponic farm: the wick system,
water culture, ebb and flow system, drip system, nutrient film technique and the
aeroponic technique. A basic system of hydroponic may require the following
equipment which may change depending on the size of the farm and technique being
used:
• Plastic trays for the medium, nutrient solution and the plants
• A table or elevated stand to hold the trays
• A container to hold the nutrient mixture
• A pumping cable or pipe which can pump 500 liters per hour
• Small pots with holes to hold the plants
• Growing medium if necessary
• Drainage tube, Sprayers
• Timer, thermometer and other sensors
• Seeds or plant cuts
• Nutrient solutions, Beneficial insects
• pH meter, Induction lights, LED grow lights
Cost Estimation in Hydroponic
Other Requirements
• Land: About 1,200 m2
• Manpower of 13 people which includes:
o Operation Head
o Purchase, Accounts and Store
o Sales & Supply Officer
o Supervisor
o Skilled Labour/ Unskilled Labour
o Driver
o Security
o Housekeeping

Investment Opportunity Study 2020 Project Profile- Hydroponic Farming, Bhutan
Page | 164
Estimated Project Cost and Financials
The total cost of the project has been considered as Nu. 10.3 million. The Break-Even
Months are 27. DSCR value is 2.07 which show that the project will generate sufficient
to pay loans. Other details are as follows:
Table_ 1:Estimated Project Cost and Financials
# Description Amount (Nu. In Lacs)
1. Establishment Cost 102.60
2. Cost of Operation
i. 2.1 Fixed Cost 53.19
ii.
a. Salary & Wages 32.04
iii. b. Overhead Cost 21.15
3. Variable Costs 42.63
iv.
a. Raw Material 30.10
b. Other Variable Cost 12.53
4. Break Even Point 69%
5. Payback Period 27 Months
6. D.S.C.R. 2.07
7. Return on Investment 44.53%
8. NPR 18.59%
1.10.1. Project Cost
The cost of project is estimated to be a sum total of the value of land, building and
civil construction, plant and machinery, MFA, preliminary expenses, pre-operative
expenses and contingency. The required land is around 1,200 m2. Its purchase value
would stand at Nu. 3 million estimated on current market trends (around Nu. 100,000
per decimal) and sharing about 29% of project cost followed by Building & Civil
Construction with 25.32% and Plant & Machinery about 23.25%. Margin Money for
working capital is not considered as part of project cost. The summary of the project
cost is as follows:
Table_ 2:Head Wise Project Cost and Sharing Percentage
# Particulars Value (Nu. in Lacs) Cost Sharing
1. Land 1200 sq. meters 29.70 28.95%
2. Building & Civil Construction 25.98 25.32%
3. Plant & Machinery 23.85 23.25%
4. Misc. Fixed Assets 12.65 12.33%
5. Preliminary Expenses 1.75 1.71%
6. Pre-operative Expenses 6.79 6.62%
7. Contingencies 3% 1.87 1.83%
Total 102.60 100%

Investment Opportunity Study 2020 Project Profile- Hydroponic Farming, Bhutan
Page | 165
1.10.2. Means of Finance
Table_ 3:Means of Finance
# Particulars Value (Nu. in Lacs)
1. Promoters Equity 46.05
2. Term Loan from Bank 56.55
3. Margin Money for Working Capital 4.58
Total 107.18
Figure_ 3:: Project Cost Components and Its Share
1.10.3. Estimation of Building and Civil Work and Cost
Based on the requirement of processing area, store for raw material and finished goods
and the office space, the following building area plan has been laid down. The building
civil construction cost is considered as per the Bhutan Schedule of Rates (Civil Works)
2018, issued by Ministry of Works and Human Settlement, Bhutan. Pre-fabricated
building structure will be used for construction of building amenities. Total estimated
building construction cost is Nu.2.6 million which is about 25% of the total project cost.
The detailed Building and Civil Work cost estimation is given below:
Land 14%
Building & Civil Construction
6%
Plant & Machinery 39%
Misc Fixed Assets 12.65, 12%
Preliminary Expenses, 1.75, 2%
Pre operative Expenses, 6.79, 7%
Contingencies , 1.87, 2%

Investment Opportunity Study 2020 Project Profile- Hydroponic Farming, Bhutan
Page | 166
Table_ 4:Building and Civil Work
# Particular Dimensions (Mt.)
Area (Sq. Mt.)
Rate
Per Sq. Mt. (Nu.)
Nu.
(in Lacs)
1. Ground preparation Cost -
including material
1200 200.00 2.40
2. Boundary wall (140 Rm with
height of 1.82m(6 ft))
252
350.00 0.88
3. Ground Cover - Carpeting
1000 70.00 0.70
4. Site preparation, frames,
doors, poly and ends plus
construction and installation
cost approx. amount to @ 1
house
1000 1200.00 12.00
5. Office Space & Display Area 7.50 10.00 75 5000.00 3.75
6. Finished Goods Storage 12.50 10.00 125 5000.00 6.25
Grand Total 3400 25.98
Source: https://www.mowhs.gov.bt/wp-content/uploads/2018/04/BSR-2018-civil.pdf
1.10.4. Plant and Machinery Cost
The cost estimates for plant & machinery have been worked out based on the cost
figures received from the Indian plant machinery suppliers. The prices are considered
without Indian GST tax as it is exempted under supply of trade agreement between
India and Bhutan (Category Export). Installation and commissioning of equipment are
considered separately in the total plant and machinery cost estimation. Freight and
insurance have been considered with the assumption that all goods are transported
by road. Goods of imported origin would be handled at the Kolkata port.
The equipment list with cost is given in the table below:
Table_ 5:Plant & Machinery with Cost
# Plant & Machinery Qty. Rate Amount
(Nu. in Lacs)
1. Equipment’s for Hydroponic as per attached list
b.1(Growing and delivery equipment cost)
4.85
2. Horizontal air fans 4 20,000 0.80
3. Cooling equipment for a single setup 4 25,000 1.00
4. Heaters, Poly inflation kit, low voltage wiring
package and protective equipment, Lights
2 175,000 3.50
5. Electrical panel setup 1 45,000 0.45
6. Environmental control equipment 2 375,000 7.50

Investment Opportunity Study 2020 Project Profile- Hydroponic Farming, Bhutan
Page | 167
7. Generator for single bay 1 75,000 0.75
8. Transportation cost @15%
2.83
Total 21.68
9. Packaging and Forwarding @10% 2.17
Grand Total 23.85
1.10.5. Equipment for Hydroponic
Growing and delivery equipment is outlined below:
Table_ 6:Growing and Delivery Equipment (List b.1)
# Equipment Qty. (Unit) Price
Per Unit
(in Nu.)
Total cost
For all Seasons (in
Nu.)
1. Sprayer 8 9500 76000
2. Carbon di-oxide
generator
2 40000 80000
3. Water Pump 8 4000 32000
4. Environment Control
Meter
2 15000 30000
5. pH meter 2 4200 8400
6. Thermometer 2 2500 5000
7. Humidity sensor 2 11000 22000
8. CO2 sensor 2 41000 82000
9. Measurement scales 2 75000 150000
Total 485400
Total Nu. In Lacs 4.85
1.10.6. Misc. Fixed Assets
A miscellaneous fixed asset includes office equipment & furniture, computer and
peripherals, firefighting equipment, vehicle etc. Nu. 1.3 million has been estimated
under this head “MFA” and presented in the below table:
Table_ 7:Misc. Fixed Assets Cost Estimation
# Particulars Qty. Amount
(Nu.in lacs)
1. Office Equipment & Furniture 1 2.00
2. Computer & accessories 2 1.00
3. Printer & Software’s 1 0.50
4. CCTV Surveillance 8 0.68
5. Fire Fighting Equipment’s 6 0.12

Investment Opportunity Study 2020 Project Profile- Hydroponic Farming, Bhutan
Page | 168
6. Vehicle 1 8.00
7. Air Conditioner 1 0.35
Total 12.65
1.10.7. Preliminary Expenses
Preliminary expenses are those expenses which are incurred before the incorporation
and commencement of the business. These are treated as deferred
revenue expenditure. These expenses are marked to be written off in the next ten years
in estimation of profitability. The Preliminary Expenses details are as follows:
Table_ 8:Preliminary Expenses
# Particular Amount
(Nu.in Lacs)
1. Company formation expenses (ROC), legal & liasoning 1.00
2. Registration in Labor Department 0.75
3. Weight & Measurement
4. and Other required Licenses
Total 1.75
1.10.8. Pre-operative Expenses
These are expenses incurred prior to commencement of commercial production. A
total of Nu. 679,000 is estimated under this cost to be written off in the next 10 years
and exempted in the first year. The details are given in the table below:
Table_ 9:Pre- operative Expenses
# Particular Amount
(Nu.in Lacs)
1. Interest up to production on term loan 1.92
2. Electricity charges construction period 0.50
3. Salary during construction period 0.40
4. Marketing launch expenses 0.80
5. Implementation of ISO 9001: 2015 Certification 0.40
6. Project consultancy fees @3% of project cost 1.87
7. Travelling Expenses 0.50
8. Registration of Trade Mark 0.40
Total 6.79
1.10.9. Cost of Raw Material
The cost of the raw material consists mainly of cost of the main ingredients, raw
material and cost of packaging. The annual raw material cost is based on the present
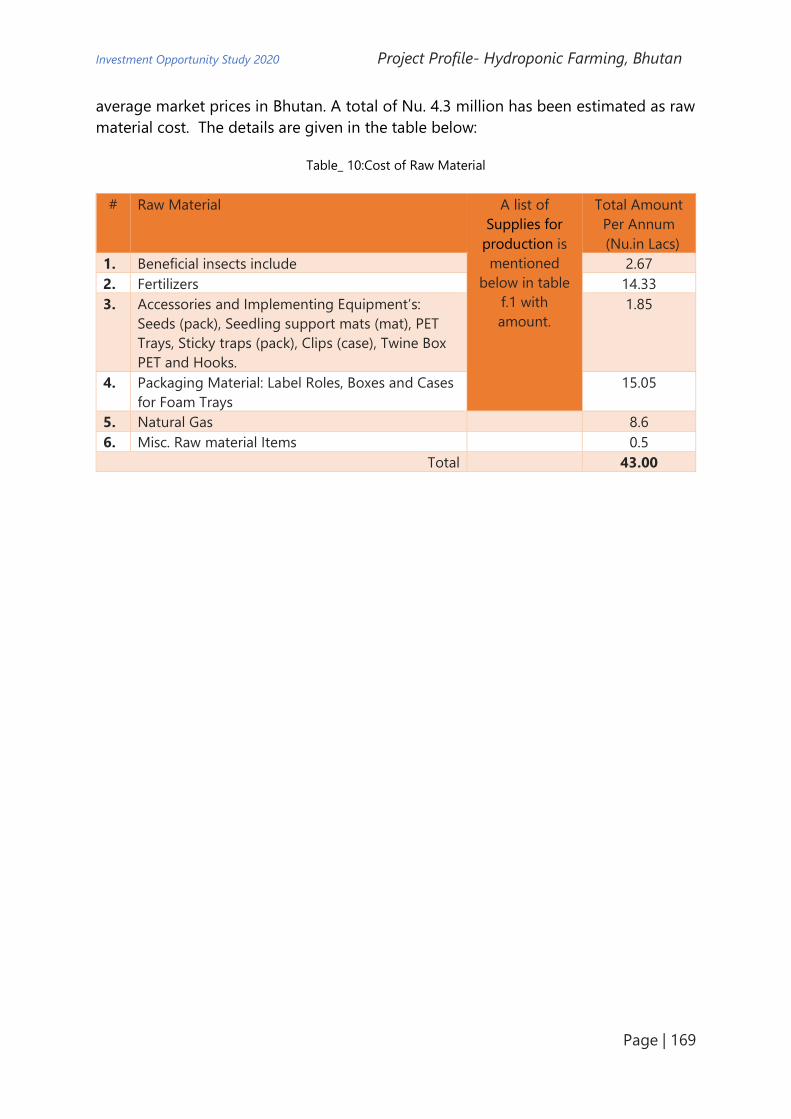
Investment Opportunity Study 2020 Project Profile- Hydroponic Farming, Bhutan
Page | 169
average market prices in Bhutan. A total of Nu. 4.3 million has been estimated as raw
material cost. The details are given in the table below:
Table_ 10:Cost of Raw Material
# Raw Material A list of
Supplies for
production is
mentioned
below in table
f.1 with
amount.
Total Amount
Per Annum
(Nu.in Lacs)
1. Beneficial insects include 2.67
2. Fertilizers 14.33
3. Accessories and Implementing Equipment’s:
Seeds (pack), Seedling support mats (mat), PET
Trays, Sticky traps (pack), Clips (case), Twine Box
PET and Hooks.
1.85
4. Packaging Material: Label Roles, Boxes and Cases
for Foam Trays
15.05
5. Natural Gas 8.6
6. Misc. Raw material Items 0.5
Total 43.00

Investment Opportunity Study 2020 Project Profile- Hydroponic Farming, Bhutan
Page | 170
1.10.10. Items for Supplies for Production (f1)
Table_ 11:Items for Supplies for Production
# Supplies for production Qty. (Nos.) Per Unit Price
(in Nu.)
Annual cost in Nu.
1. Beneficial insects include
Lacewing (pack) 30 2723.09 81692.70
Encarsia Formosa (pack) 20 1739.75 34795.00
Aphidus Colemani (pack) 10 3680.78 36807.80
Bees (hives) 20 5673.1 113462.00
Total 266757.50
Total Nu. In Lacs 2.67
2. Fertilizers
Blended mix (pounds) 3000 75.64 226920.00
Calcium nitrate (pounds) 3000 30.26 90780.00
Additional mix (pounds) 50 75.64 3782.00
Pesticides (gallons) 50 529.49 26474.50
Sanitizer (gallon) 10 2647.45 26474.50
Rockwool cubes (case) 10 12026.97 120269.70
Rockwool slabs (bags) 200 4689.76 937952.00
Total 1432652.70
Total Nu. In Lacs 14.33
3. Seeds (pack) 10 8093.62 8093.62
4. Seedling support mats (mat) 10 8623.11 8623.11
5. PET Trays 100 75.64 7564.00
6. Sticky traps (pack) 10 2269.24 22692.40
7. Clips (case) 10 6278.23 62782.30
8. Twine Box PET 10 1665.11 16651.10
9. Hooks 5200 11.35 59020.00
185426.53
Total Nu. In Lacs 1.85
# Packaging Qty.
(Unit)
Per Unit Price
(in Nu.)
Cost
(in Nu.)
1. Label rolls 180 2269.24 408463.20
2. Cases of foam trays 300 2344.88 703464.00
3. Boxes 8000 49.17 393360.00
1505287.20
Total Nu. In Lacs 15.05
1.10.11. Salary & Wages
Salaries and Wages (including benefits) for different categories of employees have
been considered based on present day expenses. The salaries are considered as per
the present trends in the relevant segment and rules as per Pay Revision Act 2019 (9
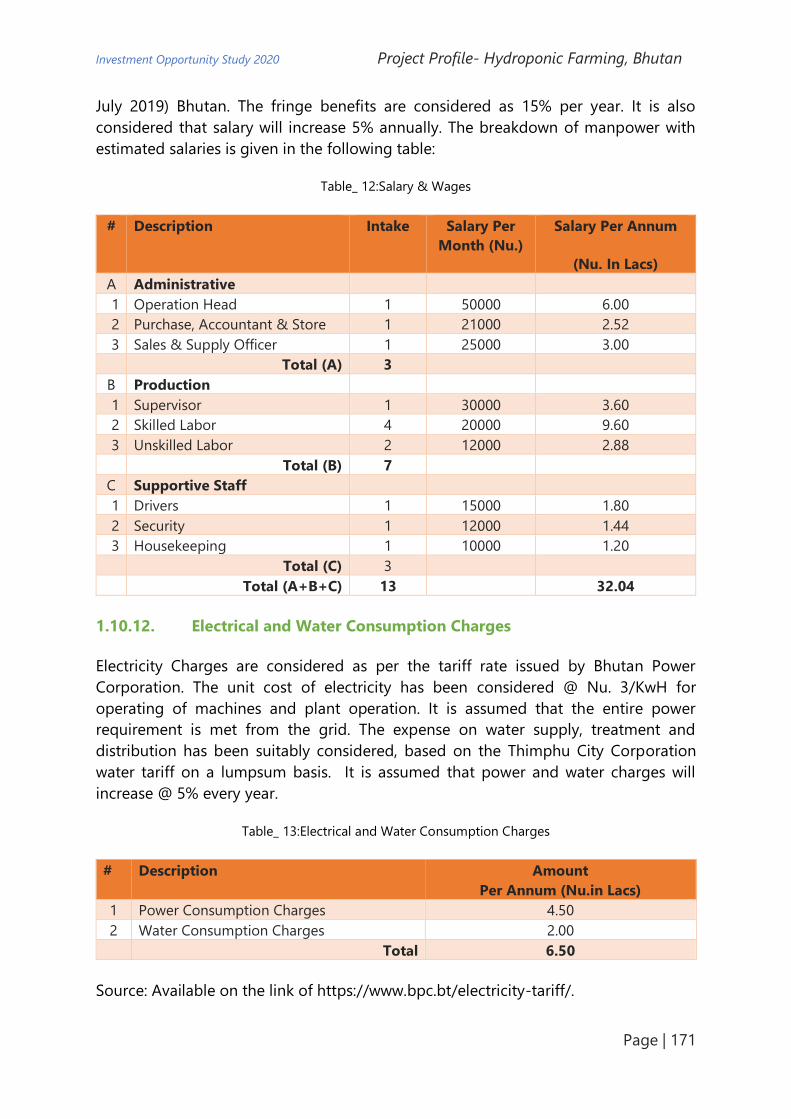
Investment Opportunity Study 2020 Project Profile- Hydroponic Farming, Bhutan
Page | 171
July 2019) Bhutan. The fringe benefits are considered as 15% per year. It is also
considered that salary will increase 5% annually. The breakdown of manpower with
estimated salaries is given in the following table:
Table_ 12:Salary & Wages
# Description Intake Salary Per
Month (Nu.)
Salary Per Annum
(Nu. In Lacs)
A Administrative
1 Operation Head 1 50000 6.00
2 Purchase, Accountant & Store 1 21000 2.52
3 Sales & Supply Officer 1 25000 3.00
Total (A) 3
B Production
1 Supervisor 1 30000 3.60
2 Skilled Labor 4 20000 9.60
3 Unskilled Labor 2 12000 2.88
Total (B) 7
C Supportive Staff
1 Drivers 1 15000 1.80
2 Security 1 12000 1.44
3 Housekeeping 1 10000 1.20
Total (C) 3
Total (A+B+C) 13 32.04
1.10.12. Electrical and Water Consumption Charges
Electricity Charges are considered as per the tariff rate issued by Bhutan Power
Corporation. The unit cost of electricity has been considered @ Nu. 3/KwH for
operating of machines and plant operation. It is assumed that the entire power
requirement is met from the grid. The expense on water supply, treatment and
distribution has been suitably considered, based on the Thimphu City Corporation
water tariff on a lumpsum basis. It is assumed that power and water charges will
increase @ 5% every year.
Table_ 13:Electrical and Water Consumption Charges
# Description Amount
Per Annum (Nu.in Lacs)
1 Power Consumption Charges 4.50
2 Water Consumption Charges 2.00
Total 6.50
Source: Available on the link of https://www.bpc.bt/electricity-tariff/.

Investment Opportunity Study 2020 Project Profile- Hydroponic Farming, Bhutan
Page | 172
The details of electrical installation for power distribution have been considered
commensurate with power load and process control requirements.
1.10.13. Term Loan Estimation
The term loan requirement is estimated on the funding pattern in Bhutan. It is
estimated as per the norms by Bhutan National Bank Limited. The term loan is
considered as up to 60% to 75% of the cost of the project and it does not include
working capital margin money (as per financing pattern by Bhutan National Bank
Limited). The estimated term loan is Nu.5.7 million and with 55% to come as loan from
by financial institution. The rest of the capital investment (Nu. 4.6 million comprising
45%) will be managed by the entrepreneurs. The details are as follows:
Table_ 14:Term Loan Estimation
# Particulars Margin
%
Amount
(Nu.in
Lacs)
Own
Contribution
(Nu. in Lacs)
Bank Loan
(Nu.in Lacs)
1. Land 50% 29.70 14.85 14.85
2. Building & Civil Construction 40% 25.98 10.39 15.59
3. Plant & Machinery 25% 23.85 5.96 17.89
4. Misc. Fixed Assets 35% 12.65 4.43 8.22
5. Preliminary Expenses 100% 1.75 1.75 0.00
6. Pre-operative Expenses 100% 6.79 6.79 0.00
7. Contingencies 100% 1.87 1.87 0.00
Total 102.60 46.05 56.55
Sharing %
45% 55%
8 Margin Money for Working
Capital
100% 4.58 4.58 0.00
1.10.14. Working Capital Loan Amount
Working capital loan up to 75% of the total working capital gap is considered in
Bhutan. The total estimated working capital loan requirement is Nu.1.2 million and
Margin money is estimated as Nu. 458,000.
Working capital requirements have been worked out in the following table:
Table_ 15:Working Capital Loan Amount
# Particulars Period Margin
%
Amount
(Nu.in
Lacs)
Own
Contribution
(Nu. in Lacs)
Bank Loan
(Nu.in
Lacs)
1. Raw Material 15 days 50% 1.24 0.62 0.62
2. Receivable 30 days 25% 8.19 2.05 6.14
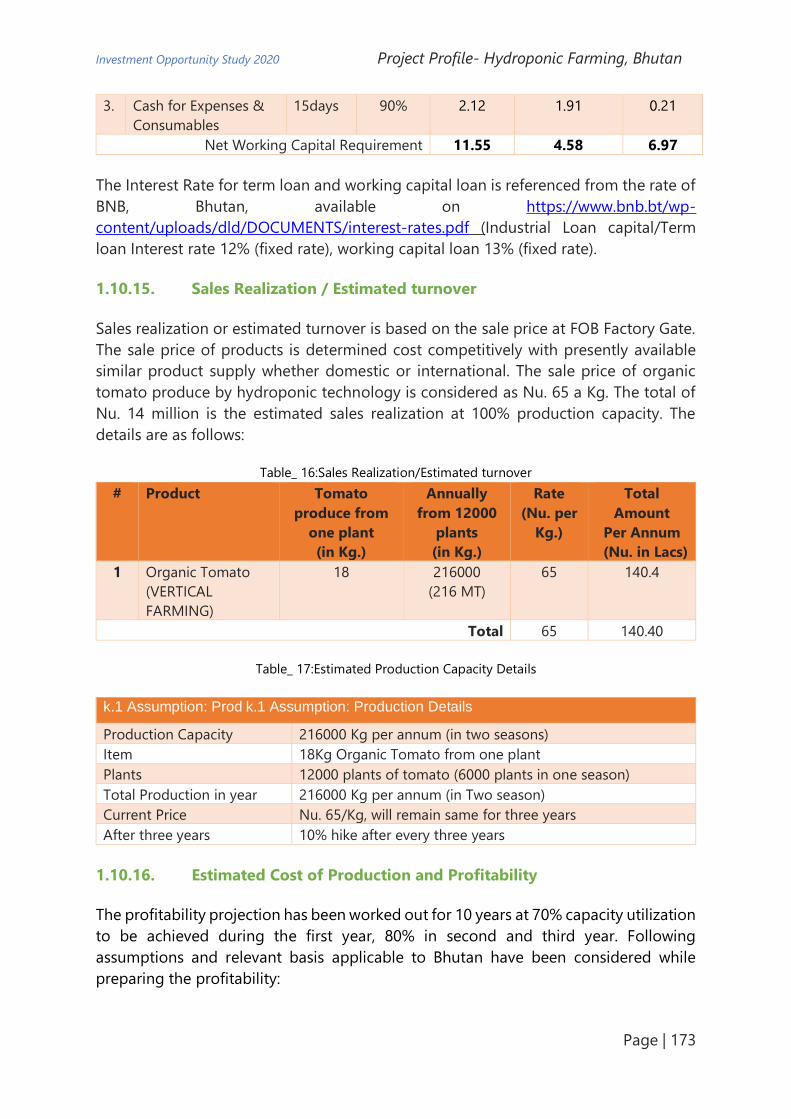
Investment Opportunity Study 2020 Project Profile- Hydroponic Farming, Bhutan
Page | 173
3. Cash for Expenses &
Consumables
15days 90% 2.12 1.91 0.21
Net Working Capital Requirement 11.55 4.58 6.97
The Interest Rate for term loan and working capital loan is referenced from the rate of
BNB, Bhutan, available on https://www.bnb.bt/wp-
content/uploads/dld/DOCUMENTS/interest-rates.pdf (Industrial Loan capital/Term
loan Interest rate 12% (fixed rate), working capital loan 13% (fixed rate).
1.10.15. Sales Realization / Estimated turnover
Sales realization or estimated turnover is based on the sale price at FOB Factory Gate.
The sale price of products is determined cost competitively with presently available
similar product supply whether domestic or international. The sale price of organic
tomato produce by hydroponic technology is considered as Nu. 65 a Kg. The total of
Nu. 14 million is the estimated sales realization at 100% production capacity. The
details are as follows:
Table_ 16:Sales Realization/Estimated turnover
# Product Tomato
produce from
one plant
(in Kg.)
Annually
from 12000
plants
(in Kg.)
Rate
(Nu. per
Kg.)
Total
Amount
Per Annum
(Nu. in Lacs)
1 Organic Tomato
(VERTICAL
FARMING)
18 216000
(216 MT)
65 140.4
Total 65 140.40
Table_ 17:Estimated Production Capacity Details
k.1 Assumption: Prod k.1 Assumption: Production Details Details
Production Capacity 216000 Kg per annum (in two seasons)
Item 18Kg Organic Tomato from one plant
Plants 12000 plants of tomato (6000 plants in one season)
Total Production in year 216000 Kg per annum (in Two season)
Current Price Nu. 65/Kg, will remain same for three years
After three years 10% hike after every three years
1.10.16. Estimated Cost of Production and Profitability
The profitability projection has been worked out for 10 years at 70% capacity utilization
to be achieved during the first year, 80% in second and third year. Following
assumptions and relevant basis applicable to Bhutan have been considered while
preparing the profitability:

Investment Opportunity Study 2020 Project Profile- Hydroponic Farming, Bhutan
Page | 174
• Repairs & maintenance have been taken as @ 1% per annum on plant & machinery
& misc. fixed assets.
• Bank interest rate has been calculated @ 12% per annum on term loan & working
capital loan @ 13%.
• Insurance charges is @ 0.25% on all assets in first year, then decreases @5% every
year.
• Power & water charges are increased @ 5% every year
• Administrative expenses have been increased @ 5% every year
• Margin money has been considered @ 40% on building, @ 25% on plant &
machinery and @ 25% on misc. fixed assets.
• Bank loan has been considered for repayment in 7 years with one-year moratorium.
• Preliminary exp. will be written off @15% every year in next 10 years.
• Pre-operative exp. will be written off from second year @10% every year in next
years.
• Depreciation has been charged using Straight-Line Method
• Insurance, lease rent & interest has been taken as fixed cost for calculating B.E.P.
• Income tax has been charged @ 30% every year as per Bhutan's tax rates (Source:
Ministry of Finance - https://www.mof.gov.bt/faq/)
• DSCR - debt service coverage ratio - is defined as net operating income divided by
total debt service.
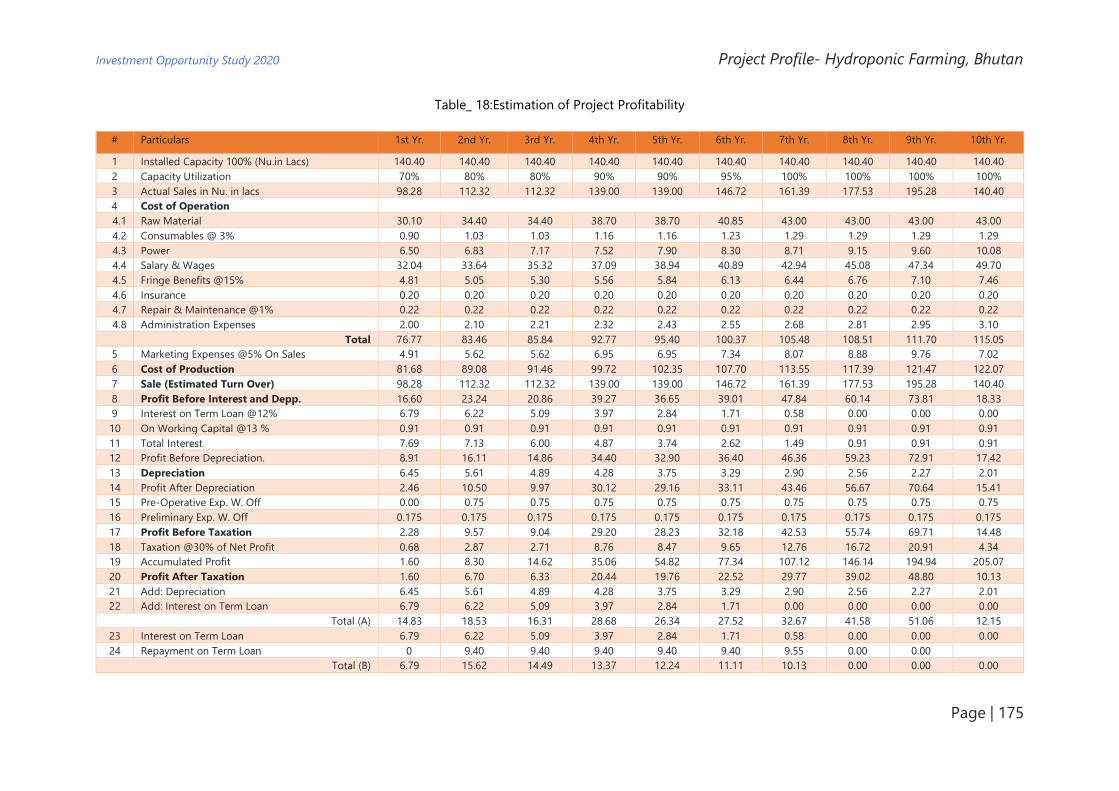
Investment Opportunity Study 2020 Project Profile- Hydroponic Farming, Bhutan
Page | 175
Table_ 18:Estimation of Project Profitability
# Particulars 1st Yr. 2nd Yr. 3rd Yr. 4th Yr. 5th Yr. 6th Yr. 7th Yr. 8th Yr. 9th Yr. 10th Yr.
1 Installed Capacity 100% (Nu.in Lacs) 140.40 140.40 140.40 140.40 140.40 140.40 140.40 140.40 140.40 140.40
2 Capacity Utilization 70% 80% 80% 90% 90% 95% 100% 100% 100% 100%
3 Actual Sales in Nu. in lacs 98.28 112.32 112.32 139.00 139.00 146.72 161.39 177.53 195.28 140.40
4 Cost of Operation
4.1 Raw Material 30.10 34.40 34.40 38.70 38.70 40.85 43.00 43.00 43.00 43.00
4.2 Consumables @ 3% 0.90 1.03 1.03 1.16 1.16 1.23 1.29 1.29 1.29 1.29
4.3 Power 6.50 6.83 7.17 7.52 7.90 8.30 8.71 9.15 9.60 10.08
4.4 Salary & Wages 32.04 33.64 35.32 37.09 38.94 40.89 42.94 45.08 47.34 49.70
4.5 Fringe Benefits @15% 4.81 5.05 5.30 5.56 5.84 6.13 6.44 6.76 7.10 7.46
4.6 Insurance 0.20 0.20 0.20 0.20 0.20 0.20 0.20 0.20 0.20 0.20
4.7 Repair & Maintenance @1% 0.22 0.22 0.22 0.22 0.22 0.22 0.22 0.22 0.22 0.22
4.8 Administration Expenses 2.00 2.10 2.21 2.32 2.43 2.55 2.68 2.81 2.95 3.10 Total 76.77 83.46 85.84 92.77 95.40 100.37 105.48 108.51 111.70 115.05
5 Marketing Expenses @5% On Sales 4.91 5.62 5.62 6.95 6.95 7.34 8.07 8.88 9.76 7.02
6 Cost of Production 81.68 89.08 91.46 99.72 102.35 107.70 113.55 117.39 121.47 122.07
7 Sale (Estimated Turn Over) 98.28 112.32 112.32 139.00 139.00 146.72 161.39 177.53 195.28 140.40
8 Profit Before Interest and Depp. 16.60 23.24 20.86 39.27 36.65 39.01 47.84 60.14 73.81 18.33
9 Interest on Term Loan @12% 6.79 6.22 5.09 3.97 2.84 1.71 0.58 0.00 0.00 0.00
10 On Working Capital @13 % 0.91 0.91 0.91 0.91 0.91 0.91 0.91 0.91 0.91 0.91
11 Total Interest 7.69 7.13 6.00 4.87 3.74 2.62 1.49 0.91 0.91 0.91
12 Profit Before Depreciation. 8.91 16.11 14.86 34.40 32.90 36.40 46.36 59.23 72.91 17.42
13 Depreciation 6.45 5.61 4.89 4.28 3.75 3.29 2.90 2.56 2.27 2.01
14 Profit After Depreciation 2.46 10.50 9.97 30.12 29.16 33.11 43.46 56.67 70.64 15.41
15 Pre-Operative Exp. W. Off 0.00 0.75 0.75 0.75 0.75 0.75 0.75 0.75 0.75 0.75
16 Preliminary Exp. W. Off 0.175 0.175 0.175 0.175 0.175 0.175 0.175 0.175 0.175 0.175
17 Profit Before Taxation 2.28 9.57 9.04 29.20 28.23 32.18 42.53 55.74 69.71 14.48
18 Taxation @30% of Net Profit 0.68 2.87 2.71 8.76 8.47 9.65 12.76 16.72 20.91 4.34
19 Accumulated Profit 1.60 8.30 14.62 35.06 54.82 77.34 107.12 146.14 194.94 205.07
20 Profit After Taxation 1.60 6.70 6.33 20.44 19.76 22.52 29.77 39.02 48.80 10.13
21 Add: Depreciation 6.45 5.61 4.89 4.28 3.75 3.29 2.90 2.56 2.27 2.01
22 Add: Interest on Term Loan 6.79 6.22 5.09 3.97 2.84 1.71 0.00 0.00 0.00 0.00
Total (A) 14.83 18.53 16.31 28.68 26.34 27.52 32.67 41.58 51.06 12.15
23 Interest on Term Loan 6.79 6.22 5.09 3.97 2.84 1.71 0.58 0.00 0.00 0.00
24 Repayment on Term Loan 0 9.40 9.40 9.40 9.40 9.40 9.55 0.00 0.00
Total (B) 6.79 15.62 14.49 13.37 12.24 11.11 10.13 0.00 0.00 0.00

Investment Opportunity Study 2020 Project Profile- Hydroponic Farming, Bhutan
Page | 176
Surplus (A) - (B) 8.05 2.91 1.82 15.31 14.11 16.41 22.54 41.58 51.06 12.15
DSCR (A/B) 2.19 1.19 1.13 2.15 2.15 2.48 3.23 0.00 0.00 0.00
Average DSCR 2.07
Table_ 19:Repayment of Interest on Term Loan
# Year Opening Balance Repayment Closing Balance Interest
1 1st year 56.55 0 56.55 6.79 6.79
2 2nd year
1st Qtr. 56.55 2.35 54.20 1.66
2nd Qtr. 54.20 2.35 51.85 1.59
3rd Qtr. 51.85 2.35 49.50 1.52
4th Qtr. 49.50 2.35 47.15 1.45 6.22
3 3rd year
1st Qtr. 47.15 2.35 44.80 1.38
2nd Qtr. 44.80 2.35 42.45 1.31
3rd Qtr. 42.45 2.35 40.10 1.24
4th Qtr. 40.10 2.35 37.75 1.17 5.09
4 4th year
1st Qtr. 37.75 2.35 35.40 1.10
2nd Qtr. 35.40 2.35 33.05 1.03
3rd Qtr. 33.05 2.35 30.70 0.96
4th Qtr. 30.70 2.35 28.35 0.89 3.97
5 5th year
1st Qtr. 28.35 2.35 26.00 0.82
2nd Qtr. 26.00 2.35 23.65 0.74
3rd Qtr. 23.65 2.35 21.30 0.67
4th Qtr. 21.30 2.35 18.95 0.60 2.84
6 6th year
1st Qtr. 18.95 2.35 16.60 0.53
2nd Qtr. 16.60 2.35 14.25 0.46
3rd Qtr. 14.25 2.35 11.90 0.39
4th Qtr. 11.90 2.35 9.55 0.32 1.71
7 7th year
1st Qtr. 9.55 2.35 7.20 0.25
2nd Qtr. 7.20 2.35 4.85 0.18
3rd Qtr. 4.85 2.35 2.50 0.11
4th Qtr. 2.50 2.50 0.00 0.04 0.58

Investment Opportunity Study 2020 Project Profile- Hydroponic Farming, Bhutan
Page | 177
Table_ 20:Break Even Point
# Particulars 1st Yr. 2nd Yr. 3rd Yr. 4th Yr. 5th Yr. 6th Yr. 7th Yr. 8th Yr. 9th Yr. 10th Yr.
1 Calculation of B.E.P.
Variable Cost 42.63 48.09 48.43 54.55 54.93 57.93 61.29 62.53 63.88 61.61
Fixed Cost 53.19 53.73 53.92 54.32 54.91 55.69 56.64 58.32 60.76 63.38
2 Break Even Point (B.E.P.) 0.96 0.84 0.84 0.64 0.65 0.63 0.57 0.51 0.46 0.80 Average B.E.P. 0.69
Table_ 21:Projected Balance Sheet
# Description Construction Period Operation Period in Years
0 1st Yr. 2nd Yr 3rd Yr 4th Yr 5th Yr 6th Yr 7th Yr 8th Yr 9th Yr 10th Yr
1 Liabilities
1.1 Equity 46.05 46.05 46.05 46.05 46.05 46.05 46.05 46.05 46.05 46.05 46.05
1.2 General reserves 0 1.60 8.30 14.62 35.06 54.82 77.34 107.12 146.14 194.94 205.07
1.3 Debt 56.55 56.55 47.15 37.75 28.35 18.95 9.55 0.00 0.00 0.00 0.00
1.4 Current Liabilities 0.00 0.46 0.51 0.50 0.50 0.50 0.50 0.50 0.50 0.50 0.50
1.5 Working Capital Loan 0.00 6.97 6.97 6.97 6.97 6.97 6.97 6.97 6.97 6.97 6.97
Total Liabilities 102.60 111.63 108.98 105.90 116.94 127.30 140.42 160.64 199.66 248.46 258.60
2 Assets
2.1 Gross Fixed Assets 64.36 64.36 64.36 64.36 64.36 64.36 64.36 64.36 64.36 64.36 64.36
2.2 Accumulated Depreciation 0 6.45 12.06 16.95 21.23 24.98 28.27 31.16 33.72 35.99 38.00
2.3 Net fixed assets
(2.01-2.02)
64.36 57.91 52.30 47.40 43.13 39.38 36.09 33.19 30.63 28.37 26.36
2.4 Preliminary Expenses 1.75 1.58 1.40 1.23 1.05 0.88 0.70 0.53 0.35 0.18 0.00
2.5 Pre-Operative Expenses 6.79 6.79 6.04 5.28 4.53 3.77 3.02 2.26 1.51 0.75 0.00
2.6 Current Assets 0.00 14.49 16.56 16.56 16.56 16.56 16.56 16.56 16.56 16.56 16.56
2.7 Profit & Loss Account 0.00 0.00 0 0 0 0 0 0 0 0 0
2.8 Cash & Bank Balance 29.70 30.87 32.69 35.43 51.68 66.71 84.06 108.10 150.61 202.61 215.68
Total Assets 102.60 111.63 108.98 105.90 116.94 127.30 140.42 160.64 199.66 248.46 258.60

Investment Opportunity Study 2020
Project Profile- Hydroponic Farming, Bhutan
Page | 178
Conclusion
Hydroponic farming can be a great way to grow sustainable organic food
economically. High demand for food production is growing. Meanwhile, the traditional
farming using soil system will not cover the world's growing demand for food.
Thus, horticulture crops production through Hydroponic is an opportunity to trap the
organic food market. The Financial Projections are positive during the first 10 years of
operation considered. This implies that the project generates sufficient funds to cover
its cost, including loan repayments and interest payments during the period. This also
indicates that the project can continue making profits even after 10 years.
Based on the estimation of project cost and financial analysis production through
Hydroponic technic is financially viable, profitable with high rate of return.
It is recommended to entrepreneurs to scale up at Industrial level.
Sources
# Internet References
1 https://www.industryarc.com/Report/15233/hydroponics-market.html
2 https://www.indiamart.com/proddetail/hydroponic-environment-control-indoor-vegetable-
machine-21325206912.html
3 https://www.alibaba.com/showroom/hydroponics-cooling-system.html
4 https://www.alibaba.com/showroom/hydroponics-cooling-system.html
5 https://www.google.com/search?q=horizontal+air+fan+for+hydroponic+farming+price&sxsrf
=ALeKk03InZyYSWcWHz_2gfJZqVommdeg7A:1594793139992&source=univ&tbm=shop&tbo
=u&sa=X&ved=2ahUKEwjhvOW0y87qAhWMxzgGHZNQBioQ1TV6BAgNEFM
6 https://www.sciencedirect.com/science/article/pii/S1877050918302473
7 https://www.explainthatstuff.com/hydroponics.html
8 https://biologicperformance.com/hydroponics/
9 https://www.agrifarming.in/hydroponic-farming-cost-and-profit-analysis
10 https://www.foodprocessing-technology.com/features/featurehydroponics-the-future-of-
farming-5901289/
11 https://www.kisancentral.com/hydroponic-farming-information-guide
12 https://www.thespruce.com/hydroponic-gardens-ebb-and-flow-systems-
1939219#:~:text=Ebb%20and%20Flow%2C%20also%20known,set%20up%2C%20and%20extre
mely%20versatile.&text=The%20system%20uses%20gravity%20to,the%20reservoir%20to%20
be%20reused.
13 https://www.greenandvibrant.com/nutrient-film-technique
14 https://www.kisancentral.com/hydroponic-farming-information-guide
15 https://www.marketsandmarkets.com/Market-Reports/hydroponic-market-94055021.html
Investment Opportunity Study 2020 Project Profile: High Tech Geophysical and Mining
Exploration Services, Bhutan
Page | 179
Project Title: High Tech Geophysical and Mining
Exploration Services, Bhutan
Investment Opportunity Study 2020 Project Profile: High Tech Geophysical and Mining
Exploration Services, Bhutan
Page | 180
1. High Tech Geophysical and Mining Exploration Services
Background of the Idea
Bhutan is a small landlocked country located between China and India. Industry, which
included the mineral industry, and services accounted for 43% and 31% of the
country’s gross domestic product (GDP), respectively. Mining of industrial minerals was
insignificant to Bhutan’s economy except for the production of ferrosilicon.
Out of the country’s total geographical area of 38,394 square kilometres, most of the
country’s areas have been geologically mapped. However, only about 6,500 square
kilometres have been geologically mapped in the scale of 1:50,000 systemically. In the
course of geological mapping, a host of metallic and industrial minerals have been
discovered.
The mineral industry of Bhutan was small in scale relative to its main economic sector
(agriculture and forestry), and was not a significant contributor to the country’s
economy. The country produced cement, coal, ferrosilicon (exported), iron ore, and
industrial minerals used for construction. Iron ore production increased by 448% to
20,505 MT from 3,741 T in 2012; limestone production by 49% to more than 1 million
MT from 677,128 T; dolomite production by 16% to 1.74 MT from about 1.5 MT; and
gypsum production by 12%. Production decreases were reported for talc (40%), coal
(21%), and stone (11%).
Rationale of Idea
Mining and quarrying have five divisions and 12 classes of which Bhutanese industries
have registered under four classes representing 11 economic activities with 163
establishments. Two establishments were registered in 1985, one for producing
dolomite powder and another was a Strone Crushing Unit. This Section had poor
performance until 2006 after which a few units were added each year. From 2017, there
has been an exponential growth resulting in 50% increase in establishments during the
last four years.

Investment Opportunity Study 2020 Project Profile: High Tech Geophysical and Mining
Exploration Services, Bhutan
Page | 181
Figure_ 1:Economic Activities and Growth Trend
Surface Collection of Stone and Boulders has about 55% of the establishments
followed by Mining of Quartzite (14.7%) and Stone quarry (12.9%). There is only one
unit of Coal Washery Plant and Marble block cutting and processing.
Geographically, Samtse dominates (25.6%) which has twice as much than the second
Dzongkhag, Chhukha (12.3%). Punakha, Gasa, Zhemgang and Lhuentse have no record
of these activities. P&M sector dominates this section almost wholly (95.7%) while the
remaining belongs to the service sector
Figure_ 2:Scale of industries and economic classification
Small and Medium scale account for the majority. However, Large and Cottage size is
also available. In terms of average investment, Large (Nu 218.7 million), Medium (Nu
34.5 million, Small (Nu 6.51 million) and Cottage (Nu 0.89 million). A gypsum mine with
investment of Nu. 900 million is the biggest industry in this section. Sole proprietorship
account for 65.6% while Company is 27.6%, Partnership is 5.5% and one establishment
each is recorded under Ministry (Manufacture of Briquette) and Others (Coal Extraction
by Samrang community).
0%
10%
20%
30%
40%
50%
60%
Section C: Economic Activities
0
20
40
60
80
100
120
140
160
180
0
5
10
15
20
25
30
198
519
87
198
919
91
199
319
95
199
719
99
20
01
20
03
20
05
20
07
20
09
20
112
013
20
152
017
20
19
Secion C: Growth Trend
0%
20%
40%
60%
80%
100%0
20
40
60
80
Cottage Small Medium Large
Section C: Scale of Industries
95.7%
4.3% 0.0%
Section C
Economic Classification
P&M
Services
Trade

Investment Opportunity Study 2020 Project Profile: High Tech Geophysical and Mining
Exploration Services, Bhutan
Page | 182
Figure_ 3:Geographic Distribution and New EA Growth
Cottage Scale Industries and P&M account for 79% of the ownership type and
economic classification of this section has is no trade. Almost 98% is run by Sole
Proprietors, but there are five incorporated companies as well. Mountain Hazelnut
Venture Private Limited is the largest established with an investment of Nu. 1,061
million; while the average investment of Large Companies is Nu 484 million, the small
and cottage requires Nu. 2.4 and 0.4 million respectively. The usual trend of Thromde
Dzongkhags having more industries is not seen here (35%) and even those
Dzongkhags that rank poorly overall are on the Top 10 List (Trashigang, Tsirang and
Dagana).
Market Outlook International
The Global Geophysical Services Market is forecast to grow to $16.2 billion by 2024,
on account of increasing investments in mining and oil & gas exploration activities.
Moreover, the demand for geophysical services for mineral extraction is expected to
increase on account of the environmental regulations imposed by governments of
several countries.
High demand for geophysical data acquisition services and increase in investments in
the mining sector for geophysics are anticipated to propel the geophysical services
market during the forecast period. Additionally, revival in crude oil prices would further
fuel the growth of the Global Geophysical Services Market over the next five years.
The Global Geophysical Services Market is segmented based on technology, type,
services, end-user, region and company. Based on technology, the market can be
segmented into Seismic, Magnetic, Gravity, Electromagnetics, LIDAR, Ground
Penetrating and Others.
The Seismic technology segment is projected to register the highest CAGR during
forecast period owing to its widespread use in mining industry. Seismic services help
0%
5%
10%
15%
20%
25%
30%
Section C: Geographic Distribution
0
1
2
3
4
5
6
Section C: New EA Growth

Investment Opportunity Study 2020 Project Profile: High Tech Geophysical and Mining
Exploration Services, Bhutan
Page | 183
the mining companies to make critical exploration and reservoir decisions. Based on
type, the market can be bifurcated into Aerial Based Survey and Land Based Survey.
The land-based surveys are expected to dominate the market during forecast period
attributable to the increase in demand for seismic surveys in the mining industry.
The Concept
High Tech Geophysical and Mining Exploration Services includes appropriate solutions
to users by defining the suitable investigation method, counseling the suitable
equipment, catering the high-quality scientific equipment & swift technical services to
fulfill the data analysis and requirement.
This service industry serves high tech solution to academic Institutions, Prime Research
Organizations, Government Departments, Private Organizations and Individual players
in Geophysical and Geo technical segment starting from basic user to progressing
researcher in global arena.
The high tech geophysical and mining exploration services needs highly skilled and
trained engineers, civil engineers, geo physic experts, experts in geology, mineral
exploration, software experts, equipment operators etc. Some of the equipment as
topographic, drone, high resolution cameras, and computers can be purchased but
high-tech sensors and radars can be arranged out sourced. Purchasing of all the
equipment needs heavy cost.
Around 1,200 sq. ft. office area is sufficient to operate such type of high skilled service
units. It requires a minimum of four-room office like Instrument store room, Software
and Data Handling, Engineers and Staff Room including Conference table and seating
room.
ISO 9001:2015 is the required certificate to manage the operation and services as such
drone and specific air survey needs legal permission as per government norms.
This business idea is under service sector which needs less capital investment and
higher recurring expenses as salaries, fringe benefits, instrument hiring fees, software
licensing etc.
Under the Bhutanese scenario, High Tech Geophysical and Mining Exploration Services
provider is needed for some Thimphu based companies and some companies like
APECS Consultancy, Bhutan Consultants & Research and Geo-Info Associates &
Surveying Consultancy are providing services in Topography survey but their work
domain is limited. Thus, opportunities are available and Department of Geology and
Mines avails maximum services in this sector.

Investment Opportunity Study 2020 Project Profile: High Tech Geophysical and Mining
Exploration Services, Bhutan
Page | 184
Minerals and Mines
1.5.1. Overview of the mining sector in Bhutan
There are three categories of mineral resources: proved, probable and possible. Proved
are economically mineable with high degree of certainty (high confidence level).
Probable are economically mineable with lower level of confidence than proved
reserves. Possible minerals are part of a mineral resource for which grade and mineral
content are estimated with a low level of confidence.
Metallic reserves particularly copper, iron ore and tungsten are probable reserve, while
lead-zinc reserve constitutes 86% as proven reserve. Non-metallic reserve such as Talc
(100%), Dolomite (99.68%) and coal (78.68%) are possible reserve. Quartzite and
gypsum are proven reserve with 100% and 85% respectively.
In terms of overall reserve, the country has 1.04 million MT of coal, 14,542.47 million
MT of dolomite, graphite ore 48.75 million MT, gypsum 134.22 million MT, limestone
164.65 million MT and quartzite 5.18 million MT. Non-metallic mineral such as copper
has a reserve of 2.04 million MT, lead-zinc 3.30 million MT, iron-ore 2.69 million MT
and tungsten 3.87 million MT.
Figure_ 4: Mineral Reserve in Bhutan (million MT)
1.5.2. Mining and GDP
Although, the growth rate has experienced spikes and falls over the years from 42.4% in 2012 to 7.7%
in 2017, its share in both absolute numbers as well as to the GDP has increased from 1,941 million in
2011 to 8,137 million in 2018 comprising 2.3% to 4.9% respectively.
0
20
40
60
80
100
120
140
160
180
Copper Lead-Zinc Iron Ore Tungsten Coal GraphiteOre
Gypsum Limestone Quartzite Talc
Probable Proven Possible

Investment Opportunity Study 2020 Project Profile: High Tech Geophysical and Mining
Exploration Services, Bhutan
Page | 185
Figure_ 5:Mining and Quarrying Sector's GDP Contribution
1.5.3. Mining Operations
In terms of quantity, Pema Gatshel has the maximum expected extraction quantity
(Limestone and Gypsum). In terms of particular minerals, dolomite extraction is only
from Samtse while granite is only from Wangdue, and similarly coal from Samdrup
Jongkhar. Figure_ 6:Mining companies in Bhutan and expected production from mines
0%
5%
10%
15%
20%
25%
30%
35%
40%
45%
50%
0
20,000
40,000
60,000
80,000
100,000
120,000
140,000
160,000
180,000
2011 2012 2013 2014 2015 2016 2017 2018
Mil
lion
Ng
ult
rum
s
GDP Mining & Quarrying % Share % Growth
0
1
2
3
4
5
6
7
8
Mining Companies in Bhutan (2020 May)
0 2.5 5 7.5 10 12.5 15 17.5 20 22.5 25
Chukha
Dagana
Pema Gatshel
Samtse
S/Jongkhar
Thimphu
Wangdue
Expected Production from Mines currently under Operation (Million MT)
Coal Dolomite Granite Gypsum Iron Ore
Limestone Marble Quartzite Talc

Investment Opportunity Study 2020 Project Profile: High Tech Geophysical and Mining
Exploration Services, Bhutan
Page | 186
1.5.4. Utilization of Minerals
Mineral extraction rate is relatively low given the terrain and
the lack of determination of proven minerals with volumes
decreasing. For example, Coal and Talc deposits as recorded
by 2018 was zero. The two least extracted minerals are
Limestone and Dolomite with annual extraction rate of
0.57% and 0.014% respectively. However, apart from this
database, other specific minerals such as Phyllite are also
being extracted. Table_ 1:Utilization of Minerals
Mineral Reserve (2010) Utilization (Till 2018) Balance Average %
Coal 1.04 1.04 0 11%
Limestone 164.65 8.52 156.13 0.575%
Gypsum 5.18 0.87 4.31 1.866%
Talc 0.13 0.13 0 13.675%
Iron Ore 2.69 0.18 2.51 1.115%
Dolomite 14542.47 17.96 14524.51 0.014%
Figure_ 7:Utilization of explored minerals and mineral production by type
Quartzite and Granite are least exported minerals, whereas all others are mostly
exported (over 60-80%).
Figure_ 8:Percentage of Export of Minerals
0%
5%
10%
15%0.1
10
1000
100000
in M
illio
n M
T (L
og
)
Utilization of Explored Minerals in Bhutan
Reserve (2010)
Utilization (Till 2018)
0.00 5.00 10.00 15.00
Dolomite
Gypsum
Marble
Quartzite
Granite
Calc Tufa
Mineral Production by Type, Bhutan, (2014-2018) in Million MT
2014 2015 2016 2017 2018
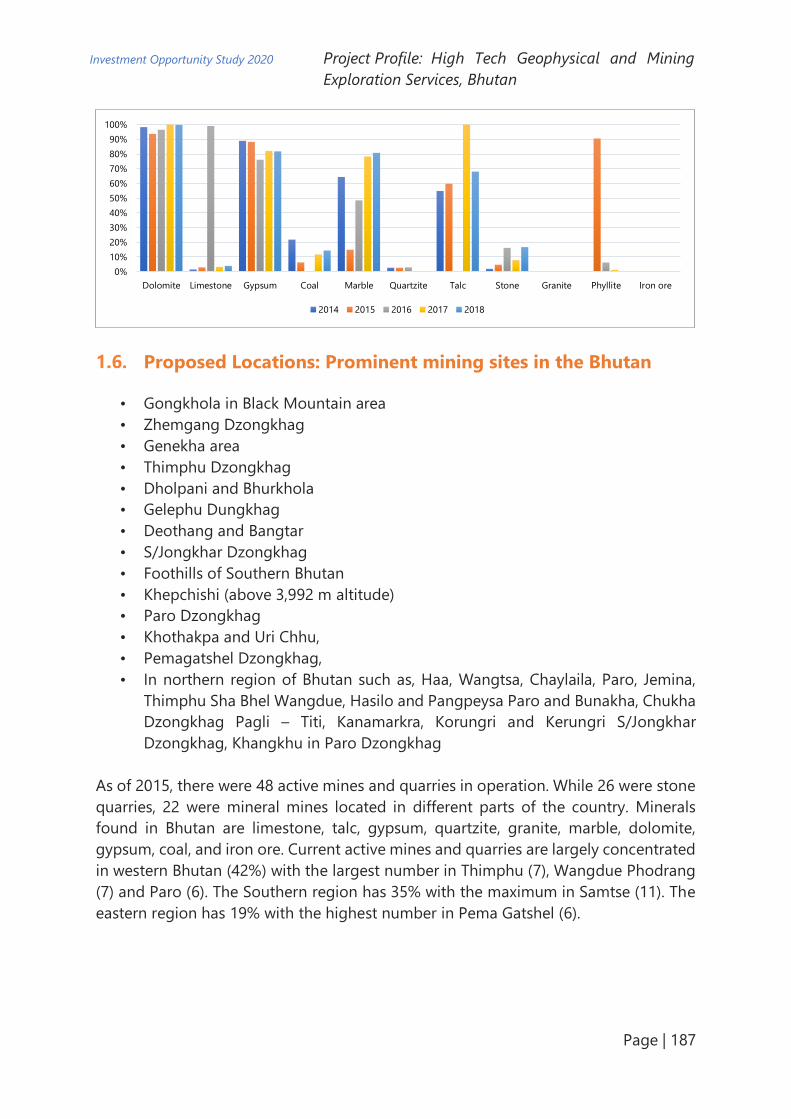
Investment Opportunity Study 2020 Project Profile: High Tech Geophysical and Mining
Exploration Services, Bhutan
Page | 187
Proposed Locations: Prominent mining sites in the Bhutan
• Gongkhola in Black Mountain area
• Zhemgang Dzongkhag
• Genekha area
• Thimphu Dzongkhag
• Dholpani and Bhurkhola
• Gelephu Dungkhag
• Deothang and Bangtar
• S/Jongkhar Dzongkhag
• Foothills of Southern Bhutan
• Khepchishi (above 3,992 m altitude)
• Paro Dzongkhag
• Khothakpa and Uri Chhu,
• Pemagatshel Dzongkhag,
• In northern region of Bhutan such as, Haa, Wangtsa, Chaylaila, Paro, Jemina,
Thimphu Sha Bhel Wangdue, Hasilo and Pangpeysa Paro and Bunakha, Chukha
Dzongkhag Pagli – Titi, Kanamarkra, Korungri and Kerungri S/Jongkhar
Dzongkhag, Khangkhu in Paro Dzongkhag
As of 2015, there were 48 active mines and quarries in operation. While 26 were stone
quarries, 22 were mineral mines located in different parts of the country. Minerals
found in Bhutan are limestone, talc, gypsum, quartzite, granite, marble, dolomite,
gypsum, coal, and iron ore. Current active mines and quarries are largely concentrated
in western Bhutan (42%) with the largest number in Thimphu (7), Wangdue Phodrang
(7) and Paro (6). The Southern region has 35% with the maximum in Samtse (11). The
eastern region has 19% with the highest number in Pema Gatshel (6).
0%
10%
20%
30%
40%
50%
60%
70%
80%
90%
100%
Dolomite Limestone Gypsum Coal Marble Quartzite Talc Stone Granite Phyllite Iron ore
2014 2015 2016 2017 2018

Investment Opportunity Study 2020 Project Profile: High Tech Geophysical and Mining
Exploration Services, Bhutan
Page | 188
Status of Mineral Resources in the Country
Table_ 2:Status of Mineral Resources in the Country
# Mineral Location Reserve (in MT) & Grades
1. Copper Ore Gongkhola in Black Mountain
area, Zhemgang Dzongkhag
2.5 inferred, with 1.5% Cu
2. Lead-Zinc
Ore
In Genekha area, Thimphu
Dzongkhag
3.116 in Chakula – Proved
0.514 in Romegong Ri – Probable
3. Tungsten
Ore
Dholpani and Bhurkhola
Gelephu Dungkhag
0.45 estimated down to 30 m depth
in Dholpani .
4. Coal Deothang and Bangtar,
S/Jongkhar Dzongkhag
Reserve very tentative
5. Dolomite All along the foothill of
Southern Bhutan.
Very huge reserve. Proved reserve
will be rendered by DGM as and
when required
6. Graphite Khepchishi (above 3992 m
altitude) Paro, Dzongkhag
23.53 proved by drilling.
7. Gypsum Khothakpa and Uri Chu,
Pemagatshel Dzongkhag
56.45 proved (in Khothakpa);
13.60 estimated (in Uri Chu and
Khar). Remaining reserve much less,
mining going on
8. Limestone Pagli – Titi , Gholtey area,
Gelephu Dungkhag,
Kanamakra, Gelephu
Dungkhag, Korungri and
Kerungri, S/Jongkhar
Dzongkhag
Reserve almost exhausted by PCAL
Reserve being assessed
Huge Reserve of high-grade
Limestone Huge reserve of cement
grade limestone
9. Marble Khanku (Paro Dzongkhag)
In northern region of Bhutan
such as, Haa Wangtsa,
Chaylaila, Paro, Jemina
Thimphu Sha Bhel
Wangdiphodrang, Hasilo and
Pangpeysa Paro and Bunakha,
Chukha Dzongkhag
12.44 proved. 29.59 Probable.
Reserve not proven
10. Slate Bhel (Bonsegeoma) and Kobja
areas both in
Wangduephodrang
Dzongkhag
16 million cubic meters.
A large portion is already extracted
for roofing purposes in Bhutan
11. Talc All in foothill belts in SW
Bhutan
Reserve not assessed properly,
because the deposit is very erratic
and patchy in nature
12. Ferrosilicon
Grade
Quartzite
Quartzite in Shumar
Formation
Reserve not assessed systematically

Investment Opportunity Study 2020 Project Profile: High Tech Geophysical and Mining
Exploration Services, Bhutan
Page | 189
The mining sector has long been an important catalyst to the economic growth of the
country in terms of revenue and employment generation. A host of minerals have been
mined in the country till date. Major minerals currently mined are dolomite, limestone,
gypsum, marble, coal, talc, quartzite and various types of construction stones. All the
mines in the country are operated using opencast mining technique and the current
land coverage by mining activities is 0.033 % of the total area of the country.
Geophysical Methods
Geophysical methods are based on the study of different physical fields being
propagated through the earth's interior. The most important geophysical fields are
gravity, magnetic, electromagnetic, and seismic wave fields. The observed values of
these fields depend, first, on the physical properties of rocks.
Gravity and magnetic geophysical methods are passive. They rely on no controlled
sources but seek out naturally occurring variations in the earth’s gravity and magnetic
fields.
Metamorphosed, igneous and poly deformed rocks, which are common subjects of
mineral exploration, can be far more complicated than the stratified rocks examined
in the search for oil and gas. Hard-rock geology presents an explorer with a mind-
boggling array of lithologic, metamorphic and structural features, which can host an
equally mind-boggling variety of mineral deposits and generate very complex patterns
of geophysical anomalies. Each locality and each deposit are different from another,
necessitating detailed field mapping and varied geophysical surveys.
Figure_ 9:Gravity and Magnetic Geophysical Method

Investment Opportunity Study 2020 Project Profile: High Tech Geophysical and Mining
Exploration Services, Bhutan
Page | 190
1.8.1. Seismic Methods
These are designed mainly for stratified rocks with relatively uncomplicated structures.
Mineral explorers rely on a wide range of geophysical techniques including magnetic,
gravity, electrical, electromagnetic and radiometric, and above all on strong knowledge
of hard-rock geology and on results of local field mapping and exploration drilling.
Reflection seismic surveys indicate changes in the acoustic impedance of rocks,
especially where these changes occur across relatively flat-lying boundaries. Lateral
variations in rock density give rise to gravity anomalies, and lateral variations in rock
magnetization produce magnetic anomalies. Contrary to an occasional misconception,
density and magnetization are rock properties quite independent of one another.
Vertical changes in rock magnetization and density in a perfectly flat and layered earth
would yield no magnetic or gravity anomalies, but these geophysical methods reveal
lateral variations and high-angle discontinuities.
Survey and data-gridding parameters are chosen to resolve all expected useful
anomaly wavelengths from the source under investigation, at minimal cost. At a
relatively low cost compared to seismic surveys, gravity and magnetic techniques can
provide geophysical coverage of large and small areas. Figure_ 10:Seismic Method
Investment Opportunity Study 2020 Project Profile: High Tech Geophysical and Mining
Exploration Services, Bhutan
Page | 191
Advanced Airborne Gravity Gradiometer Technology for
Mineral Exploration
Exploration for mineral bodies is time-consuming and expensive, making an
unsuccessful attempt extremely costly. The advanced gradiometer, operated from an
aircraft, incorporates technology to measure subtle changes in the Earth’s gravity field
and uses the data to produce a density map which can be used to identify ore bodies,
which are otherwise hard to detect.
3D imaging technologies have transformed the exploration of large mines and
continue to hold promise with a number of emerging technologies. Seismic surveys
for studying the geology of potential mining areas are not new but applications of 3D
imaging technologies have improved the efficacy of these studies greatly.
A new technology that has emerged in three-dimensional imaging is 3D laser
scanning, which helps to capture spatial data using laser light and enables geologists
to build 3D geological maps combining the surface mapping data.
3D laser scanning is a relatively new technology for the mining industry despite its
application for many years in other fields such as civil engineering, architectural design
and forensic investigation. In mining the technology has found uses in the hands of
rock engineers, ventilation engineers, safety officers as well as those surveying in
dangerous or inaccessible mining environments.
3D imaging technologies in a camera that can be used in open pit and underground
mining areas to capture three-dimensional images of the environment and
topography, eliminating the need for geologists, engineers and surveyors to physically
visit the mine. The technology enables design and analysis to be conducted from a
remote environment while also not disrupting the production while capturing the
imagery.
Analysis of the captured data will further help in exploration, mine scheduling,
planning and targeting of drill holes, and so on. Some 3D visualization and analysis
software solutions available in the market include CAE SirovisionTM, Maptek’s Vulcan,
ARANZ Geo’s Leapfrog Geo and Leapfrog Mining, Dassault System’s GEOVIA, and
Avizo Fire.

Investment Opportunity Study 2020 Project Profile: High Tech Geophysical and Mining
Exploration Services, Bhutan
Page | 192
Figure_ 11:Advanced airborne gravity gradiometer
Mining industry’s latest technological innovations
Some of latest technology innovations in mining industry are as follows:
1.10.1. Spatial Data Visualization
Mining is experiencing an exciting shift, thanks to spatial (or geospatial) data. Spatial
data is becoming more detailed and clearer than ever: Three-dimensional (3D)
Modelling creates a viewable, life-like impression with depth perception that allows
the human brain to understand and relate to complex interrelated issues. 3D modelling
supports firms by reimagining the mine more efficiently.
Virtual Reality (VR) is an artificially-created software environment that uses real-life
data. The virtual environment immerses people into a user-created 3-D environment.
VR presents an enhanced impression to help miners experience what it’s like working
in a mine or planning a new mine without being out in the field.
Augmented Reality (AR) overlays a digital visualization onto a real-world environment.
AR accomplishes this by enhancing the user’s visual field with computer-generated
inputs such as sound, video, applications, and graphics. Miners use augmented reality
to train using virtual simulators, which also helps the industry reduce equipment
maintenance costs.
By using new technology like spatial data effectively, the mining industry gains insights
into mine systems at a reduced cost and impact on the environment. The mining
industry is steadily moving toward a future where it’s possible to virtually construct
and deconstruct buildings, plants, mines, and all associated infrastructure before even
breaking ground to create a truly intelligent mine.

Investment Opportunity Study 2020 Project Profile: High Tech Geophysical and Mining
Exploration Services, Bhutan
Page | 193
1.10.2. Geographic Information Systems
Geographic information systems (GIS) are an integral tool that allows a deeper look at
how geographic relationships influence the world around us. With the help of GIS,
miners are able to solve real-life issues where location and accessibility are critical.
Geospatial data represents an object’s location, size, and shape. By visualizing this kind
of data, miners gain more insight into the represented system or mine environment.
GIS is used to gain insight into the following:
• Mineral exploration
• Geochemical and hydrology data
• Report generation
• Facility and tailings management
• Sustainability and regulatory compliance
Geospatial data software allows to train mine managers and employees in new ways,
and improve long-term understanding of mining with virtual interpretations of real-
life environments.
1.10.3. Artificial intelligence
Artificial intelligence (AI) now leads the decision-making at insight-driven firms. They
use smart data and machine learning to improve operational efficiency, mine safety,
and production workflow. Implementing artificial intelligence technology generates
day-to-day data in half the time than what has been used previously in the field.
The mining industry evolves rapidly, so machine learning and AI impact the way mines
today make choices for the future.
Here are some ways the latest technology in artificial intelligence impacts the working
mine:
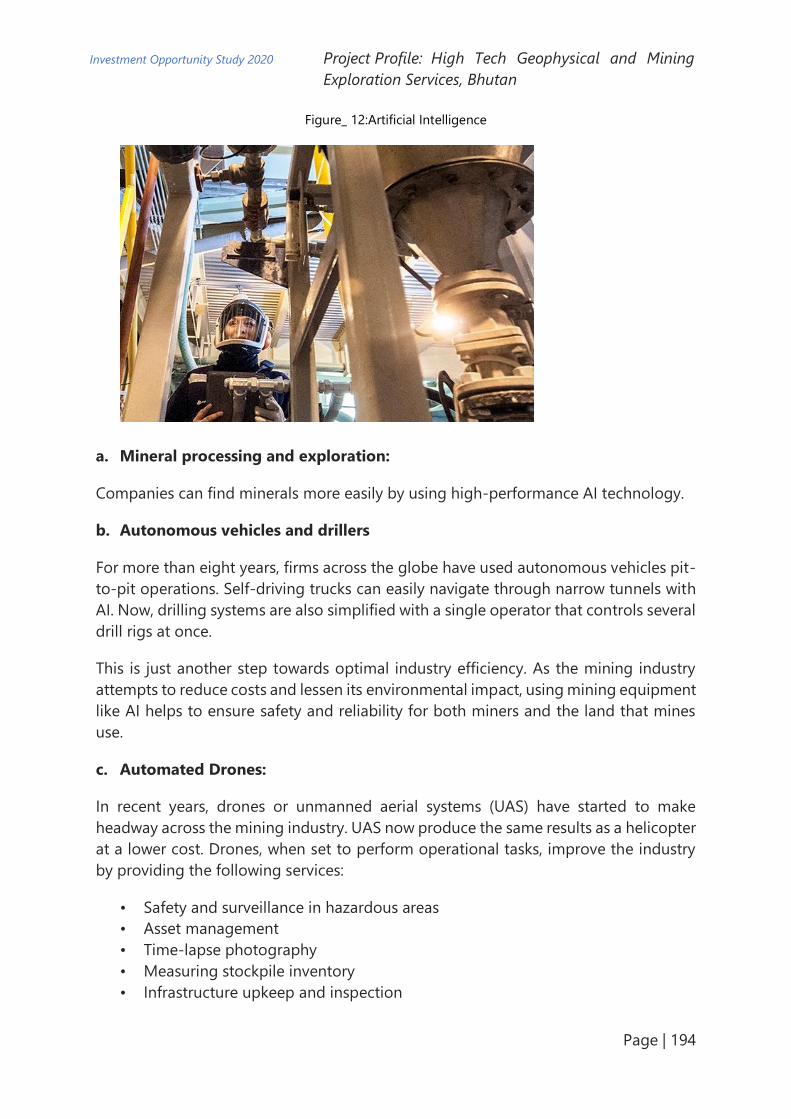
Investment Opportunity Study 2020 Project Profile: High Tech Geophysical and Mining
Exploration Services, Bhutan
Page | 194
Figure_ 12:Artificial Intelligence
a. Mineral processing and exploration:
Companies can find minerals more easily by using high-performance AI technology.
b. Autonomous vehicles and drillers
For more than eight years, firms across the globe have used autonomous vehicles pit-
to-pit operations. Self-driving trucks can easily navigate through narrow tunnels with
AI. Now, drilling systems are also simplified with a single operator that controls several
drill rigs at once.
This is just another step towards optimal industry efficiency. As the mining industry
attempts to reduce costs and lessen its environmental impact, using mining equipment
like AI helps to ensure safety and reliability for both miners and the land that mines
use.
c. Automated Drones:
In recent years, drones or unmanned aerial systems (UAS) have started to make
headway across the mining industry. UAS now produce the same results as a helicopter
at a lower cost. Drones, when set to perform operational tasks, improve the industry
by providing the following services:
• Safety and surveillance in hazardous areas
• Asset management
• Time-lapse photography
• Measuring stockpile inventory
• Infrastructure upkeep and inspection

Investment Opportunity Study 2020 Project Profile: High Tech Geophysical and Mining
Exploration Services, Bhutan
Page | 195
• Site mapping
Figure_ 13:Automated Drones can be used in Tough Terrain
Equipment required for Geophysical and Mining Exploration
Services
There are various techniques or types of deploying Geophysical and Mining
Exploration. The most important geophysical fields are gravity, magnetic,
electromagnetic, and seismic wave fields.
Some of the required equipment’s are as below:
• 24-Channel Seismograph - 24 Bit
• Ground Penetrating Radar GPR up to 120meter Depth
• Advanced Resistivity Meter (2D ERT Function)
• MASW / 48 Channel Seismograph
• Portable Borehole Camera
• Geophone with 2 HZ, 2.5 HZ, 4 HZ, 10 HZ, 28 HZ, 40HZ, 60HZ, 100HZ
• Advanced Airborne Systems
• DJI Mavic Air/Mavic Air Fly More Combo drone 4K 100Mbps Video 3-Axis
Gimbal Camera with 4KM Remote Control Foldable RC Quadcopter
• GIS Software
• Other accessories and equipment
Cost Estimation in Geophysical and Mining Exploration Services
The total cost of the project has been considered as Nu. 17.2 million. The Break-Even
Months are 23. D.S.C.R value is 4.55 which show that the project will generate sufficient
to pay loans.
Other details are as follows:

Investment Opportunity Study 2020 Project Profile: High Tech Geophysical and Mining
Exploration Services, Bhutan
Page | 196
Table_ 3:Estimated Project Cost and Financials
# Description Amount (Nu. In Lacs)
1. Establishment Cost 172.32
2. Cost of Operation
2.1 Fixed Cost @100% Capacity 47.81
a. Salary & Wages 33.60
b. Overhead Cost 14.21
3. Variable Costs 4.94
a. Raw Material 2.40
b. Other Variable Cost 2.54
4. Break Even Point 37.53%
5. Payback Period 23 Months
6. D.S.C.R. 4.55
7. Return on Investment 53.11%
8. NPR 55.47%
Other Requirements
• Land: About 1,200 m2
• Manpower of 11 people which includes:
✓ Head Consultant – Geotechnical Projects
✓ Geoscientist
✓ Survey Manager
✓ Surveyor
✓ System Analyst
✓ Data Compiler and Documentation
✓ Reception
✓ Office Assistant
✓ Driver
1.12.1. Project Cost
The cost of project is estimated to be a total value of plant and machinery, MFA,
preliminary expenses, pre-operative expenses and contingency. The required land is
around 1,200 m2 to be on lease. Equipment cost is about 79.35% of the total project
cost. Margin Money for working capital is not considered as part of project cost as per
fiscal loan pattern in Bhutan.
The summary of the project cost is as follows:

Investment Opportunity Study 2020 Project Profile: High Tech Geophysical and Mining
Exploration Services, Bhutan
Page | 197
Table_ 4:Head Wise Project Cost and Sharing Percentage
# Particulars Value (Nu. in Lacs) Cost Sharing
1. Land 1200 sq. meters On Lease
2. Building & Civil Construction On Lease
3. Plant & Machinery 136.74 79.35%
4. Misc. Fixed Assets 17.44 10.12%
5. Preliminary Expenses 1.00 0.58%
6. Pre-operative Expenses 12.51 7.26%
7. Contingencies 3% 4.63 2.68%
Total 102.60 100%
Means of Finance
Table_ 5:Means of Finance
# Particulars Value (Nu. in Lacs)
1. Promoters Equity 54.94
2. Term Loan from Bank 117.38
Total Term Loan 172.32
3. Margin Money for Working Capital 6.35
4. Working Capital Loan from Bank 12.11
Total Working Capital Loan 18.46
Table 5:
1.13.1. Equipment Cost
The cost estimates for equipment have been worked out based on the cost figures
received from the Indian equipment suppliers. The prices are considered without
Indian GST tax as it is exempted under supply of trade agreement between India and
Bhutan (Category Export). Installation and commissioning of equipment are
considered separately in the total equipment cost estimation. Freight and insurance
have been considered with the assumption that all goods are transported by road.
Goods of imported origin would be handled at the Kolkata port. The equipment list
with cost is given in table below:
Table_ 6:Plant & Machinery with Cost
# Equipment’s Qty. Rate Amount
(Nu. in Lacs)
1. 24-Channel Seismograph - 24 Bit 1 690000 6.90
2. Ground Penetrating Radar GPR up to
120meter Depth
1 4870000 48.70
3. Advanced Resistivity Meter (2D ERT
Function)
1 2500000 25.00
4. MASW / 48 Channel Seismograph 1 2500000 25.00
5. Portable Borehole Camera 1 460000 4.60

Investment Opportunity Study 2020 Project Profile: High Tech Geophysical and Mining
Exploration Services, Bhutan
Page | 198
6. Geophone with 2 HZ 2.5 HZ 4 HZ and 10
HZ, 28 HZ, 40HZ, 60HZ, 100HZ
4 120000 1.20
7. Advanced Airborne Systems 2 770000 7.70
8. DJI Mavic Air/Mavic Air Fly More Combo
drone 4K 100Mbps Video 3-Axis Gimbal
Camera with 4KM Remote Control
Foldable RC Quadcopter
2 210000 2.10
9. GIS Software 1 100000 1.00
10. Other accessories and equipment's 1 500000 5.00
Total 127.20
11. Packaging and Forwarding @7.5% 9.54
Grand Total 136.74
1.13.2. Misc. Fixed Assets
A miscellaneous fixed asset includes office equipment & furniture, computer and
peripherals, firefighting equipment, vehicle etc. Nu. 1.7 million has been estimated
under this head “MFA” and presented in the table given on next page: Table_ 7:Misc. Fixed Assets Cost Estimation
# Particulars Qty. Amount (Nu.in lacs)
1. Office Equipment, Laptop, Printer & Software’s 1 5.00
2. Furniture & Fixture with Interior Items 1 3.50
3. Fire Fighting Equipment's 1 0.60
4. CCTV Surveillance System 4 0.34
5. Van – Vehicle 1 8.00
Total 17.44
1.13.3. Preliminary Expenses
Preliminary expenses are those that are incurred before the incorporation and
commencement of business. These are treated as deferred revenue expenditure. These
expenses are marked to be written off in the next ten years in profitability estimation. Table_ 8:Preliminary Expenses
# Particular Amount
(Nu.in Lacs)
1. Company formation expenses (ROC) and setup cost 1.00
Total 1.00
1.13.4. Pre-operative Expenses
These expenses are incurred prior to commencement of commercial production. A
total of Nu. 1.3 million is estimated under this cost to be written off in the next 10
years. It is considered as exempted in the first year.
The details are given in the table below:

Investment Opportunity Study 2020 Project Profile: High Tech Geophysical and Mining
Exploration Services, Bhutan
Page | 199
Table_ 9:Pre- operative Expenses
# Particular Amount (Nu.in Lacs)
1. Interest up to exploration 1.90
2. Electricity charges construction period 0.50
3. Marketing launch expenses 1.00
4. Project consultancy fees @5% of project cost 7.71
5. Travelling Expenses for Project Implementation 1.00
6. Registration of Trade Mark and patent 0.40
Total 12.51
1.13.5. Cost of Office Consumables
This is a service segment business opportunity and the the main office consumables are stationery, paper rim, cartage refilling items etc. The annual consumables cost is based on the present average market prices in Bhutan. A total of Nu. 240,000 has been estimated under this head. The details are given in the table below:
Table_ 10:Cost of Raw Material
# Consumables Total AmountPer Annum (Nu.in Lacs)
1. Stationery Items, Paper Rim, Cartage refilling,
House Keeping Items and Misc.
2.40
Total 2.40
1.13.6. Salary & Wages
Salaries and wages (including benefits) for different categories of employees have
been considered based on present day expenses. The salaries are considered as per
the present trends in the relevant segment and rules as per Pay Revision Act 2019 (9
July 2019) Bhutan. The fringe benefits are considered at 15% per year. It is also
considered that salary will increase 5% annually.
The breakdown of manpower with estimated salaries is given in the following table:
Table_ 11:Salary & Wages
# Description Intake Salary Per
Month (Nu.)
Salary Per
Annum (Nu. In Lacs)
1. Head Consultant – Geotechnical Projects 1 70000 8.40
2. Geoscientist 1 40000 4.80
3. Survey Manager 1 30000 3.60
4. Surveyor 3 20000 7.20
5. System Analyst 1 20000 2.40
6. Data Compiler and Documentation 1 20000 2.40

Investment Opportunity Study 2020 Project Profile: High Tech Geophysical and Mining
Exploration Services, Bhutan
Page | 200
7. Reception 1 15000 1.80
8. Office Assistant 1 10000 1.20
9. Driver 1 15000 1.80
Total (A+B+C) 11 33.60
1.13.7. Electrical and Water Consumption Charges
Electricity charges are considered as per the tariff rate issued by Bhutan Power
Corporation. The unit cost of electricity has been considered @ Nu. 3/Kwh for
operating of machines and plant operation. It is assumed that the entire power
requirement is met from the grid. The expense on water supply, treatment and
distribution has been suitably considered based on the Thimphu City Corporation
water tariff on a lumpsum basis. It is assumed that power and water charges will
increase @5% every year. Table_ 12:Electrical and Water Consumption Charges
# Description Amount
Per Annum (Nu.in Lacs)
1 Power Consumption Charges 2.40
2 Water Consumption Charges 0.48
Total 2.88
Source: Available on the link of https://www.bpc.bt/electricity-tariff/.
The details of electrical installations for power distribution have been considered
commensurate with power load and process control requirements.
1.13.8. Term Loan Estimation
The term loan requirement is estimated on the funding pattern in Bhutan. It is
estimated as per the norms by Bhutan National Bank Limited. The term loan is
considered as up to 60% to 75% of the project cost and it does not include working
capital margin money (as per financing pattern by Bhutan National Bank Limited). The
estimated term loan is Nu.11.7 million of which 68% will come as loan from financial
institution. The rest of the capital investment (Nu. 5.5 million consisting 32%) will be
managed by entrepreneurs on their own.
The details are as follows: Table_ 13:Term Loan Estimation
# Particulars Margin
%
Amount (Nu.in Lacs)
Own Contribution (Nu. in Lacs)
Bank Loan (Nu.in Lacs)
1. Land 50% 0.00 0.00 0.00
2. Building & Civil Construction 10% 0.00 0.00 0.00
3. Plant & Machinery 25% 136.74 34.19 102.56
4. Misc. Fixed Assets 15% 17.44 2.62 14.82
5. Preliminary Expenses 100% 1.00 1.00 0.00
6. Pre-operative Expenses 100% 12.51 12.51 0.00
7. Contingencies 100% 4.63 4.63 0.00

Investment Opportunity Study 2020 Project Profile: High Tech Geophysical and Mining
Exploration Services, Bhutan
Page | 201
Total 172.32 54.94 117.38
Sharing %
32% 68%
8 Margin Money for Working
Capital
100% 6.35 6.35 0.00
1.13.9. Working Capital Loan Amount
Working capital loan up to 75% of the total working capital gap is considered in
Bhutan. The total estimated working capital loan requirement is Nu.1.2 million and
Margin money is estimated as Nu. 635,000.
Working capital requirements have been worked out in the following table: Table_ 14:Working Capital Loan Amount
# Particulars Period Margin
%
Amount (Nu.in Lacs)
Own Contribution (Nu. in Lacs)
Bank Loan (Nu.in Lacs)
1. Office Consumables 15 days 50% 0.07 0.03 0.03
2. Receivable 30 days 25% 15.75 3.94 11.81
3. Cash for Expenses &
Consumables
15days 90% 2.64 2.37 0.26
Net Working Capital Requirement 18.46 6.35 12.11
The Interest Rate for term loan and working capital loan is referenced from the rate of
BNB, Bhutan, available on https://www.bnb.bt/wp-
content/uploads/dld/DOCUMENTS/interest-rates.pdf (Industrial Loan capital/Term
loan Interest rate 12% (fixed rate), working capital loan 13% (fixed rate).
1.13.10. Sales Realization / Estimated turnover
Sales realization or estimated turnover is based on various geophysical surveys and
mining exploration. The sale price of products is determined as cost competitive with
presently available similar product whether supply is from domestic market or
international. The total of Nu. 27 million is estimated sales realization at 100% service
capacity.
The details are as follows: Table_ 15:Sales Realization/Estimated turnover
# Product Work per
month
Annual Minimum
Revenue
Per Work
(Nu.)
Total
Amount
Per Annum
(Nu in Lacs)
1 Various Geophysical
surveys and Mining
Exploration as required
15 180 150000 270
Total 270.00

Investment Opportunity Study 2020 Project Profile: High Tech Geophysical and Mining
Exploration Services, Bhutan
Page | 202
1.13.11. Estimated Cost of Production and Profitability
The profitability projection has been worked out for 10 years at 70% capacity utilisation
to be achieved during the first year, 70% in the second year and 80% from fourth to
6th year, and 90% from 7 years onwards. Following assumptions and basis relevant
and applicable to Bhutan have been considered while preparing the profitability.
Repairs & maintenance have been taken at @1% per annum on plant & machinery &
misc. fixed assets.
Some of the Assumptions are as follows:
Repairs & maintenance have been taken as @ 2% per annum on equipment &
misc. fixed assets.
Bank interest rate has been calculated @12% per annum on term loan & @ 13%
working capital loan.
Insurance charges @ 0.25% on all assets in first year, then decreases @5% every
year.
Power & water charges are increased @ 5% every year.
Administrative expenses have been increased @ 5% every year.
Margin money has been considered @ 40% on building, @ 25% on plant &
machinery and @25% on misc. fixed assets.
Bank loan has been considered for repayment in 7 years with one-year
moratorium.
Preliminary exp. will be written off @ 10% every year in next 10 years.
Pre-operative exp. will be written off from second year @ 10% every year in next
10 years.
Depreciation has been charged using Straight-Line Method
Insurance, lease rent & interest has been taken as fixed cost for calculating B.E.P.
Income tax has been charged @ 30% every year as per Bhutan's tax rates (Source:
Ministry of Finance - https://www.mof.gov.bt/faq/)
DSCR - debt service coverage ratio - is defined as net operating income divided
by total debt service.

Investment Opportunity Study 2020 Project Profile: High Tech Geophysical and Mining Exploration Services, Bhutan
Page | 203
1.13.12. Estimation of Project Profitability Table_ 16:Estimation of Project Profitability
# Particulars 1st Yr. 2nd Yr. 3rd Yr. 4th Yr. 5th Yr. 6th Yr. 7th Yr. 8th Yr. 9th Yr. 10th Yr.
1 Installed Capacity 100% 270.00 270.00 270.00 283.50 283.50 283.50 297.68 297.68 297.68 297.68
2 Capacity Utilization 70% 70% 70% 80% 80% 80% 90% 90% 90% 90%
3 Actual Sales in lacs Nu. 189.00 189.00 189.00 226.80 226.80 226.80 267.91 267.91 267.91 267.91
4 Cost of Operation
4.1 Land Lease Charges 5.17 5.16672 5.16672 0.72 0.74 0.76 0.79 0.81 0.83 0.86
4.2 Raw Material 1.68 1.68 1.68 1.92 1.92 1.92 2.16 2.16 2.16 2.16
4.3 Consumables @ 0% (Already taken) 0.00 0.00 0.00 0.00 0.00 0.00 0.00 0.00 0.00 0.00
4.4 Power and Utility 0.00 0.00 0.00 0.00 0.00 0.00 0.00 0.00 0.00 0.00
4.5 Repair & Maintenance @2% 2.54 2.54 2.54 2.54 2.54 2.54 2.54 2.54 2.54 2.54
4.6 Salary & Wages 33.60 35.28 37.04 38.90 40.84 42.88 45.03 47.28 49.64 52.12
4.7 Fringe Benefits @15% 5.04 5.29 5.56 5.83 6.13 6.43 6.75 7.09 7.45 7.82
4.8 Insurance 1.00 1.00 1.00 1.00 1.00 1.00 1.00 1.00 1.00 1.00
4.9 Administration Expenses 3.00 3.15 3.31 3.47 3.65 3.83 4.02 4.22 4.43 4.65
Total 46.86 48.95 51.13 53.67 56.08 58.61 61.51 64.30 67.23 70.30
5 Marketing Expenses @5% on Sale 18.90 18.90 18.90 22.68 22.68 22.68 26.79 26.79 26.79 26.79
6 Cost of Production 65.76 67.85 70.03 76.35 78.76 81.29 88.30 91.09 94.02 97.09
7 Sale (Estimated Turn Over) 189.00 189.00 189.00 226.80 226.80 226.80 267.91 267.91 267.91 267.91
8 Profit Before Interest and Depp. 123.24 121.15 118.97 150.45 148.04 145.51 179.61 176.82 173.89 170.82
9 Interest on Term Loan @12% 14.09 12.89 10.49 8.09 5.69 3.29 0.92 0.00 0.00 0.00
10 On Working Capital @13 % 1.57 1.57 1.57 1.57 1.57 1.57 1.57 1.57 1.57 1.57
11 Total Interest 15.66 14.46 12.06 9.66 7.26 4.86 2.50 1.57 1.57 1.57
12 Profit Before Depreciation. 107.58 106.69 106.91 140.79 140.78 140.65 177.11 175.25 172.32 169.24
13 Depreciation 21.87 18.56 15.74 13.36 11.34 9.62 8.17 6.93 5.89 5.00
14 Profit After Depreciation 85.71 88.14 91.16 127.43 129.44 131.03 168.94 168.31 166.43 164.24
15 Pre-operative Exp. W. Off 0.00 1.39 1.39 1.39 1.39 1.39 1.39 1.39 1.39 1.39
16 Preliminary Exp. W. Off 0.10 0.10 0.10 0.10 0.10 0.10 0.10 0.10 0.10 0.10
17 Profit before Taxation 85.61 86.65 89.67 125.94 127.95 129.54 167.45 166.82 164.94 162.75
18 Taxation @30% of Net Profit 25.68 25.99 26.90 37.78 38.39 38.86 50.24 50.05 49.48 48.83
19 Accumulated Profit 59.92 120.58 183.35 271.51 361.08 451.75 568.97 685.75 801.20 915.13
20 Profit after Taxation 59.92 60.65 62.77 88.16 89.57 90.68 117.22 116.78 115.46 113.93
21 Add: Depreciation 21.87 18.56 15.74 13.36 11.34 9.62 8.17 6.93 5.89 5.00
22 Add: Interest on Term Loan 14.09 12.89 10.49 8.09 5.69 3.29 0.00 0.00 0.00 0.00
Total (A) 95.88 92.09 89.00 109.61 106.59 103.59 125.39 123.71 121.34 118.92
23 Interest on Term Loan 14.09 12.89 10.49 8.09 5.69 3.29 0.92 0.00 0.00 0.00
24 Repayment on Term Loan 0 20.00 20.00 20.00 20.00 20.00 17.38 0.00 0.00
Total (B) 14.09 32.89 30.49 28.09 25.69 23.29 18.30 0.00 0.00 0.00

Investment Opportunity Study 2020 Project Profile: High Tech Geophysical and Mining Exploration Services, Bhutan
Page | 204
Surplus (A) - (B) 81.79 59.21 58.52 81.52 80.91 80.30 107.08 123.71 121.34 118.92
DSCR (A/B) 6.81 2.80 2.92 3.90 4.15 4.45 6.85 0.00 0.00 0.00
Average DSCR 4.55
1.13.13. Calculation of Interest on Term Loan (Nu. in Lacs) Table_ 17:Break Even Point
# Year Opening Balance Repayment Closing Balance Interest
1 1st year 117.38 0 117.38 14.09 14.09
2 2nd year
1st Qtr. 117.38 5.00 112.38 3.45
2nd Qtr. 112.38 5.00 107.38 3.30
3rd Qtr. 107.38 5.00 102.38 3.15
4th Qtr. 102.38 5.00 97.38 3.00 12.89
3 3rd year
1st Qtr. 97.38 5.00 92.38 2.85
2nd Qtr. 92.38 5.00 87.38 2.70
3rd Qtr. 87.38 5.00 82.38 2.55
4th Qtr. 82.38 5.00 77.38 2.40 10.49
4 4th year
1st Qtr. 77.38 5.00 72.38 2.25
2nd Qtr. 72.38 5.00 67.38 2.10
3rd Qtr. 67.38 5.00 62.38 1.95
4th Qtr. 62.38 5.00 57.38 1.80 8.09
5 5th year
1st Qtr. 57.38 5.00 52.38 1.65
2nd Qtr. 52.38 5.00 47.38 1.50
3rd Qtr. 47.38 5.00 42.38 1.35
4th Qtr. 42.38 5.00 37.38 1.20 5.69
6 6th year
1st Qtr. 37.38 5.00 32.38 1.05
2nd Qtr. 32.38 5.00 27.38 0.90
3rd Qtr. 27.38 5.00 22.38 0.75

Investment Opportunity Study 2020 Project Profile: High Tech Geophysical and Mining Exploration Services, Bhutan
Page | 205
4th Qtr. 22.38 5.00 17.38 0.60 3.29
7 7th year
1st Qtr. 17.38 5.00 12.38 0.45
2nd Qtr. 12.38 5.00 7.38 0.30
3rd Qtr. 7.38 5.00 2.38 0.15
4th Qtr. 2.38 2.38 0.00 0.04 0.92
1.13.14. Break Even Point Table_ 18:Break Even Point
# Particulars 1st Yr. 2nd Yr. 3rd Yr. 4th Yr. 5th Yr. 6th Yr. 7th Yr. 8th Yr. 9th Yr. 10th Yr.
1 Calculation of B.E.P.
Variable Cost 23.12 23.12 23.12 27.14 27.14 27.14 31.49 31.49 31.49 31.49
Fixed Cost 85.34 82.90 79.88 72.94 70.95 69.39 68.26 68.91 70.82 73.03
2 Break Even Point (B.E.P.) 51.45% 49.98% 48.16% 36.53% 35.54% 34.76% 28.87% 29.15% 29.95% 30.89% Average B.E.P. 37.53%
1.13.15. Projected Balance Sheet for the Project (10 Year) Table_ 19:Projected Balance Sheet
# Description Construction Period Operation Period in Years
0 1st Yr. 2nd Yr 3rd Yr 4th Yr 5th Yr 6th Yr 7th Yr 8th Yr 9th Yr 10th Yr
1 Liabilities
1.1 Equity 54.94 54.94 54.94 54.94 54.94 54.94 54.94 54.94 54.94 54.94 54.94
1.2 General reserves 0 59.92 120.58 183.35 271.51 361.08 451.75 568.97 685.75 801.20 915.13
1.3 Debt 117.38 117.38 97.38 77.38 57.38 37.38 17.38 0.00 0.00 0.00 0.00
1.4 Current Liabilities 0.00 0.46 0.51 0.50 0.50 0.50 0.50 0.50 0.50 0.50 0.50
1.5 Working Capital Loan 0.00 12.11 12.11 12.11 12.11 12.11 12.11 12.11 12.11 12.11 12.11
Total Liabilities 172.32 244.81 285.51 328.28 396.44 466.01 536.69 636.53 753.30 868.76 982.69
2 Assets
2.1 Gross Fixed Assets 158.81 158.81 158.81 158.81 158.81 158.81 158.81 158.81 158.81 158.81 158.81

Investment Opportunity Study 2020 Project Profile: High Tech Geophysical and Mining Exploration Services, Bhutan
Page | 206
2.2 Accumulated Depreciation 0 21.87 40.43 56.17 69.53 80.87 90.49 98.66 105.59 111.48 116.48
2.3 Net fixed assets
(2.01-2.02)
158.81 136.93 118.38 102.64 89.27 77.94 68.31 60.15 53.21 47.33 42.33
2.4 Preliminary Expenses 1.00 0.90 0.80 0.70 0.60 0.50 0.40 0.30 0.20 0.10 0.00
2.5 Pre-Operative Expenses 12.51 12.51 11.12 9.73 8.34 6.95 5.56 4.17 2.78 1.39 0.00
2.6 Current Assets 0.00 14.49 16.56 16.56 16.56 16.56 16.56 16.56 16.56 16.56 16.56
2.7 Profit & Loss Account 0.00 0.00 0 0 0 0 0 0 0 0 0
2.8 Cash & Bank Balance 0.00 79.98 138.66 198.66 281.67 364.06 445.85 555.35 680.55 803.39 923.80
Total Assets 172.32 244.81 285.51 328.28 396.44 466.01 536.69 636.53 753.30 868.76 982.69

Investment Opportunity Study 2020 Project Profile: High Tech Geophysical and
Mining Exploration Services, Bhutan
Page | 207
Some of the Global Service providers for High Tech Geophysical
and Mining Exploration
Table_ 20:Some of the Global Service providers for High Tech Geophysical and Mining Exploration
# Company Name Address
1. Complete Instrumentation
Solutions Pvt Ltd
Suite 511, Suncity Business Towers, Golf Course R,
Gurgaon, Haryana 122003 India
2. Quantec Geoscience Ltd. 146 Sparks Ave., Toronto, Ontario M2H 2S4 Canada
3. WTS Geophysical Solutions,
India
No: 1, Triplicane High Road, Chennai-600 005 (M) 0091
98434 74810
4. Explorer Geophysical
Consultants Pvt. Ltd.
Banasthali, Kathmandu, Nepal, Contact +977-1-6923145
5. Geophysik GGD mbH Ehrensteinstr. 33, Leipzig, 04105 Germany
6. Mineral Exploration
Corporation Limited
Dr.Babasaheb Ambedkar Bhawan, Seminary Hills,
Nagpur 440006
7. Parsan overseas (Pvt.) Ltd 707, Eros Apartments, 56-Nehru Place, New Delhi
(INDIA) 110019
Conclusion
The Mining sector is one of the five jewels of the economy and accounts for 3% of GDP
in Bhutan. It is also play as an important catalyst role in terms of revenue collection and
employment generation.
Under the Bhutanese scenario, High Tech Geophysical and Mining Exploration Services
are the need of the present times. It will provide services which includes appropriate
solutions to users by defining the suitable investigation method, counseling the suitable
equipment, catering the high-quality scientific equipment & swift technical services to
fulfill the data analysis and requirement.
The total cost of the project has been considered as Nu. 17.2 million. The payback period
is 23 months. DSCR value is 4.55 which show that the project will generate sufficient to
pay loans. Based on the estimation of project cost and financial analysis, High Tech
Geophysical and Mining Exploration Services is a profitable project in Bhutan with high
rates of return. It is recommended to entrepreneurs to scale up at Industrial level.

Investment Opportunity Study 2020 Project Profile: High Tech Geophysical and
Mining Exploration Services, Bhutan
Page | 208
Sources
Internet References
https://www.indiamart.com/proddetail/24-channel-seismograph-24-bit-
14318915633.html
https://www.indiamart.com/proddetail/ground-penetrating-radar-gpr-up-to-
120meter-depth-22272705230.html
https://www.indiamart.com/proddetail/advanced-resistivity-meter-2d-ert-function-
12173198262.html
https://www.indiamart.com/proddetail/masw-48-channel-seismograph-
19555208873.html
https://www.indiamart.com/proddetail/portable-borehole-camera-
14319328988.html
https://onshopdeals.com/dji-mavic-air-mavic-air-fly-more-combo-drone-4k-
100mbps-video-3-axis-gimbal-camera-with-4km-remote-control-foldablerc-
quadcopter/?sku=32852583206_29_201336103&cmp_
id=1033612468&adg_id=56525683571&kwd=&device=c&gclid=Cj0KCQjwgJv4BRCrAR
IsAB17JI66vp0e9_bMy9TcjG-dj6xSXftGMRnIK8XD7XrGbAkayby
GzytGvIYaAoYNEALw_wcB

Investment Opportunity Study 2020 Project Profile: Multi-product Kiosks Services,
Bhutan
Page | 209
Project Title: Multi-product Kiosks Services, Bhutan

Investment Opportunity Study 2020 Project Profile: Multi-product Kiosks Services,
Bhutan
Page | 210
Multi-product Kiosks Services, Bhutan
Background of the idea
Kiosk is a very new, smart and interactive solution and service which is having various
type of uses and application. A kiosk is a small, stand-alone booth typically placed in
high-traffic areas for business purposes. It typically provides information and
applications on education, commerce, entertainment, and a variety of other topics.
Kiosks are popular due to the number of advantages they provide.
Any common people can use the services by kiosk and can save time to wait in the
long queues. The service provided can earn a handsome amount of money by
providing this service to common people of Bhutan without investing much. One can
establish these services from one office and service centre for maintaining the kiosk.
Recently, there has been many successful deployments in self-service kiosks in various
sectors. A successful kiosk deployment needs to replace a current service that is
currently being carried out manually, or meets the demand for a service that is not
currently happening.
Rationale of the idea
Kiosk services are very easy and can help the customers in various fields such as:
Healthcare – Check in for appointments, pay for prescriptions, vending of condoms
& sanitary pads.
Government – Citizens can print government ID cards directly at the Kiosk.
Corporate – Visitor registration facility (printing badges), facility for staff to update
details for HR purposes.
Industrial – Digital job cards, recording task data, reporting issues and project
reports.
Banking – Deposits and withdrawal machines are considered forms of Self-Service
kiosks.
Retail and showrooms – Pay mobile bill, buy a top up card, or perform account
updates.
Universities – Vast number of services that students perform such as request
transcript, letter of attendance, student card replacement, etc.
Schools – Registration kiosks to allow visitors to register themselves before
entering the school, against a pre-defined visitor/check list.
Events – Badge printing to fast track delegates with pre-registered tickets using
barcode scanner. Barcode scanner and badge printer are integrated into the kiosk.
Purchasing of all the equipment needs heavy cost.

Investment Opportunity Study 2020 Project Profile: Multi-product Kiosks Services,
Bhutan
Page | 211
Restaurants and Grocery stores: Self-service kiosks at restaurants and grocery
stores.
Market Outlook International
The global interactive kiosk market size was valued at $14.76 billion in 2018, and is
projected to reach $32.51 billion by 2027, growing at a CAGR of 9.1% from 2020 to
20271. Interactive kiosk is a self-service device or a computer terminal deployed in
public sector and helps users to interact with digital content and information through
user friendly interface. Interactive kiosks are used for retail sales, bill payment,
wayfinding, information sharing, and tourism. These kiosks are used in multiple
application areas from healthcare and travel industries, as they help obtain personal
information easily from the users.
The emergence of advanced technologies offers enhanced visualizations in several
industry verticals including education, corporate, retail, sports & entertainment,
transportation, and others. In addition, interactive kiosk allows customers to get
control over their purchasing decisions, which will ensure higher degree of customer
satisfaction, and also is able to capture large number of customers. Self-service devices
are technological interfaces that enable customers to utilize a service independently
without intervention of service provider. The prominent factors impacting on the self-
service kiosk industry include rise in demand for self-service machines & automated
devices, wireless communication, technology advancements, and remote
management.
Increase in demand for automated systems fuels the growth of the interactive kiosk
market, as the seamless performance of the self-service machines enhances the overall
customer satisfaction and reduces the operational time as compared to manual
services. In addition, interactive kiosk technology has become emerging area of the
retail industry. Such systems provide moving brand experience inside or outside the
brick and mortar location. Thus, adoption of interactive systems in retail applications
is also expected to fuel the growth of the interactive kiosk market.
Furthermore, peoples shifting toward adoption of self-service systems is also
contributing to the growth of the interactive kiosk market, as these systems facilitate
users with quick and fast services without intervention of representative and eliminate
the waiting time. Moreover, the rapid developments in touch enabled technologies
drive the interactive display market growth. Nonetheless, advancement in interactive
kiosk such as tele-kiosks with global positioning system (GPS) technology is expected
to provide lucrative growth opportunities to the interactive kiosk market.
1 Report available on https://www.alliedmarketresearch.com/press-release/interactive-kiosk-market.html
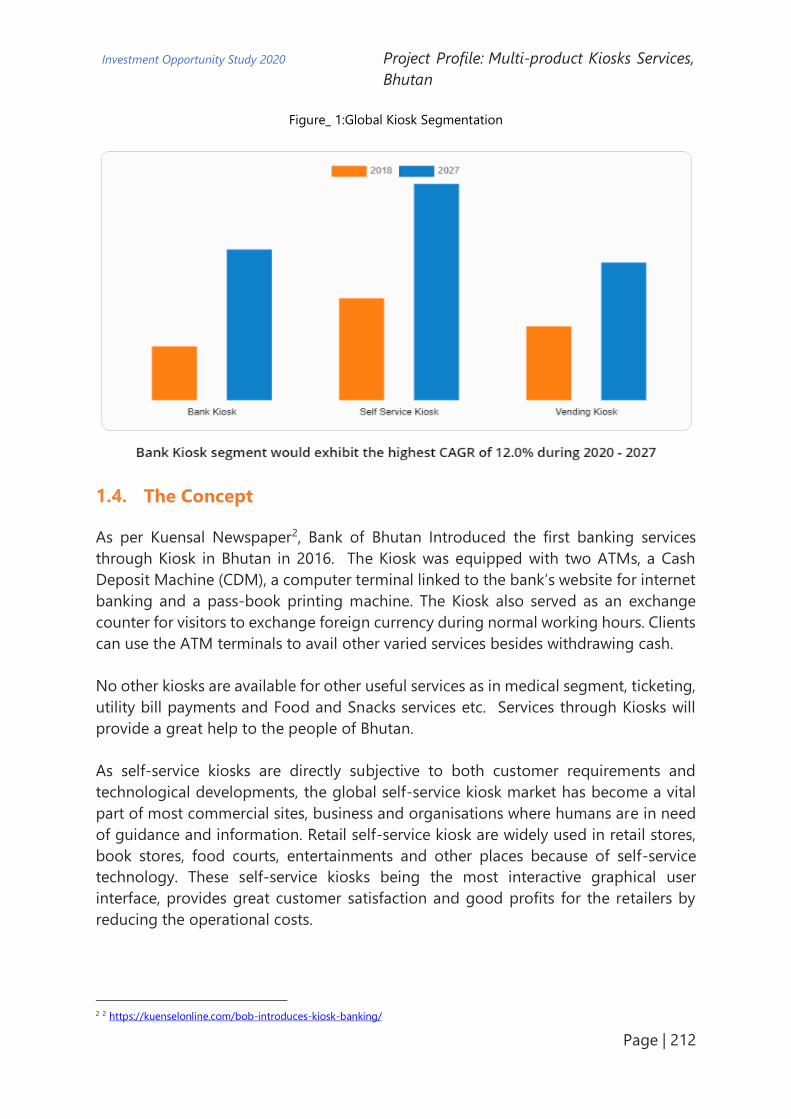
Investment Opportunity Study 2020 Project Profile: Multi-product Kiosks Services,
Bhutan
Page | 212
Figure_ 1:Global Kiosk Segmentation
The Concept
As per Kuensal Newspaper2, Bank of Bhutan Introduced the first banking services
through Kiosk in Bhutan in 2016. The Kiosk was equipped with two ATMs, a Cash
Deposit Machine (CDM), a computer terminal linked to the bank’s website for internet
banking and a pass-book printing machine. The Kiosk also served as an exchange
counter for visitors to exchange foreign currency during normal working hours. Clients
can use the ATM terminals to avail other varied services besides withdrawing cash.
No other kiosks are available for other useful services as in medical segment, ticketing,
utility bill payments and Food and Snacks services etc. Services through Kiosks will
provide a great help to the people of Bhutan.
As self-service kiosks are directly subjective to both customer requirements and
technological developments, the global self-service kiosk market has become a vital
part of most commercial sites, business and organisations where humans are in need
of guidance and information. Retail self-service kiosk are widely used in retail stores,
book stores, food courts, entertainments and other places because of self-service
technology. These self-service kiosks being the most interactive graphical user
interface, provides great customer satisfaction and good profits for the retailers by
reducing the operational costs.
2 2 https://kuenselonline.com/bob-introduces-kiosk-banking/

Investment Opportunity Study 2020 Project Profile: Multi-product Kiosks Services,
Bhutan
Page | 213
Types of kiosks that are assisting us in everyday life
Self-service digital kiosks have been in use for a long time. These interactive devices
have been making lives easier. In a world where time is precious, and customers are
becoming increasingly tech-savvy, the kiosk services instantly elevate and personalise
customer experiences.
Mentioned below are the different types of kiosks that assist us in everyday lives.
1.5.1. Financial Kiosks
The self-service kiosk revolution actually began in the financial sector. With digital
kiosks like ATMs and other banking kiosks, customers can easily withdraw or deposit
cash and can also get concise and clear information about their account balance, etc.
The advancement in technology has enabled us to make day-to-day transactions via
financial kiosks. Self-service financial kiosks are a quick and easy way to facilitate
transactions, while simultaneously cutting costs. The self-service kiosk solutions have
simplified the services offered by the financial sector, and beneficial for customers.
1.5.2. Kiosks for bill payments and purchase of services
There are kiosks that facilitate bill payments, utility bills, electric & water bills and
purchase of various services like flight tickets, TV subscriptions, gift cards, online
gaming vouchers along with domestic or international mobile recharges. They can be
located anywhere and are usually helpful in thinning the footfall in retail shops and
services providing offices.
1.5.3. Check-in Kiosks
Kiosks provide services such as internet e-check-in and self-service, allowing the
processing of a significant number of passengers to be decentralised from the airport/
station itself. The check-in kiosks are not limited to the airport/stations but checking
in for doctor’s appointment or even a hotel room is now easier than ever through a
digital kiosk. The check-in kiosk machines cut down wait time for the customers while
making verification and identification quick and simple.
1.5.4. Self-service kiosks at restaurants and grocery stores
Restaurants and Grocery stores can adopt self-service kiosk. The digital kiosks are a
way of reaching people emotionally. These kiosks provide people with the level of
comfort and convenience they’re seeking when they resort to fast food.
The self-checkout kiosks in grocery stores allow shoppers to put their items on a
conveyor belt and a machine scans each item within seconds. Also, the ease of paying
with credit or debit cards via the kiosk adds to the advantage of the customer. The

Investment Opportunity Study 2020 Project Profile: Multi-product Kiosks Services,
Bhutan
Page | 214
retail kiosks can be used at stores to accept payments, issue gift/loyalty cards or
provide a catalogue of a store’s inventory.
It will make it easier for customers to peruse available items and request out of stock
items or additional models and colours.
1.5.5. Way finding and Map Directory kiosks
Wayfinding kiosks have the advantage to interact with boarding passes, shop receipts,
etc. to make it easy for users to navigate to their desired location. These kiosks offer
busy sightseers a fast and informative way to get the most out of their trip. They help
in establishing where they are exactly within a location, and what is nearby and how
to get there?
Benefits of Using Kiosks in Business
Kiosk services can help bring your company to even greater heights. Some of the most
important benefits of having a kiosk are outlined below:
1.6.1. Improves Customer Buying Experience
Kiosks can provide customers with detailed information about products and services.
Since kiosks are easily accessible, your customers will find it convenient to visit a kiosk
for inquiries such as product pricing, feature comparison, etc. It will also instil
confidence in potential customers, by using the latest technologies to improve their
buying experience.
1.6.2. Increases Your Customer Base
Since kiosks are often placed at strategic locations to reach more potential customers,
it helps expand the customer base, which ultimately increases company’s ability to sell
more products. Kiosks allow to expand reach and generate more sales without the
need for a costly investment.
1.6.3. Reduces Costs
Interactive kiosks can be used in place of staff. Also, since kiosks can provide the
customers with answers to many of their buying concerns. Moreover, opting for a kiosk
instead of a traditional retail space will keep rent and overhead costs down and
increased visibility.
1.6.4. Helps Save Time
Kiosk assist business operations to help save time. For example, if a shopkeeper can
have both a cashier and a kiosk helping to check out customers. This will cut waiting

Investment Opportunity Study 2020 Project Profile: Multi-product Kiosks Services,
Bhutan
Page | 215
times by up to 50%. As a result, customers will have a more positive experience at store
and will be more likely to return.
1.6.5. Helps with Branding and Advertising
Kiosks provide a great opportunity for branding and advertising purposes. By
designing the exterior of kiosks according to specific corporate image, such as the
colour scheme, logo, taglines, etc. Innovative kiosks can effectively draw the attention
of potential customers by streaming brand message. The opportunities for messaging
are infinite.
1.6.6. Helps Validate Product Ideas
Mall kiosks and carts can serve as testing grounds for new products and can help
generate public interest. Just make sure product or service is appropriate for where
kiosk is located.
Estimated Project Cost and Financials
The project is suggested under the M&L service sector industry category (Investment
above Nu. 10 million). The required land for this manufacturing plant is about 1,000
sq. ft. and it could be arranged on a lease basis. Storage, repairing centre will be
constructed through pre-fabricated structure. The total cost of the project has been
estimated as Nu. 14.6 million. The Break-Even months are 53. DSCR value is 2.17 which
show that the project will generate sufficient to pay loans.
Other details are as follows:
Table_ 1:Project Summary
# Description Amount (Nu. In Lacs)
1. Establishment Cost 140.59
2. Cost of Operation
2.1 Fixed Cost 34.46
a. Salary & Wages 22.44
b. Overhead Cost 12.02
3. Variable Costs 9.32
4. Break Even Point 59.71%
5. Payback Period 53 Months
6. D.S.C.R. 2.17
7. Rate of Return 22.82%
8. NPR 36.42%

Investment Opportunity Study 2020 Project Profile: Multi-product Kiosks Services,
Bhutan
Page | 216
1.7.1. Means of Finance Table_ 2:Means of Finance
# Particulars Value (Nu. in Lacs) Percentage
1. Promoters Equity 40.76 29%
2. Term Loan from Bank 99.84 71%
3. Total 155.66 100%
4. Margin Money for Working
Capital
Nu. 3.84 Lacs
1.7.2. Project Cost
The cost of project is estimated with sum of equipment MFA, preliminary expenses,
pre-operative expenses and contingency. The total office space required for this
project is around 1,000 sq. ft. It will be arranged on a lease basis. The main capital
investment cost is equipment cost which covers about 88.62% of overall capital
investment. Margin Money for working capital is not considered as part of project cost.
The summary of the project cost is as follows: Table_ 3:Head Wise Project Cost and Sharing Percentage
# Particulars Value (Nu. in Lacs) Cost Sharing
1. Land 1000 sq. ft (Size 25ft. *40ft.) On Lease
2. Building & Civil Construction
3. Equipment Cost 124.59 88.62%
4. Misc. Fixed Assets 7.52 5.35%
5. Preliminary Expenses 0.50 0.36%
6. Pre-operative Expenses 4.02 2.86%
7. Contingencies 3% 3.96 2.82%
Total 140.59 100%
i). Plant and Machinery Cost (Equipment Cost)
The cost estimates for equipment has been worked out based on the cost figures
received from the Indian Kiosks suppliers. The prices are considered without Indian
GST tax as it is exempted under supply of trade agreement between India and Bhutan
(Category Export). Installation and commissioning of equipment are considered
separately in the total cost estimation.
Freight and insurance have been considered with the assumption that all goods are
transported by road. Goods of imported origin would be handled at the Kolkata port.
The equipment list with cost is given in table below:

Investment Opportunity Study 2020 Project Profile: Multi-product Kiosks Services,
Bhutan
Page | 217
Table_ 4:Equipment’s with Cost
# Machine & Equipment's Qty. Rate (In Nu.)
Amount (Nu. in Lacs)
1. Utility Bill Payment Kiosk Machine: (Screen Size 15 Inches)
18 200000 36.00
2. Health Monitoring Kiosk (Screen Size: 20 Inch)
5 800000 40.00
3. Blood Pressure Kiosk (Fully Automated) 4 140000 5.60
4. Sanitary Napkin (Women Pad) Vending
Automatic Machine
15 30000 4.50
5. Condom Vending Machine 15 20000 3.00
6. Self Service Kiosk - Tickets generation (Public
Transport) 4 175000 7.00
7. Self-Ordering Kiosk (QSR) Machine, for
Restaurant, Size/Dimension: 680 X 780 X
2125 Mm
2 200000 4.00
8. Softy Vending Machine 4 175000 7.00
9. Fruit/Vegetable Vending Machine, Cash and
Cashless (UPI)
1 250000 2.50
10. Snacks Vending Machine 1 160000 1.60
11. CCTV Camera and Surveillance System 60 7000 4.2
12. Maintenance Tools and Portable
Equipment's
1 50000 0.50
Total Amount
115.90
13. Packaging & Forwarding 7.5%
8.69
14. Erection and Commissioning 7.5%
8.69
Grand Total
124.59
ii). Misc. Fixed Assets
A miscellaneous fixed asset includes office equipment & furniture, computer and
peripherals, firefighting equipment, vehicle etc.
Nu. 752,000 has been estimated under this head “MFA” and presented in the below
table: Table_ 5:Misc. Fixed Assets Cost Estimation
# Particulars Qty. Amount (Nu.in lacs)
1. Laptop, Printer & Copier Machine 1 1.00
2. Furniture & Fixture with Interior Items 1 1.50
3. Fire Fighting Equipment's 1 0.02
4. Pick up 1 5.0
Total 7.52

Investment Opportunity Study 2020 Project Profile: Multi-product Kiosks Services,
Bhutan
Page | 218
iii).Preliminary Expenses
Preliminary expenses are those that are incurred before the incorporation and
commencement of business. These are treated as deferred revenue expenditure. These
expenses are marked to be written off in the next ten years in profitability estimation
The Preliminary Expenses details are as follows: Table_ 6:Preliminary Expenses
# Particular Amount (Nu.in Lacs)
1. Company formation expenses and setup approval
expenses
0.50
Total 0.50
iv). Pre-operative Expenses
These expenses are incurred prior to commencement of commercial production. A
total of Nu. 402,000 is estimated under this cost to be written off in the next 10 years.
It is considered as exempted in the first year. The details are given in the table below:
Table_ 7:Pre-operative Expenses
# Particular Amount (Nu.in Lacs)
1. Interest up to production on Term Loan 0.90
2. Training of Machine Operation and Maintenance @2% of
Machine cost
2.32
3. Marketing launch expenses 0.30
4. Travelling Expenses for Project Implementation 0.50
Total 4.02
v). Cost of Raw Material
The cost of raw materials consists of the cost of main ingredients, raw materials and
cost of packaging. The annual raw material cost is based on the present average
market prices in Bhutan. A total of Nu. 264,000 has been estimated for raw material
cost. The details are as follow given in the table below:
Table_ 8:Cost of Raw Material
# Raw Material Qty. Total Amount
1. Stationery Items, Paper Rim, Cartage refilling, House
Keeping Items and Misc.
Set
Annua
l
1.20
2. Paper Roll, Kiosk Pad 1.44
Total (Nu. In Lacs) 2.64
vi). Salary & Wages
Salaries and wages (including benefits) for different categories of employees have
been considered based on present day expenses. The salaries are considered as per
the present trends in the relevant segment and rules as per Pay Revision Act 2019 (9

Investment Opportunity Study 2020 Project Profile: Multi-product Kiosks Services,
Bhutan
Page | 219
July 2019) Bhutan. The fringe benefits are considered at 15% per year. It is also
considered that salary will increase 5% annually. The breakdown of manpower with
estimated salaries is given in the following table: Table_ 9:Salary & Wages
# Description Intake Salary Per Month (Nu.)
Salary Per Annum (Nu. In Lacs)
1. Operation Head 1 50000 6.00
2. Office Assistant 1 12000 1.44
3. Marketing & Sales 2 25000 6.00
4. Technicians 3 20000 7.20
5. Driver 1 15000 1.80
Total 8
22.44
vii). Electrical and Water Consumption Charges
Electricity charges are considered as per the tariff rate issued by Bhutan Power
Corporation. The unit cost of electricity has been considered @ Nu. 3/Kwh for
operating of machines and plant operation. It is assumed that the entire power
requirement is met from the grid. The expense on water supply, treatment and
distribution has been suitably considered based on the Thimphu City Corporation
water tariff on a lumpsum basis. It is assumed that power and water charges will
increase @ 5% every year. The utility charges are as follows: Table_ 10:Electrical and Water Consumption Charges
# Description Amount Per Annum (Nu.in Lacs)
1. Power Consumption Charges 1.20
2. Water Consumption Charges 0.48
Total 1.68
viii). Term Loan Estimation
The term loan requirement is estimated on the funding pattern in Bhutan. It is
estimated as per the norms by Bhutan National Bank Limited. The term loan is
considered as up to 60% to 75% of the project cost and it does not include working
capital margin money (as per financing pattern by Bhutan National Bank Limited). The
estimated term loan is Nu. 14.1 million of which 71% will come as loan from financial
institution. The rest of the capital investment (Nu. 4 million consisting 29%) will be
managed by entrepreneurs on their own. The estimated term loan calculation is as
follows: Table_ 11:Term Loan Requirement from Financial Institution
# Particulars Margin % Amount (Nu.in Lacs)
Own
Contribution (Nu. in Lacs)
Bank Loan (Nu.in Lacs)
1. Equipment’s 25% 124.59 31.15 93.44
2. Misc. Fixed Assets 15% 7.52 1.13 6.39

Investment Opportunity Study 2020 Project Profile: Multi-product Kiosks Services,
Bhutan
Page | 220
3. Preliminary Expenses 100% 0.50 0.50 0.00
4. Pre-operative Expenses 100% 4.02 4.02 0.00
5. Contingencies 100% 3.96 3.96 0.00
Total 140.59 40.76 99.84
Sharing % 29% 71%
ix). Working Capital Loan Amount
Working capital loan up to 75% of the total working capital gap is considered in
Bhutan. The total estimated working capital loan requirement is Nu.1.02 million and
margin money is estimated as Nu. 384,000. The working capital loan is available from
the banks in Bhutan with an interest rate of 13% (fixed rate as well as floating). Working
capital requirements have been worked out in the following table: Table_ 12:Working Capital Loan Amount
# Particulars Period Margin
%
Amount (Nu.inLacs)
Own
Contribution (Nu. in Lacs)
Bank Loan
(Nu.in Lacs)
1. Consumables 15 days 0.08 0.04 0.04 0.08
2. Receivable 30 days 8.13 2.03 6.10 8.13
3. Cash for
Expenses &
Consumables
15 days 1.96 1.77 0.20 1.96
Net Working Capital Requirement 10.17 3.84 6.33
W.C. Sharing 38% 62%
Margin Money for Working Capital @ 100%
Capacity
Nu. 3.84 Lacs
x). Rental Services Realization/Estimated turnover
Rental Service Realisation or estimated turnover is based on the service price. The
rental services price of kiosks is determined as cost competitive with presently available
similar product whether supply is from domestic market or international. The rent per
month from one kiosk (Health Kiosk, Condom and Sanitary Pad, Utility Services, Food
and Snacks & Self-Services kiosk) varies from Nu. 7,500 a kiosk to Nu. 30,000 a kiosk
and the total of Nu. 13.9 million is the estimated service realization at 100% rental. The
estimated turnover details are as follows: Table_ 13:Rental service Realization/Estimated turnover
# Product Total
No. of
Kiosk
Rent per
month from
one kiosk
Annual
Rent (Nu.)
Total Amount
Per Annum (Nu in Lacs)
1. Health Kiosk 9 30000 3240000 32.40
2. Condom and Sanitary
Pad
30 7500 2700000 27.00
3. Utility Services 18 22000 4752000 47.52

Investment Opportunity Study 2020 Project Profile: Multi-product Kiosks Services,
Bhutan
Page | 221
4. Food and Snacks 6 20000 1440000 14.40
5. Self-Services 6 25000 1800000 18.00
Total Revenue Collection 139.32
xi). Estimated Cost of Production and Profitability
The profitability projection has been worked out for 10 years at 70% capacity utilisation
to be achieved during the first three years, 80% in fourth to sixth year. Following
assumptions and relevant basis applicable to Bhutan have been considered while
preparing the profitability:
• Rental Services Price is assumed same for three years and increased by 5% after
every three Years.
• Spare Part Inventory and Maintenance @ 5% per annum on equipment & misc.
fixed assets.
• Bank interest rate has been calculated @12% per annum on term loan & @ 13%
working capital loan.
• Insurance charges will be @ Nu. 1,000 per year per kiosk machine.
• Power & water charges are increased @ 5% every year.
• Administrative expenses have been increased @ 5% every year.
• Margin money has been considered @ 40% on building, @ 25% on plant &
machinery and @ 25% on misc. fixed assets.
• Bank loan has been considered for repayment in 7 years with one-year moratorium.
• Preliminary exp. will be written off @10% every year in next 10 years.
• Pre-operative exp. will be written off from the second year @10% every year.
• Depreciation has been charged using the Straight-Line Method.
• Insurance, lease rent & interest has been taken as fixed cost for calculating B.E.P.
• Income tax has been charged @ 30% every year as per Bhutan's tax rates (Source:
Ministry of Finance - https://www.mof.gov.bt/faq/)
• DSCR - debt service coverage ratio - is defined as net operating income divided by
total debt service.

Investment Opportunity Study 2020 Project Profile: Multi-product Kiosks Services, Bhutan
Page | 222
a) Estimation of Project Profitability Table_ 14:Estimation of Project Profitability
S. No. Particulars 1st Yr. 2nd Yr. 3rd Yr. 4th Yr. 5th Yr. 6th Yr. 7th Yr. 8th Yr. 9th Yr. 10th Yr.
1 Installed Capacity @100% 139.32 139.32 139.32 146.29 146.29 146.29 153.60 153.60 153.60 153.60
2 Capacity Utilization 70% 70% 70% 80% 80% 80% 90% 90% 90% 100%
3 Actual Sales in lacs Nu. 97.52 97.52 97.52 117.03 117.03 117.03 138.24 138.24 138.24 153.60
4 Cost of Operation
4.1 Office Lease Charges 3.96 4.16 4.37 4.58 4.81 5.05 5.31 5.57 5.85 6.14
4.2 Consumables 1.85 1.85 1.85 2.11 2.11 2.11 2.38 2.38 2.38 2.64
4.3 Spare Part Inventory and Maintenance @5% 5.80 5.80 5.80 6.37 6.37 6.37 7.01 7.01 7.71 7.71
4.4 Power and Utility 1.68 1.76 1.85 1.94 2.04 2.14 2.25 2.36 2.48 2.61
4.5 Repair & Maintenance @0% 0.00 0.00 0.00 0.00 0.00 0.00 0.00 0.00 0.00 0.00
4.6 Salary & Wages 22.44 23.56 24.74 25.98 27.28 28.64 30.07 31.58 33.15 34.81
4.7 Fringe Benefits @15% 3.37 3.53 3.71 3.90 4.09 4.30 4.51 4.74 4.97 5.22
4.8 Insurance 0.69 0.69 0.69 0.69 0.69 0.69 0.69 0.69 0.69 0.69
4.9 Administration Expenses 4.00 4.20 4.41 4.63 4.86 5.11 5.36 5.63 5.91 6.21
Total 39.82 41.39 43.05 45.63 47.45 49.36 52.27 54.38 57.30 59.89
5 Marketing Expenses @10% of Sale 9.75 9.75 9.75 11.70 11.70 11.70 13.82 13.82 13.82 15.36
6 Cost of Production 49.57 51.15 52.80 57.33 59.15 61.06 66.10 68.21 71.12 75.25
7 Sale (Estimated Turn Over) 97.52 97.52 97.52 117.03 117.03 117.03 138.24 138.24 138.24 153.60
8 Profit Before Interest and Depp. 47.95 46.38 44.73 59.70 57.88 55.96 72.14 70.03 67.12 78.35
9 Interest on Term Loan @12% 11.98 10.97 8.96 6.94 4.92 2.91 0.91 0.00 0.00 0.00
10 On Working Capital @13 % 0.82 0.82 0.82 0.82 0.82 0.82 0.82 0.82 0.82 0.82
11 Total Interest 12.80 11.80 9.78 7.76 5.75 3.73 1.73 0.82 0.82 0.82
12 Profit Before Depreciation. 35.15 34.58 34.95 51.94 52.13 52.23 70.41 69.21 66.30 77.53
13 Depreciation 12.79 11.44 10.23 9.16 8.20 7.34 6.58 5.90 5.29 4.74
14 Profit After Depreciation 22.36 23.14 24.71 42.78 43.93 44.89 63.84 63.32 61.01 72.79
15 Pre -operative Exp. W. Off 0.00 0.45 0.45 0.45 0.45 0.45 0.45 0.45 0.45 0.45
16 Preliminary Exp. W. Off 0.05 0.05 0.05 0.05 0.05 0.05 0.05 0.05 0.05 0.05
17 Profit before Taxation 22.31 22.65 24.22 42.28 43.44 44.39 63.34 62.82 60.51 72.29
18 Taxation @30% of Net Profit 6.69 6.79 7.27 12.69 13.03 13.32 19.00 18.85 18.15 21.69
19 Accumulated Profit 15.61 31.47 48.42 78.02 108.42 139.50 183.84 227.81 270.17 320.77

Investment Opportunity Study 2020 Project Profile: Multi-product Kiosks Services, Bhutan
Page | 223
20 Profit after Taxation 15.61 15.85 16.95 29.60 30.41 31.08 44.34 43.97 42.36 50.61
21 Add: Depreciation 12.79 11.44 10.23 9.16 8.20 7.34 6.58 5.90 5.29 4.74
22 Add: Interest on Term Loan 11.98 10.97 8.96 6.94 4.92 2.91 0.00 0.00 0.00 0.00
Total (A) 40.39 38.26 36.14 45.70 43.53 41.33 50.92 49.87 47.64 55.34
23 Interest on Term Loan 11.98 10.97 8.96 6.94 4.92 2.91 0.91 0.00 0.00 0.00
24 Repayment on Term Loan 0 16.80 16.80 16.80 16.80 16.80 15.84 0.00 0.00 0.00
Total (B) 11.98 27.77 25.76 23.74 21.72 19.71 16.74 0.00 0.00 0.00
Surplus (A) - (B) 28.41 10.49 10.38 21.96 21.80 21.62 34.17 49.87 47.64 55.34
DSCR (A/B) 3.37 1.38 1.40 1.92 2.00 2.10 3.04 0.00 0.00 0.00
Average DSCR 2.17

Investment Opportunity Study 2020 Project Profile: Multi-product Kiosks Services,
Bhutan
Page | 224
b) Calculation of Interest on Term Loan (Nu. in Lacs) Table_ 15:Repayment of Interest on Term Loan
# Year Opening
Balance
Repayment Closing
Balance
Interest
1 1st year 99.84 0 99.84 11.98 11.98
2 2nd year
1st Qtr. 99.84 4.20 95.64 2.93
2nd Qtr. 95.64 4.20 91.44 2.81
3rd Qtr. 91.44 4.20 87.24 2.68
4th Qtr. 87.24 4.20 83.04 2.55 10.97
3 3rd year
1st Qtr. 83.04 4.20 78.84 2.43
2nd Qtr. 78.84 4.20 74.64 2.30
3rd Qtr. 74.64 4.20 70.44 2.18
4th Qtr. 70.44 4.20 66.24 2.05 8.96
4 4th year
1st Qtr. 66.24 4.20 62.04 1.92
2nd Qtr. 62.04 4.20 57.84 1.80
3rd Qtr. 57.84 4.20 53.64 1.67
4th Qtr. 53.64 4.20 49.44 1.55 6.94
5 5th year
1st Qtr. 49.44 4.20 45.24 1.42
2nd Qtr. 45.24 4.20 41.04 1.29
3rd Qtr. 41.04 4.20 36.84 1.17
4th Qtr. 36.84 4.20 32.64 1.04 4.92
6 6th year
1st Qtr. 32.64 4.20 28.44 0.92
2nd Qtr. 28.44 4.20 24.24 0.79
3rd Qtr. 24.24 4.20 20.04 0.66
4th Qtr. 20.04 4.20 15.84 0.54 2.91
7 7th year
1st Qtr. 15.84 4.20 11.64 0.41
2nd Qtr. 11.64 4.20 7.44 0.29
3rd Qtr. 7.44 4.20 3.24 0.16
4th Qtr. 3.24 3.24 0.00 0.05 0.91

Investment Opportunity Study 2020 Project Profile: Multi-product Kiosks Services, Bhutan
Page | 225
c) Break Even Point Table_ 16:Break Even Point
# Particulars 1st Yr. 2nd Yr. 3rd Yr. 4th Yr. 5th Yr. 6th Yr. 7th Yr. 8th Yr. 9th Yr. 10th Yr.
1 Calculation of B.E.P.
Variable Cost 19.08 19.16 19.25 22.13 22.23 22.33 25.46 25.58 26.40 28.32
Fixed Cost 60.05 59.38 57.93 56.70 55.68 54.86 54.25 54.92 56.69 58.63
2 Break Even Point (B.E.P.) 76.55% 75.77% 74.01% 59.75% 58.73% 57.93% 48.10% 48.75% 50.68% 46.80% Average B.E.P. 59.71%
d) Projected Balance Sheet for the Project (10 Year) Table_ 17:Projected Balance Sheet
# Description Construction
Period
Operation Period in Years
0 1st Yr. 2nd Yr 3rd Yr 4th Yr 5th Yr 6th Yr 7th Yr 8th Yr 9th Yr 10th Yr
1 Liabilities
1.1 Equity 40.76 40.76 40.76 40.76 40.76 40.76 40.76 40.76 40.76 40.76 40.76
1.2 General reserves 0 15.61 31.47 48.42 78.02 108.42 139.50 183.84 227.81 270.17 320.77
1.3 Debt 99.84 99.84 83.04 66.24 49.44 32.64 15.84 0.00 0.00 0.00 0.00
1.4 Current Liabilities 0.00 0.46 0.51 0.50 0.50 0.50 0.50 0.50 0.50 0.50 0.50
1.5 Working Capital Loan 0.00 6.33 6.33 6.33 6.33 6.33 6.33 6.33 6.33 6.33 6.33
Total Liabilities 140.59 163.00 162.10 162.25 175.05 188.65 202.93 231.43 275.40 317.76 368.37
2 Assets
2.1 Gross Fixed Assets 136.08 136.08 136.08 136.08 136.08 136.08 136.08 136.08 136.08 136.08 136.08
2.2 Accumulated Depreciation 0 12.79 24.23 34.46 43.62 51.82 59.16 65.74 71.64 76.92 81.66
2.3 Net fixed assets
(2.01-2.02)
136.08 123.28 111.84 101.61 92.45 84.26 76.91 70.33 64.44 59.15 54.41
2.4 Preliminary Expenses 0.50 0.45 0.40 0.35 0.30 0.25 0.20 0.15 0.10 0.05 0.00
2.5 Pre-Operative Expenses 4.02 4.02 3.57 3.13 2.68 2.23 1.79 1.34 0.89 0.45 0.00
2.6 Current Assets 0.00 14.49 16.56 16.56 16.56 16.56 16.56 16.56 16.56 16.56 16.56
2.7 Profit & Loss Account 0.00 0.00 0 0 0 0 0 0 0 0 0
2.8 Cash & Bank Balance 0.00 20.76 29.73 40.60 63.06 85.36 107.47 143.05 193.41 241.55 297.40
Total Assets 140.59 163.00 162.10 162.25 175.05 188.65 202.93 231.43 275.40 317.76 368.37

Investment Opportunity Study 2020 Project Profile: Multi-product Kiosks Services,
Bhutan
Page | 226
Conclusion
The proposed Kiosk Services on rental is a viable project in terms of common facility
for people of Bhutan. The project needs use of electricity and manpower to operate
the machines and material handling.
Anyone can use the services by kiosk and can save time to wait in the long queues.
The service provided can earn a handsome amount of money by providing this service
to common people of Bhutan without investing much. One can establish these services
only from one office and service centre for maintaining the kiosk.
The positive Return on Investment and user-friendly nature of self-service kiosks has
boosted its popularity making it exist in every sphere of our lives. Bhutan is a very good
market to start these types of services in different places.
Working capital mainly consisting of the amount required to purchase the kiosks. The
means of finance can be sharing between the investor and a bank loan. Required
margin money for this project is Nu. 384,000. The rate of return is 22.82% with BEP of
53 months.
The project is financially viable with a net profit ratio of 36.42%. It needs around 11
employees including managerial staff, skilled and unskilled staff to operate the plant.
A dedicated post graduate marketing executive is required to manage marketing,
supply chain management and revenue collection.
The average DSCR is 2.17 which implies that the project generates sufficient funds to
cover its cost, including loan repayments and interest payments during the period. This
also indicates that the project can continue making profits and is recommended as a
viable project in Bhutan.
References
• www.indiamart.com/proddetail/utility-bill-payment-kiosk-machine-19000028312.html
• www.indiamart.com/proddetail/posiflex-self-service-kiosk-19942429162.html
• www.indiamart.com/proddetail/self-ordering-kiosk-qsr-machine-22363281297.html
• www.indiamart.com/proddetail/condom-box-vending-machine-6823373333.html
• www.indiamart.com/proddetail/automatic-sanitary-napkin-vending-machine-
9357467812.html
• www.indiamart.com/proddetail/snacks-vending-machine-19233066162.html
• www.indiamart.com/proddetail/fruit-vegetable-vending-machine-22324816988.html
• www.indiamart.com/proddetail/softy-vending-machine-15064429662.html
• www.indiamart.com/proddetail/swayam-anytime-health-monitoring-kiosk-
21584364791.html
• www.indiamart.com/proddetail/fully-automated-blood-pressure-kiosk-18340599591.html

Investment Opportunity Study 2020 Project Profile- Car Detailing and Certified Resell
Page | 227
Project Title: Car Detailing and Certified Resell

Investment Opportunity Study 2020 Project Profile- Car Detailing and Certified Resell
Page | 228
Car Detailing and Certified Resell Services
Background of the Idea
The growth in Bhutanese economy is directly reflected through the increase in car sales
in the automobile industry. The number of vehicles has increased tremendously over
the years. Figure_ 1:: Light Vehicle Growth in Bhutan
The sharp drop in vehicle imports in 2102 and 2013 can be attributed to the ban on
vehicle import due to current account deficits and the accompanying shortage of
Indian Rupee. Although the growth rate increased from 2014 despite the increase in
tax (which could be attributed to lifting vehicle ban), the number has gradually
decreased since then (Growth Rates; 2015-14%, 2016-14%, 2017-10%, 2018-9%).
Rationale of the Idea
The Bhutan Living Standard and Survey (BLSS) 2017, show that only 23% of Bhutanese
households owned a family car. The remaining 77% of households did not own a family
car. Table_ 1:Percent of HH owning Family Car (BLSS 2017)
1Quintile
(Poorest)
2 Quintile 3 Quintile 4 Quintile 5Quintile
(Richest)
3.2 10.6 17.9 31.8 53
As seen above, there is still a great disparity between the percentage of vehicles owned
between 2nd and 3rd Quintile and the 4th and 5th Quintile. While the factor of growing
income and easy credit access has been the contributing factor for the upper two
quintiles, for others, it is still a constraint to purchase brand new vehicles.
Further, the increasing issues of Non-Performing Loans and COVID-19 will possibly
result in lower access to credit facilities. The growing concern on air quality due to
0%
5%
10%
15%
20%
25%
0
20,000
40,000
60,000
80,000
100,000
120,000
Total Number of Vehicles Number of Light Vehicle Growth Rate (LV)

Investment Opportunity Study 2020 Project Profile- Car Detailing and Certified Resell
Page | 229
vehicle emissions is compelling policy makers to discourage the use of vehicles
powered by fossil fuels which could come in terms of increased taxation thereby
making imports more expensive1.
All of these factors contribute in creating a higher demand for the second-hand car
market which has considerably developed itself in the form of formalized car
brokerage business since 2012. However, the cars are sold usually in as-is condition
without detailing and improving its feel and looks.
Market Outlook International2
The Indian used car market was valued at USD 24.24 billion in 2019, and it is expected
to register a CAGR of 15.12% during the forecast period (2020-2025).
• Recently, the used car market in India evolved with the growth of the organised
and semi-organised resell sector. The pre-owned car or used car market crossed
the 4 million units mark in FY 2018, which states that the used car market is 1.3
times the new car market. One of the key growth drivers of the market is the
revision of the GST rate on used cars from 28% to 12-18%.
• As the Indian auto industry is entering the BS-VI era from April 2020, the value
proposition of used cars can grow more robust, as new cars are expected to
become expensive due to additional technology costs. Additionally, according
to the MD and CEO of Mahindra First Choice Wheels (MFCW), the companies'
focus on reducing the production of diesel cars, like Maruti Suzuki's decision to
exit the diesel car segment by April 2020, is also expected to increase the
demand for compact diesel cars in the used car market, unless there is a
backlash against diesel cars.
• Factors, such as standardized dealership experience, good price experience, and
high financing cost for used cars, may hinder the growth of the used car market.
Some of the major players dominating the market are OLX, Mahindra First
Choice Wheels, Cars24, Maruti True Value, and Hyundai H Promise, among
others.
The Concept
1.4.1. Core Business Areas
The core business of Car Detailing and Resell will involve the following scope:
1 In 2018, the total fuel import bill at 10.276 billion closed in with hydro exports at Nu. 10.578 billion
with a nominal gap of Nu. 301 million 2 https://www.mordorintelligence.com/industry-reports/india-used-car-market
Investment Opportunity Study 2020 Project Profile- Car Detailing and Certified Resell
Page | 230
i. Purchase of second-hand vehicles
ii. Repair and Detailing
iii. Reselling
Alternatively, the business can also cater to car owners who only want the detailing
service or other car brokers. The service is unique to conventional car repair workshop
which only repair a specific damage and not overhaul the looks and quality of the cars.
a) On Car Detailing
▪ Exterior Services
Complete exterior detailing including washing the vehicle, claying the paint,
removal of all bugs & tar followed by paint correction (scratch removal) will
prepare the vehicle of cleaning and polishing the finish. During this operation
all exterior rubber trim and tires will be dressed to like new condition.
▪ Interior Services
The interior of the vehicle will be purged of all loose material carpets, seats
miscellaneous upholstery will be spot treated shampooed and deep cleaned
with a special heated extractor.
▪ Engine Cleaning & Dressing
Engines will be cleaned using the finest products to remove grease and grim
from the surfaces. A special non-silicone dressing will be applied to ensure a
bright clean surface for a long time.
1.4.2. Certified Car Resell
The business can establish itself as a premium seller of used cars. The USP would be
certifying the used cars after a complete detailing. This is a growing industry around
the world and a particular example of the business model can be drawn from
companies such as Mahindra First Choice, Zig wheels, Budget Preowned Cars among
others.

Investment Opportunity Study 2020 Project Profile- Car Detailing and Certified Resell
Page | 231
Figure_ 2:Car Detailing and Certified Resell Service Provider
1.4.3. Unique Selling Point (USP)
The business would have to leverage on the concept of ‘Certified Resell’. This will
require a proper due diligence in preparing the contract documents detailing specific
coverage of the certification and the conditions on the warranty. The business should
not make false promises to ensure that both parties are satisfied and the brand name
is not damaged.
▪ Existing Competitors
The number of automobile workshops are to the tune of about 450 while there
are about 35 brokerage service firms who deal in buying and selling of used car.
However, the concept of Certified Used Car Services is brand new in Bhutan.
▪ Expected Customer Number
Projections are made under conservative assumptions of about 1,000 vehicle
transaction in a year. The proposed business unit would cater to 3 cars in a week
totalling to 144 cars in a year.
▪ Equipment Requirement
The following plant, machinery and equipment are required for the proposed
project presented with some idea of price. Table_ 2:List of Equipment
# Particular Qty. Rate (Nu. In
Lacs)
Value (Nu. in Lacs)
1 Car Washer– Tunnel 1 6.50 6.50
2 Hydraulic Lift 2 1.50 3.00
3 Car Painting Unit (this includes Compressor, Spray
Guns, HVLP Systems, accessory equipment, etc.
2 3.50 7.00

Investment Opportunity Study 2020 Project Profile- Car Detailing and Certified Resell
Page | 232
2 Vacuum Cleaner (Carpet Extractors) 1 0.45 0.45
3 Wax polishing Machine Set (Rotary Polisher Kit -3) 1 0.10 0.10
4 Tools and Spanners sets, jack and small pneumatic
tools
1 0.25 0.25
5 Random Orbital Polishers LHR21ES 1 0.28 0.28
6 Vapor Steamers (Vapor Prof II Stem Cleaner) 1 0.30 0.30
7 Pressure Washers - Bosch 1 0.40 0.40
8 Water Tanks 4 0.08 0.32
9 Foam Guns (4 Types) 1 0.10 0.10
10 Air Compressor, Air Movers & Dryers 1 0.48 0.48
11 Ozone Generators 1 1.80 1.80
12 Cleaners Pads and Sealant 1 0.10 0.10
13 Wipers and Brushes 1 0.10 0.10
14 Misc. 1 0.50 0.50
Equipment Cost (Nu. in Lacs) 21.68
1.4.4. More Details
More details on this business idea can be found from the following sources and videos
for better understanding: Table_ 3:Reading Materials & Videos
Reading Materials Videos
https://publish.manheim.com/content/dam/consulting/
2017-Manheim-Used-Car-Market-Report.pdf
https://www.cars.com/cpo/
https://www.edmunds.com/car-buying/certified-pre-
owned-cars-a-reality-check.html
https://www.youtube.com/watch?v=oRxP
GC8QTxk
http://www.rsta.gov.bt/rstaweb/load.html?id=82&field_
cons=MENU
a) Other Requirements
• Land: About 1,000 m2
• Manpower of 15 people which includes:
o Manager
o Accounts and Administration
o Lawyer
o 4- Mechanical Section
o 4- Detailing Section
o 2- Painting Section
o 2- Marketing and Resale Section
1.4.5. Basic Financial Calculations
The calculation is based on fairly conservative values of selling 100 cars in a year with
a minimum profit margin of Nu. 50,000 per car. This is a realistic amount as vehicle

Investment Opportunity Study 2020 Project Profile- Car Detailing and Certified Resell
Page | 233
brokers, without any value addition, charge about 5% transaction fee (assuming a mid-
range car of Nu. 500,000 value, the cost is Nu. 25,000).
Other assumptions include;
• Salary of Nu. 25,000 per employee
• Overhead cost of 15% of the Salaries Cost
• No variable cost is taken as it would depend largely on the condition of the
vehicle
• No cost on purchase is taken as the vehicle would be resold thereby inclusive
of the cost price plus repair and maintenance cost
• The BEP in months is 15 months and 174 units. Table_ 4:Basic Financial Calculations
Particulars Description Amount in Nu.
Equipment Cost 21,68,000
Fixed Cost 5,175,000
Salaries (15 people) 4,500,000
Overhead Cots (15%) 675,000
Variable Costs NA
Cannot be determined as it will depend
on the type of vehicle
Profit Margin Assuming 100 cars with Nu. 50,000
MPM
7,000,000
Break Even Units 173.50
Break Even Months 15
Annual PAT after BEP 1,825,000
Annual PBT after BEP 1,277,500
Conclusion
As the economy has improved and disposable income has increased in Bhutan, people
are purchasing new cars as well as used cars. To maintain car performance and
appearance, car detailing industry in Bhutan has bright prospects and good business
opportunity.
Consumer attitudes to maintain the car has become more sophisticated as vehicles
have improved in quality and reliability. While these changes involve significant
financial investments, they hold the potential for great returns and are, in fact,
necessary in today’s market.
Car detailing businesses offer meticulous cleaning services that include a car’s exterior,
interior, and underside. Detailing a car offers many benefits, making it an appealing
Investment Opportunity Study 2020 Project Profile- Car Detailing and Certified Resell
Page | 234
service to many vehicle owners. Regular detailing helps to protect drivers from germs
and allergies while also helping to maintain the vehicle’s condition.
Vehicle owners often have a car detailed just before selling it, since a clean car has a
higher resale value than a dirty vehicle. It’s an eco-friendly business activity but needs
to follow rules as per guidelines issued by the National Environment Commission.
The suggested business is covered under small scale sector and suggested viable with
good opportunity for entrepreneurs.
Source of equipment
The equipment required for car detailing are available in India. These can be purchased
from Kolkata, New Delhi, Ahmedabad and Pune. Some supplier names are as follows:
▪ New Age Cleaning Solutions
P 88 5 Hellen Keller Sarani, New Alipur
Kolkata - 700053, West Bengal, India
Mobile: 092300 68081
Email: Infor@ newagecleaningsolutions.in
Website: www.newagecleaningsolutions.in
▪ Auto Global Equipment’s
Yesh Bhardwaj
A- 20, Ground Floor, Gazipur Village
New Delhi - 110096, Delhi, India
Mobile: +91-9716510236
Email: [email protected]
Website: https://autoglobalequipments.com/
▪ AutoFresh.in
204, Siddhi Vinayak Platinum,
Althan Bamroli Road, Surat - 394 220, Gujarat, India
Mobile: +91 98256 04000
Email: [email protected]
Website: autofresh.in
▪ GreenZ Car Care India
#21, Baglur Road, Hosur, Tamilnadu, India
Mobile: +91 80 5688 5999 / +91 89 2910 0699
Email: sales @ greenzcarcare.com
Website: greenzcarcare.com

Investment Opportunity Study 2020 Project Profile- Car Detailing and Certified Resell
Page | 235
▪ Treo Engineering Private Limited
Plot No. A-54/55, 2nd Floor, H-BLOCK, MIDC, Pimpri, Pune – 411018
Mobile: +91-840-800-2080/40
Email: [email protected]
Website: www.treo.co.in

Investment Opportunity Study 2020 Project Profile: Financial Consulting for
Investments and Market Research
Page | 236
Project Title:
Financial Consulting for Investments and Market
Research

Investment Opportunity Study 2020 Project Profile: Financial Consulting for
Investments and Market Research
Page | 237
Financial Consulting for Investments and Market Research
Background of the Idea
Bhutan has a stable political and economic environment. It maintains substantial
growth and macroeconomic stability with decreasing poverty and improvements in
human development indicators, i.e. single-digit inflation, a steady exchange rate, and
accumulating international reserves attest to the stability.
Around 56 licenses have been issued in Bhutan under consultancy category. These
consultancy companies are working in different sectors as Civil Infrastructure,
Architectural Design, Energy and Hydropower and Audit consultant. The "Rinzing
Financial Group” (RFG), “Bhutan Consultancy Services” and “Taxoservice" are the
prominent names among Financial Audit firms in Bhutan. Audit firm's need mandatory
registration in the department of "Royal Audit Authority of Bhutan".
“APECS consultancy”, “Bhutan Interdisciplinary Research & Development (BIRD)” and
“Bhutan Marketing Agency” are providing services in market survey and research
segment. Most of them are based in Thimphu.
The available services are limited to tax audit, risk, internal audit and corporate finance,
due diligence and compliance audit, tax accounting and Bhutan tax advisory etc.
Quality Services, and Integrity and Confidentiality are the core strengths of consultancy
companies in Bhutan. Consultants are committed to raising the standard of data
security and compliance to the highest level in the industry.
Rationale of the Idea
Bhutan's GDP was expected to grow by 5.2% in 2020 and 5.8% in 2021 as per the report
by Asian Development Bank titled ‘Economic indicators for Bhutan: A Fact Sheet’. The
Gross Domestic Product (GDP) in Bhutan was worth USD 2.53 billion in 2018, according
to official data from the World Bank and projections from Trading Economics.
The country is famous for its unique philosophy – Gross National Happiness (GNH) –
which guides its development. Abundant water resources create ideal conditions for
hydropower development which has spurred economic growth. Fiscal revenues from
hydropower has helped large finance investments in human capital which led to
significant improvements in service delivery and educational and health outcomes.

Investment Opportunity Study 2020 Project Profile: Financial Consulting for
Investments and Market Research
Page | 238
The current national literacy rate is 71% and the youth literacy rate is 93%. Bhutan has
maintained its course of sustainable public finances, with the fiscal deficit estimated to
have reduced to 2.1% of GDP in FY2019, from 4.6% two years prior.
The overall scenario is the economic development is on a progressive path, and many
of the schemes and funded projects are in the pipeline. In Bhutan, a prospective FDI
investor needs to conduct an in-depth study on various aspects such as customer,
market scenario, feasibilities, approval of government licenses, economic and social
points.
To understand the various schemes, fund flow mechanism and monitoring to budget,
it is crucial to provide helping hand to entrepreneurs, start-ups and people and as
such, an advisory consultancy company in Bhutan is viable who can offer quality
services in an integrated manner.
Market Outlook International
Along with Financial Institutions, international organizations such as the World Bank
Group, Asian Development Bank (ADB), SAARC, UNDP, UNIDO, FAO, WHO and WTO
also provide grants and project funds for economic development in Bhutan.
Government of Bhutan also has bilateral relations with Government of India, Japan,
South Korea, Vietnam, Turkey, Armenia, Egypt, South Africa, European Union, Canada,
Australia, New Zealand, Switzerland, Monaco, Cuba and Brazil.
Government of Bhutan is also dedicatedly providing support to develop
sustainable industrial development. The service sector is also growing by the day.
The Concept
Under the Investment opportunity study, a suggested business plan is titled "Financial
Consultant for Investments and Market Research" under the service sector – Cottage
segment. A key constraint to private investment and micro, small and medium
enterprise growth in Bhutan includes access to, and the cost of, finance.
A Financial and Marketing company and its consultant will be well familiar with
Bhutanese financial and economic scenarios and business environment, industry
knowledge for Private Sector Development, Public-Private Partnerships and Foreign
Direct Investment in Bhutan.
Company will help individuals and small businesses manage and grow their wealth.
They are more likely to service individuals than large corporations, but small business
will also be prepared even at the village level. Marketing research can be defined as
the development, interpretation and interaction of decision-oriented information to
be used in all phases of the marketing process.

Investment Opportunity Study 2020 Project Profile: Financial Consulting for
Investments and Market Research
Page | 239
Managers require information to introduce products and services that create value in
the mind of the customer. Marketing research involves researching to support
marketing activities and the statistical interpretation of data into information.
This information is then used by managers to plan marketing activities, gauge the
nature of a firm’s marketing environment and attain information from suppliers.
Becoming a financial consultant requires a college degree in commerce and work
experience, and must be registered with the Royal Audit Authority of Bhutan.
The consultancy company needs a mix of human resource from multiple professional
backgrounds. These individuals ought to possess personal knowledge and skills
earned from their several longstanding experience.
Financial Consultant
Expected Services from the proposed business outlet:
➢ Banking and Fund Management Services.
➢ FDI Bhutan Entry services covering tax and legal advisory, registration,
monitoring and reporting.
➢ Legal services such as due diligence, shareholder agreements, and other
Bhutanese law advisories.
➢ Transaction including IPOs and other public offerings, transaction tax, mergers
and acquisitions and PPP Projects.
➢ Advisable services on how to avail bank loans, manage the credits productively
and fruitfully and also act as trusted loan counsellor be it on a personal loan,
business loan or project loans in Bhutan.
➢ Consulting services not only on investments but also savings, budget, insurance,
and tax strategies.
➢ Constructing personalized financial plans that aim to achieve the financial goals
of clients.
➢ Monitoring services regularly to re-evaluate their current situation and future
goals and plan accordingly.
➢ Liquidation and Valuation.
➢ Financial Reporting Advisory Services - Financial Statement Audit and
Attestation Services.
➢ Risk Analysis – Global Mobility Services.
Market Management and Research
A consultant helps create a detailed marketing plan, determine a business's marketing
message, and identify the appropriate marketing mix to get the message out to the
target market. Some of the offered services are as follows:

Investment Opportunity Study 2020 Project Profile: Financial Consulting for
Investments and Market Research
Page | 240
➢ Preparation of Project Proposals
➢ Preparation of Detailed Feasibilities Reports
➢ Preparation of Procurement Plan
➢ Consultancy for implementation of Quality Management System Impact
Assessment Evaluations and Consultancies
➢ The market research report delivers insight across a wide range of crucial factors
such as market size, growth drivers, competitive landscape, trends, and
forecasts
➢ Data collection solutions, One to one survey, data management and statistical
analysis, policy review and analysis, and research studies etc.
➢ Business plan, Joint Venture, technological and financial tie-up with overseas
partners for successful implementation of the business blueprint
➢ Market dynamics, identify new opportunities or increase profitability through
management reforms (time, money and people)
➢ Strategic Growth Consulting, Market Entry Strategy, Capital Investment
Analysis, Opportunity Screening, and Target Screening
➢ Campaign Assessment Survey
The Financial and Marketing consultancy company provides core high-value market
research and advisory services. Also, it provides its customers with to help them
identify new market opportunities, growth engines and innovative ways to capture the
market share.
Company will work through close collaboration with Government Organisations,
Departments, International Agencies, Non-Governmental Organizations, and Civil
Society Organisations.
Business Structure and Required Sources
The proposed consultancy company will work under the service category and needs
higher working capital instead of capital investment. Arrangement of human resources
and experts are the main cost-sharing head of working capital. A fully furnished office
of 600 sq. ft. carpet area with modern office amenities is required to operate the
business. It needs laptops, online survey tools, IOS survey equipment, cameras & stuff.
The initial need for human resources is as follows: Table_ 1:Required Experts and Human Resources
Proposed Staff (12) Qualification
Financial Consultant (1) PG in Finance, Business Management,
Economics or related field.
Marketing Consultant (1) MBA- with more than ten years'
experience
QMS Expert (1) Engineering Graduate and CA
Product Marketing Expert (1) MBA – Marketing Management
Investment Opportunity Study 2020 Project Profile: Financial Consulting for
Investments and Market Research
Page | 241
Tele Networking (1) Expertise in mass communication
Survey Manager (1) Post Graduate
Enumerators (2) Graduate
Data Compiler and Documentation (1) Graduate and Certification course in
Microsoft office tools
Reception (1) Female – Graduate
Chauffeur (2) Literate with valid Driving Licenses
Basic Financial Calculations
Revenue collections under the above services are based on fee structure on a case-to-
case basis. It will be collected from company activities based on fees charges and on a
percentage basis (ranges from 1% to 8.5% of project cost) and calculated in the
involvement of the consultant, human resource and infrastructure.
The calculation is considered under the following assumptions:
• Cost of services is reasonably estimated as of Nu. 500,000 per month.
• Salary of Nu. 50,000 for the manager and 35,000 for executives and Nu.15,000
for Support Staff. The requirement of 12 experts would be in an initial start-up
for business enhancement.
• The overhead cost would be 20% of the Salaries Cost.
The primary financial calculation is as follows:
Table_ 2:Basic Financial Calculation and Financial Projections
Particulars Details Nu.
Establishment Cost 1,375,000
Fixed Cost 4,320,000
Salaries (12 people) 3,600,000
Overhead Cots (20%) including utility bills 720,000
Variable Costs NA
Cannot be determined as it will depend on
the type of service
Profit Margin Per month revenue collection of Nu.5 Lacs
per month
6,000,000
Break-Even Months 12.00
Annual PAT after BEP 1,680,000
Annual PBT after BEP 1,176,000
Market Bhutan Industrial as service sectors,
International investors, New Entrepreneurs,
Startup companies etc.
Suggested Management
System
Quality Management ISO 9001:2015

Investment Opportunity Study 2020 Project Profile: Financial Consulting for
Investments and Market Research
Page | 242
More Details:
More details on this business idea can be extracted from the following sources for
better understanding:
Table_ 3:Web Sources for further References
References
www.adb.org/countries/bhutan/main
www.bt.undp.org,
www.worldbank.org
www.indembthimphu.gov.in
http://blog.meritusindia.com/2012/07/12/emerging-trends-in-indian-management
consulting-2/ Nature Thoughts & Symmetry
https://www.statista.com/statistics/527240/gross-domestic-product-gdp-in-
bhutan/#:~:text=GDP%20is%20an%20important%20indicator,around%207.94%20
billion%20international%20dollars.
Conclusion
Bhutan is on a progressive economic path. The government is keen to provide financial
support to people of Bhutan through its financial institutions and banks. It is also
committed to sustainable domestic industrial development and foreign direct
investment policy of Bhutan. International organisations are also active in Bhutan and
consultancy business is growing by the day.
Ordinary people, new entrepreneurs, existing industries, national as well as
international organisations and interested investors need local support to implement
their goals. Thus, the opening of a Financial Consultant for Investments and Market
Research Company is a Business Opportunity and a viable project under service
segment.

Investment Opportunity Study 2020 Project Profile: Domestic Tourism Company
Page | 243
Project Title: Domestic Tourism Company

Investment Opportunity Study 2020 Project Profile: Domestic Tourism Company
Page | 244
1. Domestic Tourism Company
1.1. Background of the Idea
Dwelling on its tourism industry, Bhutan attracts many travellers from across the globe
because of its untouched mountains, serenity, and vibrancy. The Punakha Dzong-
arguably the most beautiful Dzong in the country, Trashichhodzong, the Paro Dzong
and the Taktshang Monastery, also known as the Tiger's Nest Monastery, are the main
attractions of the country.
The country has been consistently nurturing the tourism sector as an important source
of government revenue through well laid out plans and clearly defined policy
objectives.
However, such planning is limited to only international tourism market as very limited
attention is given towards domestic tourism market in Bhutan by authorities,
communities, and academicians.
There is a significant demand for rural tourism in the country and given the fact that
majority of the tourists are satisfied with the supply of rural tourism products. The ‘high
value, low volume’ policy controlled the number of tourist arrivals in Bhutan. Tourism
in Bhutan is mostly limited to western and central valleys for cultural tours, while the
social costs are borne by the people throughout the country.
The Bhutanese government has undertaken projects to introduce ecotourism in certain
conservation areas like the Phobjikha valley, a winter habitat to the endangered black-
necked crane and the community-based tourism trial in Nabji-Korphu in Trongsa.
People are not aware about their own culture and tourism scenario.
1.2. Rationale of the Idea
During this IOS study survey, respondents replied that domestic tourists could easily
pay around Nu. 5,000 -10,000 for a two-day one-night tour program. These has the
potential to become an attractive tourism package. They commented that no tour
companies are available in Bhutan who is dedicatedly working to promote domestic
tourism. Private car is the most popular choice of transport to domestic tour
destinations. Group tours are also liked but in limited numbers. Domestic tourists
prefer hotel stay but night stay in camp sites is also preferable if provided.
One respondant noted Bumthang to be the most beautiful place in Bhutan offering
interesting religious attractions. Owing to the valley’s pristine backdrop, natural
abundance, laid-back ambience, warm-hearted locals, and pleasant climate, Bumthang
can also be called as the ‘Shangri-La of Bhutan’. It has a great potential for domestic
tourism. A package of 3-4 days domestic tourism could be arranged to offer local

Investment Opportunity Study 2020 Project Profile: Domestic Tourism Company
Page | 245
sightseeing, spiritual tours, trekking, attend festivals etc. Similarly, there are several
prospects all over Bhutan for domestic tourism.
1.3. The Concept
Bhutan tourism potential is diversified in many areas as possible to ensure economic
growth and diversification. Culture tourism, eco-tourism and adventure/sports
tourism- (rafting, canoeing and climbing) offer numerous opportunities and
attractions. Local tourist also wants to enjoy these during holidays and during the
movement through one Dzongkhag to another. Numerous pilgrimages sites exist in
multiple places and there are annual religious festivals, hundreds of natural wonders
including hot springs, village culture life, different dishes and locals miss such
attractions in the absence of local tourism packages.
In conclusion, there is an ardent need and demand for a tour company completely
focussed on providing local tourism services for local tourists.
1.4. Some of domestic travel packages could focus on
• Offering holiday packages
• Offering nature-based recreational such as hiking, trekking, nature watching,
rafting, hot spring/stone bath and other related activities etc.
• Tour Packages for cultural, pilgrimage and festive activities
• Offering travel packages to attractive local destinations
Following services and tour packages will be provided by domestic tourism company:
1. Car Rental and Traveller Coach Rental Services
2. Domestic Air Ticket – Paro to Gelephu and Bumthang
3. Luxury Tour Packages - Destination based.
4. Picnic Spot Preparation
5. Pre–wedding photography trips and Honeymoon Packages
6. Educational and Research Tours
7. Snowman Trek and Mountain Trekking Tour
8. National Park Tour Packages
9. Enjoy Festival Package
10. Best Monastery Package
11. Community-based Village and Agriculture Tour Package

Investment Opportunity Study 2020 Project Profile: Domestic Tourism Company
Page | 246
12. Hotel and Homestay Booking
13. Traditional Food and Lifestyle Packages
14. Breath-taking Adventures
15. Mountain Biking Trails Along with Camp Accommodation
16. Bicycling Tour
17. Bird Watching and Fishing
18. River Rafting and White-Water Sports
19. Medicinal Springs – Gasa Tour Package
20. Spiritual and Meditation Tour Packages
21. Cultural Programs and Events
22. Traditional Medicines and Healing Tour Packages
23. Packages for Youth Sports Festivals and Camps
24. Bhutan Handicraft and Heritage
25. The company could provide camping services, trekking suites, and bicycles along
with escorted trip accompanied by experienced travel executives specializing in
remote trekking, exploration and mountaineering.
26. The productive target age population could be between 20-59 years and the
population in this group is about 405,667 people constituting 56% of total
population of Bhutan. These are the most movable people across the country.
The main active population under age group is as follows:
Table_ 1: Percentage Distribution of Population by Age Group of 20 -54 Years and Sex, Bhutan 2017
# Age Group Male % Female % Total
Population
1. 20-24 41,075 54.5 34,340 45.5 75,415
2. 25-29 42,802 54.0 36,478 46.0 79,280
3. 30-34 35,059 53.8 30,121 46.2 65,180
4. 35-39 29,689 53.4 25,860 46.6 55,549
5. 40-44 22,274 53.7 19,221 46.3 41,495
6. 45-49 18,865 53.1 16,668 46.9 35,533
7. 50-54 15,456 52.7 13,861 47.3 29,317
8. 55-59 15,456 52.7 13,861 47.3 23898
Total 205,220 176,549 405,667

Investment Opportunity Study 2020 Project Profile: Domestic Tourism Company
Page | 247
Some attractive destinations for local tourists include:
# Tourist Node
1. Lamperi (Thimphu) 13. Chelela (Paro)
2. Phobjikha Valley (Wangdue) 14. Dochula (Thimphu)
3. Buli (Zhemgang) 15. Dzomlithang (Punakha)
4. Gelephu (Sarpang) 16. Chorten Kora and Gom Kora
(Trashiyangtse)
5. Diana River (Samtse) 17. Serbithang (Thimphu)
6. Toorsa River (Chukha) 18. Ramtokto (Thimphu)
7. Bumthang Valley (Bumthang) 19. Debsi (Thimphu)
8. Yonphula (Trashigang) 20. Panbang (Zhemgang)
9. Bumdeling (Trashiyangtse) 21. Gasa Tsachu (Gasa)
10. Merak and Sakteng (Trashigang) 22. Gedu (Chukha)
11. Shaba (Paro) 23. Dewathang (Samdrup Jongkhar)
12. Bondey (Paro) 24. Sipsoo (Samtse)
1.5. Unique Selling Point (USP)
The services would have to leverage on the concept of ‘Domestic Tourism” and a
company focussed on local tourism targeting local tourists in much wanted in Bhutan.
There is enough market for such a company.
1.5.1. Equipment Requirements
Following equipment are required for the proposed project Table_ 2: Cost of Equipment
# Particulars Qty. Rate
(Nu.)
Amount (Nu.in
lacs)
1. Desk top Computer Printer and Photo Copier
Machine
2 58000 1.16
2. Aluminum Patrician, Furniture & Fixture with Interior 1 100000 1.00
3. IT Equipment’s - Mobile and IOS 1 30000 0.30
4. Fire Fighting Equipment’s 1 2000 0.02
5. Fixed Rope/ Climbing Rope/ Ascender (Jumar) 4 7000 0.28
6. Tent/ Sleeping Bags/ Climbing Backpacks 4 12000 0.48
7. Crampons/ Mountaineering/ Climbing Boots 6 8000 0.48
8. Gas Stove/ Gas Fuel 4 4000 0.16
9. Mattress 6 600 0.04
10. Carabiner/ Tape Slings/ Helmets 6 4500 0.27
11. Ice Screw/ Ice Axe/ Harness/ Trekking Poles/ Ski
Poles/ Snow shovel
4 7000 0.28
12. Belay Gloves Ski Goggles/ Headlamps 6 4000 0.24

Investment Opportunity Study 2020 Project Profile: Domestic Tourism Company
Page | 248
13. Large Thermos/ Water Bottle/ Cooking Pots and
Equipment
4 6000 0.24
14. Mountaineering Jackets/ Waterproof Trousers 6 4000 0.24
15. First Aid Kit 5 2000 0.10
16. Vehicle - CAR 2 550000 11.00
Total 16.29
1.5.2. Other Requirements
• Land: About 300 sq. ft. with three floors and outdoor playing area
• Manpower of 9 people which includes;
• Tour Operator Manager
• Receptionist
• Office Assistant Caretaker
• Tour Guides
• Driver
1.6. Basic Financial Calculations
The calculation is based on fairly conservative values considering 30 tours in a month
with an average charge of Nu. 15,000 per tour which will translate to a business of Nu.
5.4 million in a year.
1.6.1. Other assumptions include:
• Salary varies as per the designation of employee
• Overhead cost of 15% of the Salaries Cost
• Variable cost is Nu. 198,000 which includes consumables and miscellaneous
items.
• The BEP in months is 9 months and 271 units.
Particulars Description Amount in
Nu
Establishment Cost 1,450,000
Operation Cost 2,613,000
Fixed Cost 2,415,000
Salaries (9 people) 2,100,000
Overhead Cots (15%) including utility bills 315,000
Variable Costs 198,000
Consumables 180,000
Misc. 18,000
Profit Margin (Revenue
Generation)
Intake of 30 Tour Services per month
charges @15000 per Tour
5,400,000
Break Even Units (Production) 271
Packages
Break Even Months 9 Months

Investment Opportunity Study 2020 Project Profile: Domestic Tourism Company
Page | 249
Annual Profit Before Tax 1,337,000
Annual Profit After Tax 935,900
1.7. Conclusion:
The tourism sector needs diversification and there is a serious need to promote local
tourism. As such, there is enough market and ample opportunities for a company
focussed entirely on local tourism targeting local tourists. The Covid-19 pandemic has
also shown the importance of promoting local tourism.
Domestic Tourism services are very much feasible in Bhutan and it is a very good
business proposal in terms of profitability and also for the local people of Bhutan. The
BEP is marked as 9 Months with annual profit after tax Nu. 935,900. It shows that
project will generate sufficient funds. It is suggested as a viable project under cottage
service sector.
The project cost for 30 tours per month is about Nu. 1.5 million.
More Details:
More details on this business idea can be found from the following sources for better
understanding:
References
www.tourism.gov.bt/uploads/attachment_files/tcb_jJocRL3Q_The%20Druk%20Journ
al%2010.pdf
www.tourism.gov.bt
www.esikkimtourism.in/bhutan/destination/bumthang/
https://www.esikkimtourism.in/bhutan/destination/bumthang/
Bhutan IOS -2006
http://www.nsb.gov.bt/publication/files/PHCB2017_national.pdf
Dzongkhag web portals

Investment Opportunity Study 2020 Project Profile: Domestic Tourism Company
Page | 250
1.8. Annexure:
Prominent Dzongkhag wise attractions are as follows:
# Dzongkhags Attractions View
Western Region:
1. Thimphu Trashichho Dzong, Changangkha
Lhakhang, Tango Goemba, National
Memorial Chorten
Motithang Takin Preserve, Dechen
Phodrang
2. Paro Rinpung Dzong, Chumphu Ney, Kichu
Monastery, Paro Museum, Rinpung Dzong
3. Haa Wangtsa Lhakhang, Lungkha Lhakhang,
Bali Lhakhang Ungney Drag, village life.
4. Samtse Samtse Dzong, pilgrimage sites, Sidhok
Khorlo Chorten, Sipsu, Tendu, Dorokha
5. Chuukha Dokhachu Goenpa, Gelling Goenpa, Thadra
Goenpa, Chhukha Zangdo Pelri and
Tumdra Aminey
6. Punakha Punakha Dzong, Khamsum Yulley Namgyal
Chorten, River Rafting & Kayaking, Chimi
Lhakhang
7. Gasa Gasa Dzong, Laya Run, Annual Gasa
Tshechu, Royal Highland Festival

Investment Opportunity Study 2020 Project Profile: Domestic Tourism Company
Page | 251
Central Region:
8. Wangdue
Phodrang
Wangdue Eco Lodge, Adha Rukha, Gangtey
Lhakhang, Dolung Sherab Yoedsel
Chhoeling, Black Necked Crane Festival
9. Dagana The Daga Dzong, Do Kepai Goenthoe, Do
Rangthan, Do Pata Chapsa, Do Dung Chen,
Dungchen Menchu
10. Tsirang Rigsum Pemai Dumra, Buddhist-Hindu
Temple, Lung Si Gang, Lung Si Gang,
Tsirang Namgyel Chholing Dratsang
11. Sarpang Gelephu Tshachu
12. Zhemgang Bhutan Bird Festival, Cyclothon, Buli Tsho
(lake), Duenmang Tshachu (Hot spring),
Bermo Botanical Garden, Khengrig
Namsum, Zhemgang Flora and Fauna,
Marchang
13. Trongsa Trongsa Dzong, Taa Dzong, Tsheringma
Drupchhu, Jigme Singye Wangchuck
National Park
14. Bumthang Choekhor, Ura, Chumey, and Tang,
numerous pilgrimage sites, temples and
monasteries

Investment Opportunity Study 2020 Project Profile: Domestic Tourism Company
Page | 252
Eastern Region:
15. Mongar Yakgang Lhakhang, Aja Ney, Dramedtse
Lhakhang, Ruins of Zhonggar Dzong
16. Lhuentse Kishuthara- Vibrant Colored Silk Kira,
Singye Dzong, Takila-Guru Statue, Dungkar
Naktshang
17. Pema Gatshel Phrumshingla National Park, Royal Manas
National Park, Pema Gatshel Tshechu
Festival, bird-watching, Nganglam
18. Trashi Yangtse Pemaling Ney, Black-necked cranes,
Ludlow's Bhutan Glory, Gongza Ney,
Dechenphodrang Ney, Rigsum Gonpa,
Omba Ney, Gom Kora, Chorten Kora,
Pemaling Ney
19. Trashigang Trashigang Town, Rangjung Woesel
Choling Monastry, Sherubtse College,
Kanglung, Tiger's nest, Taktsang, Lorem
ipsum, Lorem ipsum dolor
20. Samdrup
Jongkhar
Mithun Breeding Farm, Dratshang, the
Zangdo Pelri, the local town and
Dewathang, bird-watching

Investment Opportunity Study 2020 Project Profile-Outdoor Sports Organiser
Page | 253
Project Title: Outdoor Sports Organiser

Investment Opportunity Study 2020 Project Profile-Outdoor Sports Organiser
Page | 254
1. Services: Outdoor Sporting Organiser
1.1. Background of the Idea
Archery, Daykor, and Khuru are the popular traditional games in Bhutan. Amongst
these, Archery is the national sport. Besides, Bhutanese are fond of other games and
sports. Since the establishment of the Bhutan Olympic Committee (BOC) in 1983, the
development in the games and sports sector has gained momentum and has been
improving.
There are 15 Sports Associations that are currently affiliated to the BOC. The affiliated
associations include Badminton, Football, Basketball, Cricket, Volleyball, Boxing, Golf,
Weightlifting, Shooting, Table Tennis, Taekwondo, Tennis and Indigenous games and
sports. Karate, Judo, Skating, Rafting and Cycling are the new entrants.
The Bhutan Olympic Committee organises sporting events in coordination with the
associations and Yangphel, a private firm that organises archery and khuru
tournaments across the country. There are also many sporting events organised across
the country by various sports association, clubs and individuals.
1.2. The rationale of the Idea
Games and Sports are essential for a healthy life and to energise oneself. It has also
become a daily activity with most people aligning to one sport or the other. Its
popularity and engagement have empowered people and has led to the establishment
of sporting brands in the country, most notably, Nivia Sports and KELME. These two
brands supply and caters the market for games and essential sports kits.
The Bhutan Olympic Committee, Dzongkhag Sports Association and the BOC affiliated
associations are engaged in organising sporting events for decades. The fact that
Yangphel only organises Archery and Khuru tournaments in the country offers
opportunities for a private outdoor sports organiser to step in.
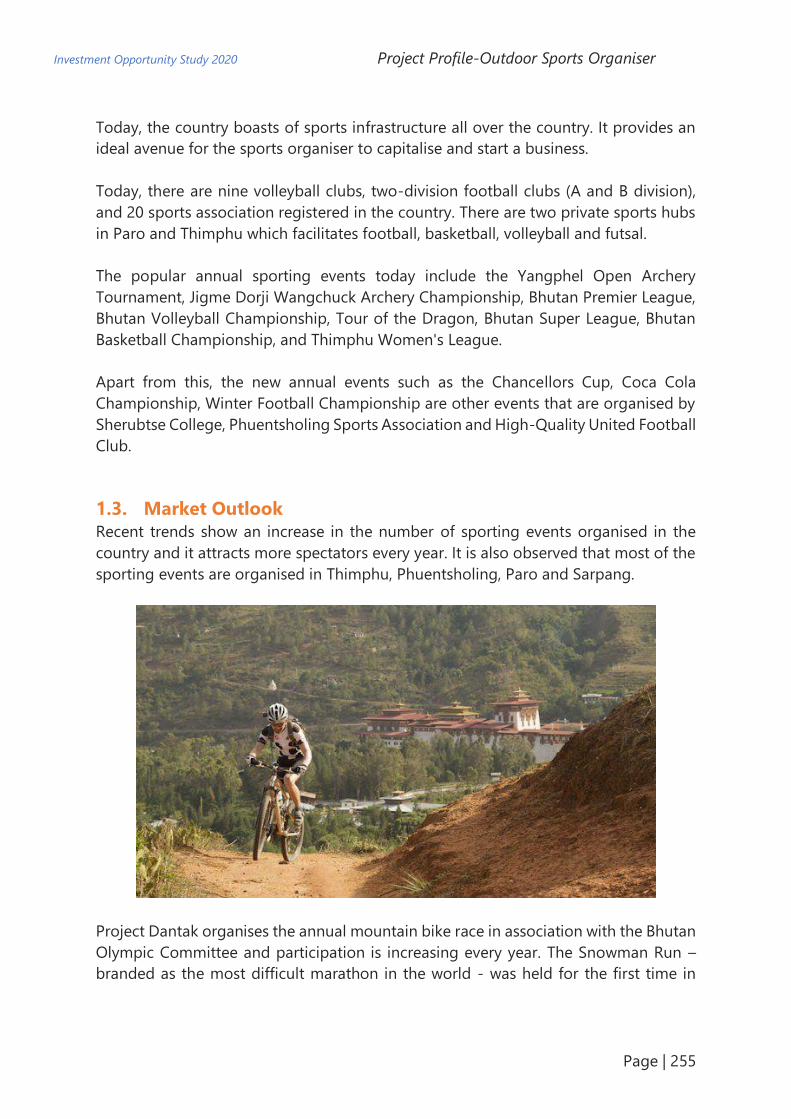
Investment Opportunity Study 2020 Project Profile-Outdoor Sports Organiser
Page | 255
Today, the country boasts of sports infrastructure all over the country. It provides an
ideal avenue for the sports organiser to capitalise and start a business.
Today, there are nine volleyball clubs, two-division football clubs (A and B division),
and 20 sports association registered in the country. There are two private sports hubs
in Paro and Thimphu which facilitates football, basketball, volleyball and futsal.
The popular annual sporting events today include the Yangphel Open Archery
Tournament, Jigme Dorji Wangchuck Archery Championship, Bhutan Premier League,
Bhutan Volleyball Championship, Tour of the Dragon, Bhutan Super League, Bhutan
Basketball Championship, and Thimphu Women's League.
Apart from this, the new annual events such as the Chancellors Cup, Coca Cola
Championship, Winter Football Championship are other events that are organised by
Sherubtse College, Phuentsholing Sports Association and High-Quality United Football
Club.
1.3. Market Outlook
Recent trends show an increase in the number of sporting events organised in the
country and it attracts more spectators every year. It is also observed that most of the
sporting events are organised in Thimphu, Phuentsholing, Paro and Sarpang.
Project Dantak organises the annual mountain bike race in association with the Bhutan
Olympic Committee and participation is increasing every year. The Snowman Run –
branded as the most difficult marathon in the world - was held for the first time in

Investment Opportunity Study 2020 Project Profile-Outdoor Sports Organiser
Page | 256
2019, and local saw four enthusiastic participants where the theme on Climate Change
was conveyed.
1.4. The Concept
Core Business Areas:
The core business of Outdoor Sports Organiser will involve the following scope:
i. Preparation of Timeline
ii. Sports coverage
iii. Advertisement and Media
Preparation of Timeline
The sports organiser should frame an annual timeline for the conduct of the sporting
events according to the feasibility and convenient of the people. The preparation of a
timeline can be organised in line with that of the annual festival that every district
conduct.
Since the organiser needs to have a coverage of the sports events all over the country,
there is a need for consultation and collaboration with various sports associations to
help the entrepreneur organise events in all 20 districts. The contribution from those
associations and clubs would further enhance his preparation.
Sports Coverage
The annual sports events in every district must be designed in a way that it meets the
expectation and need of the people there. The events such as Highland festival for
highlander and southern foothill festival are some of the tourism activities which met
expectations of the people. In line with it, the sport organiser should design and make
a similar sporting event which would suffice the needs of the region. The organiser can
plan annual national sporting events.

Investment Opportunity Study 2020 Project Profile-Outdoor Sports Organiser
Page | 257
Advertisement and Media
In this era of the 21st Century, advertisement and media coverage plays an essential
role in promoting events. This emphasises the crucial position that it can play in
improving sporting events where the participants and spectators will be kept informed
on the events that are taking place. It is encouraged that the organiser has his separate
team to handle all aspects with the media including advertisement, media coverage
and company promotion.
1.5. Basic requirements
The organiser is expected to have the following infrastructure and logistics in place for
effective organisation of sporting events:
# Particular
1 A bus
2 A Pick-Up Truck
3 Referees
4 Event Manager
5 Event Executives
6 Photographers and Media Executives
7 Program Officer/Manager
8 Focal Person (Districts)
9 Sporting Kits
10 Sporting Equipment
11 Sound Systems/ Announcer
12 Ticketing Manager and Executives
13 Lawyer/ Conflict manager
14 Medical Team
1.6. Basic Financial Requirement
The minimum initial financial requirement is calculated to be Nu 3 million which could
be obtained as loan from banks.
1.7. Conclusion
Games and Sports are a big business all over the world. Bhutan is yet to economise
and capitalise from the sector. As such, an Outdoor Sporting Organiser has much
business scope. The company can also become a crucial player in the sports industry
in Bhutan given the fact that there is no one doing it today.

Investment Opportunity Study 2020 Project Profile- Child Care Agency for
Children under 3 years
Page | 258
Project Title: Child Care Agency for
Children under 3 years

Investment Opportunity Study 2020 Project Profile- Child Care Agency for
Children under 3 years
Page | 259
1. Services: Child Care Agency for Children under 3 years
1.1. Background of the Idea
Today, Bhutan has several Early Childhood Care and Development centres which
broadly fall into two age-group categories: 3 to 5 years, and 6 to 8 years, including
those run by private, non-governmental organisations and corporations. But there is
no child care agency for the children below 3 years of age and babysitters are not
easily available in Bhutan. The concept is to open a childcare agency for infants and
target working mothers of infants.
Children who used to grow up in the secure and warm laps of their grandmothers and
aunts are now confronted with an insecure and neglected environment. Therefore,
women need a safe place for their children in their absence. It has become necessary
to provide support to the infants in terms of quality, substitute care and other services
while the mothers are at work.
Early childhood is a time of remarkable brain development that lays the foundation for
later learning and any damage or impoverishment suffered at this stage is likely to be
irreparable. These are years of extreme vulnerability and tremendous potential during
which adequate protection, care and stimulation are essential to provide the
foundation for the child’s well-being and development.
1.2. Rationale of the Idea
• To provide day-care facilities for children (6 months to 3 years) of working
mothers in the community.
• To improve nutrition and health status of children.
• To promote physical, cognitive, social and emotional development (holistic
development) of children.
• To educate and empower parents /caregivers for better childcare.
1.3. Services
The agency will provide an integrated package for the following services:
• Day-care facilities including sleeping facilities.
• Early stimulation for children below 3 years
• Supplementary nutrition (to be locally sourced)
• Growth monitoring
• Health check-up and immunization.

Investment Opportunity Study 2020 Project Profile- Child Care Agency for
Children under 3 years
Page | 260
1.4. The Concept
A childcare agency to provide facility and services enabling parents to leave their
children while they are at work and where children are provided stimulating
environment for their holistic development. The agency is designed to provide group
care to children, usually up to 3 years of age, who need care, guidance and supervision
away from their home during the day.
1.4.1. Target Group
Children of 6 months to 3 years of working women in rural and urban areas who are
employed.
1.4.2. Number of Beneficiaries and Functionaries
Ideally, the number of children in the child care agency should not be more than 30. It
is important that adequately trained nurses and babysitters are there to provide day
care facilities and to supervise day-to-day functioning.
To maintain the standard of care, the nurses should have minimum qualifications and
requisite training at the time of appointment itself to enable them to understand and
cater to the children’s individual needs and developmental capabilities. Thus, the
agency should engage only such staff who have been trained.
1.5. Physical Infrastructure
1.5.1. Location/Environment
The child care agency should be located in a safe and secure place which is welcoming
and child friendly. It is ideal to have the crèche near the homes of children or near the
place of work of the parents (at a walkable distance i.e. ½ - 1 km) for the following
reasons:
• Mothers breastfeeding their babies can conveniently come to feed their babies.
• Parents can be contacted in case of emergencies.
• Easy to pick up, bring or send the child from home.
• If a child is absent for a long period of time, the agency worker can contact
parents to enquire about the child.
• The childcare environment should be similar to the child’s home atmosphere
and should also reflect the life style of the community.
1.5.2. Building / Space Specifications
The agency should preferably have separate breast-feeding room and rest room. Other
requirements could include:
• Nursing room for sick babies.
• Daily laundry services for washing of blankets, bed sheets, pillow covers etc.
• Physical environment should be reasonably suitable for children with special
needs.

Investment Opportunity Study 2020 Project Profile- Child Care Agency for
Children under 3 years
Page | 261
• A childcare centre must have sufficient space to ensure that children can play,
rest, and learn without any hindrance and to ensure a safe and protective
environment for children.
• Care should be taken that there is sufficient space both indoors and outdoors
(preferably of equal size) at the centre.
• The space in the centre may be utilised in a multi-purpose manner, for example,
playing area can be converted into a make-shift sleeping place for children by
spreading out some durries and mats. This will facilitate organising activities for
the children to promote their development.
• In summers, the space outdoors should have a shaded area which is clean and
safe.
• In an ideal centre, the kitchen should be 25% of the covered area and toilet
should be 5% of the covered area.
• The centre should have at least two flats with 3BHK type rooms which would
have multiple rooms and congestion will be avoided for children to rest and
sleep, and a playing area.
• The rooms should have well colourful plastered walls having enough space for
display of pictorial material in each room of the centre.
1.5.3. Light and Ventilation Arrangements
The Centre should be clean, well-lighted with adequate ventilation. A fan should also
be installed at the centre where electricity supply is available. In case there is
irregular/no electricity supply; provision of installing an inverter may be made by the
agency.
1.6. Other Facilities
1.6.1. Drinking water and Sanitary Facilities
The Centre must have safe and regular drinking water facility. For this, the centre
should install a water filter/purifier which should be cleaned regularly. In places where
there is shortage of water, adequate arrangements for storage of water may be
arranged.
Child friendly toilets including for children with special needs should be available
keeping in view the safety and security of children at the centre. A clean, child-friendly
toilet with water facilities, soap, clean cloth/towel, garbage bin, wash basin/sink at low
level and an exhaust fan should be part of the centre. The centre should have a regular
supply of cleaning materials such as phenyl, disinfectants, brooms and swabs, dustbins,
garbage bins etc. Regular supervision may be done for improving the services and
maintaining hygienic conditions.

Investment Opportunity Study 2020 Project Profile- Child Care Agency for
Children under 3 years
Page | 262
1.6.2. Food and Cooking Facilities
Food provided to the children must have adequate nutritional value. As the child stays
for 8 hours at the centre, three meals and one afternoon snack may be provided. Small
children may be provided from milk time to time. There should be variety in the food
that is given to the children every day. The food should be acceptable to both babies
and children.
For this, the nurse should know what are the nutritious preparations suitable for
children, and they must cook them with due care and cleanliness. The centre must have
adequate cooking facilities, cooking utensils, utensils to feed the children – which
should be cleaned regularly before and after use. The cooking area must be located at
the place which is away from the activity area of the children to avoid accidents. Basic
cooking equipment like gas cylinder, feeding equipment, storage bins and boxes must
be available and safely placed.
1.6.3. Growth Monitoring
Assessment of nutritional status of children using new WHO child growth standards is
recognized as an important tool. The growth of children should be regularly monitored
and recorded in separate growth charts for boys and girls, which should be maintained
by nurse. Children in the age group 6 months to 3 years may be weighed on a monthly
basis.
1.6.4. Health Check-up, Medicine & First Aid Kit
The health check-up of all children registered with the centre should be done at least
once every quarter by a registered medical practitioner/doctors. The centre must at all
times be equipped with basic First Aid & Medicine Kit containing paediatric medicines
for common ailments like fever, body ache, vomiting, cough and cold, diarrhoea, ear-
ache, eye infection, stomach ache, worm infestation etc. and band-aids/ bandages,
cotton wool and disinfectants for minor injuries. ORS packets, scissors, thermometer
and antiseptic ointment should also be part of the medicine kit.
1.6.5. Equipment and Play Material
Within the centre, there should be sleeping facilities for children. Equipment, furniture
and toys should be available which are age appropriate and help to create an
accessible and stimulating environment. The facilities shall include:
Type of Facility Material/Equipment
• Sleeping & rest durries, bed sheets, cradles/ cots, pillows, mats and mosquito
nets and basic furniture to meet the requirement of the children
• Breastfeeding Room
• Room to keep sick babies
• Live monitoring using CCTV
• Laundry services

Investment Opportunity Study 2020 Project Profile- Child Care Agency for
Children under 3 years
Page | 263
• Play/Pre-school activities
• Out-door equipment and material like swings, slides, material for balancing
activities seesaw, sandpit etc.
• Pre School Education (PSE) Kit including games and toys for play activities –
doll, ball, ring, picture books, puppets and material for painting & colouring
• Cooking and Feeding, gas stove and cooking utensils like pressure cooker,
frying pans, feeding utensils like plates, bowls, spoons, tumblers etc.
• Audio-visual micro-processor-based equipment which can also be used for
interactive learning.
• Storage plastic/aluminium drums/bins/boxes for storing food material and pre-
school material
• The cradles and cots should be made of washable material to maintain
cleanliness.
1.7. Records and Registers
The enrolment forms of children duly filled in by the parents should be available with
nurses after the child is registered at the centre. In addition, the agency is required to
maintain the following basic records and registers, which should be available for
inspection at any time during the working hours of the childcare centres:
• Admission/Enrolment register for recording profile of children and their parents
including profession/income of both parents.
• Attendance registers of children.
• Attendance registers of functionaries.
• Health check-ups records including immunization of the child.
• Register for consumable and non-consumable items.
• Supplementary nutrition register for recording the food provided to the
children.
• The medical record of children to be shared with doctor.
• Mother’s meeting register.
• Visitors register.
• Register for User fee.
All records and registers should have specific entry for severely underweight children.
1.8. Training of Functionaries
The training would enable centre nurses to:
• Develop better understanding of critical issues of child survival, growth and
development and to orient them to integrated approach to child development.
• Emphasize on areas such as childcare, health care including first-aid.
• Inculcate basic personal hygienic habits in children.
• Coordinate with ministry of health/public health departments/Govt. & Private
hospitals for immunization, health related services.
• Develop skills for monitoring growth of children.

Investment Opportunity Study 2020 Project Profile- Child Care Agency for
Children under 3 years
Page | 264
• Develop basic understanding of nutritional needs of children and methods of
cooking healthy, tasty and nutritious food.
• Develop basic understanding among the centre staff about the need and
importance of day care for children.
• Develop skills for organising various activities to promote all-round
development of children with adequate teaching/learning material.
• Develop skills in addressing the psycho-social care of young infants and
toddlers.
• Develop an appreciation about the need of parent’s participation and
community involvement in the centre program and skills to work with parent
and community.
After training the nurses and centre staff will be expected to perform following
functions:
• Organise stimulation activities for infants/children.
• Monitor growth of children and accordingly provide counselling to parents.
• Prepare nutritious food for children attending the centre.
• Keep the centre and its surroundings neat and clean.
• Motivate parents for immunization and coordinate with ministry of
health/public health departments/ Govt. & Private hospitals for health-related
activities.
• Provide proper arrangements for sleep and rest of children.
• Create awareness about better child care in the community through mothers’
meetings
• Maintain records and registers
• Ensure visits by doctors/health workers
1.9. Unique Selling Point
The services would have to leverage on the concept of ‘childcare agencies for infants
and target to working mothers of infants. This will require to provide a proper facility
which enables parents to leave their children while they are at work and where children
are provided stimulating environment for their holistic development.
▪ Existing Competitors
The number of Early Child hood care centres today are 163 but they don’t have the
facilities to care the children under 3 years of age. However, the concept of Child
Care Agency for Children under 3 Years is brand new in Bhutan.
▪ Expected Customer Number
Projections are made under conservative assumptions of a batch of about 30
children in a month.

Investment Opportunity Study 2020 Project Profile- Child Care Agency for
Children under 3 years
Page | 265
▪ Equipment Requirements
Following equipment are required for the proposed project is as follows with some
idea of price.
Table 1: Cost of Early Childhood Care Equipment and Furniture
# Particulars Qty
.
Rate
(Nu.)
Amoun
t (Nu.in
lacs)
1. Desk Top Computer and Printer (Data and Record keeping) 1 28000 0.28
2. Outdoor Playing Equipment’s 10000
0
1.00
3. Toys 75000 0.75
4. Kitchen Utensils 8000 0.08
5. Sleeping beds 12500
0
1.25
6. CCTV Camera and equipment such as DVR, Monitor
etc.
8 8500 0.68
7. First Aid Kit 2 1500 0.03
Total 4.07
Consumables Table 2: Cost of Consumables
# Particular Requirement
Per day
Requirement
Per Child
Rate
Nu.
Total Amount
Per Annum (Nu. in Lacs)
1 Food Items, Milk,
Fuel, Pads etc.
30 120.00 1080000.00 10.80
Total 120.00 10.80
1.10. More Details:
More details on this business idea can be found from the following sources for better
understanding: Table 3: Further Reading Materials Web Portals Links
http://www.child-encyclopedia.com/child-care-early-childhood-education-and-
care/according-experts/impact-child-care-young-children-0-2
https://www.sba.gov/sites/default/files/files/pub_mp29.pdf
https://www.purdue.edu/hhs/hdfs/cff/wp-
content/uploads/past_projects/comm_childcare_proje.pdf
https://www.kccc.ie/Parents/Guide-to-Choosing-Childcare/Choosing-Childcare-
for-Infants-0-3-year-olds

Investment Opportunity Study 2020 Project Profile- Child Care Agency for
Children under 3 years
Page | 266
https://www.zerotothree.org/early-development/ages-and-stages
http://www.womensownresource.org/rope/Bus_Plan_Sample/Child%20Day%20Car
e%20Services%20Business%20Plan.pdf
1.10.1. Other Requirements
Land: About 500-650 sq. ft. with three floors and outdoor playing area
Manpower of 5 people which includes;
o Manager - Female
o Female - Nurse
o Cook - Female
o Caretaker
1.11. Basic Financial Calculations
The calculation is based on fairly conservative values of taking care of 30 children in a
month with fees Nu. 10,000 per month which will be Nu. 3.6 million per year.
Other assumptions include:
▪ Salary varies as per employee designation
▪ Overhead cost is 15% of the Salary Cost
▪ Variable cost is Nu. 1.1 million which includes consumables and miscellaneous
items.
▪ The BEP in months is 9 months and 22 units.
Table 4: Basic Financial Calculations
Particulars Description Amount in Nu.
Establishment Cost 477,000
Operation Cost 2,140,000
Fixed Cost 1,035,000
Salaries (5 people) 900,000
Overhead Cots (15%) including utility
bills
135,000
Variable Costs 1,105,000
Consumables 1,080,000
Misc. 25,000
Profit Margin (Revenue
Generation)
Intake of Take care services 30, rate
@10000per children
3,600,000
Break Even Units
(Production)
22.00 Kids
Break Even Months 9.00 Months
Annual Profit Before Tax 983,000
Annual Profit After Tax 688,100

Investment Opportunity Study 2020 Project Profile- Child Care Agency for
Children under 3 years
Page | 267
1.12. Conclusion
The development of new child care centres for children below 3 years will help in
development and early caring. Children with access to centre-based programmes are
more active than children without access to these programmes. Early Childhood Care
is recommended as cottage industry and can be operated with optimum infrastructure.
The project cost for 30 children per month comes to about Nu. 477,000. An average
feeding expenses per child is about Nu. 120 considering monthly fees of Nu. 10,000
per child. The cost of salary for 5 staff is about Nu. 900,000 per annum.

Investment Opportunity Study 2020 Project Profile- Branding and Marketing
Intermediary Services Provider Company
Page | 268
Project Title: Branding and Marketing Intermediary
Services Provider Company

Investment Opportunity Study 2020 Project Profile- Branding and Marketing
Intermediary Services Provider Company
Page | 269
1. Branding and Marketing Intermediary Services Provider
Company
1.1. Background of the Idea
From the past two decades, the Government of Bhutan has focused much to develop
cottage and small Industries to propel economic development and employment. The
efforts are converting in results and entrepreneurs and new start-ups are exploring the
business opportunities and contributing their expertise in manufacturing and service
sectors.
Bhutan has some Medium and Large industries in cement, steel, and ferroalloy etc. but
cottage and small industries account for more than 95% of the total number of
industries. These CSI are playing a vital role in the industrialisation and diversification
of the economy. As per the Industrial statics1 of Bhutan around 19,000 CSIs units are
licensed. Several new cottage and small Industry are also coming up. These small
cottage industries are producing dairy products, engineering goods, handloom and
many other useful items.
Over the period, specialist consulting advice services are being sought by these small
cottage industries in Bhutan under the segment of marketing and brand promotion.
This requirement and need opened the opportunity for a number of specialist
organisation to draw on their specialist knowledge base and resource to meet the
demand for specialist consulting services in this segment.
1.2. Rationale of the Idea
Bhutanese entrepreneurs are doing their best but the tough geographical terrain and
segregated marketing is a big hurdle. Support mechanism is weak, entrepreneurs are
lacking in marking and branding and also facing reluctance to supply in export market
even to India. CSIs of Bhutan can’t afford to have a dedicated team for branding and
marketing activities including web presence.
They do not know how to go about quality management systems. People are lost on
how to increase their web presence. They don’t know how to make attractive
packaging solutions? And many similar questions are unanswered including: What is
market demand? How to get licenses required for export to India and other countries?
1 CSI annual report published by the Department of Cottage and Small Industry (DCSI) in Bhutan).

Investment Opportunity Study 2020 Project Profile- Branding and Marketing
Intermediary Services Provider Company
Page | 270
How could one benefit from government schemes? What are the export formalities?
And many more.
As example is provided in an article published on dailybhutan.com2 where a cottage
unit known as “Mountain Mist Soap Unit” is manufacturing natural herbal bathing
soap. It is operated by Chimi Lhamo since 2014 supplying products to five
Dzongkhags. She confesses that the challenges facing her business is that she is not
financially stable and marketing is very difficult because people do not trust a new
product easily.
Apart from the above example, a potential foreign investor needs a depth study on
various aspects about the customer needs, market scenario, feasibilities, approval of
government licenses, economic and social assessments etc. Companies also need
helping hands to understand the various schemes, fund flow mechanism and
monitoring to budget and accounting process.
There are about 56 licenses consultancy companies operational in Bhutan providing
support to industries and working in different segments as civil infrastructure,
architectural design, energy and hydro power and audit consultancy. Most of them
are providing tax audit, tax accounting, due diligence, compliance audit and internal
audit services.
In such a scenario, there is a good scope for a consultancy company to help create a
detailed marketing plan, determine marketing message, and identify the
appropriate marketing mix to get the message out to the target market, and also be
involved in implementing the actual product marketing developed.
The proposed Branding and Marketing Intermediary Services Provider Company will
also monitor results and tweak campaigns as they go to ensure that cottage units
get the best results from their marketing efforts3.
2 https://dailybhutan.com/article/home-made-mountain-mist-soaps-well-received-in-bhutan
3 https://dailybhutan.com/article/two-made-in-bhutan-products-to-hit-the-market-soon-also-
eyeing-overseas-foray - (Source: Future Brand)

Investment Opportunity Study 2020 Project Profile- Branding and Marketing
Intermediary Services Provider Company
Page | 271
1.3. Market Outlook International
A study by Assocham4 forecasts the consulting sector in India to grow at an annual
rate of 30% yearly. In 2010, the consulting industry in India, reportedly stood at Rs
1,700 million. As of now, the business is valued at around INR 1,800 million. It is
propelled by increasing demand for consultancy services, both for domestic and
foreign firms. Presently, the consulting industry in India is dominated in the areas of
business development, engineering, designing, financing, auditing, and hospitality.
McKinsey & Company, IKON, INCO, Boston Consulting Group (BCG), A.T. Kearney, Bain
& Company, Booz & Co, etc. are the prominent names in Branding and Marketing
Consultancy companies in India.
A list of world’s best marketing and branding companies is available on
www.nogood.io5 among which the top names are Equibrand, Bain & Company, Berma
& Co, Seedx, Brolik, Bellwether (Dubai), Blue Marlin (UK) Brandimage, (USA).
1.4. The Concept
While conducting the Bhutan Investment Opportunity Study, 2020, some notable
issues from entrepreneurs included that they are facing problems to complete
compliances of export business, getting ISO certifications, to know the market
response etc. After secondary level analysis, it is inferred that there is a requirement of
a consultancy company that dedicatedly works for branding and marketing of
products produced by cottage and small-scale industries. It is suggested that the
business be labelled “Branding and Marketing Intermediary Services Provider
Company, Bhutan”.
Branding and Marketing Intermediary Services Provider Company could be an advisory
service provider company focussed to help organisations on providing special
trainings to assist in an objective and independent manner, identify management
problems, analysis such problems and recommend solutions to these problems and
help in the implementation of solutions.
Scope of work:
4 https://www.slideshare.net/MunishGoyal1/consultancy-management-business-
scenario-in-india and
5 https://nogood.io/2020/05/15/marketing-consulting-firms/
ASSOCHAM, The Associated Chambers of Commerce of India; Oldest, Leading,
largest and Apex Chamber of Commerce and Industry of India.

Investment Opportunity Study 2020 Project Profile- Branding and Marketing
Intermediary Services Provider Company
Page | 272
• Clear understanding of industry, customers and competitors.
• Identify market opportunities to drive revenue growth.
• Make better decisions to market expansion or product development.
• Deep insights and reliable data to develop marketing strategies.
• Minimize risks of investment in new or existing business.
1.5. Core Business Areas
• Supply specialized skills and expertise that a company lacks.
• Provide an external viewpoint to internal challenges.
• Prompt a new perspective on customers or marketing strategies.
• Allow a business to focus on product development and overall operations.
• Identify the new market opportunities and make better business decisions.
• Build a powerful brand.
• Ensure business growth through data driven marketing strategies and effective
implementation.
• Understand customers better and identify the most profitable customers to
target.
• Give customers a compelling reason to buy your products.
• Create differentiation and get recognized in the market.
• Set a price that is affordable to customers and profitable to you and channels.
• Create awareness and persuade customers to buy your products.
• Reach customers more effectively and efficiently.
• Improve the performance of the sales team to increase the conversion.
• Build and deploy an efficient team for the effective implementation of strategy.
• Get better results of recommended strategies through effective
implementation.
• Recognized as an export brand and increase the revenue potential.
• Discover actionable insights to optimize the marketing performance.
• Consultancy for implementation of quality management system
(ISO – Environment Management System HACCP, HAALA, GMP and Others).
• Advisable services fiscal credit service.
1.6. Business Structure & Required Resources
The proposed advisory company will work under service category and it needs higher
working capital instead of capital investment. Arrangement of human resources and
experts are the main cost sharing head of working capital. A fully furnished office of
600 sq. ft. carpet area with modern office amenities is required to operate this business.
It needs laptops, online survey tools, IOS survey equipment, cameras & stuffs.
The initial need of human resources is as follows:

Investment Opportunity Study 2020 Project Profile- Branding and Marketing
Intermediary Services Provider Company
Page | 273
Table_ 1: Required Experts and Human Resources
Proposed Experts (12) Qualification
Head Consultant – Brand building and
Marketing (1)
MBA – Marketing and Finance with
10 years working experience.
Web- SEO Manager (1) Graduate in IT and Certification in
SEO
QMS Expert (1) Engineering Graduate and Certified
Auditor
Product Marketing Expert (1) MBA – Marketing Management
Tele Networking (1) Expertise in mass communication
Survey Manager (1) Post Graduate
Enumerators (2) Graduate
Data Compiler and Documentation (1) Graduate and Certification course in
Microsoft office tools
Reception (1) Female – Graduate
Chauffeur (2) Literate with valid Driving Licenses
The proposed location for this business is “Thimphu Tech Park and Incubation Centre,
Babesa, Thimphu” while it could be also be located in other places if Tech Park is not
feasible. This company will also make a consortium with website developer companies,
printing press, packaging units etc. to provide products development, interpretation,
and interaction of decision-oriented information and marketing process with
integrated manner to provide quality services ensuring integrity and confidentiality.
1.7. Basic Financial Calculations
Revenue collections under the above services are based on a fee structure
calculated on a case-to-case basis involving expert’s man days, human resource
and infrastructure. Some services are sale in package services i.e. search engine
optimization (SEO) work, telecommunication marketing services- bulk short
message service, social networking app message and email services etc.
The calculation is based on following assumption
• Cost of services fairly estimated as of Nu. 500,000 per month.
• Salary of Nu. 50,000 for manager and 35,000 for executives and Nu.15,000 for
support staff. It is estimated that around 12 experts are required to start the
business effectively.
• Overhead cost is estimated at 20% of the salary cost.
The basic financial calculation is as follows:

Investment Opportunity Study 2020 Project Profile- Branding and Marketing
Intermediary Services Provider Company
Page | 274
Table_ 2: Basic Financial Calculation and Financial Projections
Particulars Details Nu.
Establishment Cost 1,375,000
Fixed Cost 4,320,000
Salaries (12 people) 3,600,000
Overhead Cots (20%) including utilities
bills
720,000
Variable Costs NA
Cannot be determined as it will depend on
the type of service
Profit Margin Per month revenue collection of Nu.5 Lacs
per month
6,000,000
Break Even Months 12.00
Annual PAT after BEP 1,680,000
Annual PBT after BEP 1,176,000
Market Bhutan Industrial as service sectors,
International investors, New Entrepreneurs,
Startup companies etc.
Suggested Management
System
Quality Management ISO 9001:2015
1.8. Conclusion
The proposed “branding and marketing intermediary services” provider company
will provide high value market research and advisory services and support to
customers to identify new market opportunities, growth engines and innovative
ways to capture the market share. It will work in close collaboration with government
organisations, departments, international agencies, non-governmental and civil
society organisations.
The agency will arrange a team of experts who will be well familiar with international
business (Export & Import), quality management standards, Bhutanese financial and
economic scenarios and business environment, industry knowledge for private
sector development, public private partnerships and foreign direct investment in
Bhutan. The company will have an efficient and professional in-house qualified
marketing team.
The proposed agency will provide services that create value in the mind of the
customer, provide product-to-product marketing research to support marketing
activities, and the statistical interpretation of data into information. Further, this
information will be used to plan marketing activities, gauge the nature of a firm’s

Investment Opportunity Study 2020 Project Profile- Branding and Marketing
Intermediary Services Provider Company
Page | 275
marketing environment, and attain information from suppliers including overall
product development and sale.
Government of Bhutan is keen to provide support to CSI industries through its
fiscal assistance schemes, trainings and implementation of sustainable Cottage and
Small Industry Policy, 2019. Common people, new entrepreneurs, existing industries,
national as well as international organisations and prospective investors need local
support to implement their business scope of work. Thus, opening of a Branding
and Marketing Intermediary Services Provider Company is a viable business
opportunity under small scale service segment.
References
More details on this business idea can be found from the following sources and videos
for better understanding:
• http://blog.meritusindia.com/2012/07/12/emerging-trends-in-indian-
management-consulting-2/ Nature Thoughts & Symmetry
• https://www.statista.com/statistics/527240/gross-domestic-product-gdp-in-
bhutan/#:~:text=GDP%20is%20an%20important%20indicator,around%207.94
%20billion%20international%20dollars.


Industrial Development Division
Department of Industry
Ministry of Economic Affairs
Tel: 322295/325112/330370
Website: www.moea.gov.bt


