International Competitiveness of Botswana’s beef industry
Tebogo B. Seleka
Pinkie G. KebakileBotswana Institute for Development Policy Analysis
Conference on Policies for Competitive Smallholder Livestock ProductionGaborone, Botswana, 4-6 March 2015

Outline
• Introduction
• Measuring international Competitiveness
• Results
- Against SADC countries
- Against leading beef exporters
• Factors underlying Botswana’s beef industry competitiveness
Introduction
• Beef industry in Botswana plays a key role in the economy.
- It accounts for a large proportion of agricultural value added.
- It is the second leading source of export revenue after minerals.
- It is one of the key sources of livelihood among rural dwellers – as a source of income and employment (including self-employment).
• However;
- Its share of agricultural value added has declined over time.
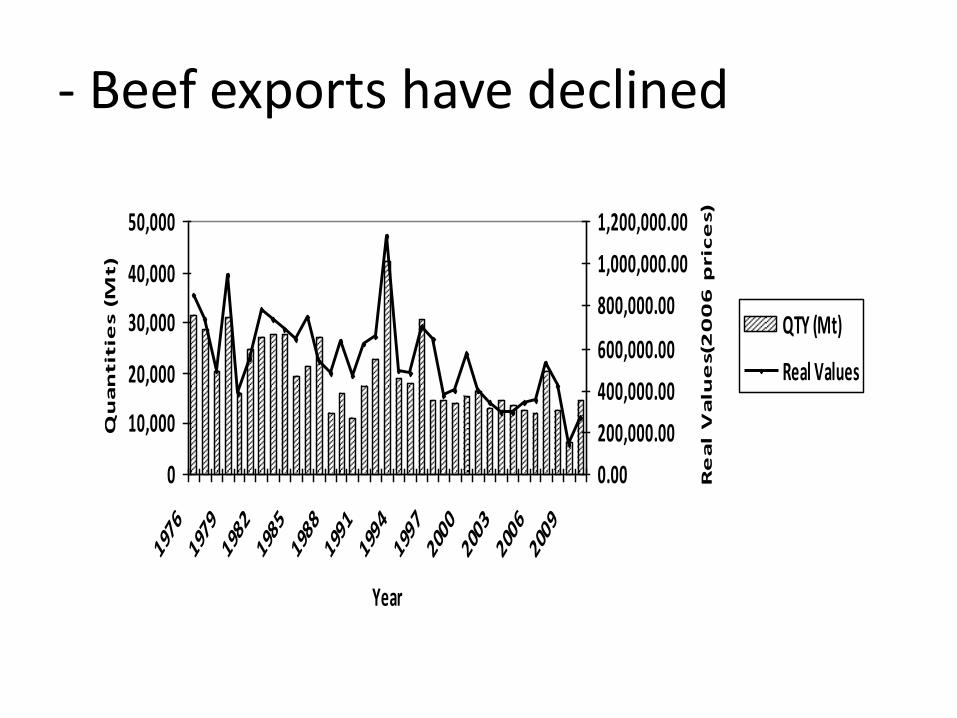
- Beef exports have declined
0
10,000
20,000
30,000
40,000
50,000
1976
1979
1982
1985
1988
1991
1994
1997
2000
2003
2006
2009
Year
Qu
an
tit
ies (
Mt)
0.00
200,000.00
400,000.00
600,000.00
800,000.00
1,000,000.00
1,200,000.00
Re
al
Va
lue
s(2
00
6 p
ric
es)
QTY (Mt)
Real Values

Measuring international competitiveness
• RCA1ij= xij/xnj
• RCA2ij=(xij/xnj)/(xik/xnk)
• RCA3ij=(xij-mij)/(xij+mij)
• NPij=(xij-mij)/pij
• PCij=pij/cij
- RCA=Revealed comparative advantage, x= exports, m=imports, I= country I, j = beef, k= all agricultural commodities, n=set of countries (SADC or leading beef exporters), NP = ratio of net trade to production, PC=ratio of production to consumption, p = production, c= consumption.
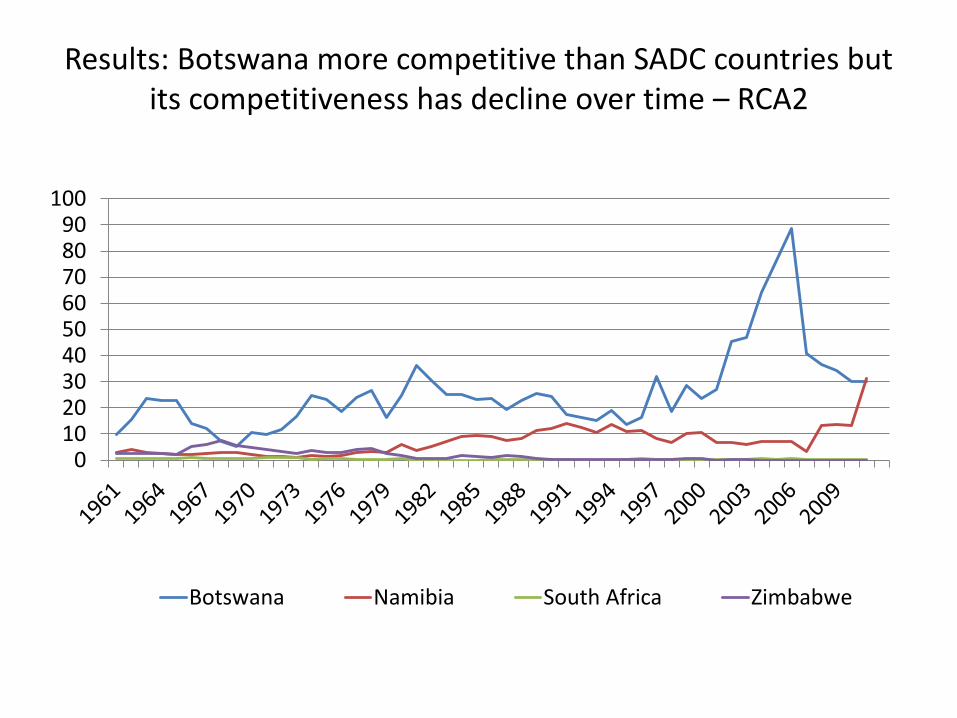
Results: Botswana more competitive than SADC countries but its competitiveness has decline over time – RCA2
0102030405060708090
100
Botswana Namibia South Africa Zimbabwe

Ratio of net trade to production
-0.2
0
0.2
0.4
0.6
0.8
1
Botswana Namibia South Africa Zimbabwe
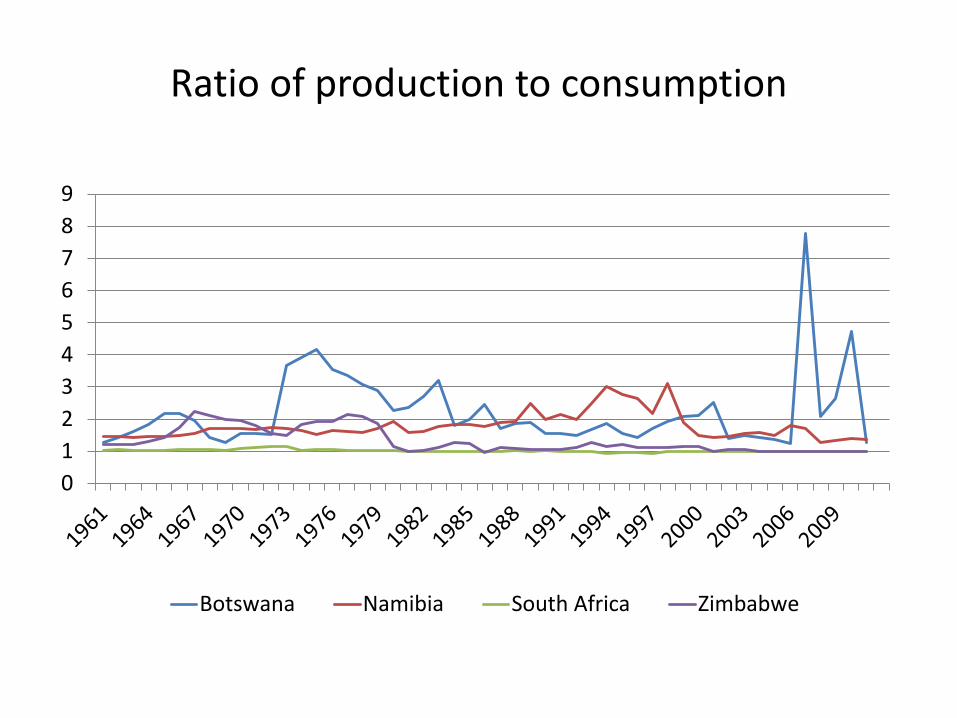
Ratio of production to consumption
0
1
2
3
4
5
6
7
8
9
Botswana Namibia South Africa Zimbabwe
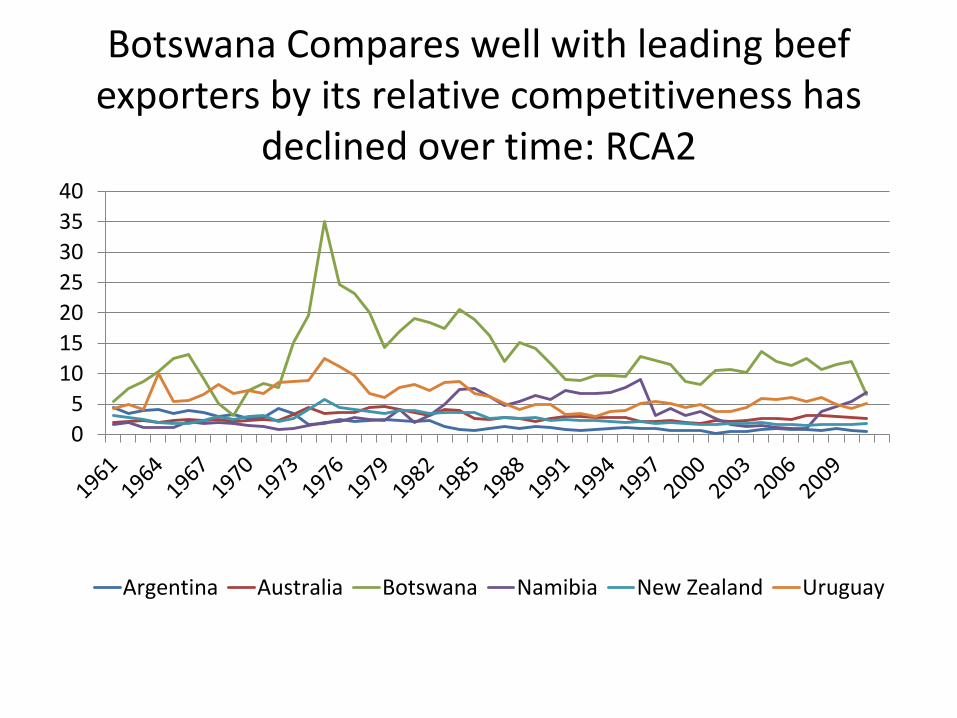
Botswana Compares well with leading beef exporters by its relative competitiveness has
declined over time: RCA2
0
5
10
15
20
25
30
35
40
Argentina Australia Botswana Namibia New Zealand Uruguay
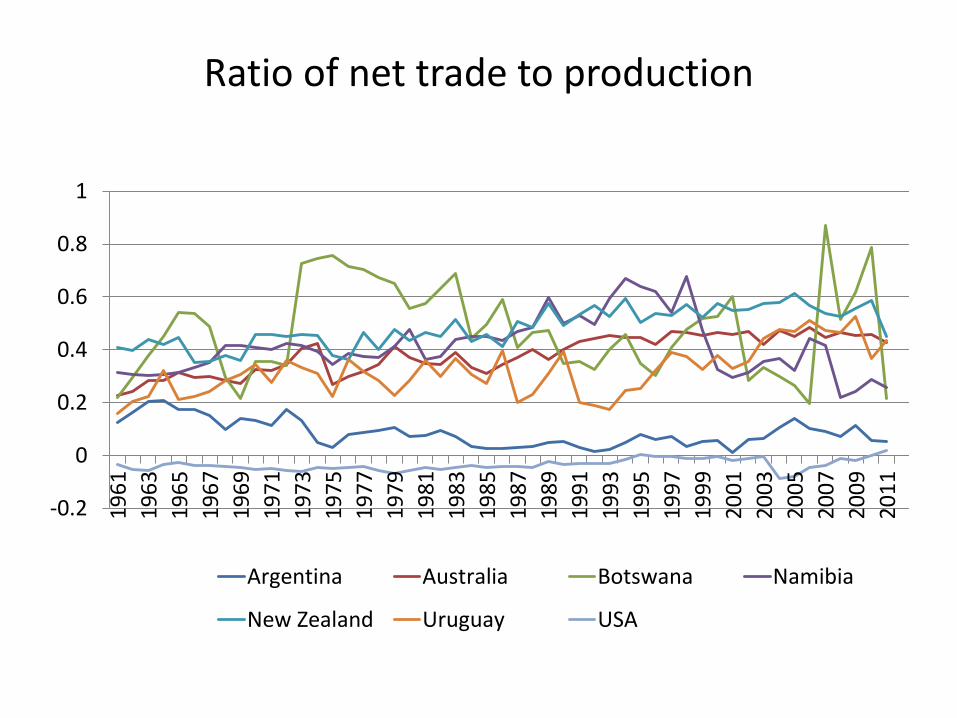
Ratio of net trade to production
-0.2
0
0.2
0.4
0.6
0.8
1
19
61
19
63
19
65
19
67
19
69
19
71
19
73
19
75
19
77
19
79
19
81
19
83
19
85
19
87
19
89
19
91
19
93
19
95
19
97
19
99
20
01
20
03
20
05
20
07
20
09
20
11
Argentina Australia Botswana Namibia
New Zealand Uruguay USA
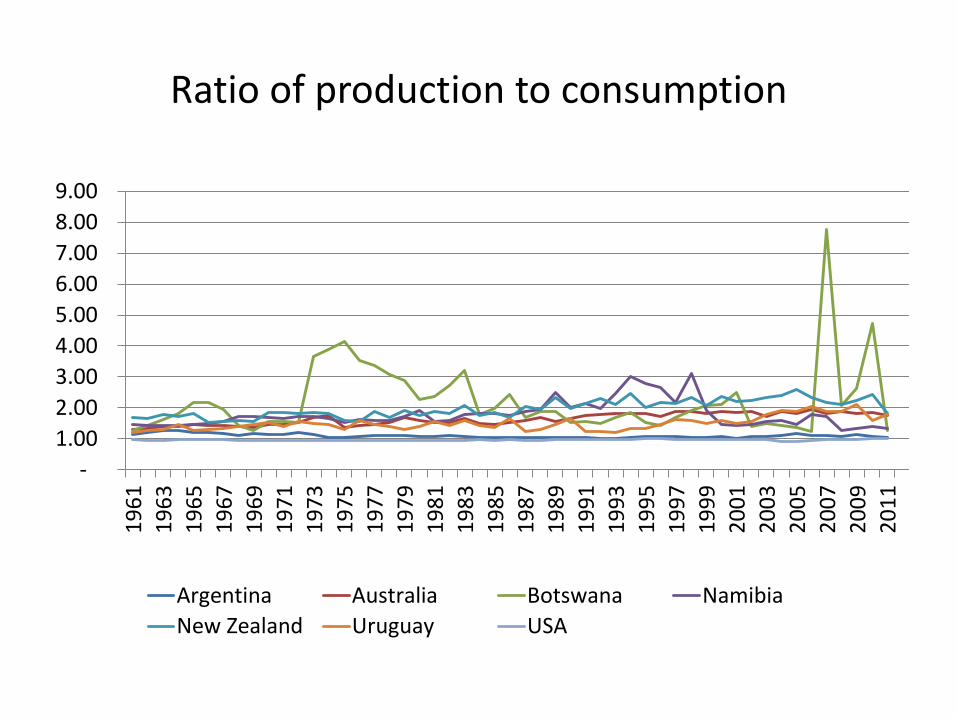
Ratio of production to consumption
-
1.00
2.00
3.00
4.00
5.00
6.00
7.00
8.00
9.00
19
61
19
63
19
65
19
67
19
69
19
71
19
73
19
75
19
77
19
79
19
81
19
83
19
85
19
87
19
89
19
91
19
93
19
95
19
97
19
99
20
01
20
03
20
05
20
07
20
09
20
11
Argentina Australia Botswana Namibia
New Zealand Uruguay USA
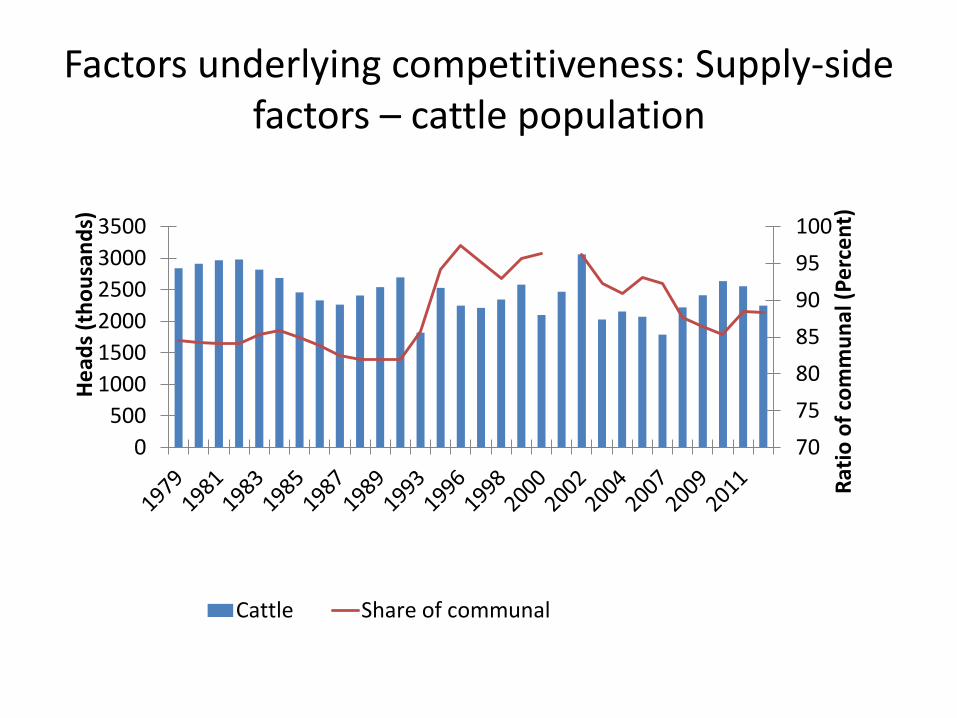
Factors underlying competitiveness: Supply-side factors – cattle population
70
75
80
85
90
95
100
0
500
1000
1500
2000
2500
3000
3500
Rat
io o
f co
mm
un
al (
Pe
rce
nt)
He
ads
(th
ou
san
ds)
Cattle Share of communal
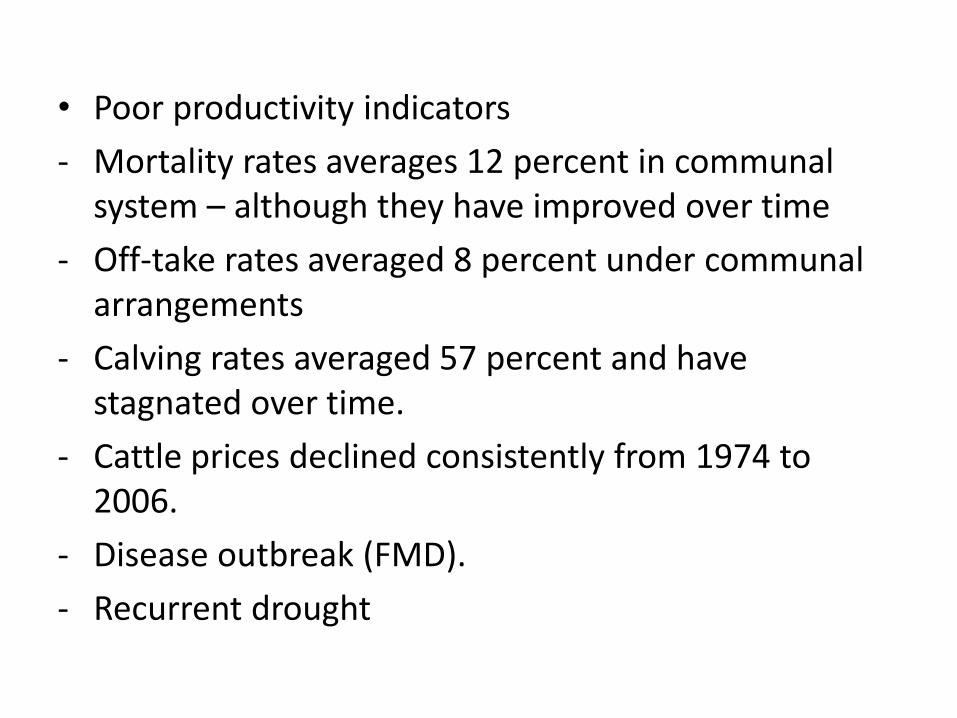
• Poor productivity indicators
- Mortality rates averages 12 percent in communal system – although they have improved over time
- Off-take rates averaged 8 percent under communal arrangements
- Calving rates averaged 57 percent and have stagnated over time.
- Cattle prices declined consistently from 1974 to 2006.
- Disease outbreak (FMD).
- Recurrent drought
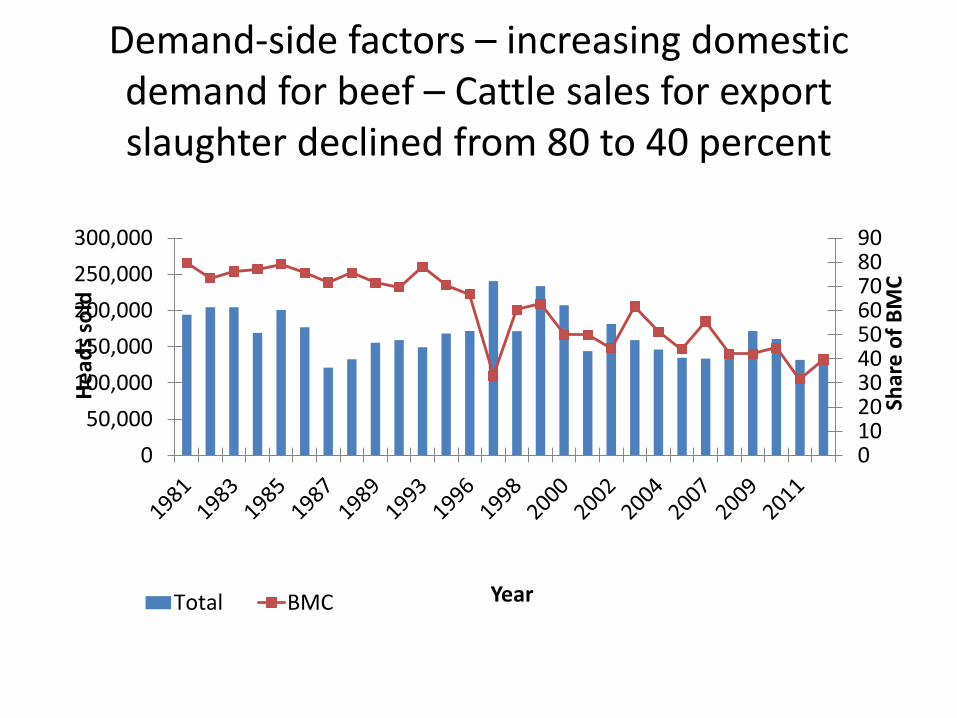
Demand-side factors – increasing domestic demand for beef – Cattle sales for export slaughter declined from 80 to 40 percent
0102030405060708090
0
50,000
100,000
150,000
200,000
250,000
300,000
Shar
e o
f B
MC
He
ads
sold
YearTotal BMC
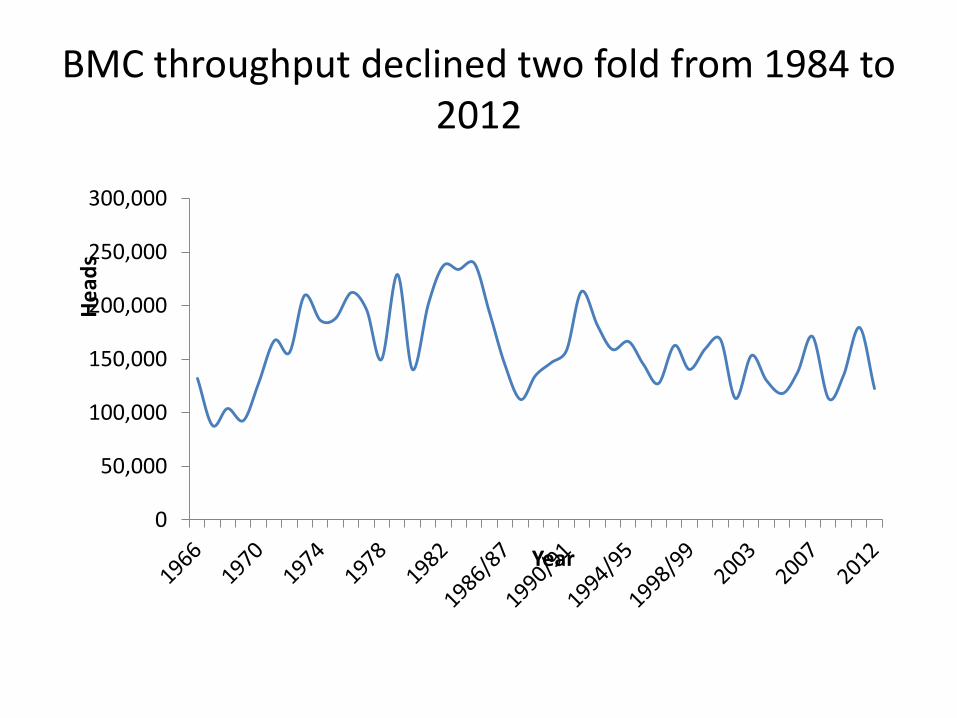
BMC throughput declined two fold from 1984 to 2012
0
50,000
100,000
150,000
200,000
250,000
300,000
He
ads
Year
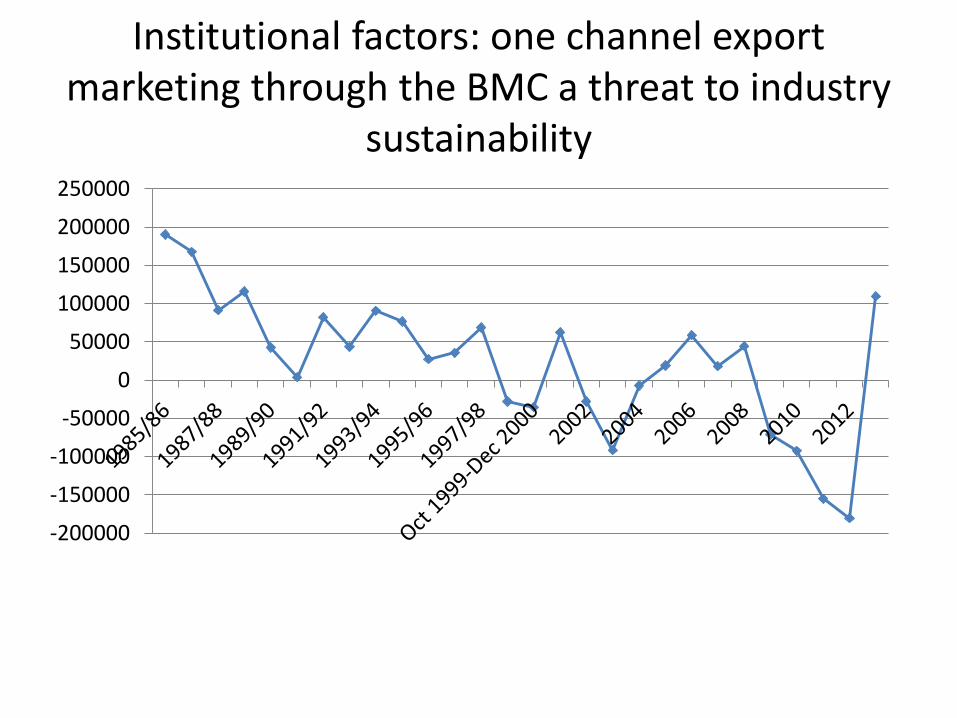
Institutional factors: one channel export marketing through the BMC a threat to industry
sustainability
-200000
-150000
-100000
-50000
0
50000
100000
150000
200000
250000
• Preference erosion in the EU market due to future policy reforms.
Conclusions• Botswana’s beef industry is more competitive
than other SADC countries, but compares well with leading beef exporters.
• Declining competitiveness levels are due to low and stagnant productivity.
• Increasing domestic demand for beef in Botswana, which has resulted in declining exports.
• Future threats include single channel export marketing and possible preference erosion in the EU market.


