ii
AFRICAN DEVELOPMENT BANK GROUP
Interim Country Strategy Paper for Eritrea
2009-2011
OREB
September 2009
iii
Table of Contents
Acronyms and Abbreviations Executive Summary
v-vi
vii-viii
I. INTRODUCTION
1
II. COUNTRY CONTEXT AND PROSPECTS
2.1 Political, Economic and Social Context 1-9
2.2 Strategic Options
2.2.1 Country Strategic Framework 9
2.2.2 Challenges and Weaknesses 10
2.2.3 Strength and Opportunities 10
2.3 Recent Developments in Aid Coordination/Harmonization
and AfDB Positioning in the Country 11-14
III. BANK GROUP STRATEGY FOR ERITREA
3.1 Rationale for Bank Group Intervention 15
3.2 Deliverables and Targets 16
3.3 Country Dialogue Issues 17
3.4 Potential Risks and Mitigation Measures 17-18
IV. CONCLUSION AND RECOMMENDATION 18
Boxes Box 1: Business Environment Assessment Box 2: National Development Policies and Strategies Box 3: Development Partners Activities Box 4: Alignment of National Priorities to Bank Group‘s Strategy
Box 5: ICSP Preparation Process
Charts Graph 1: Political Situation Graph 2: Macro Indicators Graph 3: GDP by Sector Graph 4: Key Growth Drivers
iv
Graph 5: FDI Inflows Graph 6: Macroeconomic Management Graph 7: Governance Indicators Graph 8: Ease of Doing Business Graph 9: Business Environment Graph 10: Regional Integration Graph 11: Policies for Social Inclusion Graph 12: Human Development Index Graph 13: ODA per Capita
Tables Table 1: Sectoral Contribution to GDP Table 2: Governance Indicators Table 3: Portfolio Performance Indicators Table 4: Indicative Bank Group Programme 2009-2011
List of Annexes
1. Annex I (A) CSP Results-Based Framework
2. Annex I (B) Performance Indicators per Sector
3. Annex I (C) Bank Group Operations
4. Annex II (A) Comparative Socio Economic Indicators
5. Annex II (B) Table of Economic and Financial
Indicators
6. Annex III Millennium Development Goals
CURRENCY EQUIVALENTS
September 2009
Currency Unit = Eritrean Nakfa (ERN)
1 UA = 23.88 ERN
1 UA = 1.566 US$
1 US$ = 15.25 ERN
FINANCIAL YEAR
January to December
WEIGHTS AND MEASURES
Metric System
1 Kilogramme (kg) = 2.2 pounds (lbs)
1 metric tonne (MT) = 2,205 lbs
v
ACRONYMS AND ABBREVIATIONS
ADB African Development Bank
ADF African Development Fund
ASDP Agricultural Sector Development Programme
APPR Annual Portfolio Performance Review
BOP Balance of Payment
BWIs Bretton Woods Institutions
COMESA Common Market for Eastern and Southern Africa
CPIA Country Policy and Institutional Assessment
CPI Consumer Price Index
CPRR Country Portfolio Performance Review
CSP Country Strategy Paper
CSOs Civil Society Organizations
DHS Demographic and Health Survey
DPs Development Partners
DO Development Objective
EEBC Ethiopia-Eritrea Border Commission
EDPF Eritrea Development Partner Forum
ERP Emergency Reconstruction Programme
ESDP Education Support Development Programme
ESW Economic Sector Work
FDI Foreign Direct Investment
FSF Fragile State Facility
FSS Food Security Strategy
FTZ Free Trade Zone
GDP Gross Domestic Product
GDI Gender-related Development Index
GNI Gross National Income
GoSE Government of the State of Eritrea
GSP Generalized System of Preferences
HDI Human Development Index
HLC High Level Consultation
ICSP Interim Country Strategy Paper
ICT Information and Communication Technology
IDPs Internally Displaced Persons
IGAD Intergovernmental Authority on Development
ILO International Labour Organization
IMF International Monetary Fund
IPRSP Interim Poverty Reduction Strategy Paper
IRDP Integrated Rural Development Programme
ITU International Telecommunication Union
IP Implementation Progress
IRDP Integrated Rural Development Project
MDGs Millennium Development Goals
MTDP Medium Term Development Plan
NEPAD New Economic Initiative for Africa
NGAP National Gender Action Plan
NHP National Health Policy
NPO National Programme Office
NPV Net Present Value
ODA Overseas Development Assistance
PAR Project-at-Risk
PIU Project Implementation Unit
vi
RBCSP Results Based Country Strategy Paper
SSA Sub-Saharan Africa
TB Treasury Bills
TSZ Temporary Security Zone
UA Unit of Account
UNDP United Nations Development Programme
UNFPA United Nations Population Fund
UNHCR United Nations Refugees Agency
UNICEF United Nations Children Fund
UNMEE United Nations Mission to Ethiopia and Eritrea
WHO World Health Organization
WTO World Trade Organization
vii
Executive Summary
1.1 Eritrea, one of the youngest nations
in the world, gained its independence from
Ethiopia in 1993 after 30 years of
debilitating war. The post independence
period was characterized by rapid
development in both social and economic
fronts, but the border war with Ethiopia that
erupted in 1998, lasting until 2000, reversed
some of the gains that were made. Since then,
the country has been suffering from
macroeconomic imbalances and its trade
activities, which were behind the strong
economic performance during the post-
independence period, have been badly
disrupted. The situation has been made worse
by the periodic drought problem given the
country‘s dependence on rain. In the past
eight years, annual crop harvest has
oscillated from a high of 70-80 percent to a
low of 20-30 percent of annual consumption
needs, making the country vulnerable to
food insecurity problems. In addition, the
country has also been facing severe foreign
exchange shortages making it difficult to
meet all its import needs, thus forcing it to
operate at low levels of capacity. On top of
that, shortages of skilled manpower continue
to hinder the country‘s ability to move fast
on the growth trajectory.
1.2 Despite all these challenges, the
Government of the State of Eritrea
(GoSE) has managed to improve its fiscal
position through major cuts in defence
spending and other expenditure
rationalizing measures. Efforts have also
been made to improve public financial
management and fiscal transparency,
although the national budget is still not
publically available. The GoSE has also
undertaken measures to attract foreign
investment, including the establishment of
the free trade zone in Massawa, and also to
resuscitate its mining industry. Already the
GoSE has granted more than 17 mining
licences to various foreign companies.
Some, like Bisha, have advanced to actual
work on exploration. Moreover, it has also
been investing in infrastructure
developments to promote domestic and
external interconnectivity, so as to promote
trade and improve the overall business
environment. The construction of a new
airport in Massawa is one of such activities.
In addition, the GoSE has undertaken a
number of measures to improve regional
integration, which has resulted in the
reduction of customs clearance time and the
rolling out of the ASYCUDA1 and its trade
activities within COMESA has increased.
On the social side, Eritrea is reported to be
on track to achieve the Millennium
Development Goal (MDG) goal 3 on gender
equality and MDG goal 4 on child survival.
Eritrea is also considered to be one of the
Sub-Saharan African (SSA) countries with
the best models of malaria control.
1.3 To increase agricultural
productivity, the GoSE is focusing on
multifaceted programmes of transition to
irrigation, through comprehensive water
management programmes and increased
use of essential inputs. It has embarked on
the programme of constructing micro dams
and has put in place the programme of
terracing and afforestation to control and
contain environmental degradation and
effects of climate change. And has also
piloted a high speed wind farm in Assab,
which is a model with a great potential for
scaling up.
1.4 For the past eight years, the GoSE
has also invested a lot of resources in
human capital development. For instance,
the country has managed to triple the
enrolment rate in primary education from a
very low base. The Government has also
expanded access to tertiary education by
opening seven new colleges and has
established a hands-on management school in
the country to increase the efficiency of the
Civil Service and managers of Public
Enterprises. The capacity of the Civil Service
and the Office of the Auditor General has also
been strengthened. Overall, the
Government‘s policies are geared towards
self-reliance, driven by the need to find own
solutions to the challenges currently being
faced by the country and it is within this
context that the Bank continues to lend its
support.
1 The Automated System for Customs Data is
a computerized system designed by UNCTAD to
administer a country's customs.
viii
1.5 The coming into force of the ADF
XI cycle has therefore presented the Bank
with an excellent opportunity to prepare a
new results based interim strategy for
Eritrea. Two previous attempts to present to
the Board the 2006-2007 CSP and the 2007
CSP update failed because of the objections
raised by the Government on the contents of
these documents.2 The last CSP to be
approved by the Board in 2004 was the
2002-2004 Country Strategy Paper (CSP).3
The focus of that CSP was on human
resource development and was valid until
2006. The Education Sector Development
Programme (ESDP) was the only project
that was approved in 2004 following the
approval of the last CSP for Eritrea and its
objective was to contribute to increased
access to quality education at basic and
secondary level. The freeze on private
construction between 2006 and 2008,
delayed the execution of the construction
component, although implementation is
expected to accelerate now with the lifting
of the freeze. Normally in Eritrea, once
agreement is reached with the Government
on the elaboration of the project,
implementation tends to move fast.
1.6 The new Interim Country
Strategy Paper (ICSP) therefore reflects
the continuation of the Bank’s strategic
response to the country’s human resource
development challenges and a natural
progression to the tertiary level. This is a
priority for the GoSE since investment in
education is seen as critical for achieving
2 The draft ICSP was sent to the GoSE mid-
September 2008 and it was finally in mid-May
when detailed comments from the GoSE were
received. In June 2009, the Government
officially informed the Bank of the change in
priority focus for ADF XI resources from
financing the undersea fibre optic cable to
financing activities in the higher education
sector. The Bank mission was then launched
during the first week of July 2009, where
detailed discussions were held on the contents of
the draft and agreement on both the nature of
intervention as well as the contents of the draft
ICSP. A mission to discuss the final draft would
be launched upon the completion of the
document. 3 Reference ADB/BD/WP/2003/152-
ADF/BD/WP/2003/191
sustainable growth and poverty reduction.
This is also in line with the Bank‘s own
Medium Term Strategy 2008-2012, which
has also identified ‗Higher education,
technology and vocational training‘ as one
of its pillars. Therefore, the 2009-2011 ICSP
strategy is anchored on one pillar, the
Promotion of Human Resources
Development and will revolve around
interventions that will help the GoSE
address some of the challenges currently
being faced in the tertiary education sector.
The ICSP will cover the period of 24 months
from its approval date. As for the GoSE‘s
plans under ADF XII, the focus is likely to
switch to agriculture given the importance of
this sector in growth and poverty reduction.
1.7 The Boards of Directors are,
therefore, invited to consider and approve
the proposed strategic response to the
country’s skilled manpower shortages as
elaborated in the 2009-2011 ICSP. It is
recommended that the total ADF-XI grant
allocation of UA 13.7 million be utilized to
finance activities geared at ensuring
sustained human resource development in
Eritrea.
1
ERITREA INTERIM COUNTRY
STRATEGY PAPER 2009-2011
I. Introduction
1.1 This results based 2009-2011 Interim
Country Strategy Paper (ICSP) presents the
Bank’s strategic and selective response to
development challenges currently facing
Eritrea in the higher education sub-sector. Specifically, the Bank Group‘s interim strategy
seeks to assist the country address human
resource challenges through activities that will
contribute to the country‘s efforts to build the
optimal level of human capital stock required to
achieve sustainable growth. This is in response to
the specific request from the Government of the
State of Eritrea (GoSE) to the Bank for support in
the area of higher education, which is also a
priority area for both the GoSE and the Bank. For
GoSE, this falls within the priority area on
‗human capital development.‘ The other two
GoSE priority areas include, ‗food security and
development of cash crops‘ and ‗physical and
social infrastructure.‘ The Government has been
recruiting foreign teachers in order to temporarily
address the problem of shortages of teachers for
tertiary education and is now working towards
strengthening its own internal capacity as it
strives to achieve economic self-sufficiency. As
for the Bank, support to higher education is one of
the four priority areas identified in its Medium
Term Strategy 2008-2012 (MTS). The decision to
support this sector is also based on the Bank‘s
own comparative advantage, its country
knowledge and the existing policy framework.
Therefore, the proposed interventions in tertiary
education will be financed by the grant allocation
UA13.7 million from ADF XI. In anticipation of
the upcoming ADF-XII, the GoSE has already
indicated that agriculture would be priority
number one.
1.2 The coming into force of the new
ADF cycle has presented the Bank with an
excellent opportunity to start afresh with a
new results based interim strategy. The ICSP
will cover the period of 24 months from its
approval date. The decision to prepare an interim
strategy instead of a full CSP is based on the fact
that the country‘s draft 5 Year National
Development Plan is yet to be finalized. This
ICSP will therefore facilitate the transition to a
full CSP. It should be noted that since 2006 the
relationship between the Bank and Eritrea has not
been based on a valid CSP. Previous attempts to
present the 2006-2007 CSP and the 2007 CSP
update to the Board, in 2006 and 2007,
respectively, did not bear results because of the
objections that were raised by the GoSE on the
contents of the CSP4 and the last minute
withdrawal of the Integrated Rural Development
Project (IRDP), which was to accompany the
2007 CSP update. As a result, the country was not
able to utilize its ADF X allocation of UA 14.3
million. Extra efforts have been made to ensure
the acceptability of the ICSP to the Government.
1.3 The last strategy to be approved by
the Board, the 2002-2004 Country Strategy
Paper (CSP),5 approved on February 25, 2004,
was based on the Interim Poverty Reduction
Strategy (I-PRSP) of 2004. Consistent with the I-
PRSP, the medium-term assistance strategy focused
on human resource development, in particular
support to basic education and was valid until 2006.
In considering the Bank Group‘s strategy, the
Board commended the authorities for beginning to
refocus their efforts from post-conflict
reconstruction to long-term development and
poverty eradication, but expressed concern over
high defence spending, lack of transparency in
fiscal management, weak business environment as
well as the strained relations with members of the
international community. Although progress has
been made to address some of these issues, as will
be illustrated in subsequent sections, there is still
room for further improvements. With the
approval of the 2002-2004 CSP, Eritrea received
UA18.63 million through the Education Sector
Development Program (ESDP), approved in
November 2004. The project is now progressing
well, after delays in the construction of schools,
caused by the construction freeze (2006-2008),
and is scheduled to be completed in 2011.
II. Country Context and Prospects
2.1 Political, Economic and Social
Context
4 Government was of the view that the document had
not presented the country context correctly and that it
contained factual errors and misconceptions. 5 Reference ADB/BD/WP/2003/152-
ADF/BD/WP/2003/191. It should be noted that the
2002-2006 CSP was not results focused, as it was
prepared before the new results-based CSP format was
approved.
2
Political Context
2.1.1 The country’s political landscape
continues to be affected by border issues. Thirty
years of liberation struggle against Ethiopia and the
1998–2000 border conflict continue to influence
and impact Government policies and institutions.
As far as Eritrea is concerned, the border conflict
was resolved in 2007 with the virtual demarcation
by the Eritrea-Ethiopia Boundary Commission
(EEBC). This was the remaining action that was
needed following the issuance of its verdict in
2002, which was only accepted by Eritrea.
Meanwhile, border tensions escalated between
Eritrea and Djibouti following the brief skirmish
along their border in June 2008. From the
Government‘s perspective, the Djibouti issue is
not a major one and believes that it can be
resolved amicably and bilaterally.
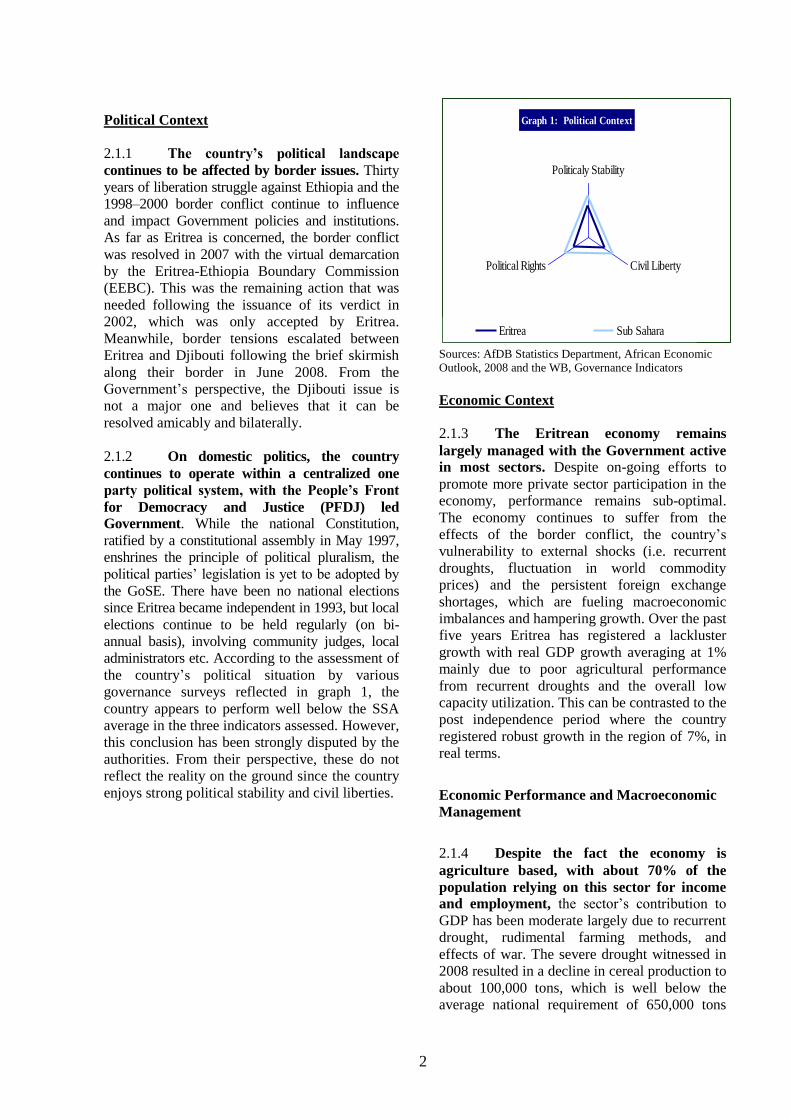
2.1.2 On domestic politics, the country
continues to operate within a centralized one
party political system, with the People’s Front
for Democracy and Justice (PFDJ) led
Government. While the national Constitution,
ratified by a constitutional assembly in May 1997,
enshrines the principle of political pluralism, the
political parties‘ legislation is yet to be adopted by
the GoSE. There have been no national elections
since Eritrea became independent in 1993, but local
elections continue to be held regularly (on bi-
annual basis), involving community judges, local
administrators etc. According to the assessment of
the country‘s political situation by various
governance surveys reflected in graph 1, the
country appears to perform well below the SSA
average in the three indicators assessed. However,
this conclusion has been strongly disputed by the
authorities. From their perspective, these do not
reflect the reality on the ground since the country
enjoys strong political stability and civil liberties.
Graph 1: Political Context
Politicaly Stability
Civil LibertyPolitical Rights
Eritrea Sub Sahara
Sources: AfDB Statistics Department, African Economic
Outlook, 2008 and the WB, Governance Indicators
Economic Context
2.1.3 The Eritrean economy remains
largely managed with the Government active
in most sectors. Despite on-going efforts to
promote more private sector participation in the
economy, performance remains sub-optimal.
The economy continues to suffer from the
effects of the border conflict, the country‘s
vulnerability to external shocks (i.e. recurrent
droughts, fluctuation in world commodity
prices) and the persistent foreign exchange
shortages, which are fueling macroeconomic
imbalances and hampering growth. Over the past
five years Eritrea has registered a lackluster
growth with real GDP growth averaging at 1%
mainly due to poor agricultural performance
from recurrent droughts and the overall low
capacity utilization. This can be contrasted to the
post independence period where the country
registered robust growth in the region of 7%, in
real terms.
Economic Performance and Macroeconomic
Management
2.1.4 Despite the fact the economy is
agriculture based, with about 70% of the
population relying on this sector for income
and employment, the sector‘s contribution to
GDP has been moderate largely due to recurrent
drought, rudimental farming methods, and
effects of war. The severe drought witnessed in
2008 resulted in a decline in cereal production to
about 100,000 tons, which is well below the
average national requirement of 650,000 tons
3
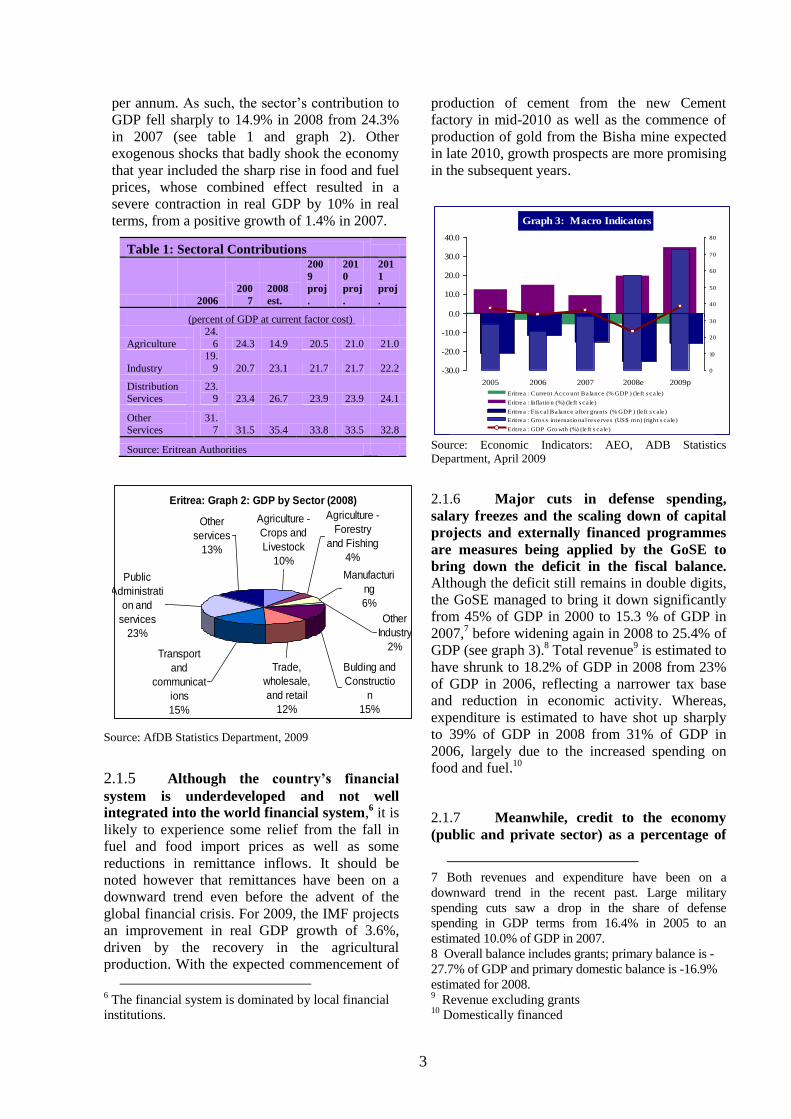
per annum. As such, the sector‘s contribution to
GDP fell sharply to 14.9% in 2008 from 24.3%
in 2007 (see table 1 and graph 2). Other
exogenous shocks that badly shook the economy
that year included the sharp rise in food and fuel
prices, whose combined effect resulted in a
severe contraction in real GDP by 10% in real
terms, from a positive growth of 1.4% in 2007.
Table 1: Sectoral Contributions
2006
200
7
2008
est.
200
9
proj
.
201
0
proj
.
201
1
proj
.
(percent of GDP at current factor cost)
Agriculture
24.
6 24.3 14.9 20.5 21.0 21.0
Industry
19.
9 20.7 23.1 21.7 21.7 22.2
Distribution Services
23.9 23.4 26.7 23.9 23.9 24.1
Other Services
31.7 31.5 35.4 33.8 33.5 32.8
Source: Eritrean Authorities
Eritrea: Graph 2: GDP by Sector (2008)
Agriculture -
Crops and
Livestock
10%
Agriculture -
Forestry
and Fishing
4%
Other
Industry
2%
Bulding and
Constructio
n
15%
Trade,
wholesale,
and retail
12%
Transport
and
communicat
ions
15%
Public
Administrati
on and
services
23%
Other
services
13%
Manufacturi
ng
6%
Source: AfDB Statistics Department, 2009
2.1.5 Although the country’s financial
system is underdeveloped and not well
integrated into the world financial system,6 it is
likely to experience some relief from the fall in
fuel and food import prices as well as some
reductions in remittance inflows. It should be
noted however that remittances have been on a
downward trend even before the advent of the
global financial crisis. For 2009, the IMF projects
an improvement in real GDP growth of 3.6%,
driven by the recovery in the agricultural
production. With the expected commencement of
6 The financial system is dominated by local financial
institutions.
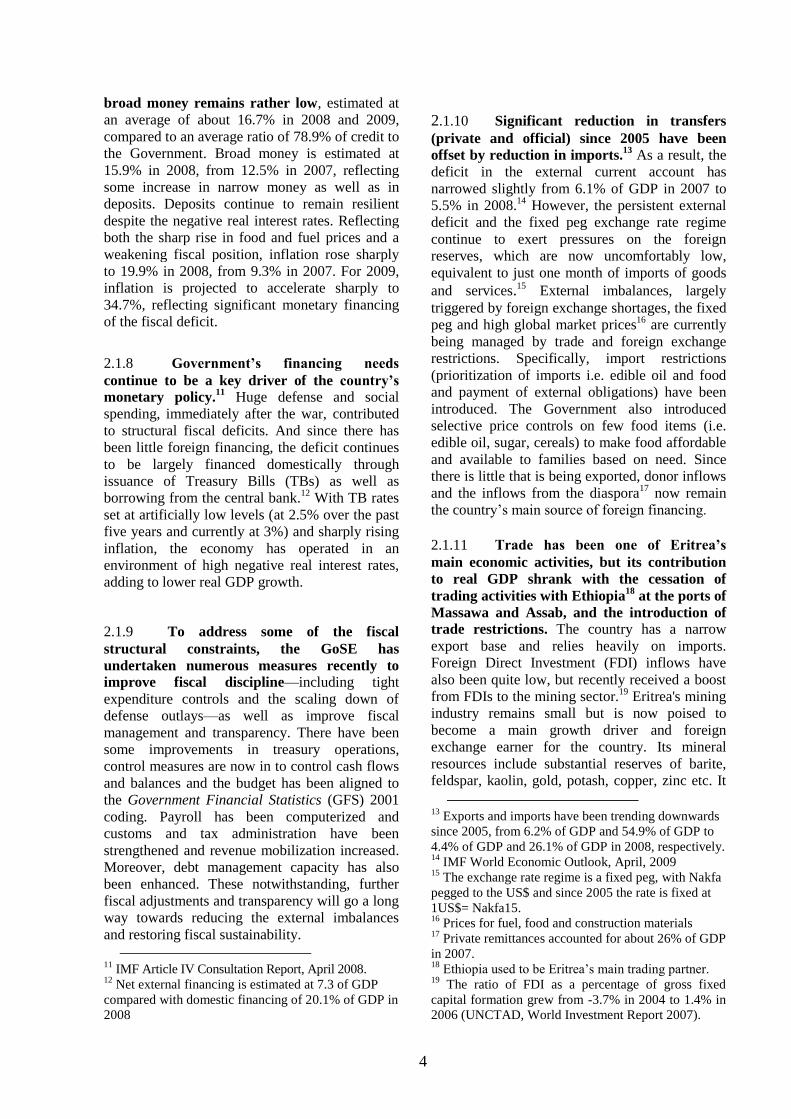
production of cement from the new Cement
factory in mid-2010 as well as the commence of
production of gold from the Bisha mine expected
in late 2010, growth prospects are more promising
in the subsequent years.
Graph 3: Macro Indicators
-30.0
-20.0
-10.0
0.0
10.0
20.0
30.0
40.0
2005 2006 2007 2008e 2009p
0
10
20
30
40
50
60
70
80
Eritrea : Current Acco unt Balance (% GDP ) (le ft s ca le)
Eritrea : Infla tio n (%) (le ft s ca le)
Eritrea : F is ca l Balance afte r grants (% GDP ) (le ft s ca le)
Eritrea : Gro s s inte rna tio nal res erves (US$ mn) (right s ca le)
Eritrea : GDP Gro wth (%) (le ft s ca le)
Source: Economic Indicators: AEO, ADB Statistics
Department, April 2009
2.1.6 Major cuts in defense spending,
salary freezes and the scaling down of capital
projects and externally financed programmes
are measures being applied by the GoSE to
bring down the deficit in the fiscal balance.
Although the deficit still remains in double digits,
the GoSE managed to bring it down significantly
from 45% of GDP in 2000 to 15.3 % of GDP in
2007,7 before widening again in 2008 to 25.4% of
GDP (see graph 3).8 Total revenue
9 is estimated to
have shrunk to 18.2% of GDP in 2008 from 23%
of GDP in 2006, reflecting a narrower tax base
and reduction in economic activity. Whereas,
expenditure is estimated to have shot up sharply
to 39% of GDP in 2008 from 31% of GDP in
2006, largely due to the increased spending on
food and fuel.10
2.1.7 Meanwhile, credit to the economy
(public and private sector) as a percentage of
7 Both revenues and expenditure have been on a
downward trend in the recent past. Large military
spending cuts saw a drop in the share of defense
spending in GDP terms from 16.4% in 2005 to an
estimated 10.0% of GDP in 2007.
8 Overall balance includes grants; primary balance is -
27.7% of GDP and primary domestic balance is -16.9%
estimated for 2008. 9 Revenue excluding grants
10 Domestically financed
4
broad money remains rather low, estimated at
an average of about 16.7% in 2008 and 2009,
compared to an average ratio of 78.9% of credit to
the Government. Broad money is estimated at
15.9% in 2008, from 12.5% in 2007, reflecting
some increase in narrow money as well as in
deposits. Deposits continue to remain resilient
despite the negative real interest rates. Reflecting
both the sharp rise in food and fuel prices and a
weakening fiscal position, inflation rose sharply
to 19.9% in 2008, from 9.3% in 2007. For 2009,
inflation is projected to accelerate sharply to
34.7%, reflecting significant monetary financing
of the fiscal deficit.
2.1.8 Government’s financing needs
continue to be a key driver of the country’s
monetary policy.11
Huge defense and social
spending, immediately after the war, contributed
to structural fiscal deficits. And since there has
been little foreign financing, the deficit continues
to be largely financed domestically through
issuance of Treasury Bills (TBs) as well as
borrowing from the central bank.12
With TB rates
set at artificially low levels (at 2.5% over the past
five years and currently at 3%) and sharply rising
inflation, the economy has operated in an
environment of high negative real interest rates,
adding to lower real GDP growth.
2.1.9 To address some of the fiscal
structural constraints, the GoSE has
undertaken numerous measures recently to
improve fiscal discipline—including tight
expenditure controls and the scaling down of
defense outlays—as well as improve fiscal
management and transparency. There have been
some improvements in treasury operations,
control measures are now in to control cash flows
and balances and the budget has been aligned to
the Government Financial Statistics (GFS) 2001
coding. Payroll has been computerized and
customs and tax administration have been
strengthened and revenue mobilization increased.
Moreover, debt management capacity has also
been enhanced. These notwithstanding, further
fiscal adjustments and transparency will go a long
way towards reducing the external imbalances
and restoring fiscal sustainability.
11 IMF Article IV Consultation Report, April 2008.
12 Net external financing is estimated at 7.3 of GDP
compared with domestic financing of 20.1% of GDP in
2008
2.1.10 Significant reduction in transfers
(private and official) since 2005 have been
offset by reduction in imports.13
As a result, the
deficit in the external current account has
narrowed slightly from 6.1% of GDP in 2007 to
5.5% in 2008.14
However, the persistent external
deficit and the fixed peg exchange rate regime
continue to exert pressures on the foreign
reserves, which are now uncomfortably low,
equivalent to just one month of imports of goods
and services.15 External imbalances, largely
triggered by foreign exchange shortages, the fixed
peg and high global market prices16
are currently
being managed by trade and foreign exchange
restrictions. Specifically, import restrictions
(prioritization of imports i.e. edible oil and food
and payment of external obligations) have been
introduced. The Government also introduced
selective price controls on few food items (i.e.
edible oil, sugar, cereals) to make food affordable
and available to families based on need. Since
there is little that is being exported, donor inflows
and the inflows from the diaspora17
now remain
the country‘s main source of foreign financing. 2.1.11 Trade has been one of Eritrea’s
main economic activities, but its contribution
to real GDP shrank with the cessation of
trading activities with Ethiopia18
at the ports of
Massawa and Assab, and the introduction of
trade restrictions. The country has a narrow
export base and relies heavily on imports.
Foreign Direct Investment (FDI) inflows have
also been quite low, but recently received a boost
from FDIs to the mining sector.19
Eritrea's mining
industry remains small but is now poised to
become a main growth driver and foreign
exchange earner for the country. Its mineral
resources include substantial reserves of barite,
feldspar, kaolin, gold, potash, copper, zinc etc. It
13
Exports and imports have been trending downwards
since 2005, from 6.2% of GDP and 54.9% of GDP to
4.4% of GDP and 26.1% of GDP in 2008, respectively. 14
IMF World Economic Outlook, April, 2009 15
The exchange rate regime is a fixed peg, with Nakfa
pegged to the US$ and since 2005 the rate is fixed at
1US$= Nakfa15. 16
Prices for fuel, food and construction materials 17
Private remittances accounted for about 26% of GDP
in 2007. 18
Ethiopia used to be Eritrea‘s main trading partner. 19
The ratio of FDI as a percentage of gross fixed
capital formation grew from -3.7% in 2004 to 1.4% in
2006 (UNCTAD, World Investment Report 2007).
5
is expected that with the commencement of
production activities at the Bisha mine could
contribute an additional one or two percent to the
real GDP. Graphs 4 and 5, highlights key growth
drivers and the trend in FDI.
Graph 4: Key Growth Drivers, 2008
Annual Export Growth
Aid per CapitaFDI%GFCF
Eritrea Africa
Source: AfDB Statistics Department
2.1.12 The country’s debt remains highly
unsustainable, with the domestic debt at
114% of GDP and external debt at 62% of
GDP as of end December 2008. According the
IMF, Eritrea has a high risk of debt distress, with
most of its debt indicators above the HIPC
threshold. The debt relief option under
HIPC/MDRI is available, but its eligibility also
requires having in place an IMF Staff Monitored
Programme (SMP).20
More external grant
resources would be needed to ease pressures on
domestic financing and hence domestic debt.
Graph 5 : FDI inflows to Eritrea
-10
-5
0
5
10
15
20
25
30
2000 2001 2002 2003 2004 2005 2006
Mil
lio
ns o
f U
S$
Source: UNCTAD World Investment Report 2008
20
Eritrea has not yet indicated its readiness for the
SMP.
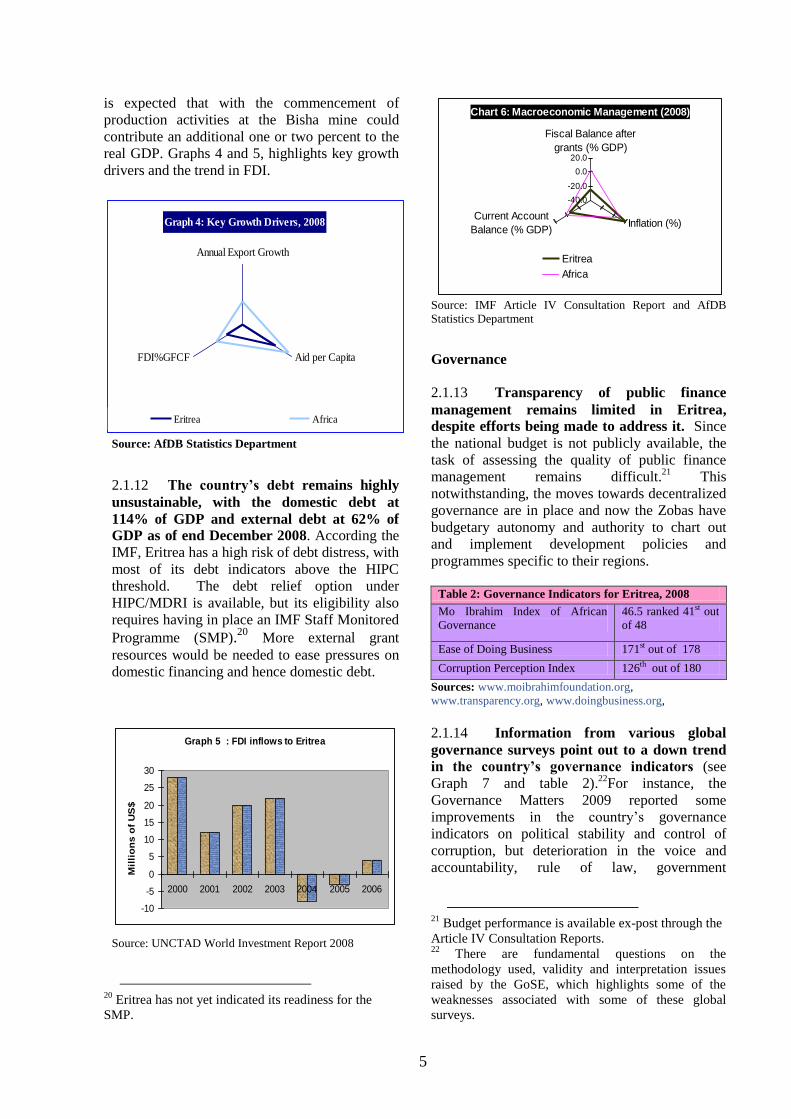
Chart 6: Macroeconomic Management (2008)
-40.0
-20.0
0.0
20.0
Fiscal Balance after
grants (% GDP)
Inflation (%) Current Account
Balance (% GDP)
Eritrea
Africa
Source: IMF Article IV Consultation Report and AfDB
Statistics Department
Governance
2.1.13 Transparency of public finance
management remains limited in Eritrea,
despite efforts being made to address it. Since
the national budget is not publicly available, the
task of assessing the quality of public finance
management remains difficult.21
This
notwithstanding, the moves towards decentralized
governance are in place and now the Zobas have
budgetary autonomy and authority to chart out
and implement development policies and
programmes specific to their regions.
Table 2: Governance Indicators for Eritrea, 2008
Mo Ibrahim Index of African
Governance
46.5 ranked 41st out
of 48
Ease of Doing Business 171st out of 178
Corruption Perception Index 126th out of 180
Sources: www.moibrahimfoundation.org,
www.transparency.org, www.doingbusiness.org,
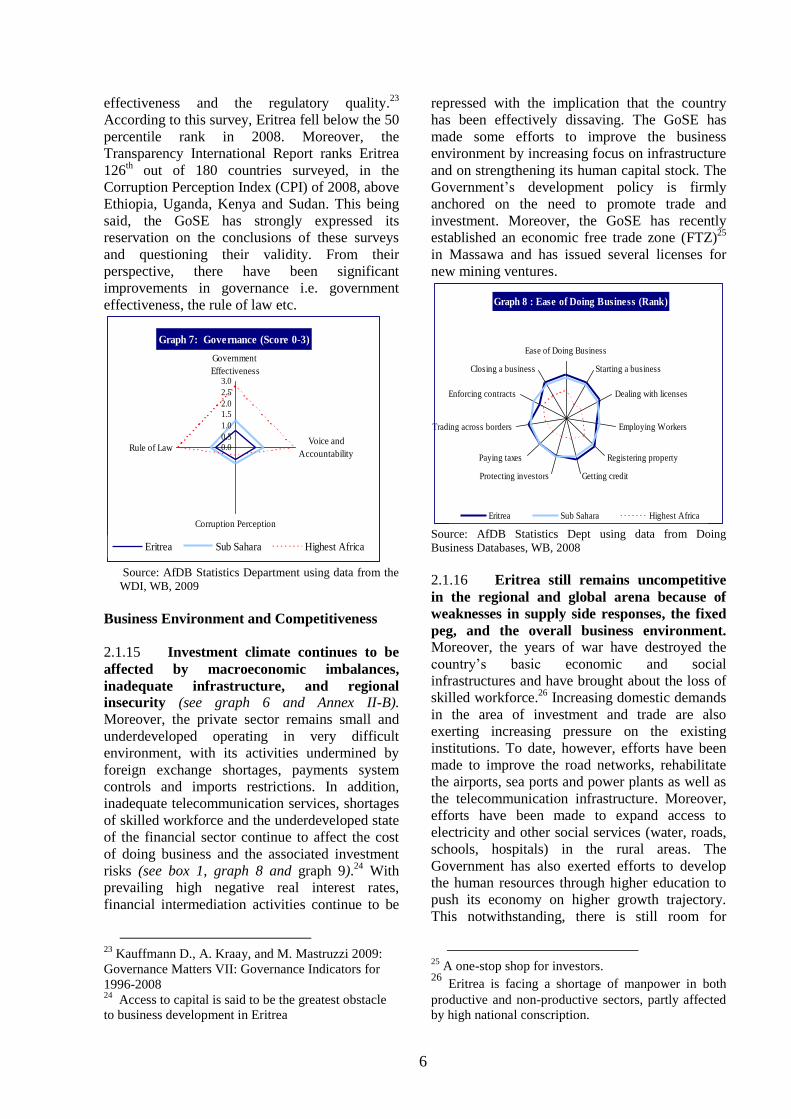
2.1.14 Information from various global
governance surveys point out to a down trend
in the country’s governance indicators (see
Graph 7 and table 2).22
For instance, the
Governance Matters 2009 reported some
improvements in the country‘s governance
indicators on political stability and control of
corruption, but deterioration in the voice and
accountability, rule of law, government
21
Budget performance is available ex-post through the
Article IV Consultation Reports. 22
There are fundamental questions on the
methodology used, validity and interpretation issues
raised by the GoSE, which highlights some of the
weaknesses associated with some of these global
surveys.
6
effectiveness and the regulatory quality.23
According to this survey, Eritrea fell below the 50
percentile rank in 2008. Moreover, the
Transparency International Report ranks Eritrea
126th out of 180 countries surveyed, in the
Corruption Perception Index (CPI) of 2008, above
Ethiopia, Uganda, Kenya and Sudan. This being
said, the GoSE has strongly expressed its
reservation on the conclusions of these surveys
and questioning their validity. From their
perspective, there have been significant
improvements in governance i.e. government
effectiveness, the rule of law etc.
Graph 7: Governance (Score 0-3)
0.0
0.5
1.0
1.5
2.0
2.5
3.0
Government
Effectiveness
Voice and
Accountability
Corruption Perception
Rule of Law
Eritrea Sub Sahara Highest Africa
Source: AfDB Statistics Department using data from the
WDI, WB, 2009
Business Environment and Competitiveness
2.1.15 Investment climate continues to be
affected by macroeconomic imbalances,
inadequate infrastructure, and regional
insecurity (see graph 6 and Annex II-B).
Moreover, the private sector remains small and
underdeveloped operating in very difficult
environment, with its activities undermined by
foreign exchange shortages, payments system
controls and imports restrictions. In addition,
inadequate telecommunication services, shortages
of skilled workforce and the underdeveloped state
of the financial sector continue to affect the cost
of doing business and the associated investment
risks (see box 1, graph 8 and graph 9).24
With
prevailing high negative real interest rates,
financial intermediation activities continue to be
23
Kauffmann D., A. Kraay, and M. Mastruzzi 2009:
Governance Matters VII: Governance Indicators for
1996-2008 24
Access to capital is said to be the greatest obstacle
to business development in Eritrea
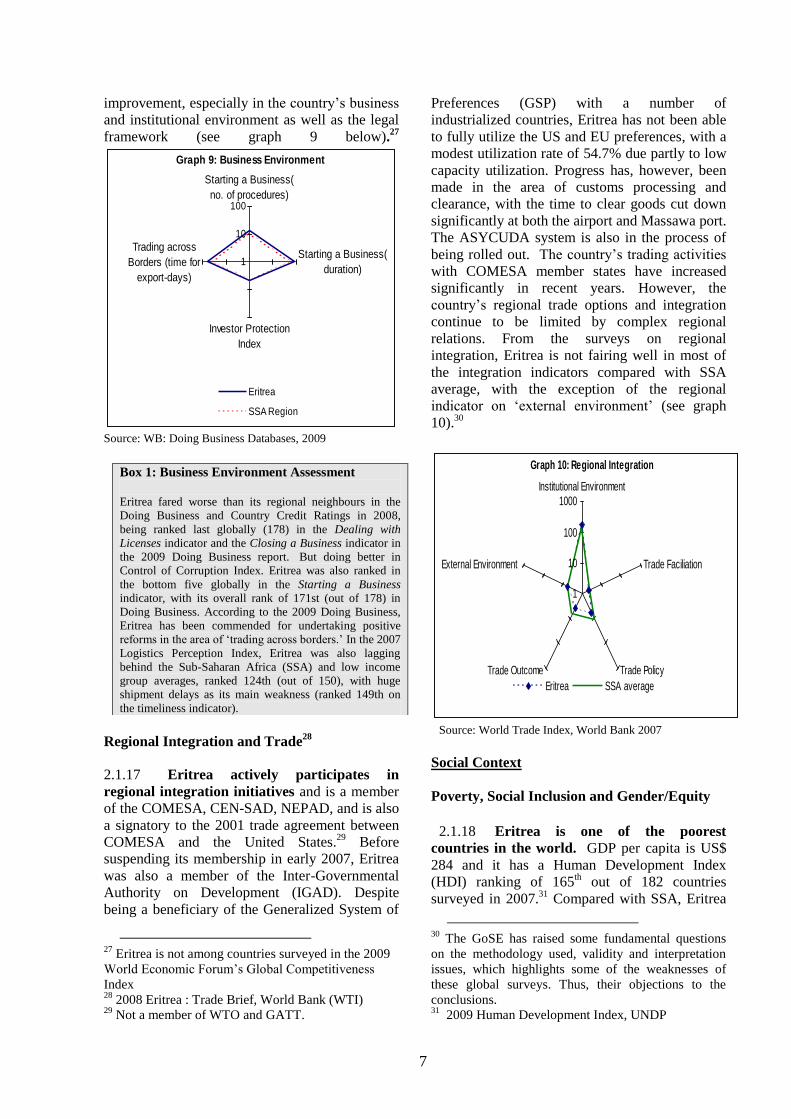
repressed with the implication that the country
has been effectively dissaving. The GoSE has
made some efforts to improve the business
environment by increasing focus on infrastructure
and on strengthening its human capital stock. The
Government‘s development policy is firmly
anchored on the need to promote trade and
investment. Moreover, the GoSE has recently
established an economic free trade zone (FTZ)25
in Massawa and has issued several licenses for
new mining ventures.
Graph 8 : Ease of Doing Business (Rank)
Ease of Doing Business
Starting a business
Dealing with licenses
Employing Workers
Registering property
Getting creditProtecting investors
Paying taxes
Trading across borders
Enforcing contracts
Closing a business
Eritrea Sub Sahara Highest Africa
Source: AfDB Statistics Dept using data from Doing
Business Databases, WB, 2008
2.1.16 Eritrea still remains uncompetitive
in the regional and global arena because of
weaknesses in supply side responses, the fixed
peg, and the overall business environment.
Moreover, the years of war have destroyed the
country‘s basic economic and social
infrastructures and have brought about the loss of
skilled workforce.26
Increasing domestic demands
in the area of investment and trade are also
exerting increasing pressure on the existing
institutions. To date, however, efforts have been
made to improve the road networks, rehabilitate
the airports, sea ports and power plants as well as
the telecommunication infrastructure. Moreover,
efforts have been made to expand access to
electricity and other social services (water, roads,
schools, hospitals) in the rural areas. The
Government has also exerted efforts to develop
the human resources through higher education to
push its economy on higher growth trajectory.
This notwithstanding, there is still room for
25
A one-stop shop for investors. 26
Eritrea is facing a shortage of manpower in both
productive and non-productive sectors, partly affected
by high national conscription.
7
improvement, especially in the country‘s business
and institutional environment as well as the legal
framework (see graph 9 below).27
Graph 9: Business Environment
1
10
100
Starting a Business(
no. of procedures)
Starting a Business(
duration)
Investor Protection
Index
Trading across
Borders (time for
export-days)
Eritrea
SSA Region
Source: WB: Doing Business Databases, 2009
Regional Integration and Trade28
2.1.17 Eritrea actively participates in
regional integration initiatives and is a member
of the COMESA, CEN-SAD, NEPAD, and is also
a signatory to the 2001 trade agreement between
COMESA and the United States.29
Before
suspending its membership in early 2007, Eritrea
was also a member of the Inter-Governmental
Authority on Development (IGAD). Despite
being a beneficiary of the Generalized System of
27
Eritrea is not among countries surveyed in the 2009
World Economic Forum‘s Global Competitiveness
Index 28
2008 Eritrea : Trade Brief, World Bank (WTI) 29
Not a member of WTO and GATT.
Preferences (GSP) with a number of
industrialized countries, Eritrea has not been able
to fully utilize the US and EU preferences, with a
modest utilization rate of 54.7% due partly to low
capacity utilization. Progress has, however, been
made in the area of customs processing and
clearance, with the time to clear goods cut down
significantly at both the airport and Massawa port.
The ASYCUDA system is also in the process of
being rolled out. The country‘s trading activities
with COMESA member states have increased
significantly in recent years. However, the
country‘s regional trade options and integration
continue to be limited by complex regional
relations. From the surveys on regional
integration, Eritrea is not fairing well in most of
the integration indicators compared with SSA
average, with the exception of the regional
indicator on ‗external environment‘ (see graph
10).30
Graph 10: Regional Integration
1
10
100
1000
Institutional Environment
Trade Faciliation
Trade PolicyTrade Outcome
External Environment
Eritrea SSA average
Source: World Trade Index, World Bank 2007
Social Context
Poverty, Social Inclusion and Gender/Equity
2.1.18 Eritrea is one of the poorest
countries in the world. GDP per capita is US$
284 and it has a Human Development Index
(HDI) ranking of 165th out of 182 countries
surveyed in 2007.31
Compared with SSA, Eritrea
30
The GoSE has raised some fundamental questions
on the methodology used, validity and interpretation
issues, which highlights some of the weaknesses of
these global surveys. Thus, their objections to the
conclusions. 31
2009 Human Development Index, UNDP
Box 1: Business Environment Assessment
Eritrea fared worse than its regional neighbours in the
Doing Business and Country Credit Ratings in 2008,
being ranked last globally (178) in the Dealing with
Licenses indicator and the Closing a Business indicator in
the 2009 Doing Business report. But doing better in
Control of Corruption Index. Eritrea was also ranked in
the bottom five globally in the Starting a Business
indicator, with its overall rank of 171st (out of 178) in
Doing Business. According to the 2009 Doing Business,
Eritrea has been commended for undertaking positive
reforms in the area of ‗trading across borders.‘ In the 2007
Logistics Perception Index, Eritrea was also lagging
behind the Sub-Saharan Africa (SSA) and low income
group averages, ranked 124th (out of 150), with huge
shipment delays as its main weakness (ranked 149th on
the timeliness indicator).
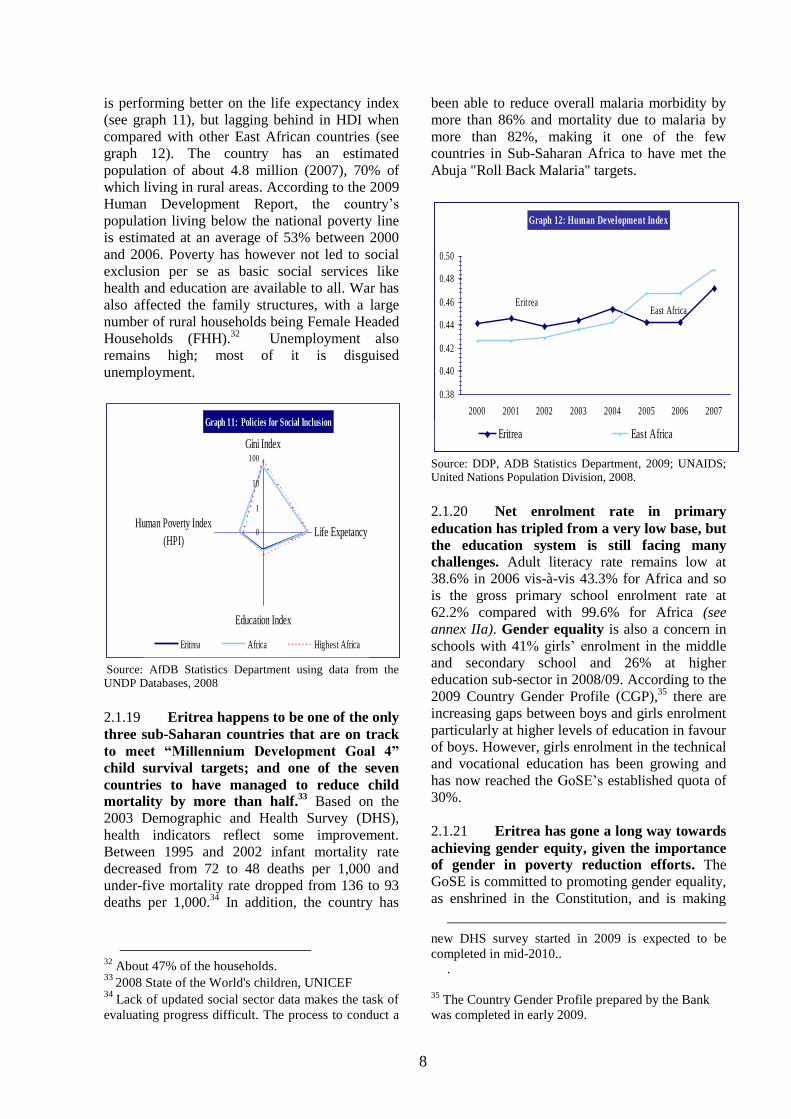
8
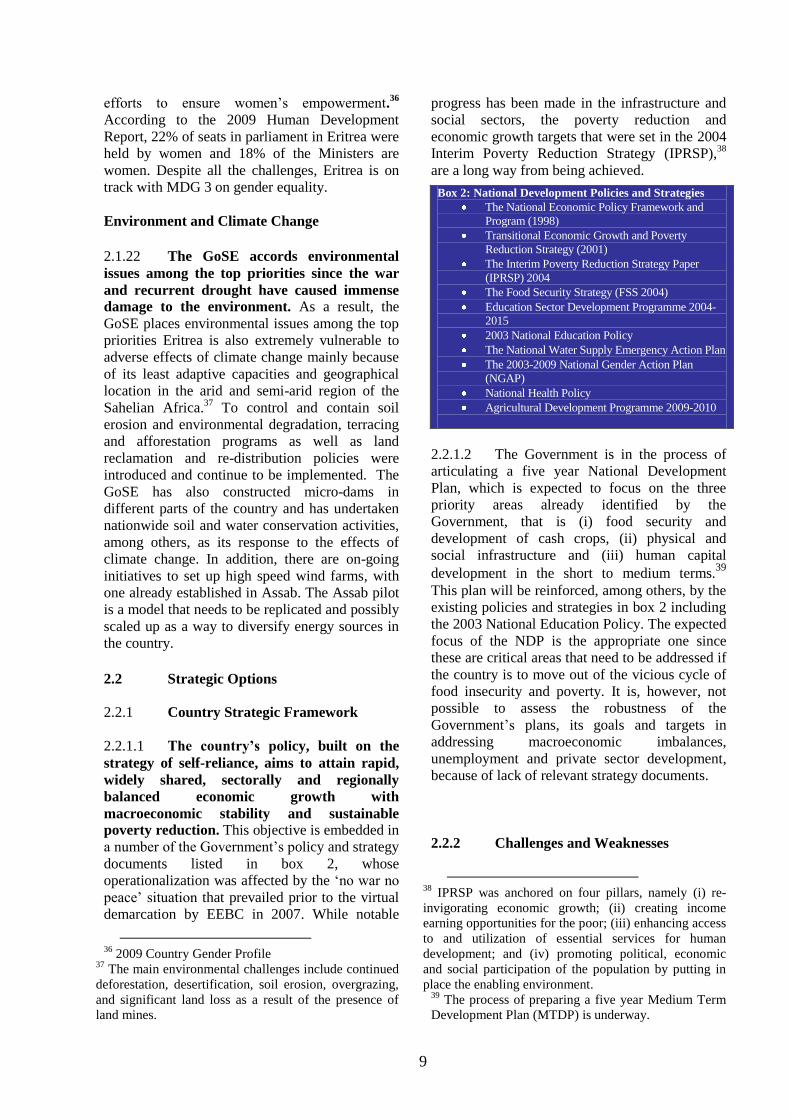
is performing better on the life expectancy index
(see graph 11), but lagging behind in HDI when
compared with other East African countries (see
graph 12). The country has an estimated
population of about 4.8 million (2007), 70% of
which living in rural areas. According to the 2009
Human Development Report, the country‘s
population living below the national poverty line
is estimated at an average of 53% between 2000
and 2006. Poverty has however not led to social
exclusion per se as basic social services like
health and education are available to all. War has
also affected the family structures, with a large
number of rural households being Female Headed
Households (FHH).32
Unemployment also
remains high; most of it is disguised
unemployment.
Graph 11: Policies for Social Inclusion
0
1
10
100
Gini Index
Life Expetancy
Education Index
Human Poverty Index
(HPI)
Eritrea Africa Highest Africa
Source: AfDB Statistics Department using data from the UNDP Databases, 2008
2.1.19 Eritrea happens to be one of the only
three sub-Saharan countries that are on track
to meet “Millennium Development Goal 4”
child survival targets; and one of the seven
countries to have managed to reduce child
mortality by more than half.33
Based on the
2003 Demographic and Health Survey (DHS),
health indicators reflect some improvement.
Between 1995 and 2002 infant mortality rate
decreased from 72 to 48 deaths per 1,000 and
under-five mortality rate dropped from 136 to 93
deaths per 1,000.34
In addition, the country has
32
About 47% of the households. 33
2008 State of the World's children, UNICEF 34
Lack of updated social sector data makes the task of
evaluating progress difficult. The process to conduct a
been able to reduce overall malaria morbidity by
more than 86% and mortality due to malaria by
more than 82%, making it one of the few
countries in Sub-Saharan Africa to have met the
Abuja "Roll Back Malaria" targets.
Graph 12: Human Development Index
Eritrea East Africa
0.38
0.40
0.42
0.44
0.46
0.48
0.50
2000 2001 2002 2003 2004 2005 2006 2007
Eritrea East Africa
Source: DDP, ADB Statistics Department, 2009; UNAIDS; United Nations Population Division, 2008.
2.1.20 Net enrolment rate in primary
education has tripled from a very low base, but
the education system is still facing many
challenges. Adult literacy rate remains low at
38.6% in 2006 vis-à-vis 43.3% for Africa and so
is the gross primary school enrolment rate at
62.2% compared with 99.6% for Africa (see
annex IIa). Gender equality is also a concern in
schools with 41% girls‘ enrolment in the middle
and secondary school and 26% at higher
education sub-sector in 2008/09. According to the
2009 Country Gender Profile (CGP),35
there are
increasing gaps between boys and girls enrolment
particularly at higher levels of education in favour
of boys. However, girls enrolment in the technical
and vocational education has been growing and
has now reached the GoSE‘s established quota of
30%.
2.1.21 Eritrea has gone a long way towards
achieving gender equity, given the importance
of gender in poverty reduction efforts. The
GoSE is committed to promoting gender equality,
as enshrined in the Constitution, and is making
new DHS survey started in 2009 is expected to be
completed in mid-2010..
.
35
The Country Gender Profile prepared by the Bank
was completed in early 2009.
9
efforts to ensure women‘s empowerment.36
According to the 2009 Human Development
Report, 22% of seats in parliament in Eritrea were
held by women and 18% of the Ministers are
women. Despite all the challenges, Eritrea is on
track with MDG 3 on gender equality.
Environment and Climate Change
2.1.22 The GoSE accords environmental
issues among the top priorities since the war
and recurrent drought have caused immense
damage to the environment. As a result, the
GoSE places environmental issues among the top
priorities Eritrea is also extremely vulnerable to
adverse effects of climate change mainly because
of its least adaptive capacities and geographical
location in the arid and semi-arid region of the
Sahelian Africa.37
To control and contain soil
erosion and environmental degradation, terracing
and afforestation programs as well as land
reclamation and re-distribution policies were
introduced and continue to be implemented. The
GoSE has also constructed micro-dams in
different parts of the country and has undertaken
nationwide soil and water conservation activities,
among others, as its response to the effects of
climate change. In addition, there are on-going
initiatives to set up high speed wind farms, with
one already established in Assab. The Assab pilot
is a model that needs to be replicated and possibly
scaled up as a way to diversify energy sources in
the country.
2.2 Strategic Options
2.2.1 Country Strategic Framework
2.2.1.1 The country’s policy, built on the
strategy of self-reliance, aims to attain rapid,
widely shared, sectorally and regionally
balanced economic growth with
macroeconomic stability and sustainable
poverty reduction. This objective is embedded in
a number of the Government‘s policy and strategy
documents listed in box 2, whose
operationalization was affected by the ‗no war no
peace‘ situation that prevailed prior to the virtual
demarcation by EEBC in 2007. While notable
36
2009 Country Gender Profile 37
The main environmental challenges include continued
deforestation, desertification, soil erosion, overgrazing,
and significant land loss as a result of the presence of
land mines.
progress has been made in the infrastructure and
social sectors, the poverty reduction and
economic growth targets that were set in the 2004
Interim Poverty Reduction Strategy (IPRSP),38
are a long way from being achieved.
2.2.1.2 The Government is in the process of
articulating a five year National Development
Plan, which is expected to focus on the three
priority areas already identified by the
Government, that is (i) food security and
development of cash crops, (ii) physical and
social infrastructure and (iii) human capital
development in the short to medium terms.39
This plan will be reinforced, among others, by the
existing policies and strategies in box 2 including
the 2003 National Education Policy. The expected
focus of the NDP is the appropriate one since
these are critical areas that need to be addressed if
the country is to move out of the vicious cycle of
food insecurity and poverty. It is, however, not
possible to assess the robustness of the
Government‘s plans, its goals and targets in
addressing macroeconomic imbalances,
unemployment and private sector development,
because of lack of relevant strategy documents.
2.2.2 Challenges and Weaknesses
38
IPRSP was anchored on four pillars, namely (i) re-
invigorating economic growth; (ii) creating income
earning opportunities for the poor; (iii) enhancing access
to and utilization of essential services for human
development; and (iv) promoting political, economic
and social participation of the population by putting in
place the enabling environment. 39
The process of preparing a five year Medium Term
Development Plan (MTDP) is underway.
Box 2: National Development Policies and Strategies
The National Economic Policy Framework and
Program (1998)
Transitional Economic Growth and Poverty
Reduction Strategy (2001)
The Interim Poverty Reduction Strategy Paper
(IPRSP) 2004
The Food Security Strategy (FSS 2004)
Education Sector Development Programme 2004-
2015
2003 National Education Policy
The National Water Supply Emergency Action Plan
The 2003-2009 National Gender Action Plan
(NGAP)
National Health Policy
Agricultural Development Programme 2009-2010
10
2.2.2.1 The Government is committed to
alleviating poverty by creating food security,
building up its infrastructure and boosting the
stock of its human capital, but is facing multiple
challenges.
Low agricultural productivity
and food insecurity: Given the country‘s
vulnerability to recurrent droughts and reliance on
rain-fed agriculture, Eritrea continues to face food
insecurity. Even in good years Eritrea is not able
to meet more than 70% of its national food
requirements
Restoring macroeconomic stability:
Macroeconomic and structural imbalances
continue to weaken the overall business
environment as well as impact the country‘s
competitiveness (see section 2.1). The main
challenges that need to be urgently addressed
include the persistently high fiscal deficit,
unsustainable public debt, an overvalued
exchange rate, and rising inflation..
Shortages of skilled workforce: Shortage of
appropriate human capital hinders Eritrea's
development efforts. The country is facing serious
shortages of skilled workforce, especially teachers
for upper-schools and higher education
institutions, and is currently relying on foreign
teachers to fill the gaps, which is not sustainable.
Shortage of foreign currency to boost
business environment: Shortage of foreign
exchange and lack of supplies (i.e. fuel, spare
parts, construction materials etc) are crippling the
economy, forcing it to operate at low capacity.
Specifically, private households and business are
facing difficulties in accessing foreign currency to
meet their import needs. The fixed peg also
continues to make the country uncompetitive,
discouraging export and investment activities.
2.2.3 Strengths and Opportunities
2.2.3.1 Eritrea is a country with numerous
potentials, which if exploited, could transform its
growth dynamics.
Strategic location: the country is easily
accessible from Europe and the Middle and Far
East and strategically located with its 1000 km
coast along the Red Sea. Although transit trade
with Ethiopia has ceased, the two ports, the
Massawa and Assab, still have potential of
becoming the country‘s foreign exchange earner,
serving landlocked countries in the region. To
facilitate this, efforts are currently being made to
attract services investment to the port and
shipment sectors as well as to the FTZ. The
completion of the free-port in Massawa is
expected to also give a boost to the export
services, especially transport and logistics
services.
Transformation of Agriculture: Although this sector has been affected by years of
war, recurrent drought and effects of climate
change, it can be transformed into a modern high
technology and high valued export products
sector. The scope is also high for raising
agricultural productivity through increased
reliance on irrigation and improved farming
methods and promotion of the livestock sector
exports activities especially for the Middle East
markets. Moreover, opportunities also lie in the
production of high valued crops and vegetables
for exports to Europe and Middle East.
Fisheries: The country has a potential
of catching up to 80,000 tons of fish annually, but
currently is only able to catch up to 60,000 tons.
Eritrea has started to export fish and sea
cucumbers from the Red Sea on a small scale to
markets in Europe and Asia. To facilitate the
export of high valued perishable seafood, a new
airport has also been constructed in Massawa and
the Massawa port has been rehabilitated and is
also being developed so as to be able to service
the needs of the neighbouring countries as well
and more investments in fishing equipments
would be needed.
Mining potential: Exploration activities
conducted in various parts of the country during
the last seven years confirm that Eritrea is one of
the Volcanogenic Massive Sulfide (VMS)
countries in the world. Eritrea has a large reserve
of gold and also substantial reserves of potash,
zinc, copper, silver, marble, barite, feldspar,
kaolin and rock salt. The recent licensing of a
number of mining concessions is expected to
make the mining sector one of the main drivers of
growth. For instance, the Bisha mining site is
expected to yield 1.06 million ounces of gold, 10
million ounces of silver, 747 million pound of
11
copper and more than 1 billion pounds of zinc
over a 3-year life once production starts in 2011.40
Tourism: The country‘s location at the
Horn of Africa with its natural resources and rich
historical sites and a close proximity to the
European and Middle and Far Eastern market
makes it an attractive tourist spot as well as
strategic trade point. This sector has the potential
of being a good source of foreign exchange
earnings if well developed, but border issues
would also need to be resolved.
Off-shore oil and gas: Although the
country‘s full potential has not be exploited fully,
it is reported that the country has a potential of
producing up to 200,000 barrels/day.
2.3 Recent Developments in Aid
Coordination/Harmonization and AfDB
Positioning in the Country
2.3.1 The GoSE is driving forward its
development agenda and it is clear about the
direction it wants to go. In terms of donor
coordination, the GoSE currently prefers to deal
with development partners bilaterally rather than
as a group, adopting a more focused approach in
their cooperation with development partners.41
In
doing this, the Government seeks to ensure that
there is minimal duplication of efforts and clear
division of labour and a more balanced
distribution of limited external resources to
critical sectors of the economy. The Eritrean
Development Partners‘ Forum (EDPF)
established in 2007,42
meets quarterly to share
information on different development issues in
and review implementation of individual
interventions and is supported by Technical
working groups. The GoSE does not participate in
these meetings in view of its preference to hold
bilateral meetings for programmatic issues.
However, the Authorities have made it clear that
the door for dialogue with the development
40
Almost 1 million troy oz of gold are expected over
the first two years of production at Bisha. 41
The major development partners in Eritrea include
the World Bank, AfDB, the European Union (EU), the
UN System (UNDP, UNICEF, FAO, UNFPA,
UNHCR, WHO, IFAD), Norway, United States, Italy,
China. Active international NGOs include the Lutheran
World Federation, Oxfam, among others.
partner group on broader policy and other
regional issues was open.
42
Currently co-chaired by the UN System and the EU.
12
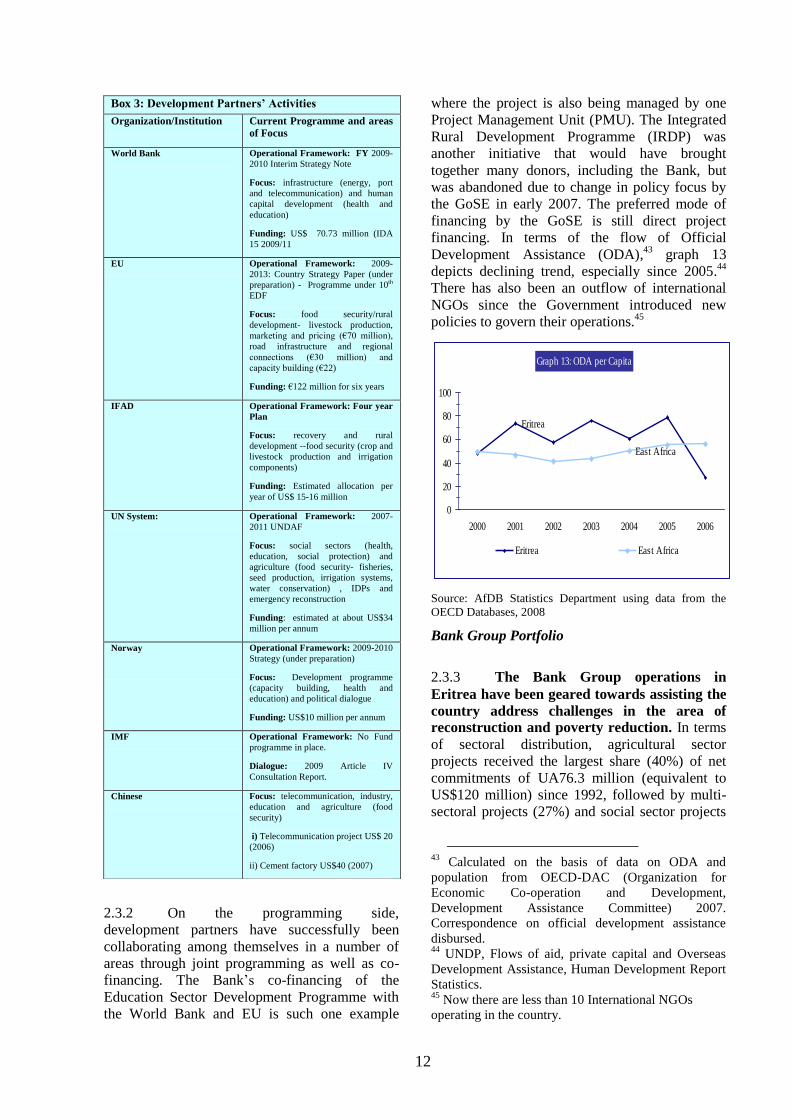
2.3.2 On the programming side,
development partners have successfully been
collaborating among themselves in a number of
areas through joint programming as well as co-
financing. The Bank‘s co-financing of the
Education Sector Development Programme with
the World Bank and EU is such one example
where the project is also being managed by one
Project Management Unit (PMU). The Integrated
Rural Development Programme (IRDP) was
another initiative that would have brought
together many donors, including the Bank, but
was abandoned due to change in policy focus by
the GoSE in early 2007. The preferred mode of
financing by the GoSE is still direct project
financing. In terms of the flow of Official
Development Assistance (ODA),43
graph 13
depicts declining trend, especially since 2005.44
There has also been an outflow of international
NGOs since the Government introduced new
policies to govern their operations.45
Graph 13: ODA per Capita
Eritrea
East Africa
0
20
40
60
80
100
2000 2001 2002 2003 2004 2005 2006
Eritrea East Africa
Source: AfDB Statistics Department using data from the
OECD Databases, 2008
Bank Group Portfolio
2.3.3 The Bank Group operations in
Eritrea have been geared towards assisting the
country address challenges in the area of
reconstruction and poverty reduction. In terms
of sectoral distribution, agricultural sector
projects received the largest share (40%) of net
commitments of UA76.3 million (equivalent to
US$120 million) since 1992, followed by multi-
sectoral projects (27%) and social sector projects
43
Calculated on the basis of data on ODA and
population from OECD-DAC (Organization for
Economic Co-operation and Development,
Development Assistance Committee) 2007.
Correspondence on official development assistance
disbursed. 44
UNDP, Flows of aid, private capital and Overseas
Development Assistance, Human Development Report
Statistics. 45
Now there are less than 10 International NGOs
operating in the country.
Box 3: Development Partners’ Activities
Organization/Institution Current Programme and areas
of Focus
World Bank
Operational Framework: FY 2009-
2010 Interim Strategy Note
Focus: infrastructure (energy, port
and telecommunication) and human
capital development (health and
education)
Funding: US$ 70.73 million (IDA
15 2009/11
EU Operational Framework: 2009-
2013: Country Strategy Paper (under
preparation) - Programme under 10th
EDF
Focus: food security/rural
development- livestock production,
marketing and pricing (€70 million),
road infrastructure and regional
connections (€30 million) and
capacity building (€22)
Funding: €122 million for six years
IFAD Operational Framework: Four year
Plan
Focus: recovery and rural
development --food security (crop and
livestock production and irrigation
components)
Funding: Estimated allocation per
year of US$ 15-16 million
UN System: Operational Framework: 2007-
2011 UNDAF
Focus: social sectors (health,
education, social protection) and
agriculture (food security- fisheries,
seed production, irrigation systems,
water conservation) , IDPs and
emergency reconstruction
Funding: estimated at about US$34
million per annum
Norway
Operational Framework: 2009-2010
Strategy (under preparation)
Focus: Development programme
(capacity building, health and
education) and political dialogue
Funding: US$10 million per annum
IMF Operational Framework: No Fund
programme in place.
Dialogue: 2009 Article IV
Consultation Report.
Chinese Focus: telecommunication, industry,
education and agriculture (food
security)
i) Telecommunication project US$ 20
(2006)
ii) Cement factory US$40 (2007)
13
(24%). Currently, there is only one on-going
project, the Support to the Education Sector
Development Programme- ESDP (UA18.6
million), whose implementation has been slowed
by lack of progress in the implementation of the
construction works due to the suspension of
private construction activities between 2006 and
2008. As such, the disbursement remains rather
low for the ESDP at UA 8.2 million, equivalent to
44% disbursement rate. Total disbursement as at
end September 2009 was UA65.8 million, which
is about 86.2% of the cumulative net
commitments. Following the removal of
restrictions over the construction industry and
increased community base construction activities,
the implementation of the project is expected to
accelerate.
2.3.4 The Bank is also providing support
to the agricultural sector through the grant
allocation of UA 2 million from the African
Food Crisis Response, approved in February
2009. Eritrea was one of the countries that was
badly affected by the high food and fuel prices
and as such became one of the beneficiaries of the
Bank‘s Food Crisis Response. These resources
are currently being used to purchase the much
needed farm inputs including (i) seeds and
pesticides with the objective of improving
productivity of food crops and (ii) poultry
farming inputs with the objective of increasing
productivity of poultry farming. The procurement
process has reached an advanced stage, with some
of the items already being put into use in the
current rainy season.
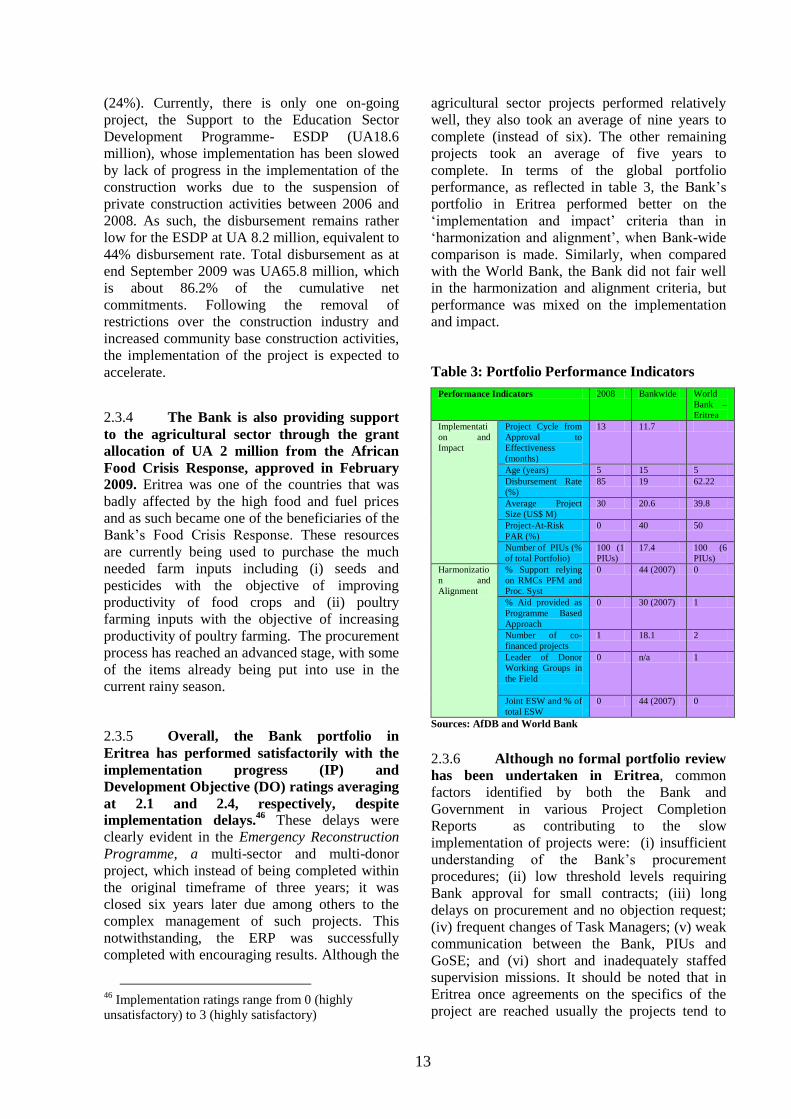
2.3.5 Overall, the Bank portfolio in
Eritrea has performed satisfactorily with the
implementation progress (IP) and
Development Objective (DO) ratings averaging
at 2.1 and 2.4, respectively, despite
implementation delays.46
These delays were
clearly evident in the Emergency Reconstruction
Programme, a multi-sector and multi-donor
project, which instead of being completed within
the original timeframe of three years; it was
closed six years later due among others to the
complex management of such projects. This
notwithstanding, the ERP was successfully
completed with encouraging results. Although the
46
Implementation ratings range from 0 (highly
unsatisfactory) to 3 (highly satisfactory)
agricultural sector projects performed relatively
well, they also took an average of nine years to
complete (instead of six). The other remaining
projects took an average of five years to
complete. In terms of the global portfolio
performance, as reflected in table 3, the Bank‘s
portfolio in Eritrea performed better on the
‗implementation and impact‘ criteria than in
‗harmonization and alignment‘, when Bank-wide
comparison is made. Similarly, when compared
with the World Bank, the Bank did not fair well
in the harmonization and alignment criteria, but
performance was mixed on the implementation
and impact.
Table 3: Portfolio Performance Indicators
Performance Indicators 2008 Bankwide World
Bank –
Eritrea
Implementati
on and
Impact
Project Cycle from
Approval to
Effectiveness
(months)
13 11.7
Age (years) 5 15 5
Disbursement Rate
(%)
85 19 62.22
Average Project
Size (US$ M)
30 20.6 39.8
Project-At-Risk
PAR (%)
0 40 50
Number of PIUs (%
of total Portfolio)
100 (1
PIUs)
17.4 100 (6
PIUs)
Harmonizatio
n and
Alignment
% Support relying
on RMCs PFM and
Proc. Syst
0 44 (2007) 0
% Aid provided as
Programme Based
Approach
0 30 (2007) 1
Number of co-
financed projects
1 18.1 2
Leader of Donor
Working Groups in
the Field
0 n/a 1
Joint ESW and % of
total ESW
0 44 (2007) 0
Sources: AfDB and World Bank
2.3.6 Although no formal portfolio review
has been undertaken in Eritrea, common
factors identified by both the Bank and
Government in various Project Completion
Reports as contributing to the slow
implementation of projects were: (i) insufficient
understanding of the Bank‘s procurement
procedures; (ii) low threshold levels requiring
Bank approval for small contracts; (iii) long
delays on procurement and no objection request;
(iv) frequent changes of Task Managers; (v) weak
communication between the Bank, PIUs and
GoSE; and (vi) short and inadequately staffed
supervision missions. It should be noted that in
Eritrea once agreements on the specifics of the
project are reached usually the projects tend to
14
run smoothly-thus the better ratings (see annex I
b). The Bank Group‘s Audit Report of May 2005
concluded that project management in Eritrea has
improved in the areas of accounting, procurement
and compliance with loan conditions. On the non-
lending side, the Bank maintained dialogue with
the GoSE on issues that were identified in the last
CSP as well as on issues concerning project
management and communication between the
Bank and the GoSE with some success. The Bank
was also able to prepare a Country Gender
Profile, which was submitted to the Board during
the first quarter of 2009.
2.3.7 Given the fact that there was no formal
post CSP review for the previous CSP, the desk
review of the operationalization of the previous
CSP and the assessment of the failed attempts to
prepare CSPs highlight the need to be more
flexible to respond to the special needs of
countries emerging out of conflict as well as the
need to engage closely with the Government to
gain country ownership and support. This also
highlights the need for the field presence to
ensure effective and continuous dialogue and
efficient operationalization of Bank-financed
projects and programmes. On the portfolio side,
the Bank will also ensure that quality-at-entry for
new interventions is high and that delays are
minimized and problems resolved in a timely
manner.
15
III. Bank Group Strategy for Eritrea
3.1 Rationale for Bank Group
Intervention
3.1.1 The rationale behind the proposed
Bank Group’s interventions in higher
education is the need to help the GoSE
improve the quality of its human capital
critical for growth and poverty reduction.
Specifically, the Bank‘s strategy has been
designed to respond to the shortages of skilled
workforce through interventions in the higher
education sub-sector. The Bank‘s planned
intervention intends to support the GoSE‘s efforts
to achieve self-sufficiency in human resource by
producing the optimum level of skills needed to
enable the country to maximize its growth
potential as well as accelerate the process of
reducing poverty. The proposed support for the
development of the higher education sub-sector is
also in line with the Bank‘s own priorities
articulated in its Medium-Term Strategy,
identifying higher education, technology and
vocational training as one its priority area of
support.
3.1.2 Therefore, the strategy is going to be
supported by one pillar: Promotion of Human
Resource Development. This presents the
continuation of the Bank‘s support in the
education sector, but at the next step, the tertiary
level. As already indicated in section 2.2.2, the
institutes of higher education are facing serious
shortages of qualified teachers and only able to
absorb a fraction of student graduating from high
school. The development of this strategy has been
guided by the Government‘s development
priorities; the Bank‘s own comparative
advantages and existing policy framework.
Specifically, the strategy is supported by the
existing national policy framework guiding the
sector, that is, the 2003 National Education Policy
and the Education Sector Development
Programme 2004-2015. The planned intervention
will be financed by the grant allocation of
UA13.7 million from ADF XI. 47
47
The country‘s allocation under ADF-XI, which is grant, is
the outcome of the Performance Based Allocation (PBA)
exercise completed in early 2009 and is subject to change.
The allocation was based on both the Country Policy and
Institutional Assessment (CPIA) rating of 2.43 and the
Governance Factor rating of 0.66.
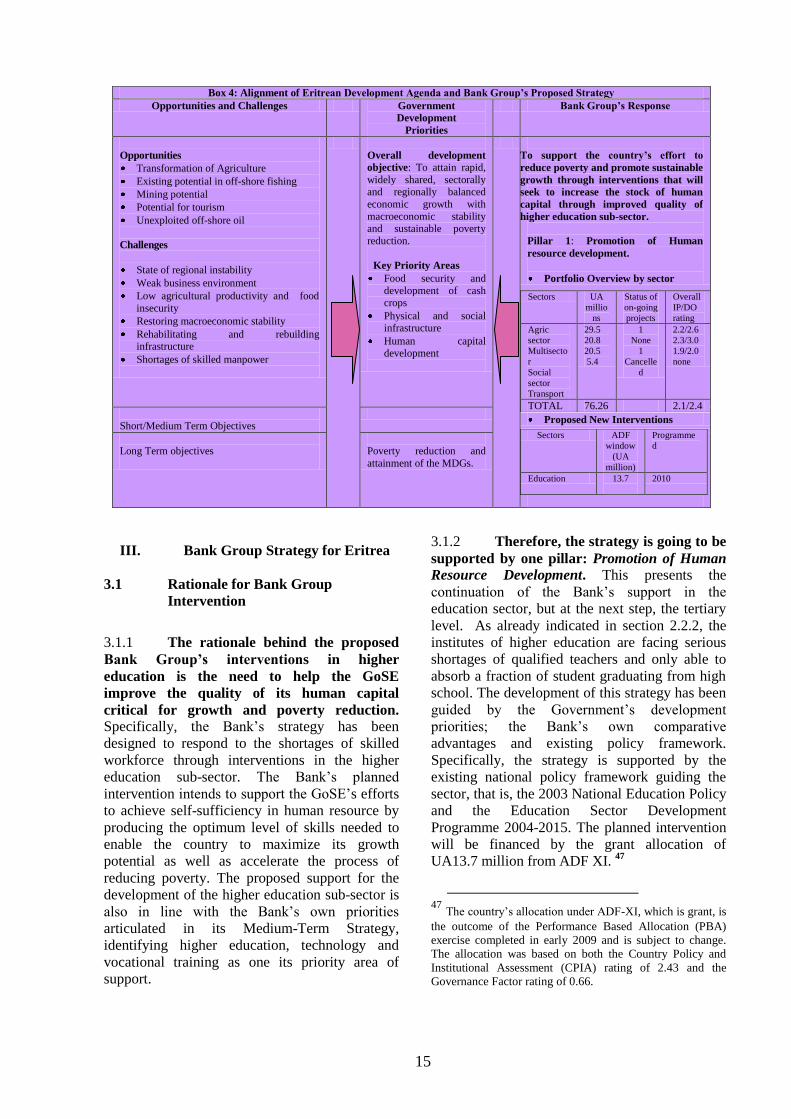
Box 4: Alignment of Eritrean Development Agenda and Bank Group’s Proposed Strategy
Opportunities and Challenges Government
Development
Priorities
Bank Group’s Response
Opportunities
Transformation of Agriculture
Existing potential in off-shore fishing
Mining potential
Potential for tourism
Unexploited off-shore oil
Challenges
State of regional instability
Weak business environment
Low agricultural productivity and food
insecurity
Restoring macroeconomic stability
Rehabilitating and rebuilding infrastructure
Shortages of skilled manpower
Overall development
objective: To attain rapid,
widely shared, sectorally and regionally balanced
economic growth with
macroeconomic stability and sustainable poverty
reduction.
Key Priority Areas
Food security and
development of cash crops
Physical and social infrastructure
Human capital development
To support the country’s effort to
reduce poverty and promote sustainable
growth through interventions that will
seek to increase the stock of human
capital through improved quality of
higher education sub-sector.
Pillar 1: Promotion of Human
resource development.
Portfolio Overview by sector
Sectors UA
millio
ns
Status of
on-going
projects
Overall
IP/DO
rating
Agric
sector
Multisecto
r
Social
sector
Transport
29.5
20.8
20.5
5.4
1
None
1
Cancelle
d
2.2/2.6
2.3/3.0
1.9/2.0
none
TOTAL 76.26 2.1/2.4
Proposed New Interventions
Sectors ADF
window
(UA
million)
Programme
d
Education 13.7
2010
Short/Medium Term Objectives
Long Term objectives
Poverty reduction and
attainment of the MDGs.
16
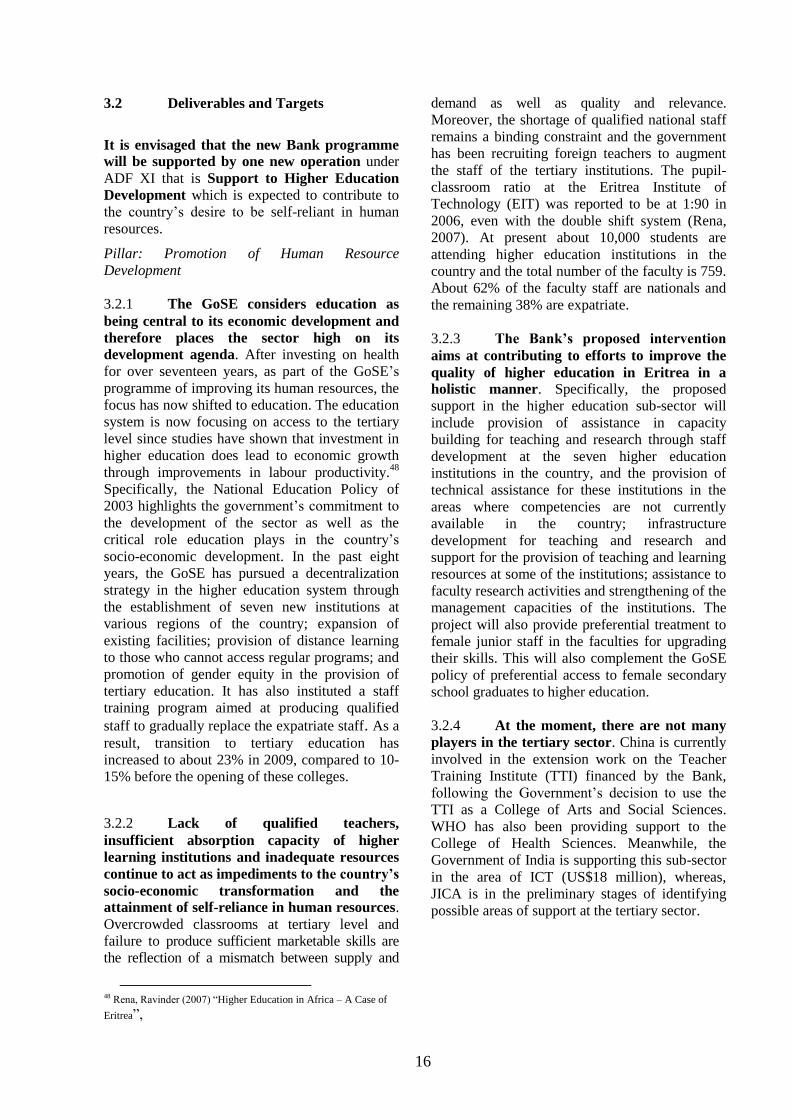
3.2 Deliverables and Targets
It is envisaged that the new Bank programme
will be supported by one new operation under
ADF XI that is Support to Higher Education
Development which is expected to contribute to
the country‘s desire to be self-reliant in human
resources.
Pillar: Promotion of Human Resource
Development
3.2.1 The GoSE considers education as
being central to its economic development and
therefore places the sector high on its
development agenda. After investing on health
for over seventeen years, as part of the GoSE‘s
programme of improving its human resources, the
focus has now shifted to education. The education
system is now focusing on access to the tertiary
level since studies have shown that investment in
higher education does lead to economic growth
through improvements in labour productivity.48
Specifically, the National Education Policy of
2003 highlights the government‘s commitment to
the development of the sector as well as the
critical role education plays in the country‘s
socio-economic development. In the past eight
years, the GoSE has pursued a decentralization
strategy in the higher education system through
the establishment of seven new institutions at
various regions of the country; expansion of
existing facilities; provision of distance learning
to those who cannot access regular programs; and
promotion of gender equity in the provision of
tertiary education. It has also instituted a staff
training program aimed at producing qualified
staff to gradually replace the expatriate staff. As a
result, transition to tertiary education has
increased to about 23% in 2009, compared to 10-
15% before the opening of these colleges.
3.2.2 Lack of qualified teachers,
insufficient absorption capacity of higher
learning institutions and inadequate resources
continue to act as impediments to the country’s
socio-economic transformation and the
attainment of self-reliance in human resources.
Overcrowded classrooms at tertiary level and
failure to produce sufficient marketable skills are
the reflection of a mismatch between supply and
48 Rena, Ravinder (2007) ―Higher Education in Africa – A Case of
Eritrea‖,
demand as well as quality and relevance.
Moreover, the shortage of qualified national staff
remains a binding constraint and the government
has been recruiting foreign teachers to augment
the staff of the tertiary institutions. The pupil-
classroom ratio at the Eritrea Institute of
Technology (EIT) was reported to be at 1:90 in
2006, even with the double shift system (Rena,
2007). At present about 10,000 students are
attending higher education institutions in the
country and the total number of the faculty is 759.
About 62% of the faculty staff are nationals and
the remaining 38% are expatriate.
3.2.3 The Bank’s proposed intervention
aims at contributing to efforts to improve the
quality of higher education in Eritrea in a
holistic manner. Specifically, the proposed
support in the higher education sub-sector will
include provision of assistance in capacity
building for teaching and research through staff
development at the seven higher education
institutions in the country, and the provision of
technical assistance for these institutions in the
areas where competencies are not currently
available in the country; infrastructure
development for teaching and research and
support for the provision of teaching and learning
resources at some of the institutions; assistance to
faculty research activities and strengthening of the
management capacities of the institutions. The
project will also provide preferential treatment to
female junior staff in the faculties for upgrading
their skills. This will also complement the GoSE
policy of preferential access to female secondary
school graduates to higher education.
3.2.4 At the moment, there are not many
players in the tertiary sector. China is currently
involved in the extension work on the Teacher
Training Institute (TTI) financed by the Bank,
following the Government‘s decision to use the
TTI as a College of Arts and Social Sciences.
WHO has also been providing support to the
College of Health Sciences. Meanwhile, the
Government of India is supporting this sub-sector
in the area of ICT (US$18 million), whereas,
JICA is in the preliminary stages of identifying
possible areas of support at the tertiary sector.
17
Table 4: Indicative Bank Programme for
Eritrea for 2009-2011: Project Title Planne
d
Board
Date
Indicative
Amount (in UA
million)
Regions
Covered
Human Resource development
Support to Higher
Education
Development
2010 13.7 (ADF
XI
allocation)
nationwi
de
Total Programmed 13.7 (UA m)
Source: AfDB database
Non-Lending Activities
3.2.5 The Bank Group will also focus its
engagement in the country on non-lending
activities. Economic and sector work (ESW) will
enhance the Bank‘s advisory role and support the
realization of the country‘s development agenda.
The Bank will explore with the Government
existing opportunities for analytical work with a
view of coming up with an agreed plan of work.
Possible sources of financing for the ESWs would
also include bilateral and thematic Trust Funds.
3.2.6 The monitoring of the ICSP will be
through regular consultations with the
Government. The performance indicators
selected in this ICSP will facilitate the monitoring
of ICSP outputs and outcomes. The Bank‘s
dialogue missions as well as the ICSP completion
report will be used as tools to assess how far the
Bank‘s interventions have contributed to the
intended results.
3.3 Country Dialogue Issues
3.3.1 Need to improve the accessibility and
availability of data: Given the data accessibility
and availability problem—with no publication and
dissemination of national statistics and data, the
Bank will continue to engage the GoSE on the
importance of having good timely data and the
legal framework to facilitate its publication and
dissemination for effective poverty reduction. The
Bank will be ready to provide capacity building
support if requested.
3.3.2 Need to improve the business
environment and governance for private sector
growth. Given the needs for further improvement
in the current environment for private sector
development and growth, the Bank will continue to
dialogue with GoSE on the need to undertake
reforms to address some of the barriers to private
sector development, competition and foreign
investment.
3.3.3 Possible areas for Studies or Economic
and Sector Work (ESWs): The Bank will
continue to engage in discussion with the GoSE on
the importance of such analytical work for
knowledge building and the deepening of policy
analysis.
3.4 Potential Risks and Mitigating Measures
3.4.1 Macroeconomic risk: Although
temporary measures have been put in place to
address the foreign exchange shortages and
revenue shortfall, they do not address the
underlying causes of scarcity for foreign
exchange and structural deficits. Therefore,
further fiscal adjustments will be required to
restore fiscal and debt sustainability and reduce
internal and external imbalances. The IMF had
expressed willingness to work with the GoSE on
fiscal adjustments and structural reform measures,
but the GoSE is currently not ready to enter into a
programme with the Fund.49
So the Bank will
continue to dialogue the GoSE on the need to
49
2008 Article IV Consultation report for Eritrea
Box 5: ICSP Preparation Process
The ICSP has been prepared using a
participatory approach, with full involvement of GoSE,
and development partners. The preparation process
started with the High Level Consultation Mission (HLC) in
March 2008, which held consultations with officials from
Government ministries and agencies, representatives from
donor community in Eritrea and the private sector. This
was then followed by the ICSP preparatory mission in June
2-6, 2008, where meetings were held with officials from the
GoSE sectors specifically involved in the ICSP as well as
those from international agencies, and organizations
including the NGOs.
The draft ICSP was sent to the GoSE mid-
September 2008, but due to concerns raised by the GoSE
regarding the contents in the draft report, the process was
put on hold. It was finally in mid-May 2009 when the Bank
received detailed comments from the GoSE. In June 2009,
the Government officially informed the Bank of the change
in priority focus for ADF XI resources from financing the
undersea fibre optic cable to financing activities in the
higher education sector. The Bank mission was then
launched during the first week of July 2009, where detailed
discussions were held on the contents of the draft and
agreement on both the nature of intervention as well as the
contents of the draft ICSP. A dialogue mission was
undertaken in mid-September 2009 and the document was
discussed and eventually cleared. The clearance was
through a formal letter to the Bank dated September 30,
2009.
18
address those structural issues to ensure
effectiveness of its support.
3.4.2 Weak Capacity for Project
management: To minimize this risk, the Bank
will organize regular training events for project
coordinators, staff, and other government officials
involved in procurement and disbursement
activities. This will ensure gradual building up of
capacity for project management. This will be
enhanced by the inbuilt capacity building
activities anticipated in the new operations
3.4.3 Risk of falling in chronic arrears
with the AFDB: The risk of the arrears situation
becoming a chronic problem is high, with the
country being in and out of sanctions and its
related effect on disbursement activities. Recent
improvements in debt management and the
expected increase in foreign exchange from the
Bisha mine should minimize this risk. The Bank
will work closely work with the GoSE to find
sustainable solution to this problem.
IV. Conclusion and Recommendations
Conclusion
4.1 The country faces many challenges.
Support from development partners, including
the Bank would be critical to achieving he
GoSE’s socio-economic objectives. The GoSE
has been using its meagre resources to improve
basic social services, service delivery, and invest
in human and physical capital in the country.
These efforts continue to be undermined by
shortages of skilled manpower, foreign exchange
shortages, recurrent drought and persistently high
fiscal deficit. The proposed Bank‘s strategy for
the period of 2009-2011 ICSP aims at
contributing to the country‘s efforts to build the
capacity of the higher education institutions
needed to produce the required stock of human
capital necessary for economic growth and
poverty reduction. The proposed interventions
would be anchored on the pillar on Promotion of
Human Resource Development.
Recommendation
4.2 The Boards of Directors are invited
to consider and approve the proposed strategic
response to the country’s challenges in higher
education elaborated in the 2009-2011 ICSP. It
is recommended that the total grant allocation
under ADF-XI of UA 13.7 million be utilized to
finance activities geared towards enhancing
human resource development.
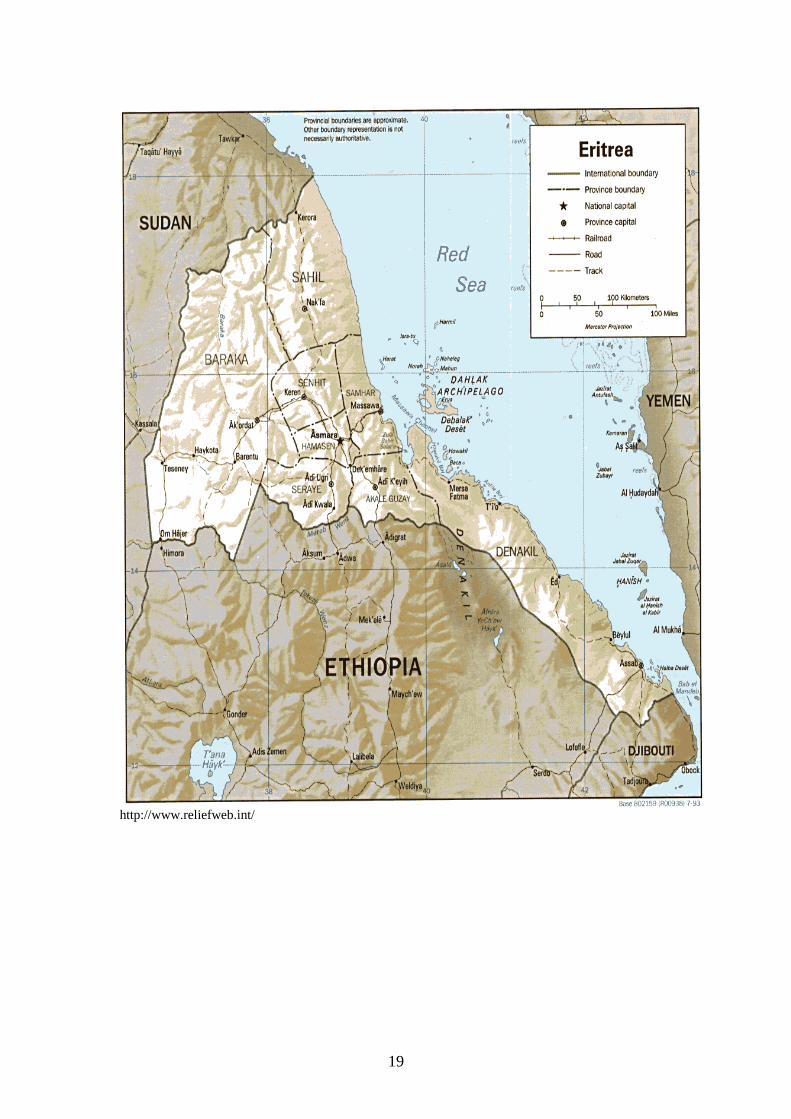
19
http://www.reliefweb.int/
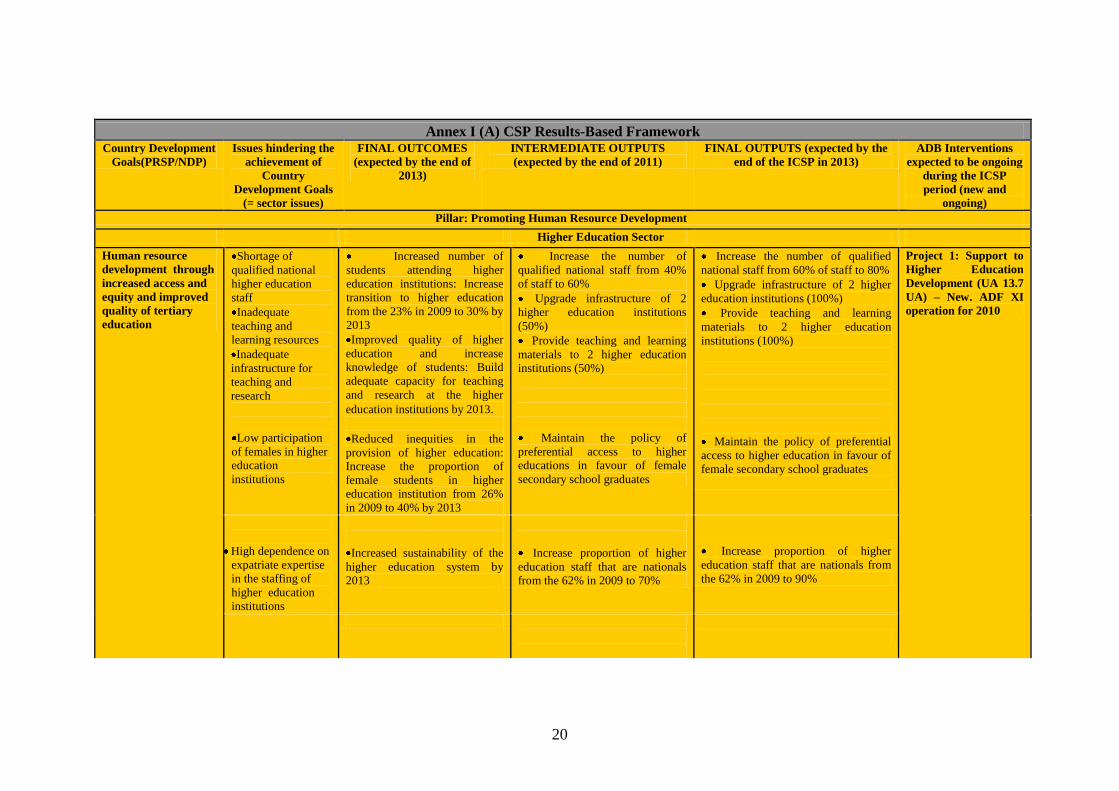
20
Annex I (A) CSP Results-Based Framework Country Development
Goals(PRSP/NDP)
Issues hindering the
achievement of
Country
Development Goals
(= sector issues)
FINAL OUTCOMES
(expected by the end of
2013)
INTERMEDIATE OUTPUTS
(expected by the end of 2011)
FINAL OUTPUTS (expected by the
end of the ICSP in 2013)
ADB Interventions
expected to be ongoing
during the ICSP
period (new and
ongoing)
Pillar: Promoting Human Resource Development
Higher Education Sector
Human resource
development through
increased access and
equity and improved
quality of tertiary
education
Shortage of
qualified national
higher education
staff
Inadequate
teaching and
learning resources
Inadequate
infrastructure for
teaching and
research
Low participation
of females in higher
education
institutions
Increased number of
students attending higher
education institutions: Increase
transition to higher education
from the 23% in 2009 to 30% by
2013
Improved quality of higher
education and increase
knowledge of students: Build
adequate capacity for teaching
and research at the higher
education institutions by 2013.
Reduced inequities in the
provision of higher education:
Increase the proportion of
female students in higher
education institution from 26%
in 2009 to 40% by 2013
Increase the number of
qualified national staff from 40%
of staff to 60%
Upgrade infrastructure of 2
higher education institutions
(50%)
Provide teaching and learning
materials to 2 higher education
institutions (50%)
Maintain the policy of
preferential access to higher
educations in favour of female
secondary school graduates
Increase the number of qualified
national staff from 60% of staff to 80%
Upgrade infrastructure of 2 higher
education institutions (100%)
Provide teaching and learning
materials to 2 higher education
institutions (100%)
Maintain the policy of preferential
access to higher education in favour of
female secondary school graduates
Project 1: Support to
Higher Education
Development (UA 13.7
UA) – New. ADF XI
operation for 2010
High dependence on
expatriate expertise
in the staffing of
higher education
institutions
Increased sustainability of the
higher education system by
2013
Increase proportion of higher
education staff that are nationals
from the 62% in 2009 to 70%
Increase proportion of higher
education staff that are nationals from
the 62% in 2009 to 90%
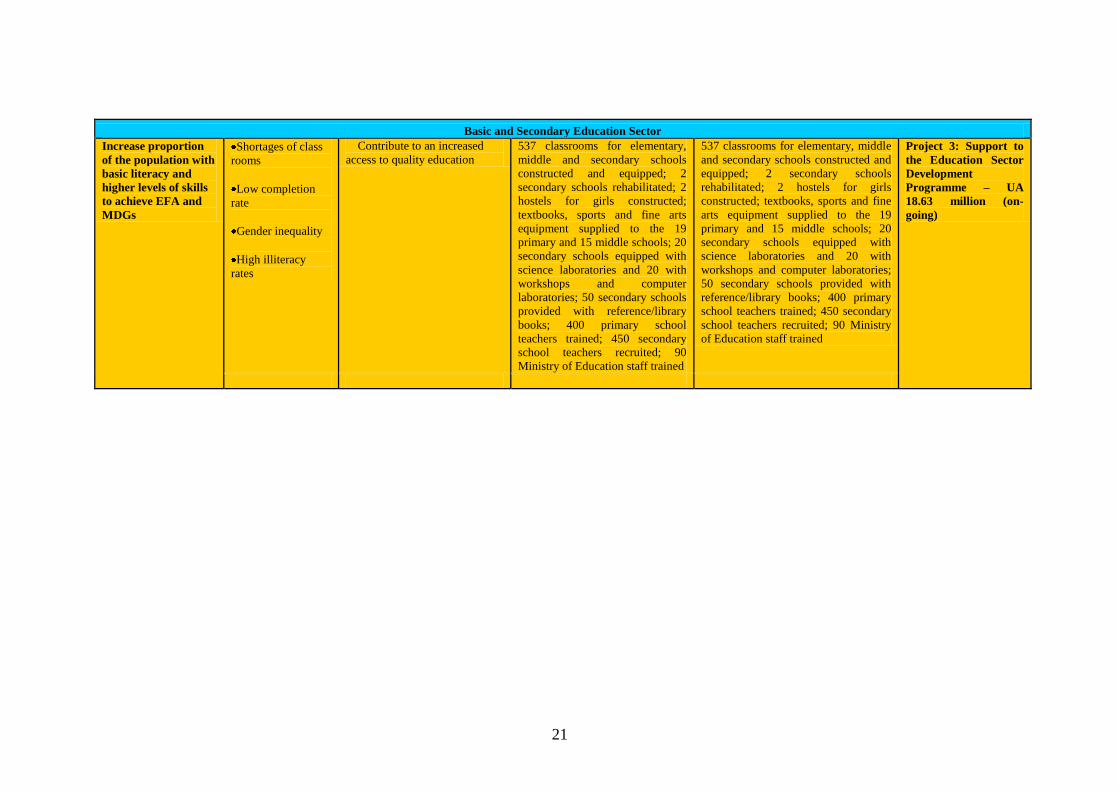
21
Basic and Secondary Education Sector
Increase proportion
of the population with
basic literacy and
higher levels of skills
to achieve EFA and
MDGs
Shortages of class
rooms
Low completion
rate
Gender inequality
High illiteracy
rates
Contribute to an increased
access to quality education
537 classrooms for elementary,
middle and secondary schools
constructed and equipped; 2
secondary schools rehabilitated; 2
hostels for girls constructed;
textbooks, sports and fine arts
equipment supplied to the 19
primary and 15 middle schools; 20
secondary schools equipped with
science laboratories and 20 with
workshops and computer
laboratories; 50 secondary schools
provided with reference/library
books; 400 primary school
teachers trained; 450 secondary
school teachers recruited; 90
Ministry of Education staff trained
537 classrooms for elementary, middle
and secondary schools constructed and
equipped; 2 secondary schools
rehabilitated; 2 hostels for girls
constructed; textbooks, sports and fine
arts equipment supplied to the 19
primary and 15 middle schools; 20
secondary schools equipped with
science laboratories and 20 with
workshops and computer laboratories;
50 secondary schools provided with
reference/library books; 400 primary
school teachers trained; 450 secondary
school teachers recruited; 90 Ministry
of Education staff trained
Project 3: Support to
the Education Sector
Development
Programme – UA
18.63 million (on-
going)
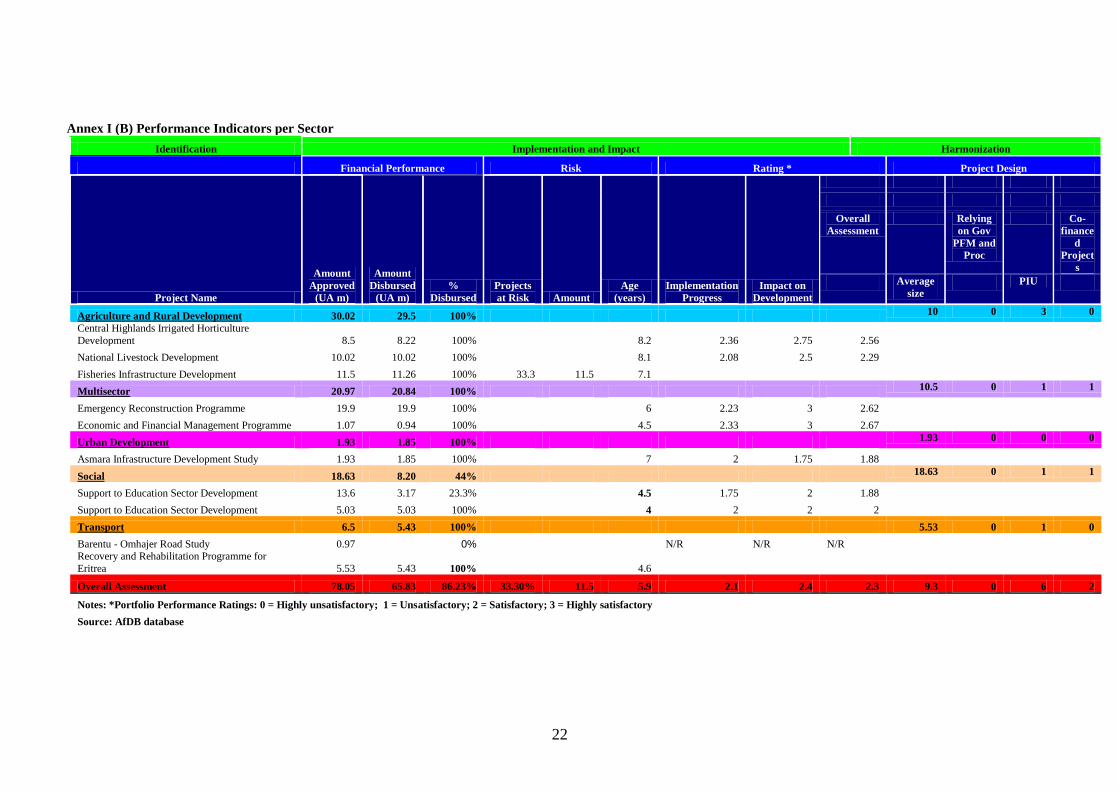
22
Annex I (B) Performance Indicators per Sector
Identification Implementation and Impact Harmonization
Financial Performance Risk Rating * Project Design
Project Name
Amount
Approved
(UA m)
Amount
Disbursed
(UA m)
%
Disbursed
Projects
at Risk Amount
Age
(years)
Implementation
Progress
Impact on
Development
Overall
Assessment
Relying
on Gov
PFM and
Proc
Co-
finance
d
Project
s
Average
size PIU
Agriculture and Rural Development 30.02 29.5 100% 10 0 3 0
Central Highlands Irrigated Horticulture
Development 8.5 8.22 100% 8.2 2.36 2.75 2.56
National Livestock Development 10.02 10.02 100% 8.1 2.08 2.5 2.29
Fisheries Infrastructure Development 11.5 11.26 100% 33.3 11.5 7.1
Multisector 20.97 20.84 100% 10.5 0 1 1
Emergency Reconstruction Programme 19.9 19.9 100% 6 2.23 3 2.62
Economic and Financial Management Programme 1.07 0.94 100% 4.5 2.33 3 2.67
Urban Development 1.93 1.85 100% 1.93 0 0 0
Asmara Infrastructure Development Study 1.93 1.85 100% 7 2 1.75 1.88
Social 18.63 8.20 44% 18.63 0 1 1
Support to Education Sector Development 13.6 3.17 23.3% 4.5 1.75 2 1.88
Support to Education Sector Development 5.03 5.03 100% 4 2 2 2
Transport 6.5 5.43 100% 5.53 0 1 0
Barentu - Omhajer Road Study 0.97 0% N/R N/R N/R Recovery and Rehabilitation Programme for
Eritrea 5.53 5.43 100% 4.6
Overall Assessment 78.05 65.83 86.23% 33.30% 11.5 5.9 2.1 2.4 2.3 9.3 0 6 2
Notes: *Portfolio Performance Ratings: 0 = Highly unsatisfactory; 1 = Unsatisfactory; 2 = Satisfactory; 3 = Highly satisfactory
Source: AfDB database
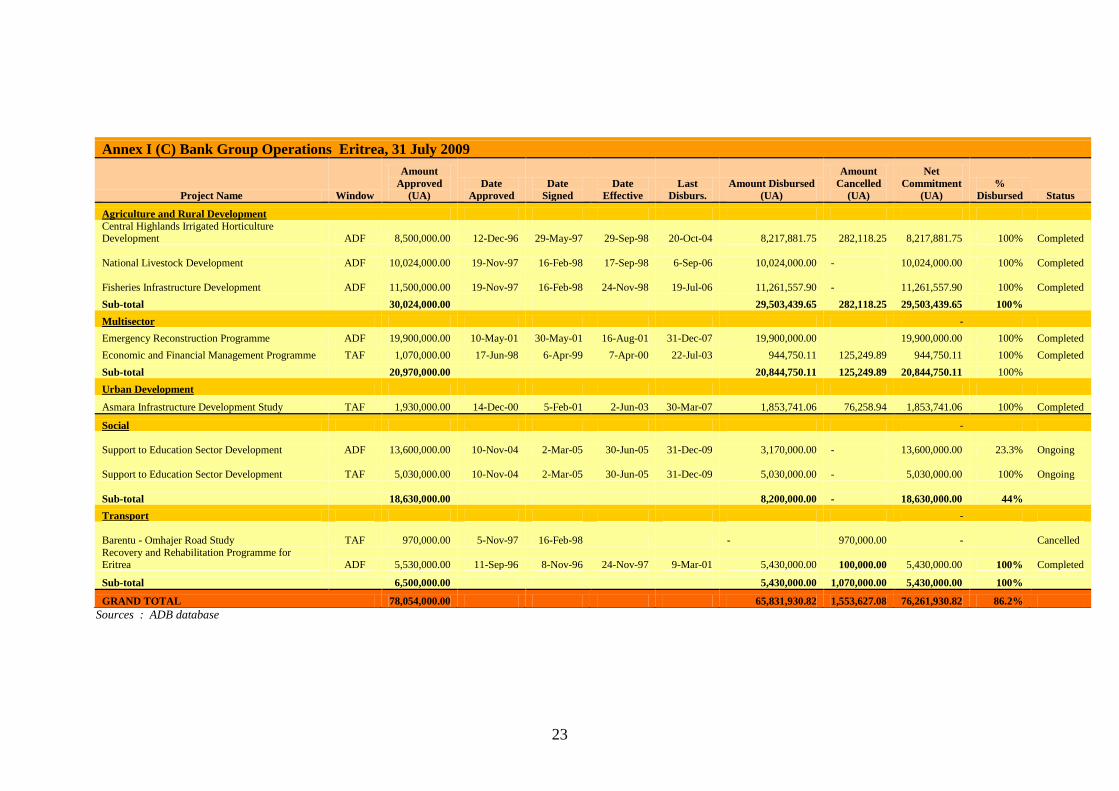
23
Annex I (C) Bank Group Operations Eritrea, 31 July 2009
Project Name Window
Amount
Approved
(UA)
Date
Approved
Date
Signed
Date
Effective
Last
Disburs.
Amount Disbursed
(UA)
Amount
Cancelled
(UA)
Net
Commitment
(UA)
%
Disbursed Status
Agriculture and Rural Development
Central Highlands Irrigated Horticulture Development ADF 8,500,000.00 12-Dec-96 29-May-97 29-Sep-98 20-Oct-04 8,217,881.75 282,118.25 8,217,881.75 100% Completed
National Livestock Development ADF 10,024,000.00 19-Nov-97 16-Feb-98 17-Sep-98 6-Sep-06 10,024,000.00
- 10,024,000.00 100% Completed
Fisheries Infrastructure Development ADF 11,500,000.00 19-Nov-97 16-Feb-98 24-Nov-98 19-Jul-06 11,261,557.90
- 11,261,557.90 100% Completed
Sub-total 30,024,000.00 29,503,439.65 282,118.25 29,503,439.65 100%
Multisector -
Emergency Reconstruction Programme ADF 19,900,000.00 10-May-01 30-May-01 16-Aug-01 31-Dec-07 19,900,000.00 19,900,000.00 100% Completed
Economic and Financial Management Programme TAF 1,070,000.00 17-Jun-98 6-Apr-99 7-Apr-00 22-Jul-03 944,750.11 125,249.89 944,750.11 100% Completed
Sub-total 20,970,000.00 20,844,750.11 125,249.89 20,844,750.11 100%
Urban Development
Asmara Infrastructure Development Study TAF 1,930,000.00 14-Dec-00 5-Feb-01 2-Jun-03 30-Mar-07 1,853,741.06 76,258.94 1,853,741.06 100% Completed
Social -
Support to Education Sector Development ADF 13,600,000.00 10-Nov-04 2-Mar-05 30-Jun-05 31-Dec-09 3,170,000.00
- 13,600,000.00 23.3% Ongoing
Support to Education Sector Development TAF 5,030,000.00 10-Nov-04 2-Mar-05 30-Jun-05 31-Dec-09 5,030,000.00 - 5,030,000.00 100% Ongoing
Sub-total 18,630,000.00 8,200,000.00
- 18,630,000.00 44%
Transport -
Barentu - Omhajer Road Study TAF 970,000.00 5-Nov-97 16-Feb-98
- 970,000.00 - Cancelled
Recovery and Rehabilitation Programme for Eritrea ADF 5,530,000.00 11-Sep-96 8-Nov-96 24-Nov-97 9-Mar-01 5,430,000.00 100,000.00 5,430,000.00 100% Completed
Sub-total 6,500,000.00 5,430,000.00 1,070,000.00 5,430,000.00 100%
GRAND TOTAL 78,054,000.00 65,831,930.82 1,553,627.08 76,261,930.82 86.2%
Sources : ADB database
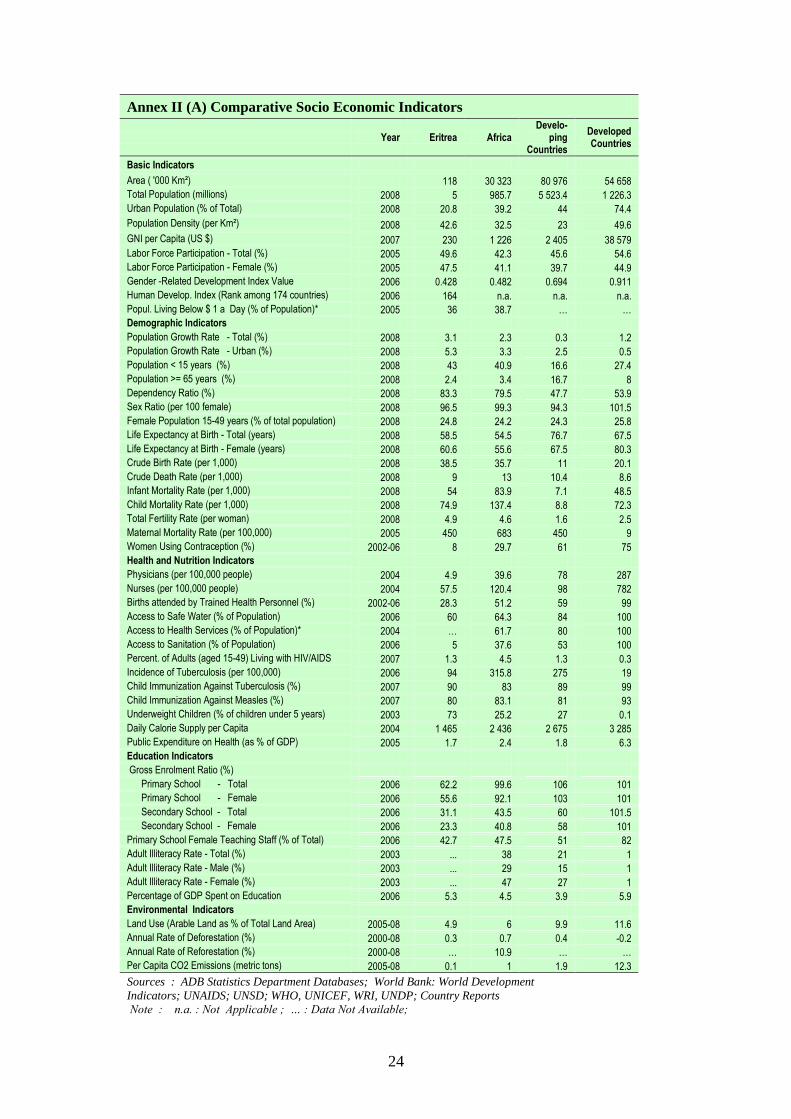
24
Annex II (A) Comparative Socio Economic Indicators
Year Eritrea Africa Develo-
ping Countries
Developed Countries
Basic Indicators
Area ( '000 Km²) 118 30 323 80 976 54 658
Total Population (millions) 2008 5 985.7 5 523.4 1 226.3
Urban Population (% of Total) 2008 20.8 39.2 44 74.4
Population Density (per Km²) 2008 42.6 32.5 23 49.6
GNI per Capita (US $) 2007 230 1 226 2 405 38 579
Labor Force Participation - Total (%) 2005 49.6 42.3 45.6 54.6
Labor Force Participation - Female (%) 2005 47.5 41.1 39.7 44.9
Gender -Related Development Index Value 2006 0.428 0.482 0.694 0.911
Human Develop. Index (Rank among 174 countries) 2006 164 n.a. n.a. n.a.
Popul. Living Below $ 1 a Day (% of Population)* 2005 36 38.7 … …
Demographic Indicators
Population Growth Rate - Total (%) 2008 3.1 2.3 0.3 1.2
Population Growth Rate - Urban (%) 2008 5.3 3.3 2.5 0.5
Population < 15 years (%) 2008 43 40.9 16.6 27.4
Population >= 65 years (%) 2008 2.4 3.4 16.7 8
Dependency Ratio (%) 2008 83.3 79.5 47.7 53.9
Sex Ratio (per 100 female) 2008 96.5 99.3 94.3 101.5
Female Population 15-49 years (% of total population) 2008 24.8 24.2 24.3 25.8
Life Expectancy at Birth - Total (years) 2008 58.5 54.5 76.7 67.5
Life Expectancy at Birth - Female (years) 2008 60.6 55.6 67.5 80.3
Crude Birth Rate (per 1,000) 2008 38.5 35.7 11 20.1
Crude Death Rate (per 1,000) 2008 9 13 10.4 8.6
Infant Mortality Rate (per 1,000) 2008 54 83.9 7.1 48.5
Child Mortality Rate (per 1,000) 2008 74.9 137.4 8.8 72.3
Total Fertility Rate (per woman) 2008 4.9 4.6 1.6 2.5
Maternal Mortality Rate (per 100,000) 2005 450 683 450 9
Women Using Contraception (%) 2002-06 8 29.7 61 75
Health and Nutrition Indicators
Physicians (per 100,000 people) 2004 4.9 39.6 78 287
Nurses (per 100,000 people) 2004 57.5 120.4 98 782
Births attended by Trained Health Personnel (%) 2002-06 28.3 51.2 59 99
Access to Safe Water (% of Population) 2006 60 64.3 84 100
Access to Health Services (% of Population)* 2004 … 61.7 80 100
Access to Sanitation (% of Population) 2006 5 37.6 53 100
Percent. of Adults (aged 15-49) Living with HIV/AIDS 2007 1.3 4.5 1.3 0.3
Incidence of Tuberculosis (per 100,000) 2006 94 315.8 275 19
Child Immunization Against Tuberculosis (%) 2007 90 83 89 99
Child Immunization Against Measles (%) 2007 80 83.1 81 93
Underweight Children (% of children under 5 years) 2003 73 25.2 27 0.1
Daily Calorie Supply per Capita 2004 1 465 2 436 2 675 3 285
Public Expenditure on Health (as % of GDP) 2005 1.7 2.4 1.8 6.3
Education Indicators
Gross Enrolment Ratio (%)
Primary School - Total 2006 62.2 99.6 106 101
Primary School - Female 2006 55.6 92.1 103 101
Secondary School - Total 2006 31.1 43.5 60 101.5
Secondary School - Female 2006 23.3 40.8 58 101
Primary School Female Teaching Staff (% of Total) 2006 42.7 47.5 51 82
Adult Illiteracy Rate - Total (%) 2003 ... 38 21 1
Adult Illiteracy Rate - Male (%) 2003 ... 29 15 1
Adult Illiteracy Rate - Female (%) 2003 ... 47 27 1
Percentage of GDP Spent on Education 2006 5.3 4.5 3.9 5.9
Environmental Indicators
Land Use (Arable Land as % of Total Land Area) 2005-08 4.9 6 9.9 11.6
Annual Rate of Deforestation (%) 2000-08 0.3 0.7 0.4 -0.2
Annual Rate of Reforestation (%) 2000-08 … 10.9 … …
Per Capita CO2 Emissions (metric tons) 2005-08 0.1 1 1.9 12.3
Sources : ADB Statistics Department Databases; World Bank: World Development
Indicators; UNAIDS; UNSD; WHO, UNICEF, WRI, UNDP; Country Reports
Note : n.a. : Not Applicable ; … : Data Not Available;
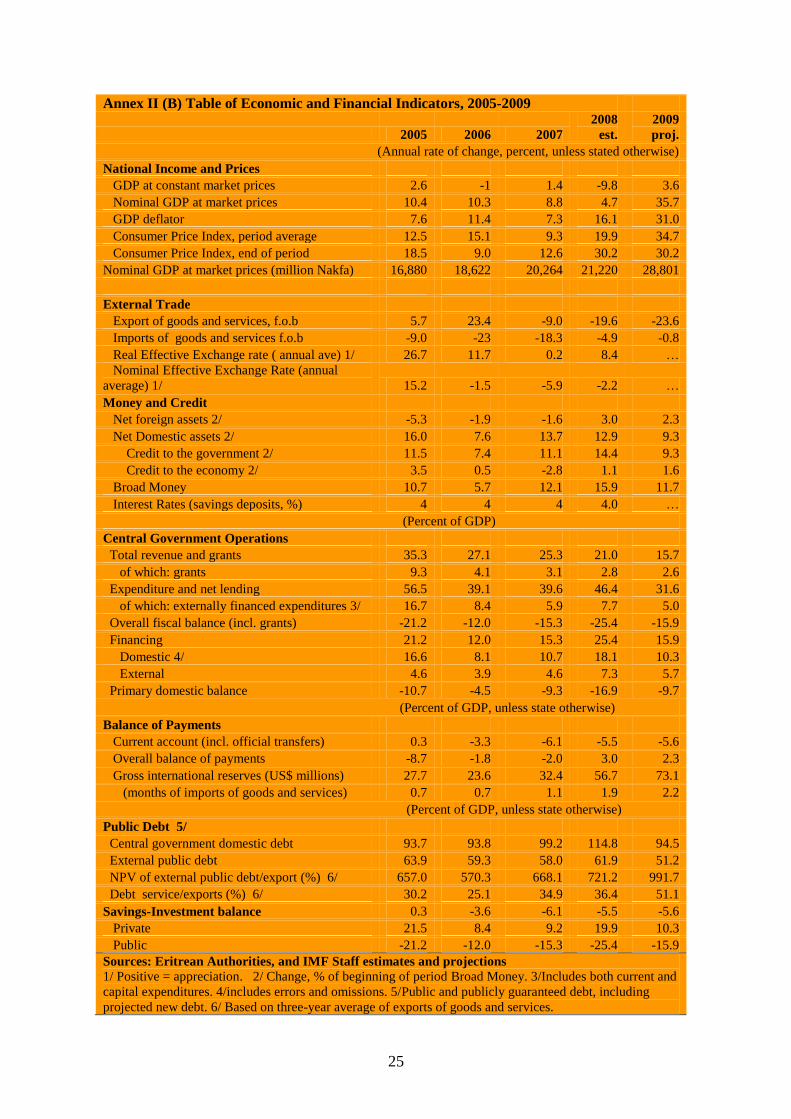
25
Annex II (B) Table of Economic and Financial Indicators, 2005-2009
2005 2006 2007
2008
est.
2009
proj.
(Annual rate of change, percent, unless stated otherwise)
National Income and Prices
GDP at constant market prices 2.6 -1 1.4 -9.8 3.6
Nominal GDP at market prices 10.4 10.3 8.8 4.7 35.7
GDP deflator 7.6 11.4 7.3 16.1 31.0
Consumer Price Index, period average 12.5 15.1 9.3 19.9 34.7
Consumer Price Index, end of period 18.5 9.0 12.6 30.2 30.2
Nominal GDP at market prices (million Nakfa) 16,880 18,622 20,264 21,220 28,801
External Trade
Export of goods and services, f.o.b 5.7 23.4 -9.0 -19.6 -23.6
Imports of goods and services f.o.b -9.0 -23 -18.3 -4.9 -0.8
Real Effective Exchange rate ( annual ave) 1/ 26.7 11.7 0.2 8.4 …
Nominal Effective Exchange Rate (annual
average) 1/ 15.2 -1.5 -5.9 -2.2 …
Money and Credit
Net foreign assets 2/ -5.3 -1.9 -1.6 3.0 2.3
Net Domestic assets 2/ 16.0 7.6 13.7 12.9 9.3
Credit to the government 2/ 11.5 7.4 11.1 14.4 9.3
Credit to the economy 2/ 3.5 0.5 -2.8 1.1 1.6
Broad Money 10.7 5.7 12.1 15.9 11.7
Interest Rates (savings deposits, %) 4 4 4 4.0 …
(Percent of GDP)
Central Government Operations
Total revenue and grants 35.3 27.1 25.3 21.0 15.7
of which: grants 9.3 4.1 3.1 2.8 2.6
Expenditure and net lending 56.5 39.1 39.6 46.4 31.6
of which: externally financed expenditures 3/ 16.7 8.4 5.9 7.7 5.0
Overall fiscal balance (incl. grants) -21.2 -12.0 -15.3 -25.4 -15.9
Financing 21.2 12.0 15.3 25.4 15.9
Domestic 4/ 16.6 8.1 10.7 18.1 10.3
External 4.6 3.9 4.6 7.3 5.7
Primary domestic balance -10.7 -4.5 -9.3 -16.9 -9.7
(Percent of GDP, unless state otherwise)
Balance of Payments
Current account (incl. official transfers) 0.3 -3.3 -6.1 -5.5 -5.6
Overall balance of payments -8.7 -1.8 -2.0 3.0 2.3
Gross international reserves (US$ millions) 27.7 23.6 32.4 56.7 73.1
(months of imports of goods and services) 0.7 0.7 1.1 1.9 2.2
(Percent of GDP, unless state otherwise)
Public Debt 5/
Central government domestic debt 93.7 93.8 99.2 114.8 94.5
External public debt 63.9 59.3 58.0 61.9 51.2
NPV of external public debt/export (%) 6/ 657.0 570.3 668.1 721.2 991.7
Debt service/exports (%) 6/ 30.2 25.1 34.9 36.4 51.1
Savings-Investment balance 0.3 -3.6 -6.1 -5.5 -5.6
Private 21.5 8.4 9.2 19.9 10.3
Public -21.2 -12.0 -15.3 -25.4 -15.9
Sources: Eritrean Authorities, and IMF Staff estimates and projections
1/ Positive = appreciation. 2/ Change, % of beginning of period Broad Money. 3/Includes both current and
capital expenditures. 4/includes errors and omissions. 5/Public and publicly guaranteed debt, including
projected new debt. 6/ Based on three-year average of exports of goods and services.
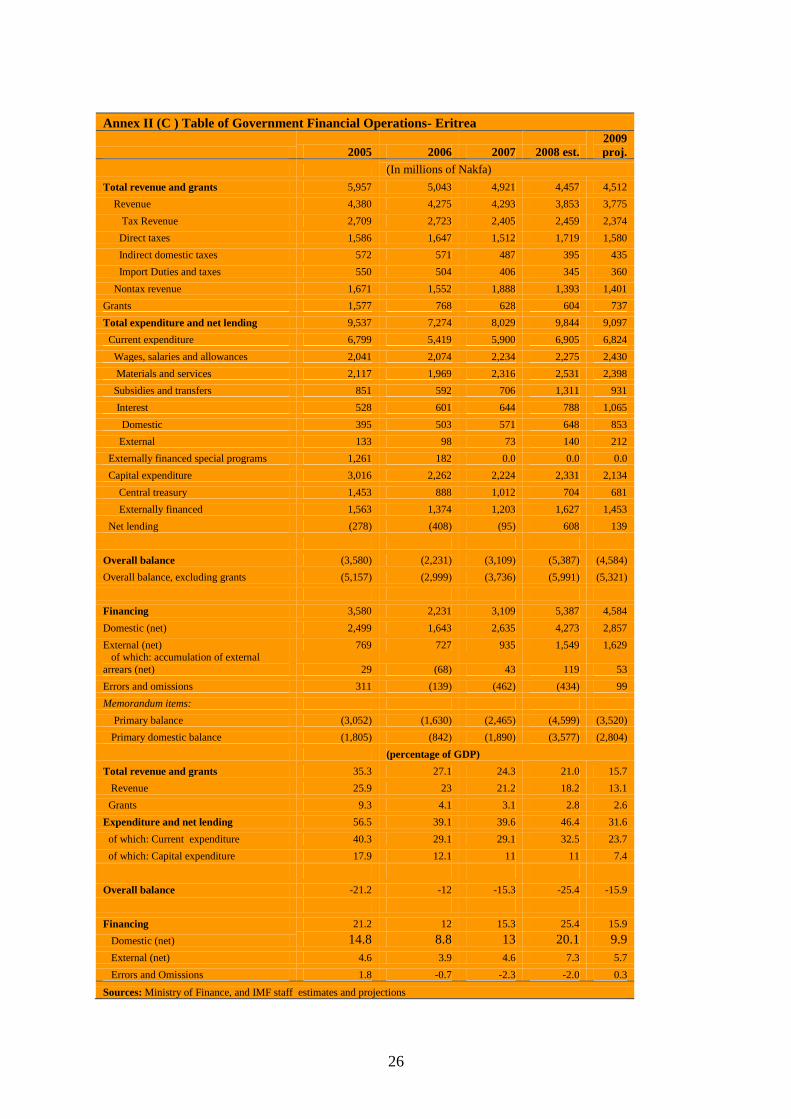
26
Annex II (C ) Table of Government Financial Operations- Eritrea
2005 2006 2007 2008 est.
2009
proj.
(In millions of Nakfa)
Total revenue and grants 5,957 5,043 4,921 4,457 4,512
Revenue 4,380 4,275 4,293 3,853 3,775
Tax Revenue 2,709 2,723 2,405 2,459 2,374
Direct taxes 1,586 1,647 1,512 1,719 1,580
Indirect domestic taxes 572 571 487 395 435
Import Duties and taxes 550 504 406 345 360
Nontax revenue 1,671 1,552 1,888 1,393 1,401
Grants 1,577 768 628 604 737
Total expenditure and net lending 9,537 7,274 8,029 9,844 9,097
Current expenditure 6,799 5,419 5,900 6,905 6,824
Wages, salaries and allowances 2,041 2,074 2,234 2,275 2,430
Materials and services 2,117 1,969 2,316 2,531 2,398
Subsidies and transfers 851 592 706 1,311 931
Interest 528 601 644 788 1,065
Domestic 395 503 571 648 853
External 133 98 73 140 212
Externally financed special programs 1,261 182 0.0 0.0 0.0
Capital expenditure 3,016 2,262 2,224 2,331 2,134
Central treasury 1,453 888 1,012 704 681
Externally financed 1,563 1,374 1,203 1,627 1,453
Net lending (278) (408) (95) 608 139
Overall balance (3,580) (2,231) (3,109) (5,387) (4,584)
Overall balance, excluding grants (5,157) (2,999) (3,736) (5,991) (5,321)
Financing 3,580 2,231 3,109 5,387 4,584
Domestic (net) 2,499 1,643 2,635 4,273 2,857
External (net) 769 727 935 1,549 1,629 of which: accumulation of external
arrears (net) 29 (68) 43 119 53
Errors and omissions 311 (139) (462) (434) 99
Memorandum items:
Primary balance (3,052) (1,630) (2,465) (4,599) (3,520)
Primary domestic balance (1,805) (842) (1,890) (3,577) (2,804)
(percentage of GDP)
Total revenue and grants 35.3 27.1 24.3 21.0 15.7
Revenue 25.9 23 21.2 18.2 13.1
Grants 9.3 4.1 3.1 2.8 2.6
Expenditure and net lending 56.5 39.1 39.6 46.4 31.6
of which: Current expenditure 40.3 29.1 29.1 32.5 23.7
of which: Capital expenditure 17.9 12.1 11 11 7.4
Overall balance -21.2 -12 -15.3 -25.4 -15.9
Financing 21.2 12 15.3 25.4 15.9
Domestic (net) 14.8 8.8 13 20.1 9.9
External (net) 4.6 3.9 4.6 7.3 5.7
Errors and Omissions 1.8 -0.7 -2.3 -2.0 0.3
Sources: Ministry of Finance, and IMF staff estimates and projections
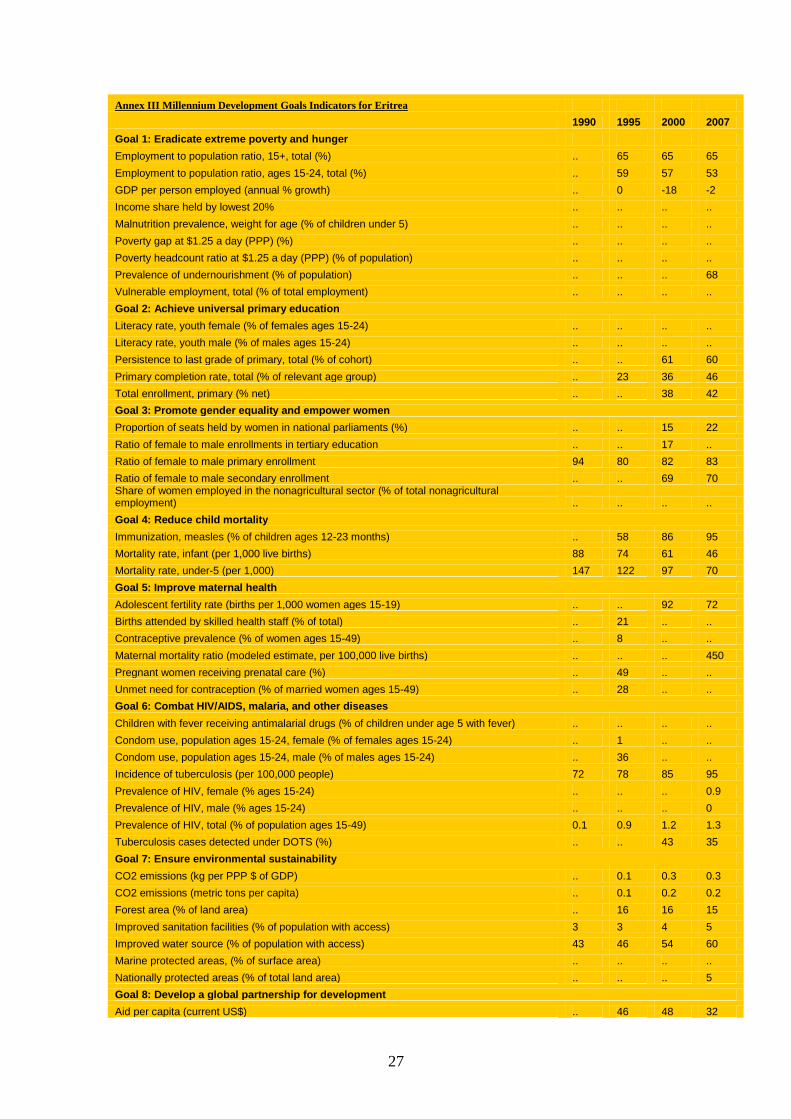
27
Annex III Millennium Development Goals Indicators for Eritrea
1990 1995 2000 2007
Goal 1: Eradicate extreme poverty and hunger
Employment to population ratio, 15+, total (%) .. 65 65 65
Employment to population ratio, ages 15-24, total (%) .. 59 57 53
GDP per person employed (annual % growth) .. 0 -18 -2
Income share held by lowest 20% .. .. .. ..
Malnutrition prevalence, weight for age (% of children under 5) .. .. .. ..
Poverty gap at $1.25 a day (PPP) (%) .. .. .. ..
Poverty headcount ratio at $1.25 a day (PPP) (% of population) .. .. .. ..
Prevalence of undernourishment (% of population) .. .. .. 68
Vulnerable employment, total (% of total employment) .. .. .. ..
Goal 2: Achieve universal primary education
Literacy rate, youth female (% of females ages 15-24) .. .. .. ..
Literacy rate, youth male (% of males ages 15-24) .. .. .. ..
Persistence to last grade of primary, total (% of cohort) .. .. 61 60
Primary completion rate, total (% of relevant age group) .. 23 36 46
Total enrollment, primary (% net) .. .. 38 42
Goal 3: Promote gender equality and empower women
Proportion of seats held by women in national parliaments (%) .. .. 15 22
Ratio of female to male enrollments in tertiary education .. .. 17 ..
Ratio of female to male primary enrollment 94 80 82 83
Ratio of female to male secondary enrollment .. .. 69 70 Share of women employed in the nonagricultural sector (% of total nonagricultural employment) .. .. .. ..
Goal 4: Reduce child mortality
Immunization, measles (% of children ages 12-23 months) .. 58 86 95
Mortality rate, infant (per 1,000 live births) 88 74 61 46
Mortality rate, under-5 (per 1,000) 147 122 97 70
Goal 5: Improve maternal health
Adolescent fertility rate (births per 1,000 women ages 15-19) .. .. 92 72
Births attended by skilled health staff (% of total) .. 21 .. ..
Contraceptive prevalence (% of women ages 15-49) .. 8 .. ..
Maternal mortality ratio (modeled estimate, per 100,000 live births) .. .. .. 450
Pregnant women receiving prenatal care (%) .. 49 .. ..
Unmet need for contraception (% of married women ages 15-49) .. 28 .. ..
Goal 6: Combat HIV/AIDS, malaria, and other diseases
Children with fever receiving antimalarial drugs (% of children under age 5 with fever) .. .. .. ..
Condom use, population ages 15-24, female (% of females ages 15-24) .. 1 .. ..
Condom use, population ages 15-24, male (% of males ages 15-24) .. 36 .. ..
Incidence of tuberculosis (per 100,000 people) 72 78 85 95
Prevalence of HIV, female (% ages 15-24) .. .. .. 0.9
Prevalence of HIV, male (% ages 15-24) .. .. .. 0
Prevalence of HIV, total (% of population ages 15-49) 0.1 0.9 1.2 1.3
Tuberculosis cases detected under DOTS (%) .. .. 43 35
Goal 7: Ensure environmental sustainability
CO2 emissions (kg per PPP $ of GDP) .. 0.1 0.3 0.3
CO2 emissions (metric tons per capita) .. 0.1 0.2 0.2
Forest area (% of land area) .. 16 16 15
Improved sanitation facilities (% of population with access) 3 3 4 5
Improved water source (% of population with access) 43 46 54 60
Marine protected areas, (% of surface area) .. .. .. ..
Nationally protected areas (% of total land area) .. .. .. 5
Goal 8: Develop a global partnership for development
Aid per capita (current US$) .. 46 48 32
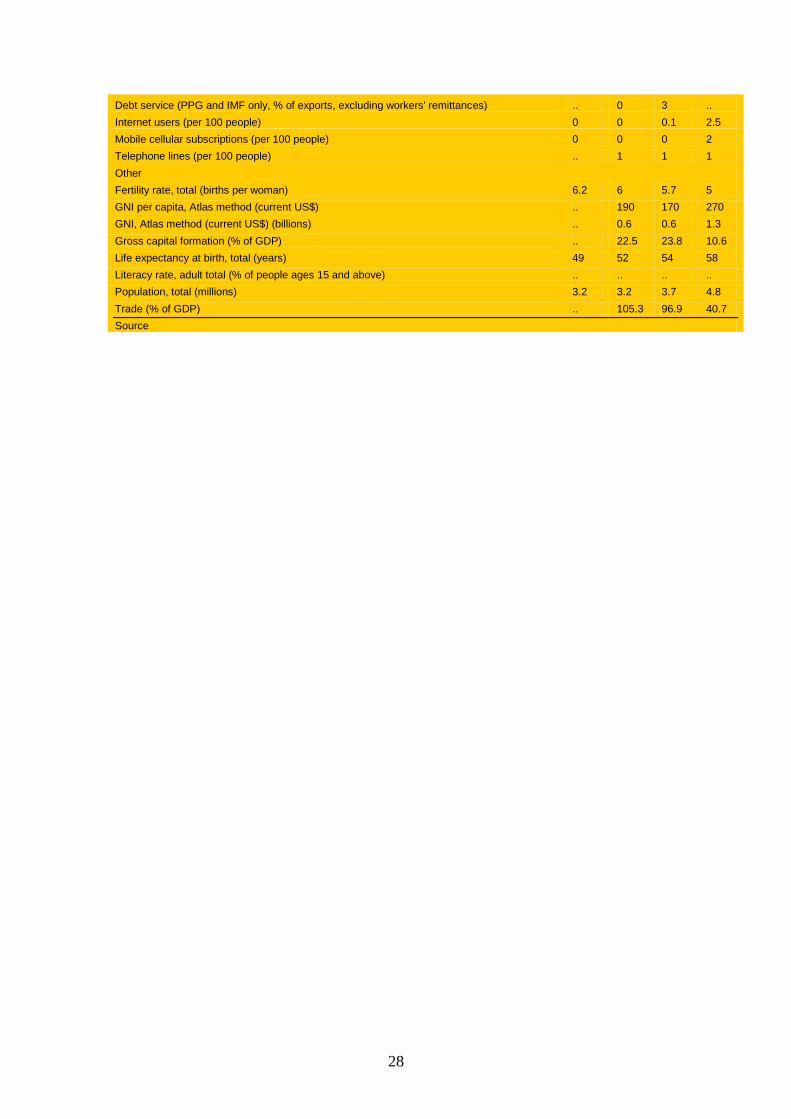
28
Debt service (PPG and IMF only, % of exports, excluding workers' remittances) .. 0 3 ..
Internet users (per 100 people) 0 0 0.1 2.5
Mobile cellular subscriptions (per 100 people) 0 0 0 2
Telephone lines (per 100 people) .. 1 1 1
Other
Fertility rate, total (births per woman) 6.2 6 5.7 5
GNI per capita, Atlas method (current US$) .. 190 170 270
GNI, Atlas method (current US$) (billions) .. 0.6 0.6 1.3
Gross capital formation (% of GDP) .. 22.5 23.8 10.6
Life expectancy at birth, total (years) 49 52 54 58
Literacy rate, adult total (% of people ages 15 and above) .. .. .. ..
Population, total (millions) 3.2 3.2 3.7 4.8
Trade (% of GDP) .. 105.3 96.9 40.7
Source
29
List of References
1. GoSE 2004, Interim Poverty Reduction Strategy
2. GoSE 2003, National Education Policy
3. GoSE 2007, Agricultural Development Programme2008-2010,
4. GoSE, 1995-2002 Demographic and Health Survey
5. UNCTAD, World Investment Report 2007
6. IMF 2008, Article IV Consultation Report
7. IMF April 2009, World Economic Outlook/Regional Economic Outlook
8. World Bank 2008, Eritrea At Glance -http://devdata.worldbank.org/AAG/eri_aag.pdf
9. World Bank 2008, Interim Strategy Note for Eritrea
10. UNDP, Human Development Index 2008 Report
11. UN 2007, United Nations Development Assistance Framework 2007-2011
12. Economic Intelligence Unit, Country Reports for Eritrea 2008-2009
13. Business Monitor International, Country Reports and Assessments
14. Transparency International, 2009 Corruption Perception Index
15. World Bank 2009, Doing Business Report –
16. World Development Indicators Database
17. Mo Ibrahim 2008, Ibrahim Index of African Governance
18. UNICEF 2008, State of the World Children
19. AFDB 2009, Eritrea_Food Crisis Support from Surplus Account
20. AFDB 2009, Country Gender Profile for Eritrea
21. COMESA 2008, Regional Perspectives 2007-2008
22. Kauffmann D., A. Kraay and M. Mastuzzi 2009: Governance Matters VII:
Governance Indicators 1996-2008.
23. Rena, Ravinder (2007) ―Higher Education in Africa – A Case of Eritrea‖, New Delhi:
Journal of Educational Planning and Administration, Vol.21, No. 2. (April)
24. IMF March 2009, Implication of the Global Financial Crisis for Low-Income
Countries


