INTELLIGENT TRANSPORTATION SYSTEMS: HELPING PUBLIC TRANSIT SUPPORT WELFARE TO WORK INITIATIVES
Jill A. Hough* Crystal Bahe
Mary Lou Murphy Jennifer Swenson
Upper Great Plains Transportation Institute North Dakota State University
P.O. Box 5074 Fargo, ND 58105
701.231.7767 www.ugpti.org
May 2002
*Hough is an Associate Research Fellow, Bahe is a Student Research Assistant, Murphy and Swenson are former UGPTI Student Research Assistants that assisted with this study.

ii
Acknowledgments The report has been prepared with funds provided by the Federal Transit Administration (FTA) through the Intelligent Transportation System Joint Program Office (ITS JPO) and by the Mountain Plains Consortium (MPC). The MPC receives funding from the U.S. Department of Transportation. Other MPC member universities include North Dakota State University, Colorado State University, University of Wyoming, and Utah State University. The authors would like to thank Bridgewater State College and the Community Transportation Association of America for providing mailing lists. Thanks are extended to the many transit operators that completed the questionnaires. Thank you to Laurel Benson for assistance with the data entry. Thanks also are extended to Kiel Ova and Matthew Martimo for technical assistance in the follow-up Web-based survey. Thank you to Paul Colton of the Metropolitan Council in St. Paul, Minn., for hosting the site visit to Metro. Finally, thank you to Ayman Smadi for his helpful suggestions.
Disclaimer
The contents of this report reflect the views of the author, who is responsible for the facts and accuracy of the information presented herein. This document is disseminated under the sponsorship of the Department of Transportation, University Transportation Centers Program, and the Federal Transit Administration, in the interest of information exchange. The U.S. Government assumes no liability for the contents or use thereof.

iii
TABLE OF CONTENTS
INTRODUCTION............................................................................................................. 1
BACKGROUND ON INTELLIGENT TRANSPORTATION SYSTEMS................. 2
Fleet Management and Operations ................................................................................. 2 Automatic Passenger Counter.......................................................................................... 3 Automatic Vehicle Location............................................................................................ 3 Geographic Information Systems .................................................................................... 4 Scheduling and Dispatch ................................................................................................. 5 Traffic Signal Priority...................................................................................................... 5
Traveler Information Systems ......................................................................................... 6 Automated Trip Itineraries .............................................................................................. 6 In-Vehicle Announcers .................................................................................................... 7 Interactive Kiosks ............................................................................................................ 8 Variable Message Signs and Monitors ............................................................................ 9
Electronic Fare Collection.............................................................................................. 10 Electronic Fare Collection............................................................................................. 10
WELFARE REFORM BACKGROUND ..................................................................... 11
RESEARCH METHODS............................................................................................... 14
Survey Instrument Design, Mailings, and Response Rates......................................... 14 Survey I.......................................................................................................................... 14 Survey II - Web Based Questionnaire ........................................................................... 18
RESULTS ........................................................................................................................ 20
Overview of Transit Systems Responding to Questionnaire I .................................... 20 Vehicles Operated and Accessibility............................................................................. 20
Communications ............................................................................................................. 22
Funding Flexibility .......................................................................................................... 24
Results from Survey II – Focus Upon Transit Systems Using ITS............................. 25
RURAL SYSTEMS......................................................................................................... 27
Transit Management ...................................................................................................... 28 Automatic Vehicle Location.......................................................................................... 28

iv
Geographic Information Systems .................................................................................. 28 Scheduling and Dispatching .......................................................................................... 30 Signal Priority................................................................................................................ 32
Traveler Information Systems ....................................................................................... 33 In-Vehicle Announcer ................................................................................................... 33
SMALL AND MEDIUM URBAN................................................................................. 33
Transit Management ...................................................................................................... 35 Automatic Passenger Counters ...................................................................................... 35 Automatic Vehicle Location.......................................................................................... 36 Geographic Information Systems .................................................................................. 37 Scheduling and Dispatching .......................................................................................... 39
Traveler Information Systems ....................................................................................... 42 Automated Trip Itineraries ............................................................................................ 42 In-Vehicle Announcer ................................................................................................... 44 Variable Message Signs................................................................................................. 45 Web................................................................................................................................ 45
Electronic Fare Collection.............................................................................................. 45 Electronic Fare Collection............................................................................................. 45
LARGE URBAN TRANSIT SYSTEMS....................................................................... 47
Transit Management ...................................................................................................... 47 Automatic Passenger Counters ...................................................................................... 49 Automatic Vehicle Location.......................................................................................... 51 Geographic Information Systems .................................................................................. 53 Scheduling and Dispatching Software ........................................................................... 55 Signal Priority................................................................................................................ 57
Traveler Information Systems ....................................................................................... 58 Automated Trip Itinerary............................................................................................... 58 In-Vehicle Announcers .................................................................................................. 60 Kiosks ............................................................................................................................ 61 Variable Message Signs................................................................................................. 62 Web................................................................................................................................ 62
Electronic Fare Collection.............................................................................................. 63 Electronic Fare Collection............................................................................................. 63
ITS AND WELFARE TO WORK ................................................................................ 66
Survey I Results............................................................................................................... 66
v
Survey II Results ............................................................................................................. 67 Automatic Vehicle Location.......................................................................................... 69 Scheduling and Dispatch ............................................................................................... 69 Electronic Fare Collection (EFC) .................................................................................. 69 Geographic Information Systems (GIS) ........................................................................ 70 Automated Trip Itinerary (ATI)..................................................................................... 70 Web................................................................................................................................ 70
PLANNED FUTURE ITS USE...................................................................................... 71
SUMMARY..................................................................................................................... 72
CONCLUSIONS ............................................................................................................. 74
REFERENCES................................................................................................................ 75

vi
LIST OF FIGURES
Figure 1. Sample Frame of Study ..................................................................................... 15 Figure 2. Transit Systems Using ITS, Survey I. ............................................................... 17 Figure 3. Transit Systems Using ITS, Responding to Survey II....................................... 19 Figure 4. Accessible Distance for Passengers to Walk/Travel to Use Public
Transportation, by Percentage, based on Transit Systems Using ITS. ........... 21 Figure 5. Transit Systems Using Specific ITS Technology, by Percentage ..................... 22 Figure 6. Communication Equipment Used between Dispatch and Vehicles for
Systems Utilizing ITS. .................................................................................... 24 Figure 7. Technologies Used by Rural Transit Systems Responding to Survey II........... 29 Figure 8. Length of Time Rural Transit Systems Responding Have Used S&D. ............ 30 Figure 9. Impacts on Rural Transit Systems Responding, as a Result of
Implementing S&D. ........................................................................................ 31 Figure 10. Changes in Rural Transit Systems Costs as a Result of Implementing
S&D. ............................................................................................................... 32 Figure 11. Small and Medium Urban Population Categories. .......................................... 34 Figure 12. Length of Time Small and Medium Urban Transit Systems Have
Used APC........................................................................................................ 35 Figure 13. Length of Time Small and Medium Urban Transit Systems Reporting
Have Used AVL. ............................................................................................. 36 Figure 14. Length of Time Small and Medium Urban Transit Systems Have
Used GIS. ........................................................................................................ 37 Figure 15. Results since Transit Systems Have Implemented GIS. ................................. 38 Figure 16. Changes in Costs and Revenues for Small and Medium Transit Systems
as a Result of Implementing GIS. ................................................................... 39 Figure 17. Length of Time Small and Medium Urban Transit Systems Have
Been Using S&D. ............................................................................................ 40
vii
Figure 18. Results Attributed to Implementing Scheduling and Dispatching Software, by Small and Medium Urban Transit Systems. .............................................. 41
Figure 19. Operating and Capital Cost Changes Experienced by Small and Medium
Urban Transit Systems as a Result of Implementing S&D Software. ............ 42 Figure 20. Length of Time Small and Medium Urban Transit Systems Have
Used ATI......................................................................................................... 43 Figure 21. Results Since Small and Medium Urban Systems Have Implemented
ATI. ................................................................................................................. 44 Figure 22. Length of Time Small and Medium Urban Transit Systems Reported Use
of EFC. ............................................................................................................ 46 Figure 23. Technologies Used by Large Urban Transit Systems Responding, by State. . 48 Figure 24. Length of Time Large Urban Transit Systems Have Been Using APC. ......... 49 Figure 25. Results Since Large Urban Transit Systems Have Implemented APC. .......... 50 Figure 26. Length of Time Large Urban Transit Systems Have Been Using AVL. ......... 51 Figure 27. Results Since Large Urban Transit Systems Have Implemented AVL. .......... 52 Figure 28. Change in Costs for Large Urban Transit Systems Due to Implementing AVL. ........................................................................................ 53 Figure 29. Length of Time Large Urban Transit Systems Have Been Using GIS. .......... 54 Figure 30. Results of Large Urban Transit Systems Since Implementing GIS. ............... 54 Figure 31. Length of Time Large Urban Transit Systems Have Been Using S&D. ......... 55 Figure 32. Results of Large Urban Transit Systems That Have Implemented S&D. ....... 56 Figure 33. Change in Costs Due to Implementing S&D. ................................................. 57 Figure 34. Length of Time Transits Have Been Using SP. .............................................. 58 Figure 35. Length of Time Large Urban Transit Systems Have Been Using ATI. .......... 59 Figure 36. Results Since Large Urban Transit Systems Have Implemented ATI. ........... 60 Figure 37. Length of Time Large Urban Transit Systems Have Been Using IVA. .......... 61
viii
Figure 38. Length of Time Large Urban Transit Systems Have Been Using WEB. ........ 62 Figure 39. Length of Time Large Urban Transit Systems Have Been Using EFC. ......... 63 Figure 40. Results Since Large Urban Transit Systems Have Implemented EFC............ 64 Figure 41. Change in Costs for Large Urban Transit Systems Due to
Implementing EFC.......................................................................................... 65
ix
LIST OF TABLES
Table 1. Transit System Breakdown by Population and Square Mileage Service Areas ........... 26 Table 2. ITS Technologies Used by Each Population Category................................................. 26 Table 3. Technologies Used by Rural Transit Systems .............................................................. 27 Table 4. Small and Medium Urban Technologies ...................................................................... 33 Table 5. ITS Used by Large Urban System................................................................................ 47 Table 6. Changes in Transit Service to Welfare Recipients as a Result of Implementing
ITS Technology............................................................................................................. 68 Table 7. Number of Future Technologies to be Implemented, by Population Category............ 71
x
List of Acronyms & Abbreviations AFDC Aid to Families with Dependent Children
APC Automatic Passenger Counters
ATI Automated Trip Itinerary
AVL Automatic Vehicle Location
CTAA Community Transportation Association of America
FTA Federal Transit Administration
GPS Global Positioning Systems
ISTEA Intermodal Surface Transportation Efficiency Act of 1991
ITS Intelligent Transportation Systems
IVA In-Vehicle Announcer
JOBS Job Opportunities and Basic Skills Training
KIOSKS Kiosks
S&D Scheduling and Dispatching
SP Signal Priority
TANF Temporary Assistance for Needy Families
TEA 21 Transportation Equity Act for the 21st Century
US United States
VMS Variable Message Signs
WEB Web-based technologies

xi
EXECUTIVE SUMMARY This study was conducted to identify ITS technologies that transit systems are using, and
particularly to aid in the progress of the Welfare to Work Initiative. ITS technologies
categorized in Fleet Management and Operations, Traveler Information Systems, and
Electronic Fare Collection were identified and presented to Transit Managers for
selection of technologies used by their systems. The technologies within Transit
Management include Automatic Passenger Counter (APC), Automatic Vehicle Locator
(AVL), Geographic Information Systems (GIS), Scheduling and Dispatch (S&D), and
Traffic Signal Priority (SP). Advanced Traveler Information Systems include Automated
Trip Itinerary (ATI), In-vehicle Announcer (IVA), Kiosks, Variable Message Signs
(VMS), and the Web. Electronic Fare Collection includes only Electronic Fare Collection
(EFC).
Two different surveys were used to gather information for this study. First, a survey was
developed and administered to identify transit systems that use ITS. There were 2,459
surveys mailed to rural, small urban, and suburban transit systems throughout the United
States. Five-hundred-one transit systems responded resulting in a 20.4 percent response
rate. Of these systems, 122 reported the use of ITS (24.4 percent). A second survey was
designed and administered to better target the systems that use ITS. The surveys
contained questions regarding each technology the transit systems use. Questions were
asked regarding length of time the technology has been used, impacts upon the system
and community, and changes in costs and revenues. Additional questions regarding
service to welfare to work clientele were asked. From the 122 reporting use of ITS, we
were able to contact 116 transit systems. They were asked to complete the follow up web-
based survey. Seventy-four transit systems responded to the second questionnaire for a
response rate of 64 percent. To summarize results from the surveys, transit systems were
categorized by population size. Transit systems were classified as Rural if they served
populations less than 50,000 people, Small Urban if serving populations between 50,000
and 250,000; Medium Urban for populations between 250,000 and 400,000 and Large
Urban for systems of more than 400,000. Due to the low number of Medium Urban
systems responding, the categories of Small Urban and Medium Urban were combined.
xii
Nine Rural Transit systems identified the use of ITS. They prominently use S&D and
GIS. Overall, the systems have experienced positive results from using these
technologies. Forty-five Small and Medium Urban systems reported primary use of GIS,
S&D, EFC, and ATI. These systems also reported positive results using ITS. Often cost
increases were offset by increased coverage or better service to the community and
welfare to work clientele. Twenty Large Urban systems reported use of ITS. They most
frequently use S&D, EFC, GIS, and ATI. Positive results were reported from these
technologies. Transit managers from all groups had difficulties reporting on welfare to
work clientele because many systems do not delineate this group of customers. However,
AVL, S&D, EFC, GIS, ATI, and the Web were believed to have helped increase service
to welfare-to-work users. It could be concluded that transit systems were satisfied with
the ITS technologies implemented and many reported their intent to implement additional
ITS technologies in the future. Costs were found to be probably the largest barrier to
implementing the technologies, along with transit systems reluctance to invest in rapidly
changing technologies.

INTRODUCTION Mobility is an essential requirement for any type of meaningful invo lvement in our
modern society. Without mobility, an individual’s chances for participation in this
country’s socioeconomic system are severely limited. Since most jobs are not in close
proximity to home, the chances of a person attaining gainful employment, without
mobility, are slim at best. Furthermore, the lack of mobility can relegate one to a
substandard lifestyle. Without some form of adequate transportation, it would not be
possible for people to shop, to socialize, to worship, or to participate in many other life-
enriching activities. For many Americans, the only possible solution to this problem is
public transportation.
Since most people in America have vehicles of their own, they do not realize the
important role that public transportation plays in our society. This is not the case for
some Americans who select to or must rely on public transportation to take them to work,
to shop, to worship, etc. For many people, especially low-income and welfare dependent
families, public transportation is the only source of mobility. According to statistics from
the U.S. Department of Transportation, only 6.5 percent of welfare recipients own a
vehicle. This statistic further emphasizes the importance of public transportation to
welfare recipients and shows the need for our society to provide adequate and affordable
public transportation for them.
However, public transportation services as they currently exist are unable to meet all the
demands placed on them by the Welfare to Work Initiative introduced in 1996. To
minimize some of the transportation challenges facing welfare recipients, the DOT has
begun to apply ITS technologies to the Welfare to Work program.
2
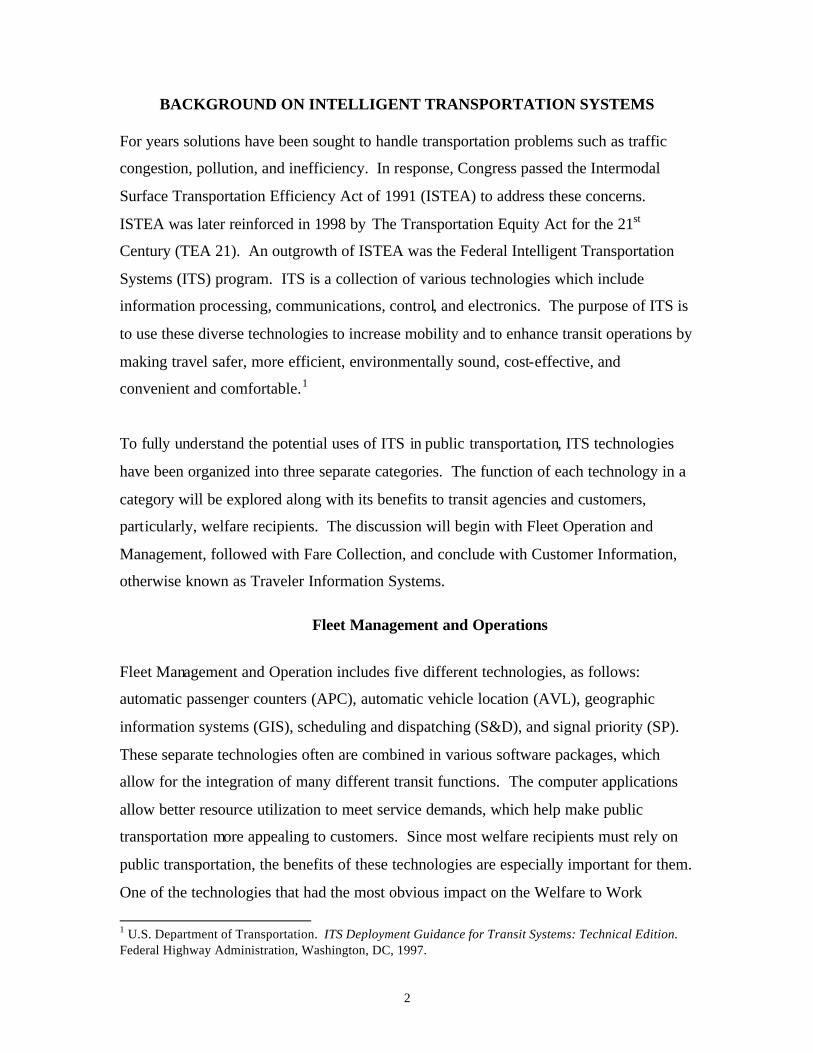
BACKGROUND ON INTELLIGENT TRANSPORTATION SYSTEMS For years solutions have been sought to handle transportation problems such as traffic
congestion, pollution, and inefficiency. In response, Congress passed the Intermodal
Surface Transportation Efficiency Act of 1991 (ISTEA) to address these concerns.
ISTEA was later reinforced in 1998 by The Transportation Equity Act for the 21st
Century (TEA 21). An outgrowth of ISTEA was the Federal Intelligent Transportation
Systems (ITS) program. ITS is a collection of various technologies which include
information processing, communications, control, and electronics. The purpose of ITS is
to use these diverse technologies to increase mobility and to enhance transit operations by
making travel safer, more efficient, environmentally sound, cost-effective, and
convenient and comfortable.1
To fully understand the potential uses of ITS in public transportation, ITS technologies
have been organized into three separate categories. The function of each technology in a
category will be explored along with its benefits to transit agencies and customers,
particularly, welfare recipients. The discussion will begin with Fleet Operation and
Management, followed with Fare Collection, and conclude with Customer Information,
otherwise known as Traveler Information Systems.
Fleet Management and Operations
Fleet Management and Operation includes five different technologies, as follows:
automatic passenger counters (APC), automatic vehicle location (AVL), geographic
information systems (GIS), scheduling and dispatching (S&D), and signal priority (SP).
These separate technologies often are combined in various software packages, which
allow for the integration of many different transit functions. The computer applications
allow better resource utilization to meet service demands, which help make public
transportation more appealing to customers. Since most welfare recipients must rely on
public transportation, the benefits of these technologies are especially important for them.
One of the technologies that had the most obvious impact on the Welfare to Work
1 U.S. Department of Transportation. ITS Deployment Guidance for Transit Systems: Technical Edition. Federal Highway Administration, Washington, DC, 1997.
3
program is the use of geographic information system. GIS allows transit agencies to
accurately track where demand is located in their service area.
Automatic Passenger Counter
The APC automatically records the number of passengers, time and location of each stop
as passengers get on and off the bus. The APC can collect data, previously recorded
manually or with a hand-held device, with a reduction in time, cost, and effort. By means
of infrared beams at the doors or pressure sensitive mats on the steps, the APC accurately
records the time, location, and the number of passengers as they enter or exit the bus.
With the information provided by the APCs, transit planners can make changes to routes
and schedules that better serve the transportation needs of their community. For
example, the city of Calgary, which first implemented an APC system in 1990, found the
count data obtained by the APCs to be “extremely accurate” and the point-to-point travel
times valuable for future planning.2 The potential benefits of this information for the
Welfare to Work program include making transit agencies more aware of the particular
transportation needs of the welfare recipients in their local communities. That way
changes can be made to existing routes, or additional routes can be planned to enhance
welfare recipients’ chances of attaining gainful employment.
Automatic Vehicle Location
Satellite geo-positioning technology tracking vehicles is one of the most common AVL
systems, which is another ITS technology that involves daily operations and
management. With AVL, dispatchers can pinpoint at any given time, the location of
buses in their fleet that are equipped with the technology. Access to this type of
information, can be especially significant in an emergency situation, when either
passenger or driver safety may be threatened. In addition, bus location information can
be given to customers to assist them in planning an itinerary based on the most up-to-the-
minute information. Finally, this information can be used to determine whether buses are
running on schedule and, if necessary, to reroute buses around problem areas. Many
2 Neil McKendrick, City of Calgary Transportation Department, Calgary, Alberta, Canada.
4
transit agencies have found that automatic vehicle location has been increasing their on-
time performance while at the same time it has been decreasing the number of buses
necessary for a route. For example, through the use of AVL in Kansas City, Mo., the
transit system was able reduced the number of buses needed for its routes by 9 percent.3
The potential benefits for the Welfare to Work participant are a safer more efficient and
reliable way to get to work on time.
Geographic Information Systems
A geographic information system (GIS) enables a transit agency to collect, store, analyze
and display data by location. GIS can provide transportation agenc ies with specific
information regarding mobility problems. With GIS software, a spatial analysis can
determine where job opportunities, daycare centers, public transportation, and other
services are in relation to where most welfare recipients live. GIS mapping can point to
the most efficient routes for welfare recipients to reach needed services. Transit planners
also can use the information provided by GIS to modify, improve, or add new services.
GIS technology also can be used to help caseworkers and employment counselors to find
jobs that are accessible to welfare recipients. For example, St. Mary’s county, a rural
area in Southern Maryland, along with KFH Group, a consulting firm in Bethesda, MD.,
used GIS technology to help welfare recipients find work. With the assistance of GIS,
case workers in the county’s Department of Social Services were able to see where most
public assistance recipients live, along with, the location of suitable employment
opportunities, daycare centers and available public transportation. 4 By using GIS
technology, case-workers in St. Mary’s county, were able to make the move from welfare
to work and easier transition for the recipients residing there.
3 Jones, W., ITS Technologies in Public Transit: Deployment and Benefits, US Department of transportation ITS Joint Program Office, November 1995. 4 U.S.DOT. A Guide to Innovative Practices: Access to Jobs. Federal Transit Administration, Washington, DC, 1998.

5
Scheduling and Dispatch
Scheduling/dispatch software is used to aid in designing and modifying transit routes. It
can also be used to route, schedule, and dispatch vehicles in demand response operations.
It often is combined with GIS and AVL to coordinate different transit functions.
Combined technologies such as, computer-aided dispatching and AVL can increase the
efficiency of transit operations, enhance safety, improve service, and cut costs. For
example, systems integrating automated scheduling and dispatching and AVL enable a
dispatcher to know the exact location and status of each bus under control. This real-time
information allows the dispatcher to address any problems with service or to respond to
any emergency. In addition, automated dispatching software and AVL allow the
coordination of services among many separate transportation agencies to meet the
employment transportation gaps.5 The potential benefits for Welfare to Work
participants are better access, more reliable, and efficient way to travel to work.
Traffic Signal Priority Traffic Signal Priority is a technology that holds a traffic light green or turns it green
earlier than it would without priority. Signal Priority once was only implemented by
emergency vehicles, but now is being used by buses and streetcars. A signal priority
system is combined with AVL technology, which allows the system to provide priority
only when needed (i.e., when a bus is running behind schedule). The benefits of a signal
priority system are that it keeps transit vehicles on schedule and improves on-time
performance. As a result, fewer vehicles are necessary for a route. This can mean a large
savings for a transit agency. For instance, in Portland, Oregon, a traffic signal priority
system has been used successfully to keep buses on schedule. By using this system, bus
travel times were reduced by 5 to 8 percent, and as a result, fewer buses are necessary for
5 U.S. Department of Transportation. Access to Jobs. Welfare to Work Initiative. Federal Transit Administration, Washington, DC, 1998.

6
serving the same routes. 6 The potential benefit for welfare recipients, relying on public
transit, is improved on-time performance.
Traveler Information Systems
Traveler information systems provide customers with information for planning their trips
and during their trips. Transit information can be static, such as route maps, or dynamic
such as route delays and other real-time information. Travelers may access information
from differing locations such as home, work, transportation terminals, wayside areas, and
on-board vehicles. Information can be accessed through various means, such as
automated trip itineraries, in-vehicle announcers, variable message signs, monitors, and
interactive kiosks. These technologies may help individuals better plan their trips and
help decrease frustrations by providing needed information.
Automated Trip Itineraries
Automated trip itineraries assist customers with the information necessary to plan a trip
from its point of origin to its final destination. Automated trip itineraries include a broad
range of data, such as modes of travel, travel time, transfers, schedules, fares, tourist
information, and weather. When automated trip itineraries are combined with AVL
technology, real-time information concerning traffic congestion and possible delays can
be reported. Since automated trip itineraries are electronic, they can be accessed by
various means, such as touch-tone telephones, personal computers, pagers, hand-held
devices, kiosks, and Internet, fax machines, cable and interactive television.
The benefits of automated trip itineraries are that they provide accurate and timely
information for customers through a variety of means. For example the Smart Trek
information program, in the Puget Sound area of Seattle, Wash., uses downtown kiosks,
cable television, and the Internet to provide information on traffic flow and congestion
and highway speeds.7 An additional benefit of an automated transit information system is
that it can reduce caller-waiting time. The New Jersey Transit found that their new
6 Kloos, W., “Bus Priority at Traffic Signals in Portland: The Powell Boulevard Pilot Project,” Submitted to ITE for the Compendium of Technical Paper, July 1994.

7
automated information system reduced callers waiting time from 85 seconds to 27
seconds, although the actual number of callers had increased.8 The potential benefit for
the Welfare to Work program is an accessible information system that provides accurate
and real-time information for its participants, assisting them to reach places of potential
employment.
In-Vehicle Announcers
In-vehicle announcers usually are audio and visual systems, used en-route, to provide
passengers with next stop information. A sign placed in the front, and sometimes in the
middle of each vehicle, displays next stop information while a pre-recorded message
simultaneously announces the same information. In-vehicle announcers help passengers
with either visual or hearing impairment to recognize their stop. In addition, they help
new customers, unfamiliar with a route, as well as existing customers, inattentive to their
surroundings, to find their stop. Finally, in-vehicle announcers help transit agencies to
comply with the requirements for bus and rail stop announcement according to the
American with Disabilities Act. In San Francisco, a study was conducted to test the
effectiveness of in-vehicle announcer. The San Francisco Municipal Railway selected 18
visually impaired subjects to participate in an experiment to evaluate “Talking Signs”
technology on buses. In this experiment, the participants used infrared receivers to find
bus stops and buses. The study found the “remote infrared audible signage” (Talking
Signs) enabled the visually handicapped to be more independent on public transit
vehicles.9
As stated above, in-vehicle announcers can be helpful, not only to the visually or hearing
impaired, but also to the average customer. They can alert new or inattentive passengers
to their stops. Therefore, a potential benefit of an in-vehicle announcement system to the
7 “Intelligent Transportation is Here and Working,” Trek Talk , Issue 2, Spring 1997. 8 “NJ Transit’s Customer Information Speeded Up by New System,” Passenger Transport, 24 January 1994. 9 Crandall, W., Ph.D., B. Bentzen, Ph.D., L. Myers, M.Ed., and P. Mitchell, Ph.D., Remote Infrared Signage for People Who are Blind or Print Disabled: A Surface Transit Accessibility Study-Project Action, The Smith-Kettlewell Eye Research Institute, San Francisco, April 1996.

8
Welfare to Work participant might be the added assurance of identifying correct transfer
points and alighting at the appropriate stop.
Interactive Kiosks
Interactive Kiosks can be computer-like terminals or larger machines that provide travel
information. Found in malls, hotels, airports, businesses, and transit centers, interactive
kiosks are accessed easily by means of a computer-mouse, touch screen, or keyboard.
Kiosks can provide a wide range of travel information, such as routes and schedules,
traffic congestion, and weather. When combined with automatic vehicle location
information, kiosks can provide customers with real-time information, such as the on-
time status of their transit vehicle.
Interactive kiosks promote transit services by providing easily accessible information
about a wide range of services for both new and existing customers. This contributes to
greater customer convenience, satisfaction, and for the transit agency, the potential for
increased revenues. In addition, interactive kiosks along with other electronic forms of
customer information help transit agencies to comply with the Americans with
Disabilities Act by providing services to the visually and hearing impaired.
Due to their accessibility and the wealth of information that they provide, kiosks have
become a popular way for transit riders to get travel information. In the downtown areas
of Minneapolis and St. Paul, video kiosks and electronic bulletin boards have been used
to provide transit routes and schedules in addition to traffic incident and construction
information. A study conducted in 1995 to evaluate the benefits of kiosks and other ITS
technologies determined that two-thirds of the people who used the kiosks and computer
bulletin boards, were requesting bus route and scheduling information. 10
As noted previously, interactive kiosks are an accessible means of finding many different
types of travel information. Since most Welfare to Work participants must rely upon
10 Remer, M., T. Atherton, and W. Gardner, “ITS Benefits, Evaluation and Costs: Results and Lessons from the Minnesota Guidestar Travlink Operational Test.” Draft, November 1995.

9
public transportation, having access to information regarding routes, schedules, traffic
congestion, and bus delays can be especially significant for them. Finally, it can make
the process of seeking employment less taxing and keeping employment more rewarding.
Variable Message Signs and Monitors
Transit agencies use variable message signs and monitors in combination with automatic
vehicle location to show whether buses are running on schedule. These signs and
monitors provide customers with information regarding arrival and departure times. With
this information, customers can make decisions based on their own particular
circumstances. In addition, access to this information can reduce customer anxiety
significantly, especially when a bus is delayed. Monitors usually are found at transit
centers where many buses arrive and depart, while variable message signs are used at
stops that involve only one or two bus routes.
Since 1996, the Spokane Transit Authority has used monitors at its downtown transit
center. At the transit center, two monitors provide customers with information
concerning the arrival and departure times. One monitor provides arrival information
while the other provides departure information. The departure monitor also gives
passengers information concerning the specific bay location of their departing bus. In
addition to traveler information, this system can alert bus drivers waiting in a holding
area, to the availability of their assigned bus bay. Also, the system can track the exact
arrival and departure times of every bus. This information enables dispatchers and
planners to make changes in the schedule, if necessary. 11
The information provided by variable message signs and monitors increases customer
convenience. By supplying information about arrival and departure times, customers can
make decisions based on their own particular circumstances. For the Welfare to Work
participant, who has to make several stops in a day, this information can assist with the
decision making process. For example, if the participant knows that a bus will be
11 U.S. Department of Transportation, Advanced Public Transportation Systems: The State of the Art Update ’98, Federal Transit Administration, Washington, DC, 1998.

10
delayed, one can determine whether there is sufficient time to run an errand or choose to
remain at the bus stop.
Electronic Fare Collection
Electronic Fare Collection
An electronic fare collection is a system in which cards are used in place of coins or
tokens, to pay for transit rides. The purpose of an electronic fare collection system is to
reduce the expense of handling and protecting transit revenues and to provide customer
convenience. In an automated fare system different types of media can be used in a
variety of ways. The types of media include magnetic stripe cards, credit cards, or smart
cards that can be contact or contactless. For example, some systems may use these media
for transit, retail purchases, and banking, while other systems may use them for transit
only. Electronic fare collection systems can also support integrated billing for the
provision of subsidized transit service for clients receiving health and human services
such as those participating in welfare to work.
One benefit of an electronic fare system is a reduction in the cost of handling and fare
processing. For example, the New Jersey Transit discovered an estimated savings of $2.7
million due to a reduction in the costs of handling and processing cash and tokens.12
Also, in Ventura County, smart cards saved the agency $990,000 in reduced handling
costs.13 Another benefit of an automated fare system is improved customer convenience.
In the Seattle/central Puget Sound Area of Washington, a smart card trial prototype was
used to link six transit agencies and the Washington Ferry. Due to the coordination of
these systems customers were able to use one fare card for all systems. A survey of
customers and focus groups that used the smart cards rendered mostly favorable
responses. 14 15
12 ITS Technologies in Public Transit: Deployment and Benefits, ITS America, February 1995. 13 Advanced Public Transportation System Benefits, Federal Transit Administration, January 1996. 14 Smart Card Prototype Demonstration Project, Final Report, IBI Group, June 1997. 15 Michael G. Dining, Volpe National Transportation Systems Center, Cambridge, Massachusetts.

11
An additional benefit of the new electronic media is a more secure fare collection system.
In 1993, the New York City Transit installed a magnetic stripe system, as a result, the
agency gained an additional $43 million and in 1994 an additional $54 million in transit
revenue due to greater security measures and less fare evasion. 16 The final benefit of an
electronic fare system is the potential for additional transit revenue due to an increase in
marketing strategies, such as transaction fees, interest gained from pre-paid cards, and the
unused value of pre-paid cards. The potential benefit of an electronic fare collection
system for Welfare to Work participants might be the convenience of using one fare card
for a variety of systems and potential services.
WELFARE REFORM BACKGROUND Awareness of the need for changes and improvements to public transportation began in
the anticipation of the Welfare Reform bill that was signed into law by Former President
Clinton in August of 1996. Its purpose was to totally revamp the previous program, Aid
to Families with Dependent Children (AFDC), and to replace it with the Temporary
Assistance for Needy Families (TANF) program. Under the new program, welfare
recipients, in some states, are provided with benefits for no longer than 24 consecutive
months while other states have opted for the maximum of 60 months total. As its name
would suggest, the purpose of TANF is to move welfare recipients from the welfare rolls
to the work world within these time limits. Hence, it has been aptly coined the “Welfare
to Work” program. Implementation of this new program has significantly increased the
federal government’s awareness of the need for adequate public transportation.
According to Former U.S. Secretary of Transportation Rodney Slater, “Transportation is
the ‘to’ in welfare to work.”
Two of the greatest challenges facing welfare recipients have been the lack of private
transportation and the special mismatch of welfare recipients to job opportunities. While
most of the job growth has occurred in the suburbs, many welfare recipients reside in
central urban area. If welfare recipients had private transportation or adequate, affordable
16 Time to Get Smart, article published in Mass Transit, November/December 1995.

12
public transportation, there would not be a problem. As noted earlier, only 6.5 percent of
welfare recipients own cars, and therefore, need to rely on public transportation. To
further complicate matters, public transportation often does not extend to these areas of
high employment. The commuter rails that do reach these areas do not provide direct
access to places of employment and are too cost-prohibitive for welfare recipients. 17 In
addition, commute times to these locations via public transit often are unreasonable.
Western Reserve University’s Center on Urban Poverty and Social Change found that
with an 80-minute commute, welfare recipients could reach less than 44 percent of the
job openings in the Cleveland, Ohio, area.18
Public Transportation is not only an issue for urban areas, but also for rural ones. In fact,
almost 40 percent of all rural counties in the United States have no public transportation.
This, combined with the high rate of unemployment in rural areas, has made public
transportation a growing concern in the small towns of America. As a result, many
welfare recipients in rural areas are forced to continue on welfare because they are unable
to get to and from work.
Other challenges facing welfare recipients include irregular work hours and complete
trips. Many jobs involve shift work that occurs in the evenings or on weekends. Transit
service often is unavailable or extremely limited at these times. In additions to getting to
work, single mothers, the primary recipients of welfare, often have to make several stops
in their day. They must have access to necessary services, such as daycare, job training,
shopping, and medical care. This further complicates the matter of getting to work and
points to the need for changes and improvements to our public transportation system.
Awareness of the need for accessible, affordable public transportation for welfare
recipients began even before the enactment of the Welfare Reform bill. In 1988
Congress passed the Family Support Act in an effort to promote self-sufficiency in
17 U.S. Department of Transportation. A Guide to Innovative Practices: Access to Jobs. Federal Transportation Administration. Washington, DC, 1998. 18 Leete, L. Bania, N. The Impact of Welfare on Labor Markets. Cleveland: Center on Urban Poverty and Social Change. Case Western Reserve University, 1996.
13
welfare recipients. Title I of the Act, also referred to as the JOBS (Job Opportunities and
Basic skills Training) program, was implemented to overcome any obstacles that welfare
recipients may encounter in their search for employment. Studies of the JOBS programs
in several states found that the most common barrier to employment for welfare
recipients was the lack of adequate and affordable transportation.
The Federal Transit Administration (FTA) responded to this critical matter by developing
JOBLINKS, an innovative program designed to evaluate different transportation
strategies to help welfare recipients and the unemployed attain self-sufficiency.
JOBLINKS supplies funding and technical assistance for demonstration projects that
show a high potential for success in providing employment transportation for the
unemployed. Since 1993, the FTA has provided funding for 16 JOBLINKS
demonstration projects that have been administered by the Community Transportation
Association of America (CTAA).
Bridges to Work is another innovative program specifically devised to address the
phenomenon know as “spatial mismatch.” As stated previously, most of the job growth
has taken place in suburban areas, while many welfare recipients reside in central urban
areas without cars or adequate public transportation to reach the se areas of high
employment. To solve this problem the U.S. Department of Housing and Urban
Development and the U.S. Department of Transportation, along with various private
foundations, have joined forces to find new ways to link job-ready, urban welfare
recipients with suburban jobs. Bridges to Work projects are now in progress in the
following cities: Baltimore, Chicago, Denver, Milwaukee, and St. Louis.

14
RESEARCH METHODS The information generated for this study relies mainly on direct surveys of transit
managers. Two surveys were conducted, a mail-back survey and a Web-based survey.
Since surveying all transit systems in the United States would be time and resource
prohibitive, developing a sample frame for this study was necessary. Sample frame A
was selected by obtaining mailing lists of rural, small urban, and suburban transit systems
from reliable sources. Sample frame B of this study consisted of identifying systems from
sample frame A that use ITS (Figure 1). The survey instrument design and response rates
are presented in this section.
Survey Instrument Design, Mailings, and Response Rates
The initial survey was sent to transit managers throughout the United States to gather
information about their transit systems and inquire about their use of ITS and transit
services to welfare recipients. The second survey was a follow-up survey of the systems
indicating their use of ITS.
Survey I
Survey I, which represents sample frame A, was a mail questionnaire designed for transit
managers in cities throughout the United States. The mailing lists were obtained from
Lawrence Harmon with Bridgewater State College Transit in Massachusetts and the
Community Transportation Association of America in Washington, D.C. It should be
noted that a single comprehensive list of transit systems in the United States does not
exist. The only factor used in selecting transit systems for the survey was the availability
of contact information (mailing lists).
The survey asked about services provided by the transit system, such as hours of service,
number and types of vehicles used, the distance for accessible service, and whether
welfare recipients had access to the service. Another major portion of the survey
identified if the system used ITS, and if so, which technologies are used. Responders
15
Figure 1. Sample Frame of Study
could select from 10 technologies as well as indicate other technologies that were not
listed. A matrix was provided with the questionnaire asking recipients to report on
changes in service, costs, and revenues as a result of implementing ITS. Unfortunately,
many of the responses on the matrix were not useable. Much of this information was
captured on the second follow-up questionnaire for systems who indicated they used ITS.
Another section of the first questionnaire focused on communication devices used by
transit systems. Respondents also were asked their view of the flexibility of the funding
received and how that impacts technology financing as well as cooperation with other
state transportation officials. Finally, respondents were asked about their perception of
significant barriers that impede the use of new technologies.
16
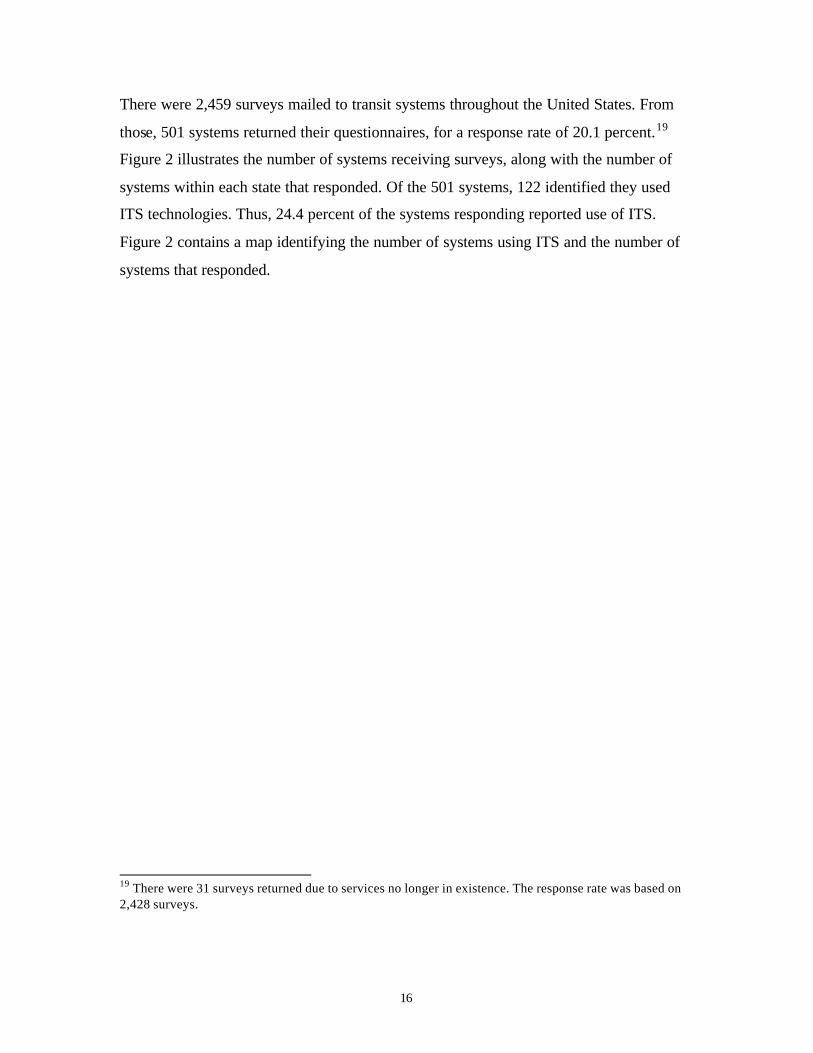
There were 2,459 surveys mailed to transit systems throughout the United States. From
those, 501 systems returned their questionnaires, for a response rate of 20.1 percent.19
Figure 2 illustrates the number of systems receiving surveys, along with the number of
systems within each state that responded. Of the 501 systems, 122 identified they used
ITS technologies. Thus, 24.4 percent of the systems responding reported use of ITS.
Figure 2 contains a map identifying the number of systems using ITS and the number of
systems that responded.
19 There were 31 surveys returned due to services no longer in existence. The response rate was based on 2,428 surveys.
17
Figure 2. Transit Systems Using ITS, Survey I.
18
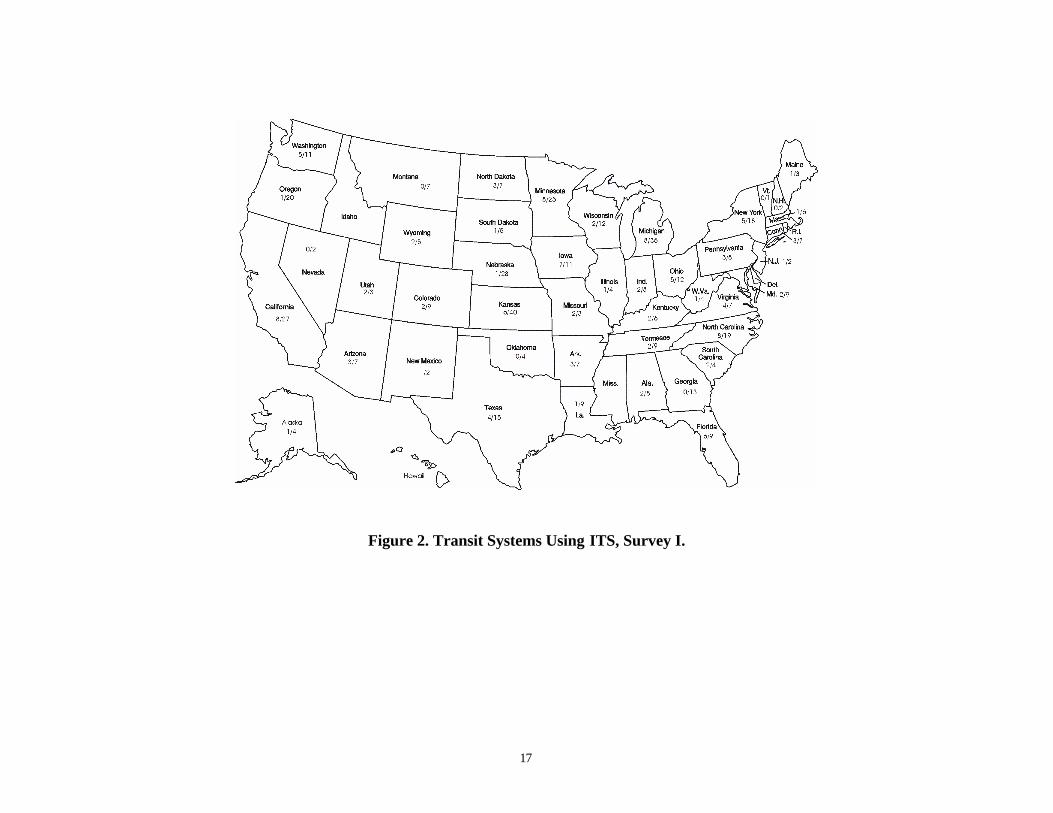
Survey II - Web Based Questionnaire Survey II, which is sample frame B, provided a follow-up to the transit systems that
reported use of ITS. One hundred sixteen transit systems were sent e-mail messages
asking them to complete the Web-based survey during the spring of 2001.20 Systems
were asked to identify each ITS technology they use. The manager completing the survey
was guided through a series of questions about each technology they identified using.
Questions included type of technology used, length of time using the technology, and
impacts systems were experiencing since implementing the technologies, such as:
o system coverage
o labor needed
o changes in costs and revenues
o changes in service to residents
o changes in service to welfare recipients
Seventy-four systems responded to the Web-based survey yielding a 64 percent response
rate. Figure 3 identifies the number of transit systems in each state that were asked to
complete the Web-based survey and the number of systems completing the survey.
20 Six of the 122 systems could not be reached for the follow-up survey.
19
Figure 3. Transit Systems Using ITS, Responding to Survey II.

20
RESULTS
Overview of Transit Systems Responding to Questionnaire I
This section reports on the results of the 122 transit systems using ITS and specifics to
the systems; such as the vehicles operated, communication systems used, funding
flexibilities, and the ITS technologies used.
Vehicles Operated and Accessibility Several different vehicle types and sizes are used by transit systems responding to the
questionnaire. The majority of systems reported the use of vans, small buses, and some
large buses. Transit systems were asked what they considered an accessible distance for
passengers to walk to a bus stop to use transit vehicles. Forty percent of respondents
indicated 0.25 miles to be an accessible distance. The distance of 0.25 is consistent with
literature. Interestingly, 20 percent indicated 0.75 miles was acceptable and 4 percent
believed one mile was considered accessible (Figure 4). Approximately 80 percent of
respondents believed that residents had access to more than 50 percent of the businesses
by using transit services in their service area.

21
22%
40%1%
13%
20%
4%0 mile0.25 mile0.35 mile0.5 mile0.75 mile1 mile
Figure 4. Accessible Distance for Passengers to Walk/Travel to Use Public Transportation, by Percentage, based on Transit Systems Using ITS.
In addition to questions about the transit service, the systems were asked to identify ITS
technologies they use. Ten different ITS technologies are being used by transit systems in
varying levels. Scheduling and Dispatching is the most used technology with 42 percent,
followed by Geographic Information Systems with 27 percent reporting use of these
technologies (Figure 5). More in depth analysis and discussion of these technologies are
provided in results from Survey II.

22
0
5
10
15
20
25
30
35
40
45
S & D GIS
EFC
AVL AT
IIVA AP
CKios
ks SP VMS
ITS Technology
Per
cen
t
Figure 5. Transit Systems Using Specific ITS Technology, by Percentage
Communications
Effective communications are an important element to transit system success. The flow
of information between dispatchers and drivers is essential for success. Communications
enable proper management of system operations. Dispatchers must be able to
communicate with drivers to inform them of schedule changes, special client needs,
traffic conditions, weather cond itions, advised routing, and other relevant information.
Various methods of communications between the dispatcher and drivers are available,
ranging from relatively simple and inexpensive methods to highly sophisticated systems.
The communications system selected by transit systems will generally vary depending
upon the life cycle the transportation program is in, and of course, the budget.21 There are
four primary methods used for communication between the dispatchers and drivers. They
include pay phone/pager, two-way radio, cellular phone, and computer.
The pay phone/pager method is the least expensive method, but it also is quite limited as
it only allows one-way communications or a call back at a later time. Very small systems
21 Lindsay, Oliver. Non-Emergency Health Paratransit Planning and Operations Manual. Community
Transportation Association of America, www.ctaa.org/ntrc/medical/pubs/hbc/dispatch.shtml.

23
may use this method and it may adequately meet their needs. The two-way radio is a
common choice among transit systems. Transit systems selecting two-way
communications may operate at different frequencies. Some systems may chose to share
communications with other companies, thereby reducing their costs, but also limiting
their use of the airways. Two-way radio with private frequency is more expensive, but
there is no waiting time for open air to communicate with the fleet.
Cellular phones may be a more expensive method of communication, but prices are
declining due to the competitive market. This method works well if communication is
minimal between drivers and dispatchers. There is the potential for abuse of the phone so
restrictions can be placed on numbers the phone can access, e.g., work, emergency, etc.
However, as more AVL and GPS are placed in vehicles, these systems can also be used
for communications.
Transit managers were asked to identify the types of communication equipment they
currently use to talk between dispatch and vehicles. The question was not designed to
investigate the sophistication of each systems communication, but rather to identify what
several systems are using. Seventy-five percent of the systems utilizing ITS reported the
use of two-way radios for the ir communication (Figure 6). Cells phones and telephones
also are used for the systems.

24
0 10 20 30 40 50 60 70 80
Two-Way Radio
Other
Cell Phone
Telephone
Band RadioE
qu
ipm
ent
Percent
Figure 6. Communication Equipment Used Between Dispatch and Vehicles for Systems Utilizing ITS.
Funding Flexibility
Respondents were asked if the flexibility of federal, state, and local funds to make
technology purchases has been useful to their agency. Sixty-six percent of the
respondents indicated the flexibility had been helpful, while 32 percent did not believe it
had been helpful (two percent did not respond to the question). Those who found the
funding to be flexible used the monies to purchase computers and software or equipment,
such as buses or fare collection units. Some transit officials felt the flexibility allowed
their agency to implement solutions based on local needs. Likewise, the flexible funding
allowed systems to use federal dollars to purchase technologies they may not have been
able to purchase with local funds. One transit manager indicated that progress would be
much slower due to the generally conservative fiscal approaches of many small
communities toward funding new technologies. Other managers indicated they felt that
too much money was being given to highways rather than to transit.

25
According to transit managers, the most common barrier to implementing ITS is funding,
which was not a surprise finding. Another common response was that technology
changes so rapidly, it is difficult to know when to purchase the latest technology.
Results from Survey II – Focus Upon Transit Systems Using ITS
The results presented in this section are based on responses of 74 transit systems using
ITS in the U.S. These systems provide services for various populations and square mile
coverage. Both are important characteristics to consider. For purposes of this study,
transit systems were considered: “Rural” if they served populations less than 50,000
people. Nine systems responding were classified as rural. “Small Urban” systems serve
populations between 50,000 and 250,000. Forty-one systems were classified as small
urban. “Medium Urban” serve populations ranging between 250,000 to 400,000 people.
Four systems were classified as medium urban. Finally, “Large Urban” systems serve
populations more than 400,000 people. There were 20 systems classified as large urban.
Since only four medium urban systems responded to the questionnaire, the categories of
small urban and medium urban were combined for purpose of presenting results of this
study.
The square miles of service reported by respondents are presented in Table 1. In general
it would be expected that systems serving larger square miles often are rural and small
urban systems. Eight systems did not complete the question for square mile service area.
Three of the rural and 12 of the small urban provide service to areas more than 500 sq.
miles. The rural systems may travel from one smaller community to other surrounding
communities and to nearby larger communities that provide medical service, which may
not be available in the more rural settings.

26
Table 1. Transit System Breakdown by Population Category and Square Mileage
Rural
Small Urban
Medium Urban
Large Urban
Totals
Less than 100 sq mi.
2 12 1 1 16
100-200 sq. mi 1 7 0 10 18 200-500 sq. mi 1 4 0 6 11 500-1000 sq. mi 2 4 0 3 9 1000 plus sq. mi 1 8 3 0 12 Not Reported 2 6 0 0 - Totals 9 41 4 20 74 Table 2 contains a breakdown of the ITS technologies used by each of the population
categories. Just a cursory view of Table 2 reveals that scheduling and dispatch is the most
frequently used technology by rural systems, S&D is most frequently used by small
urban, and Scheduling and Dispatch along with Electronic Fare Collection are most
commonly used by large urban systems. Several of the systems use multiple ITS
technologies.
Table 2. ITS Technologies Used by Each Population Category.
Rural Sm & Md
Urban Large Urban Total Transit Management 11 55 45 111 APC 3 7 10 AVL 1 4 7 12 GIS 3 14 10 27 S&D 6 34 16 56 SP 1 5 6 Automated Traveler Information Systems 1 13 22 36 ATI 7 9 16 IVA 1 2 4 7 KIOSKS 1 1 VMS 3 1 4 WEB 1 7 8 Electronic Fare Collection 0 7 14 20

27
Each of the 11 technologies used by each of the three population categories, will be
examined in the following section. First, rural systems will be examined, then small and
medium urban, followed by large urban systems. The perceptions of the transit managers
regarding each technology they use will be addressed including the length of time the
systems have used the technology, how it has impacted the transit system services, costs,
and revenues, and also how the technology has impacted service to the residents in the
city.
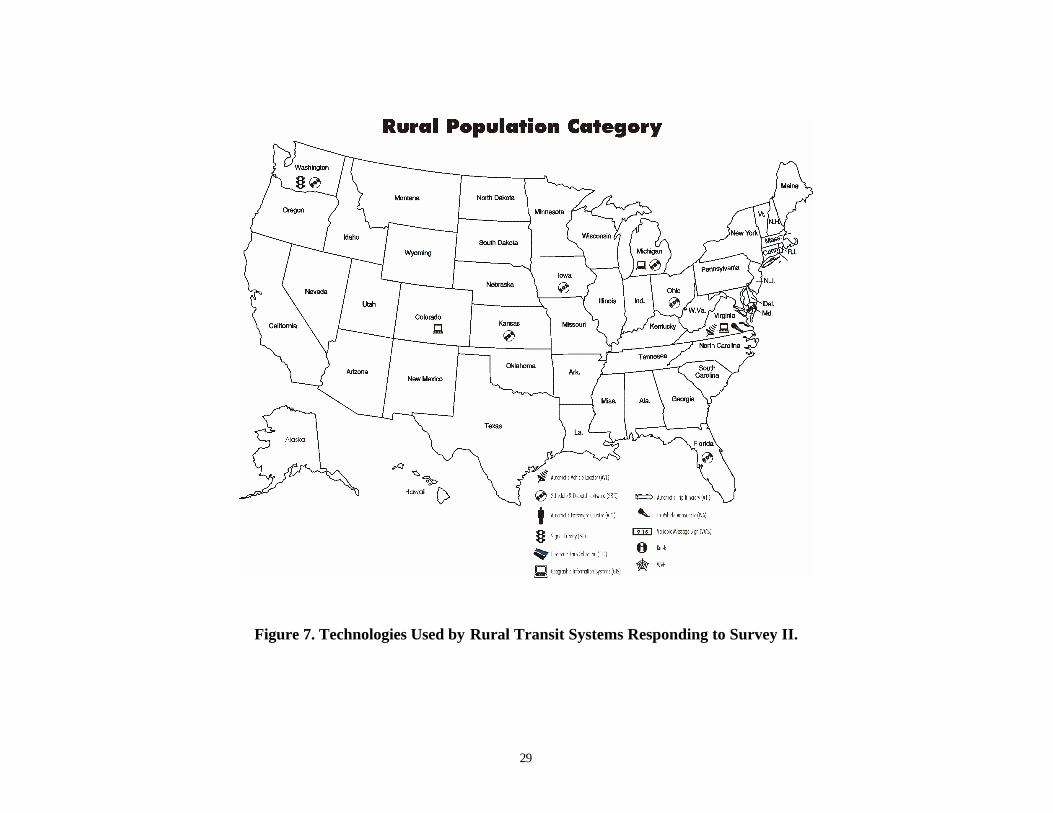
RURAL SYSTEMS Nine rural transit systems responded to the survey. These systems reported use of five
ITS technologies. S&D and GIS are the most widely used technologies by the rural
systems responding (Table 3). The states where the nine rural transit systems are from
and the technologies they use are identified in Figure 7.
Table 3. Technologies Used by Rural Transit Systems N = 9
Rural % Transit Management AVL 1 11% GIS 3 33% S&D 6 67% SP 1 11% Automated Traveler Information Systems IVA 1 11% Total 12

28
Transit Management
Automatic Vehicle Location
Only one rural transit system reported the use of AVL and they have used this technology
for less than six months (Table 3). Given this short time period, the system experienced
the need for less labor. They did not report a change in costs, but it could be possible they
would experience a decrease in operational costs if less labor was needed.
Geographic Information Systems
Three rural transit systems indicated they use GIS in their operations. The technology
has been used for more than five years by one of the systems (33 percent) and between
one to three years for the other systems (67 percent) (Table 3). Since implementing the
technology, the systems reported an increase in passengers and an increase in the service
benefits to residents.
29
Figure 7. Technologies Used by Rural Transit Systems Responding to Survey II.
30
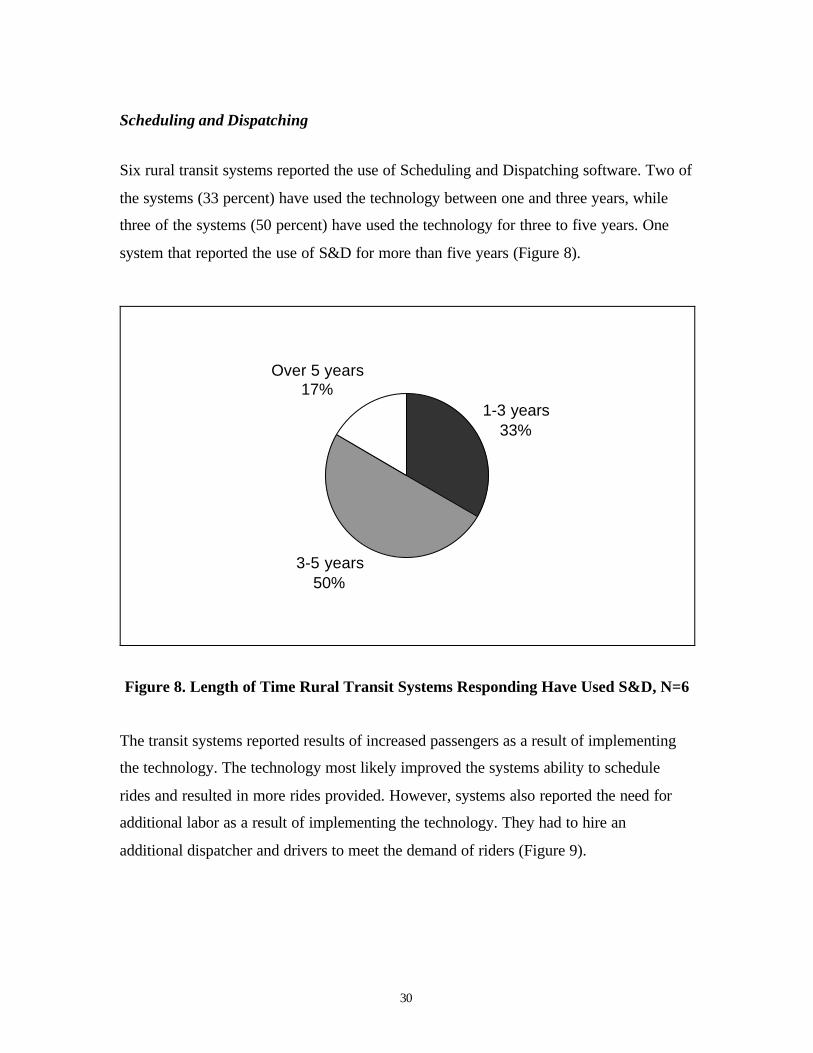
Scheduling and Dispatching
Six rural transit systems reported the use of Scheduling and Dispatching software. Two of
the systems (33 percent) have used the technology between one and three years, while
three of the systems (50 percent) have used the technology for three to five years. One
system that reported the use of S&D for more than five years (Figure 8).
1-3 years33%
3-5 years50%
Over 5 years17%
Figure 8. Length of Time Rural Transit Systems Responding Have Used S&D, N=6
The transit systems reported results of increased passengers as a result of implementing
the technology. The technology most likely improved the systems ability to schedule
rides and resulted in more rides provided. However, systems also reported the need for
additional labor as a result of implementing the technology. They had to hire an
additional dispatcher and drivers to meet the demand of riders (Figure 9).

31
0% 10% 20% 30% 40% 50% 60% 70%
Percent
Meet route Schedule
Additional coverage
Additional Labor
Less Labor
Increased Passengers
Figure 9. Impacts on Rural Transit Systems Responding, as a Result of Implementing S&D, N=6.
The systems reported mixed results in changes of costs and revenues as a result of the
technology. Approximately one-half of the systems reported increased operating and
capital costs. The increased operating costs were a result of hiring additional labor and
the increased capital costs were a result of needing additional vehicles to meet the
increased demand. Five of the systems (83 percent) recognized increased revenues
(Figure10). A couple of these systems indicated their demand was growing, not as a
result of the S&D, but the S&D helped them to better plan and meet this demand. All
rural systems reporting use of this technology indicated an increase in services provided
to the residents of their community.

32
0%
10%
20%
30%
40%
50%
60%
70%
80%
90%
100%
Operating Capital
Per
cen
t
No change
DecreaseIncrease
Figure 10. Changes in Rural Transit Systems Costs as a Result of Implementing S&D, N=6.
NOTE: Only those who responded to the question are included in the percentages, therefore percentages may not add up to 100.
Signal Priority
One rural transit system reported the use of Signal Priority. The technology has been in
place between 3-5 years, which would allow the transit system to make a fair assessment
of usefulness of the technology. This technology allowed the system to better meet their
route schedule, which is an expectation of this type of technology. The transit system also
reported an increase in their capital costs as a result of implementing this technology.
However, once the costs have been incurred, capital costs should not continue to increase.

33
Traveler Information Systems
In-Vehicle Announcer
An IVA was reported to be in use by one rural transit system for 1-3 years. The system
reported they experienced the need for less labor because of implementing this
technology. It is not clear why they needed less labor. The system did report an increase
in the service benefits to residents as a result of implementing the technology. This result
would be expected because the riders would be informed of upcoming stops or other
announcements that may be of relevance to them.
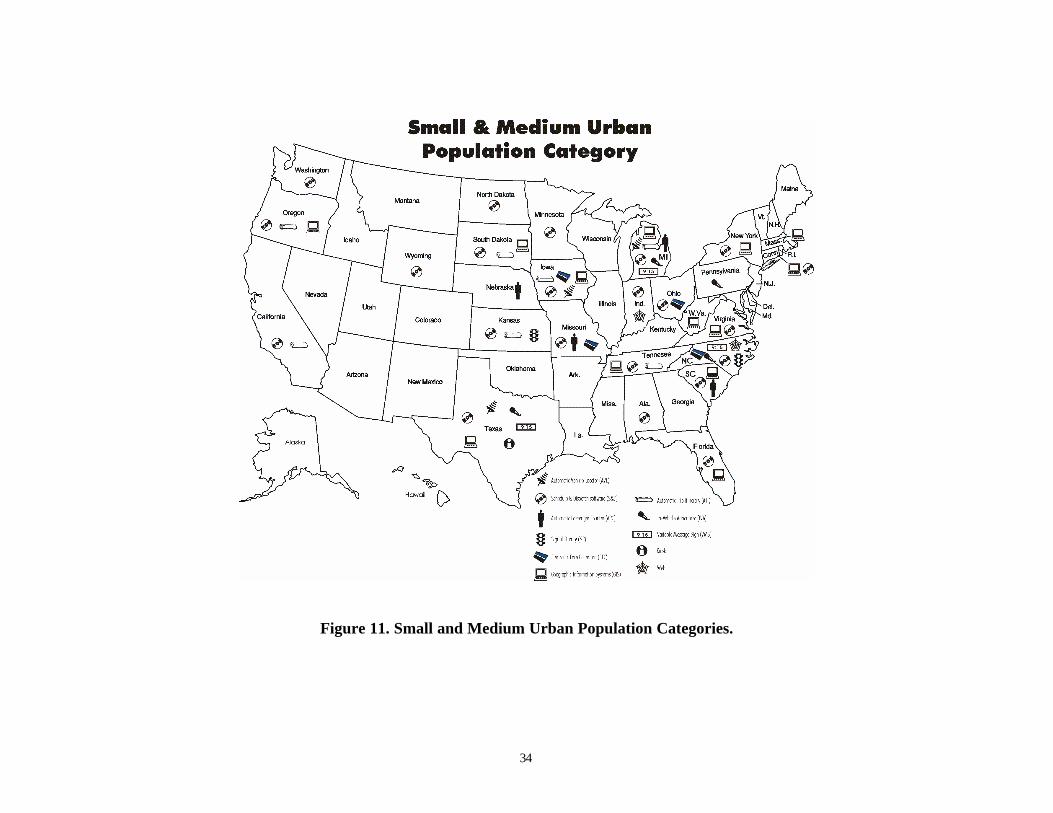
SMALL AND MEDIUM URBAN
Forty-five transit systems that responded to this questionnaire are classified in the small
and medium urban systems. Nine of the 11 ITS technologies are used by these systems.
The specific technology breakdown is in Table 4. S&D is the most frequently used
technology for small and medium urban systems with 34 systems (76 percent) reporting
its use. The states where these transit systems are located and technologies used by the
systems are shown in Figure 11.
Table 4. Small and Medium Urban Technologies
Sm/Med Urban % Transit Management APC 3 7% AVL 5 11% GIS 14 31% S&D 34 76%
Automated Traveler Information Systems
ATI 7 16% IVA 2 4% VMS 3 7% WEB 1 2%
Electronic Fare Collection
EFC 7 16%
34
Figure 11. Small and Medium Urban Population Categories.
35
Transit Management
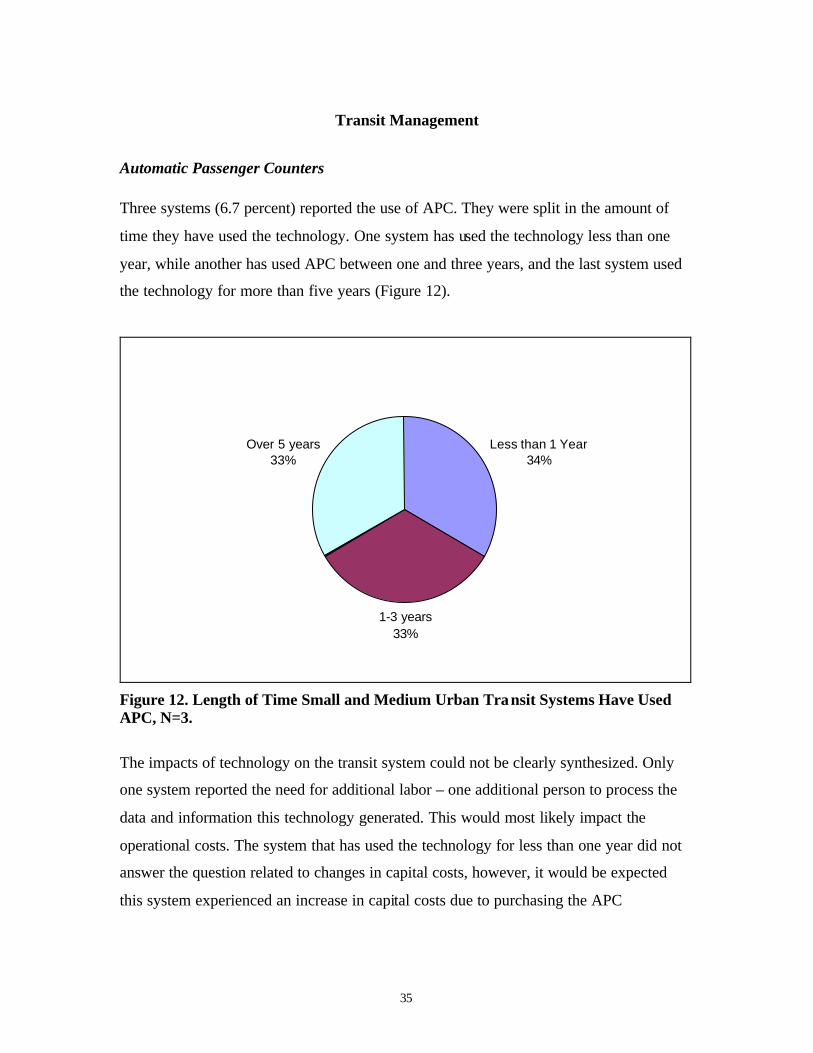
Automatic Passenger Counters Three systems (6.7 percent) reported the use of APC. They were split in the amount of
time they have used the technology. One system has used the technology less than one
year, while another has used APC between one and three years, and the last system used
the technology for more than five years (Figure 12).
Less than 1 Year34%
1-3 years33%
Over 5 years33%
Figure 12. Length of Time Small and Medium Urban Transit Systems Have Used APC, N=3.
The impacts of technology on the transit system could not be clearly synthesized. Only
one system reported the need for additional labor – one additional person to process the
data and information this technology generated. This would most likely impact the
operational costs. The system that has used the technology for less than one year did not
answer the question related to changes in capital costs, however, it would be expected
this system experienced an increase in capital costs due to purchasing the APC

36
technology. None of the systems reported any change in their revenues. All three systems
did report increased service to residents using their transit system.
Automatic Vehicle Location Five small and medium urban transit systems (11 percent) reported the use of AVL.
Three of the systems have used the technology for less than one year. While one system
has used the technology for one to three years and the other has used the technology
between three and five years (Figure 13).
Less than 1 Year60%
1-3 Years20%
3-5 Years20%
Figure 13. Length of Time Small and Medium Urban Transit Systems Reporting Have Used AVL, N=5.
One of the transit systems that has used the technology for less than one year reported
several benefits the technology had on the system. AVL has helped to increase the
number of passengers, reduce labor, meet route schedules better, extend hours of
operation, and increase service coverage. This same system recognized a decrease in
operating costs because it needed fewer dispatchers. Likewise, they recognized a
decrease in capital costs because they needed fewer vehicles. The same system
recognized an increase in revenues. However, this increase was attributed to better record
37
keeping. Surprisingly, the other four systems did not identify benefits of using AVL.
However, they did experience changes in costs that they attributed to AVL.
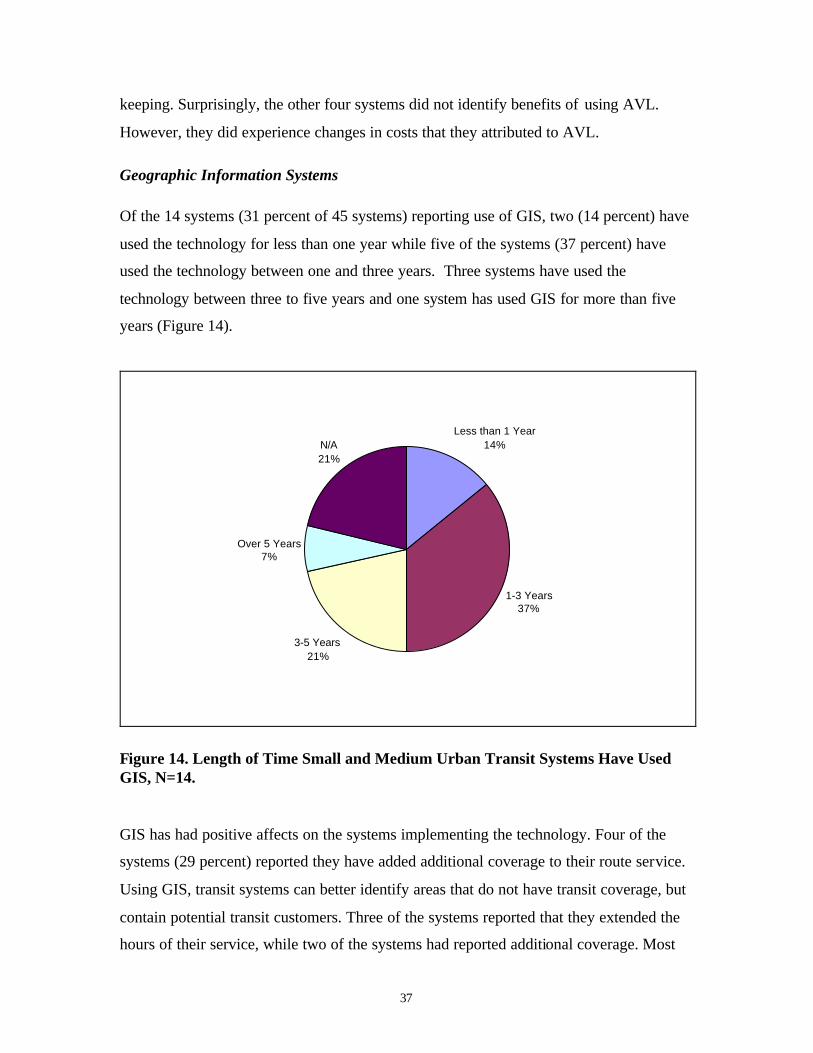
Geographic Information Systems Of the 14 systems (31 percent of 45 systems) reporting use of GIS, two (14 percent) have
used the technology for less than one year while five of the systems (37 percent) have
used the technology between one and three years. Three systems have used the
technology between three to five years and one system has used GIS for more than five
years (Figure 14).
Less than 1 Year14%
1-3 Years37%
3-5 Years21%
Over 5 Years7%
N/A21%
Figure 14. Length of Time Small and Medium Urban Transit Systems Have Used GIS, N=14. GIS has had positive affects on the systems implementing the technology. Four of the
systems (29 percent) reported they have added additional coverage to their route service.
Using GIS, transit systems can better identify areas that do not have transit coverage, but
contain potential transit customers. Three of the systems reported that they extended the
hours of their service, while two of the systems had reported additional coverage. Most

38
likely these systems identified a group of people that needed service and quite possibly
began to provide evening service. Likewise, this accounted for the increased passengers
identified in Figure 15. A system reported the need for additional labor, but this was due
to the need to hire additional drivers because of the increased coverage and extended
hours. Systems that reported the need for additional labor and extended service also
experienced increased operational costs. Also a couple of systems reported increased
capital costs. The capital cost increases resulted from the need to purchase GIS software,
software upgrades, and additional vehicles to meet additional service needs. Less labor
was required by two systems because they better utilized their equipment by eliminating
a route that was providing duplicate service. This same system experienced reduced
operating costs (Figure 16).
0% 5% 10% 15% 20% 25% 30%
Percent
Additional Coverage
Extended Hours
Meet Route Schedule
Increase in Passengers
Less Labor
Additional Labor
Res
ult
s
Figure 15. Results Since Transit Systems Have Implemented GIS, N=14.
39
0%
10%
20%
30%
40%
50%
60%
70%
80%
90%
100%
Operating Capital Revenue
Costs & Revenues
Per
cen
t DecreaseIncreaseNo Change
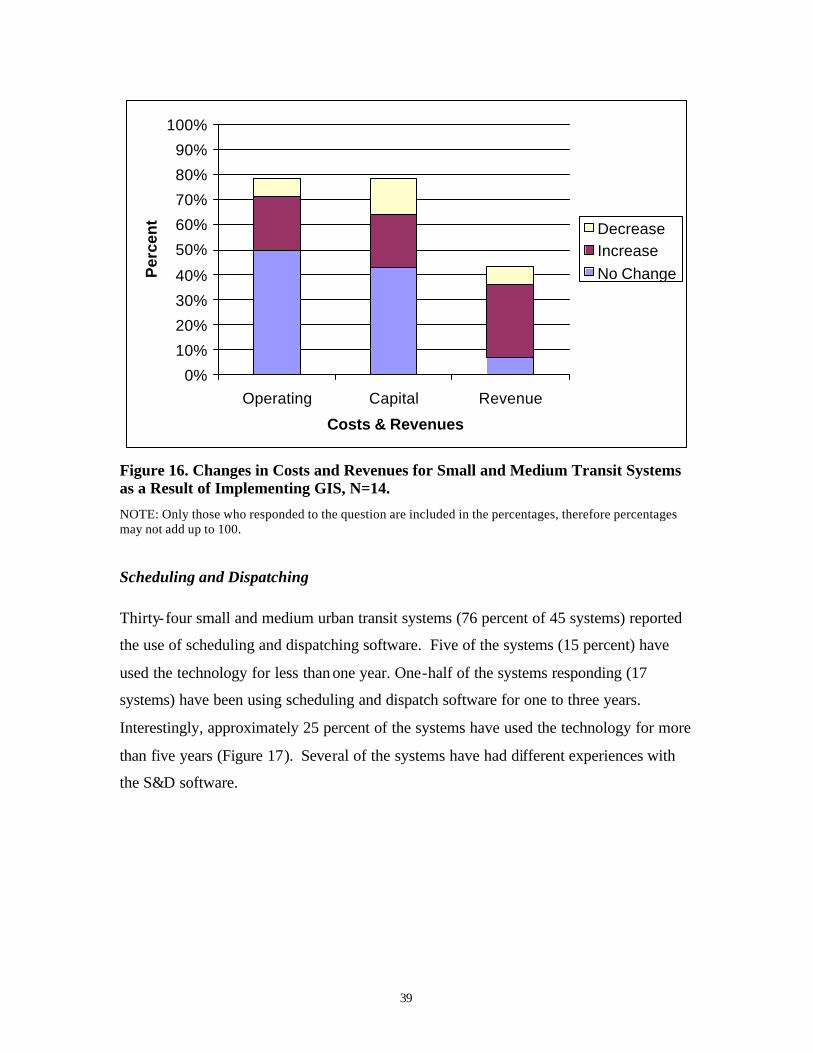
Figure 16. Changes in Costs and Revenues for Small and Medium Transit Systems as a Result of Implementing GIS, N=14.
NOTE: Only those who responded to the question are included in the percentages, therefore percentages may not add up to 100.
Scheduling and Dispatching Thirty-four small and medium urban transit systems (76 percent of 45 systems) reported
the use of scheduling and dispatching software. Five of the systems (15 percent) have
used the technology for less than one year. One-half of the systems responding (17
systems) have been using scheduling and dispatch software for one to three years.
Interestingly, approximately 25 percent of the systems have used the technology for more
than five years (Figure 17). Several of the systems have had different experiences with
the S&D software.

40
Less than 1 Year15%
1-3 Years49%
3-5 Years12%
Over 5 Years24%
Figure 17. Length of Time Small and Medium Urban Transit Systems Have Been Using S&D, N=34.
The small transit systems that use S&D software reported several results they attributed
to the technology. Eleven systems (32 percent) attributed increased passengers due to the
use of their S&D technology. Some of the systems indicated they did not know by how
much they increased passengers as a result of S&D. Nine of the systems (26 percent)
reported they are better able to meet route schedules as a result of the software. The
systems were split on their need for additional labor (six systems or 18 percent) or less
labor (six systems or 18 percent). The systems needing additional labor required more
dispatchers or individuals with more technical background to work with the system
(Figure 18).
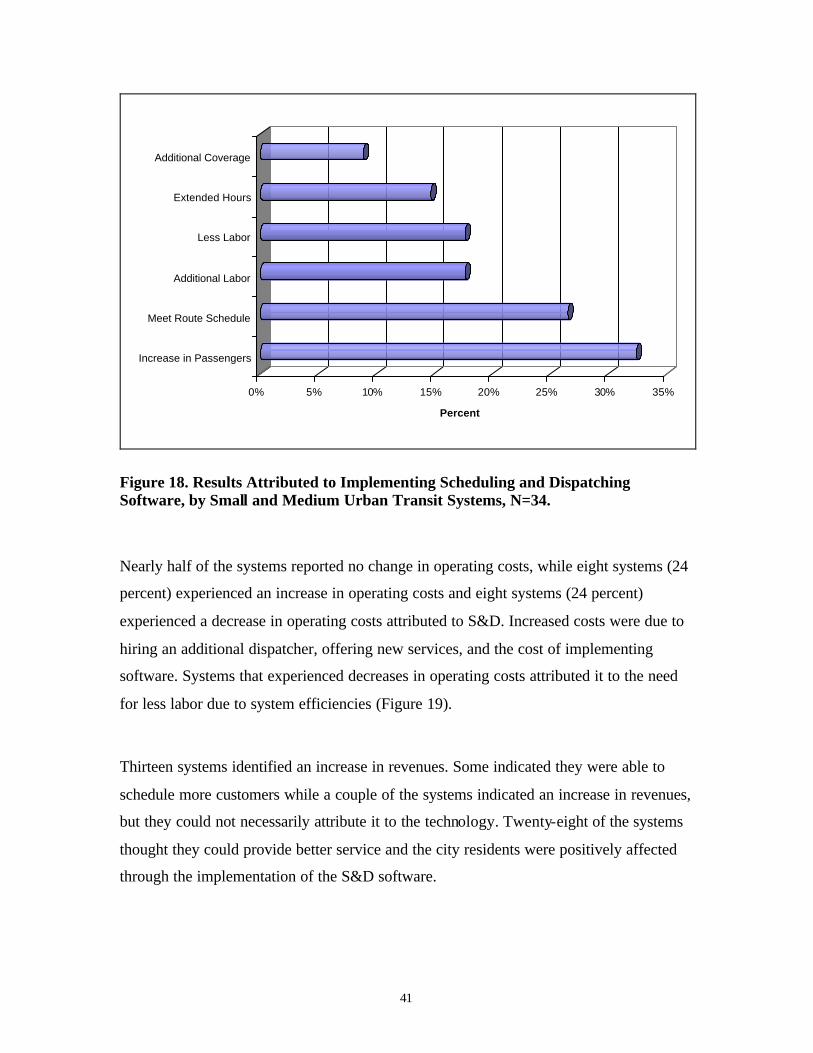
41
0% 5% 10% 15% 20% 25% 30% 35%
Percent
Increase in Passengers
Meet Route Schedule
Additional Labor
Less Labor
Extended Hours
Additional Coverage
Figure 18. Results Attributed to Implementing Scheduling and Dispatching Software, by Small and Medium Urban Transit Systems, N=34.
Nearly half of the systems reported no change in operating costs, while eight systems (24
percent) experienced an increase in operating costs and eight systems (24 percent)
experienced a decrease in operating costs attributed to S&D. Increased costs were due to
hiring an additional dispatcher, offering new services, and the cost of implementing
software. Systems that experienced decreases in operating costs attributed it to the need
for less labor due to system efficiencies (Figure 19).
Thirteen systems identified an increase in revenues. Some indicated they were able to
schedule more customers while a couple of the systems indicated an increase in revenues,
but they could not necessarily attribute it to the technology. Twenty-eight of the systems
thought they could provide better service and the city residents were positively affected
through the implementation of the S&D software.
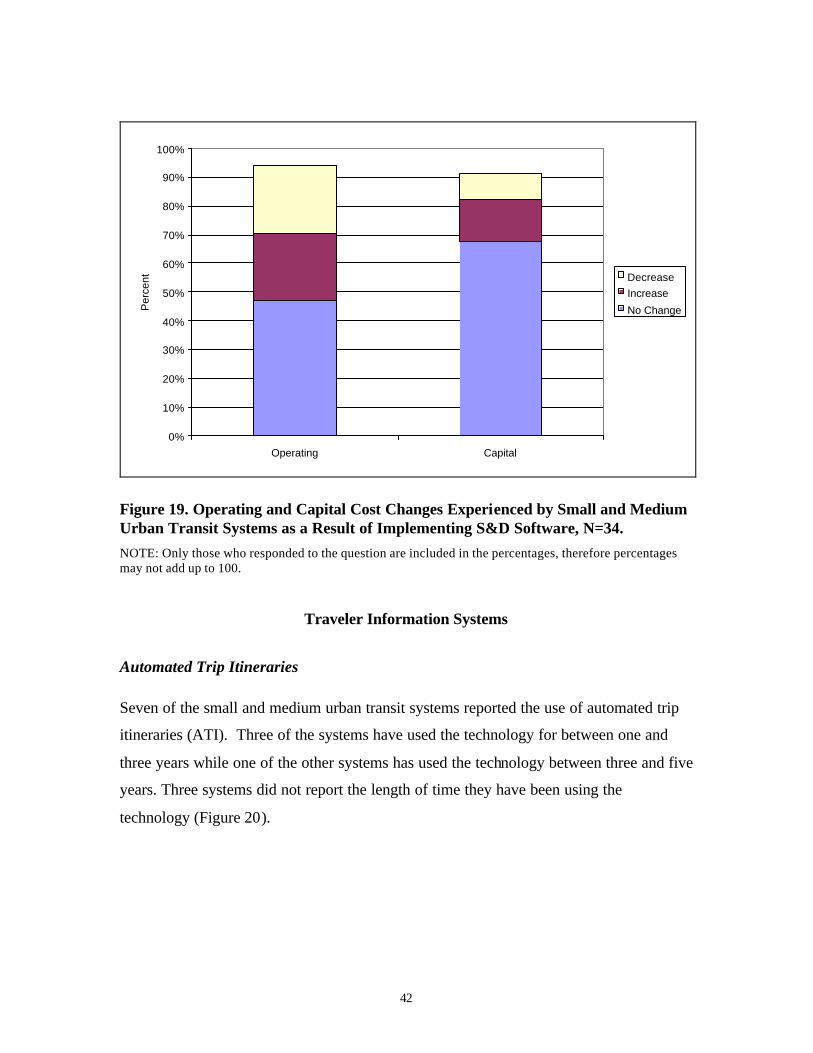
42
0%
10%
20%
30%
40%
50%
60%
70%
80%
90%
100%
Operating Capital
Per
cent Decrease
Increase
No Change
Figure 19. Operating and Capital Cost Changes Experienced by Small and Medium Urban Transit Systems as a Result of Implementing S&D Software, N=34. NOTE: Only those who responded to the question are included in the percentages, therefore percentages may not add up to 100.
Traveler Information Systems
Automated Trip Itineraries Seven of the small and medium urban transit systems reported the use of automated trip
itineraries (ATI). Three of the systems have used the technology for between one and
three years while one of the other systems has used the technology between three and five
years. Three systems did not report the length of time they have been using the
technology (Figure 20).
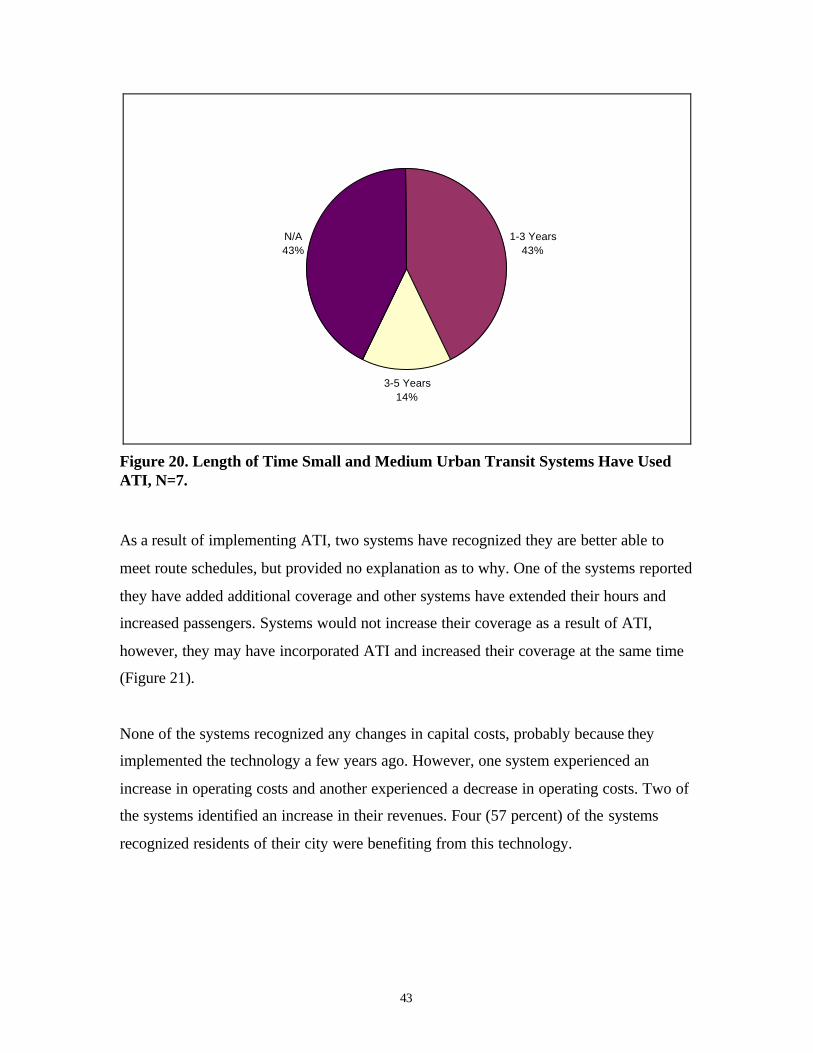
43
1-3 Years43%
3-5 Years14%
N/A43%
Figure 20. Length of Time Small and Medium Urban Transit Systems Have Used ATI, N=7.
As a result of implementing ATI, two systems have recognized they are better able to
meet route schedules, but provided no explanation as to why. One of the systems reported
they have added additional coverage and other systems have extended their hours and
increased passengers. Systems would not increase their coverage as a result of ATI,
however, they may have incorporated ATI and increased their coverage at the same time
(Figure 21).
None of the systems recognized any changes in capital costs, probably because they
implemented the technology a few years ago. However, one system experienced an
increase in operating costs and another experienced a decrease in operating costs. Two of
the systems identified an increase in their revenues. Four (57 percent) of the systems
recognized residents of their city were benefiting from this technology.
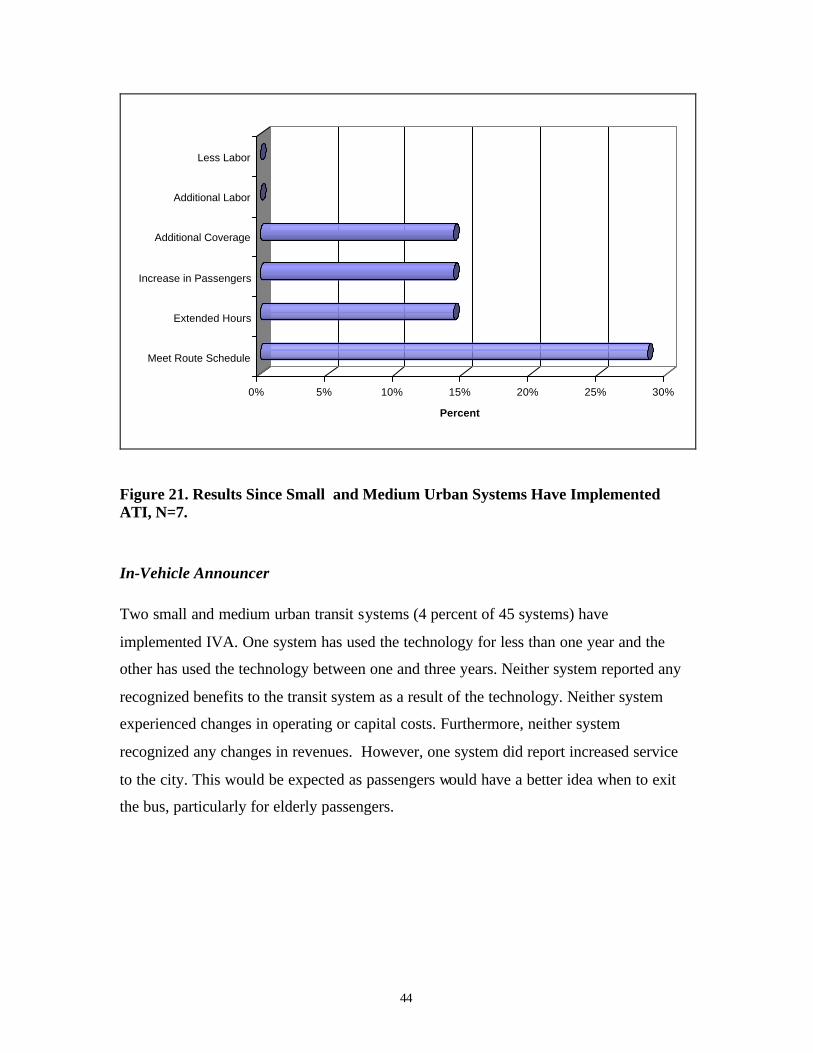
44
0% 5% 10% 15% 20% 25% 30%
Percent
Meet Route Schedule
Extended Hours
Increase in Passengers
Additional Coverage
Additional Labor
Less Labor
Figure 21. Results Since Small and Medium Urban Systems Have Implemented ATI, N=7.
In-Vehicle Announcer Two small and medium urban transit systems (4 percent of 45 systems) have
implemented IVA. One system has used the technology for less than one year and the
other has used the technology between one and three years. Neither system reported any
recognized benefits to the transit system as a result of the technology. Neither system
experienced changes in operating or capital costs. Furthermore, neither system
recognized any changes in revenues. However, one system did report increased service
to the city. This would be expected as passengers would have a better idea when to exit
the bus, particularly for elderly passengers.

45
Variable Message Signs Only one transit system in the category of small and medium urban reported the use of
VMS. This system has used the technology between three and five years. They did not
recognize any particular benefits to the transit system as a result of implementing the
technology. Furthermore, they did not experience any change in operating or capital costs
as a result of the technology. Nor did they experience any change in revenues. They did
report that services to customers in the city did increase.
Web Only one of the small and medium urban transit systems reported use of the Web. They
have only been using the Web for their transit system for less than one year. They did not
recognize any changes in operating or capital costs nor any change in revenues. However,
the transit system reporting thought that citizens of their city would benefit from the use
of this technology. This system may have posted route schedules for customers and
potential customers to identify routes, times, and costs.
Electronic Fare Collection
Only one method of electronic fare collection reported on in this study. Several of the
small and medium urban transit systems use EFC.
Electronic Fare Collection Seven small and medium urban transit systems (16 percent of 45 systems) responding
reported the use of Electronic Fare Collection. Two of the systems (29 percent) have
used the technology for less than one year. One of the systems (14 percent) have used the
technology for one to three years. Two systems (29 percent) have used the technology for
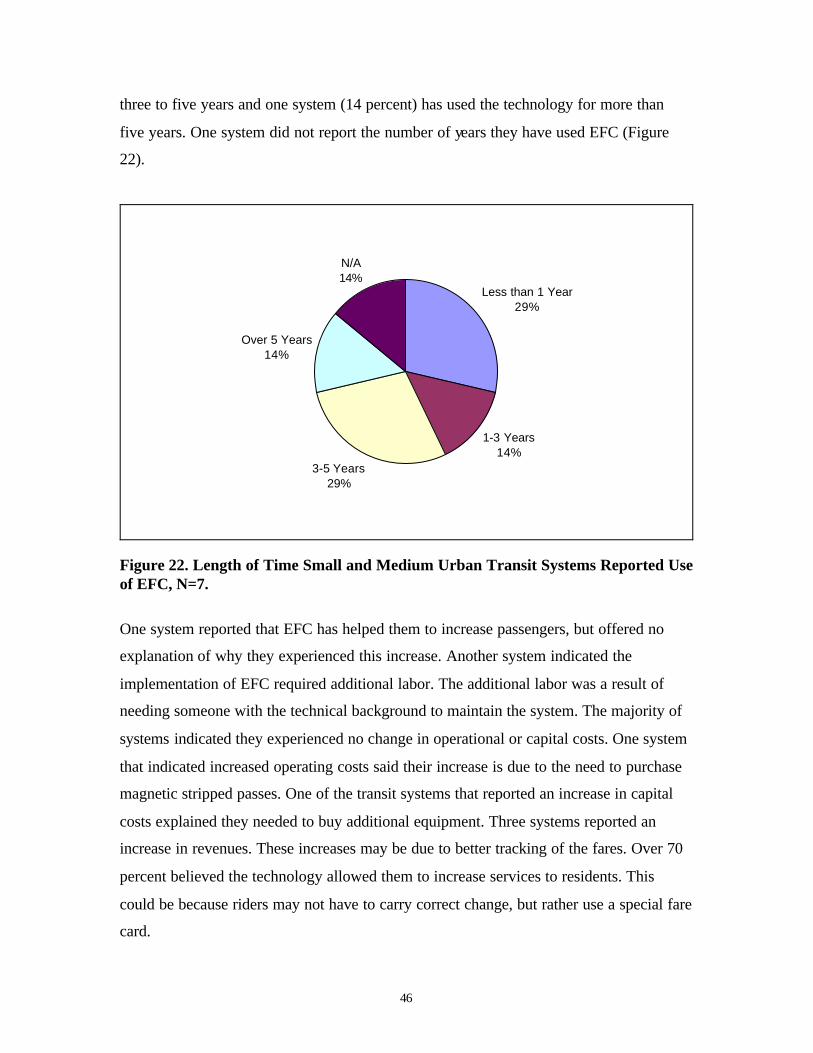
46
three to five years and one system (14 percent) has used the technology for more than
five years. One system did not report the number of years they have used EFC (Figure
22).
Less than 1 Year29%
1-3 Years14%
3-5 Years29%
Over 5 Years14%
N/A14%
Figure 22. Length of Time Small and Medium Urban Transit Systems Reported Use of EFC, N=7.
One system reported that EFC has helped them to increase passengers, but offered no
explanation of why they experienced this increase. Another system indicated the
implementation of EFC required additional labor. The additional labor was a result of
needing someone with the technical background to maintain the system. The majority of
systems indicated they experienced no change in operational or capital costs. One system
that indicated increased operating costs said their increase is due to the need to purchase
magnetic stripped passes. One of the transit systems that reported an increase in capital
costs explained they needed to buy additional equipment. Three systems reported an
increase in revenues. These increases may be due to better tracking of the fares. Over 70
percent believed the technology allowed them to increase services to residents. This
could be because riders may not have to carry correct change, but rather use a special fare
card.

47
LARGE URBAN TRANSIT SYSTEMS
Twenty transit systems in large urban cities with populations of more than 400,000
reported the use of ITS technologies in this questionnaire. Eleven different ITS
technologies were reported by these systems. The largest use of a single technology is the
use of scheduling and dispatching technologies. Each of the technologies in use are
addressed in Table 5. The states in which these systems are located are presented in
Figure 23.
Table 5. ITS Used by Large Urban System
Large Urban % Transit Management APC 7 35% AVL 7 35% GIS 10 50% S&D 16 80% SP 3 15% Automated Traveler Information Systems ATI 9 45% IVA 4 20% KIOSKS 1 5% VMS 1 5% WEB 7 35% Electronic Fare Collection EFC 14 70%
Transit Management
The results from large urban transit systems’ experience with five different fleet
management and operations technologies are reported on in this section. The technologies
include Geographic Information Systems (GIS), Automatic Vehicle Locators (AVL),
Automated Passenger Counters (APC), Signal Priority (SP), and Variable Message Signs
(VMS).
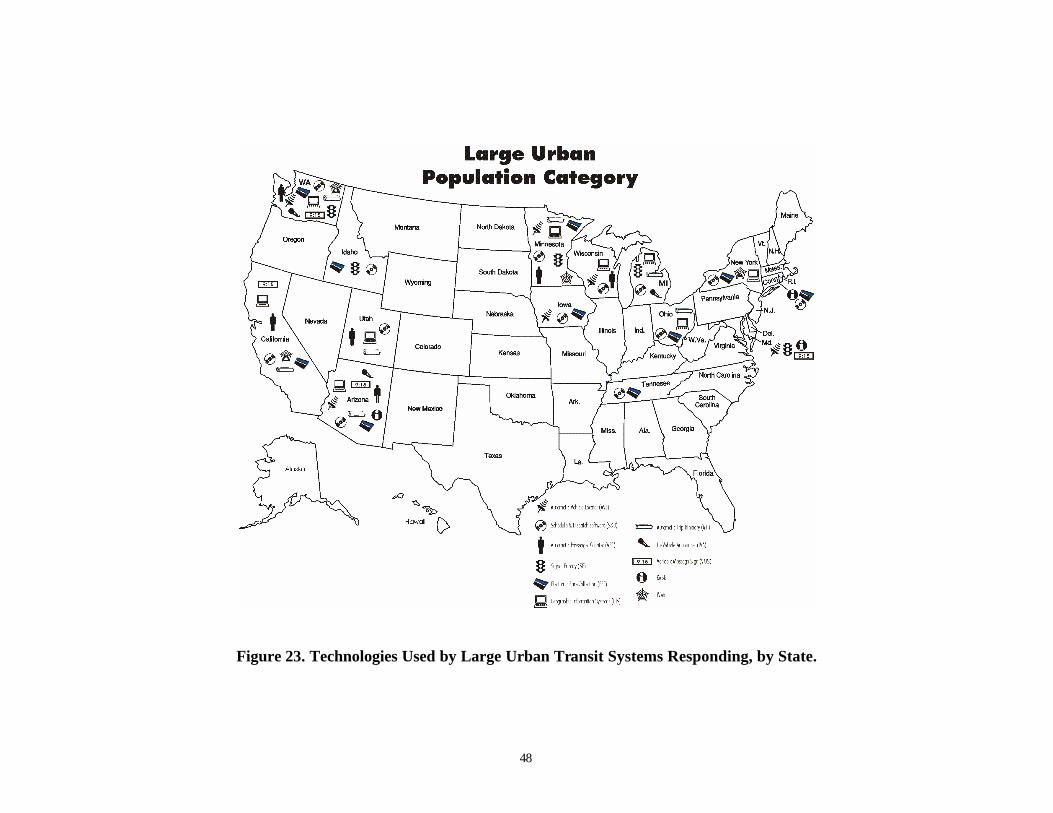
48
Figure 23. Technologies Used by Large Urban Transit Systems Responding, by State.
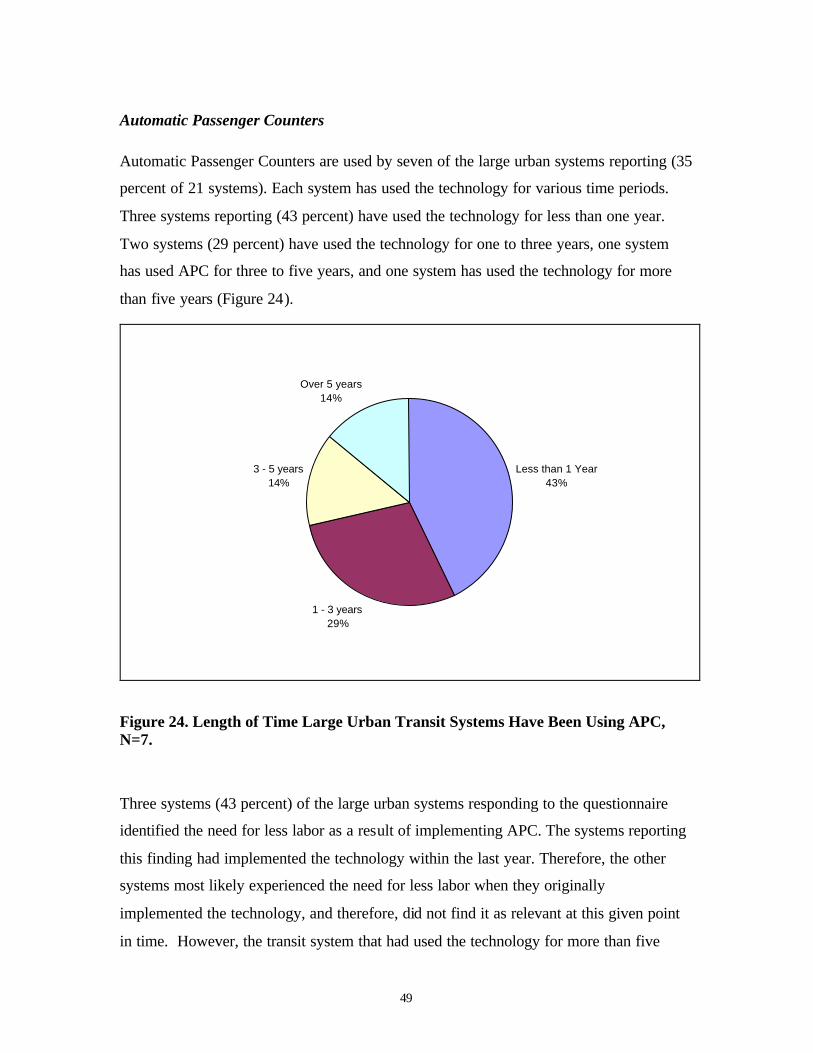
49
Automatic Passenger Counters Automatic Passenger Counters are used by seven of the large urban systems reporting (35
percent of 21 systems). Each system has used the technology for various time periods.
Three systems reporting (43 percent) have used the technology for less than one year.
Two systems (29 percent) have used the technology for one to three years, one system
has used APC for three to five years, and one system has used the technology for more
than five years (Figure 24).
Less than 1 Year43%
1 - 3 years29%
3 - 5 years14%
Over 5 years14%
Figure 24. Length of Time Large Urban Transit Systems Have Been Using APC, N=7.
Three systems (43 percent) of the large urban systems responding to the questionnaire
identified the need for less labor as a result of implementing APC. The systems reporting
this finding had implemented the technology within the last year. Therefore, the other
systems most likely experienced the need for less labor when they originally
implemented the technology, and therefore, did not find it as relevant at this given point
in time. However, the transit system that had used the technology for more than five

50
years reported an increase in additional coverage as well as better meeting route
schedules as a result of the technology. It is not clear how the system realized additional
coverage. One of the systems newly implementing the technology reported increased
passengers serviced as a result of the technology. Four systems (57 percent) reported
their service to residents of the community increased as a result of the technology (Figure
25).
0% 5% 10% 15% 20% 25% 30% 35% 40% 45%
Percent
Meet routeschedule
Additional Coverage
Additional Labor
Less Labor
Increasepassengers
Figure 25. Results Since Large Urban Transit Systems Have Implemented APC, N=7. Two large urban systems (29 percent) reported a decrease in operating costs while only
one system reported an increase in capital costs as a result of using APC. Most systems
experienced no change in their costs as a result of implementing the technology. Most
likely the systems experienced the increased capital costs when they first purchased the
systems, but have since paid for the technology and may experience additional costs if
they need to upgrade equipment.
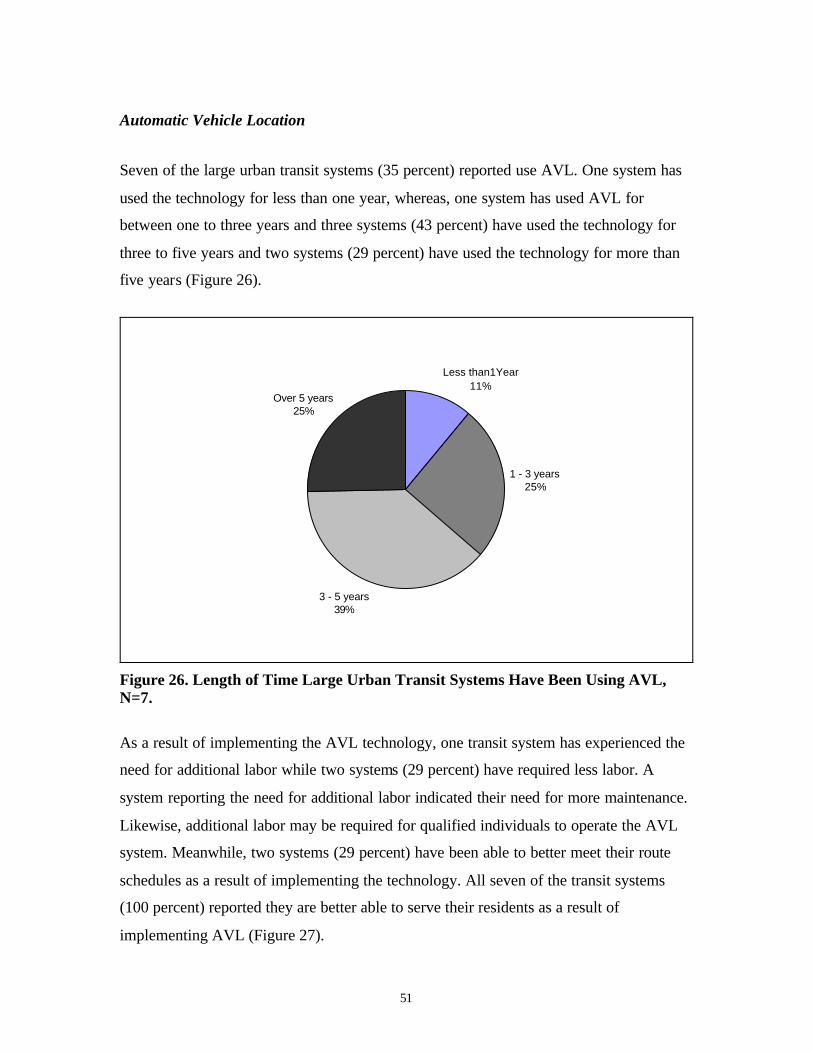
51
Automatic Vehicle Location
Seven of the large urban transit systems (35 percent) reported use AVL. One system has
used the technology for less than one year, whereas, one system has used AVL for
between one to three years and three systems (43 percent) have used the technology for
three to five years and two systems (29 percent) have used the technology for more than
five years (Figure 26).
Less than1Year11%
1 - 3 years25%
3 - 5 years39%
Over 5 years25%
Figure 26. Length of Time Large Urban Transit Systems Have Been Using AVL, N=7.
As a result of implementing the AVL technology, one transit system has experienced the
need for additional labor while two systems (29 percent) have required less labor. A
system reporting the need for additional labor indicated their need for more maintenance.
Likewise, additional labor may be required for qualified individuals to operate the AVL
system. Meanwhile, two systems (29 percent) have been able to better meet their route
schedules as a result of implementing the technology. All seven of the transit systems
(100 percent) reported they are better able to serve their residents as a result of
implementing AVL (Figure 27).

52
0% 5% 10% 15% 20% 25% 30%
Percent
Meet route schedule
Additional Coverage
Additional Labor
Less Labor
Increasepassengers
Figure 27. Results since Large Urban Transit Systems Have Implemented AVL, N=7.
Some of the transit systems reported changes in the operating and capital costs as a result
of implementing AVL. Four systems (57 percent) reported increased operating costs,
whereas, one system reported decreased operating costs. The increased operating costs
may be a result of incurred maintenance costs by the transit system. Likewise, three
systems (43 percent) reported an increase in capital costs and one system reported a
decrease in capital costs (Figure 28). The decrease in capital costs maybe a result of
better use of equipment.

53
0%
10%
20%
30%
40%
50%
60%
70%
80%
90%
100%
Operating Capital
Per
cen
t No Change
Decrese
Increase
Figure 28. Change in Costs for Large Urban Transit Systems Due to Implementing AVL, N=7.
Geographic Information Systems Ten of the 20 large urban systems reported the use of GIS technologies. The systems
reporting have extensive experience using GIS. One of the systems has used GIS for
more than five years, while 60 percent of the systems (six systems) have used the
technology for three to five years (Figure 29).
As a result of implementing GIS, two of the systems identified the need for additional
labor. This may have been in response to needing to hire individuals experienced with
using GIS. Two of the systems also reported GIS directly helped them better meet their
route schedules. Furthermore, 60 percent of the systems (six systems) reported an
increase in benefits to residents as a result of the transit system implementing GIS. Most
likely these systems were able to identify target resident groups in their community and
provide the necessary services to these groups (Figure 30).
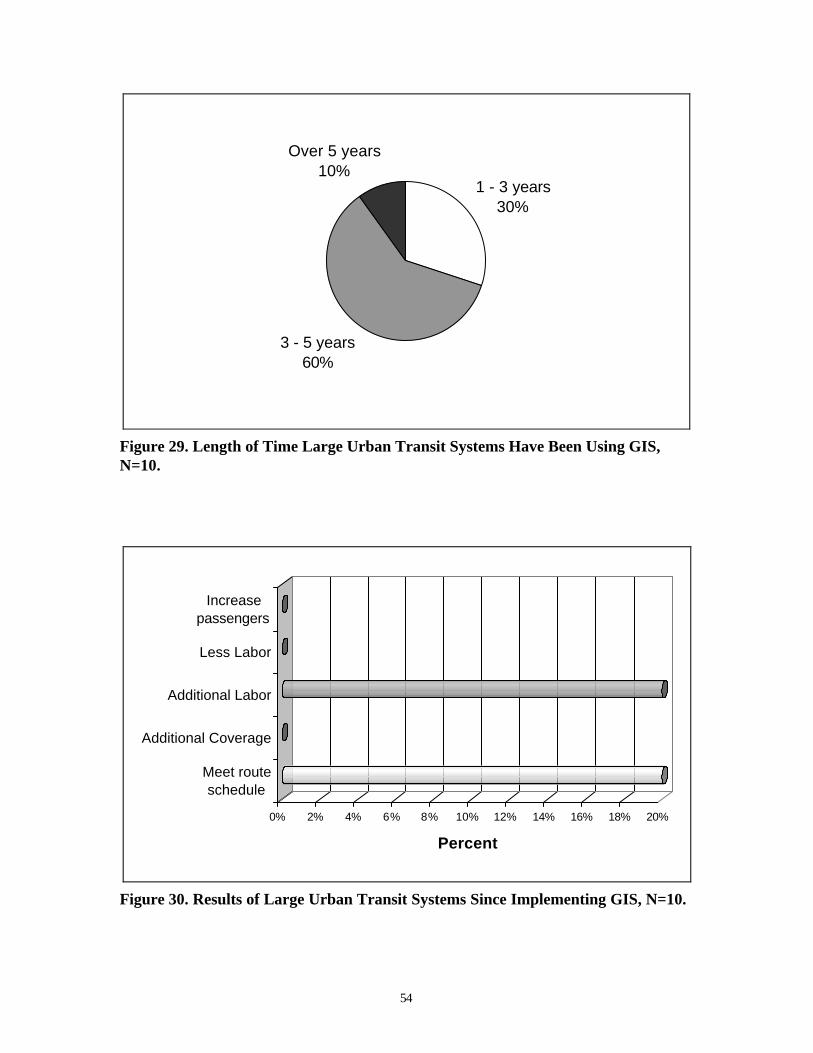
54
1 - 3 years30%
3 - 5 years60%
Over 5 years10%
Figure 29. Length of Time Large Urban Transit Systems Have Been Using GIS, N=10.
0% 2% 4% 6% 8% 10% 12% 14% 16% 18% 20%
Percent
Meet routeschedule
Additional Coverage
Additional Labor
Less Labor
Increasepassengers
Figure 30. Results of Large Urban Transit Systems Since Implementing GIS, N=10.

55
Only one system reported an increase in operating costs, while two systems (20 percent)
reported a decrease. Two systems reported an increase in capital costs, while one reported
a decrease. The remaining systems reported no change in their costs as a result of the
technology. Most likely the systems absorbed costs in their first year or two of
implementing the technology. Each of the systems reported no change in revenues. This
makes sense since none of the systems specifically identified an increase in passengers.
However, it was surprising that none of the systems reported an increase in passengers.
Scheduling and Dispatching Software Sixteen large urban transit systems reported the use of scheduling and dispatch software.
Five of these systems (31 percent) have used the technology between one and three years.
Three systems (19 percent) have used the technology for between three and five years
and eight systems (50 percent) have used the technology for more than five years (Figure
31). Clearly there is extensive experience with scheduling and dispatch software.
1-3 years31%
3-5 years19%
Over 5 years50%
Figure 31. Length of Time Large Urban Trans it Systems Have Been Using S&D, N=16.

56
Four systems (25 percent) have indicated they have increased passengers and also better
met route schedules as a result of using this technology. The increased passengers could
not necessarily be attributed to the software, but the systems have been better able to
handle increased demand because of it. They are better able to meet route schedules
because they have planned rides and routes better by using the software. Other benefits of
the technology have been the need for less labor and also additional transit coverage to
the city. Less labor has been required because schedulers and dispatchers are better able
to handle more trips than they could manually, without software. In addition, systems
have required fewer support personnel and have developed better schedules using the
software (Figure 32).
0% 5% 10% 15% 20% 25%
Percent
Meet route Schedule
Additional coverage
Additional Labor
Less Labor
IncreasedPassengers
Figure 32. Results of Large Urban Transit Systems That Have Implemented S&D, N=16.
Operating costs have increased for two (13 percent) of the transit systems using S&D.
The increase is a result of taking more calls and requiring additional dispatchers. Five
systems (31 percent) reported their operating costs decreased because of increased
efficiencies with fewer man-hours required. Capital costs increased for two systems and
decreased for one system while remaining unchanged for the other systems. The

57
increased costs have come from upgrading software. Revenues have increased for two
systems and remained unchanged for 14 systems (88 percent). The increase is a result of
the transit systems ability to schedule more passengers (Figure 33).
0%
10%
20%
30%
40%
50%
60%
70%
80%
90%
100%
Operating Capital Revenue
Per
cen
t
No Change
DecreaseIncrease
Figure 33. Change in Costs Due to Implementing S&D, N=16.
Signal Priority Three large urban transit systems (15 percent) reported use of signal priority. One of
these systems has only implemented SP within the last year. The other two systems have
been using SP for between one and three years (Figure 34). Two of the systems (67
percent) indicated the technology has helped them increase the number of passengers
served. The systems reported no changes in costs or revenues as a result of implementing
the technology. However, one system believed they were able to better serve the residents
in the community by using the technology. The better service would be a result of
reduced travel time or the systems better keeping their schedules. However, none of the
systems identified better meeting their route schedules as an improved service due to
implementing the technology.
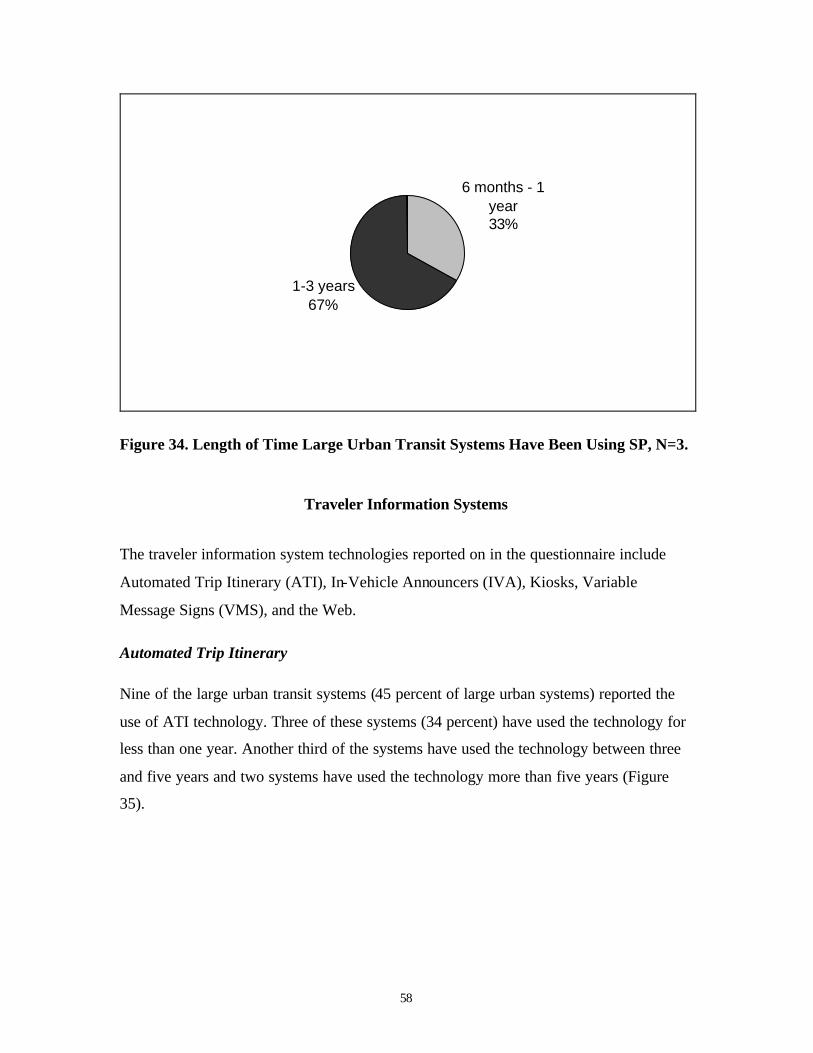
58
6 months - 1 year33%
1-3 years67%
Figure 34. Length of Time Large Urban Transit Systems Have Been Using SP, N=3.
Traveler Information Systems
The traveler information system technologies reported on in the questionnaire include
Automated Trip Itinerary (ATI), In-Vehicle Announcers (IVA), Kiosks, Variable
Message Signs (VMS), and the Web.
Automated Trip Itinerary Nine of the large urban transit systems (45 percent of large urban systems) reported the
use of ATI technology. Three of these systems (34 percent) have used the technology for
less than one year. Another third of the systems have used the technology between three
and five years and two systems have used the technology more than five years (Figure
35).

59
Less than 1 Year34%
1 - 3 years11%
3 - 5 years33%
Over 5 years22%
Figure 35. Length of Time Large Urban Transit Systems Have Been Using ATI, N=9.
ATI has impacted several of the transit systems using the technology. Two systems (22
percent) have noted the need for less labor. This reportedly is due to increased
productivity with customer information. Sys tems using the internet application of ATI
have reduced the number of calls needing responses. A system reported increased
passengers, which likely is due to the improved information available for the customers
to use (Figure 36).

60
0% 5% 10% 15% 20% 25%
Percent
Meet routeschedule
Additional Coverage
Additional Labor
Less Labor
Increasepassengers
Figure 36. Results since Large Urban Transit Systems Have Implemented ATI, N=9.
Two systems (22 percent) reported increased operating costs due to implementing the
technology. While two systems reported decreased operating costs due to the need for
less labor, only one system reported an increase in capital costs and one system reported
an increase in revenues. The increase in revenues probably is closely related to improved
service customers and city residents are receiving with this technology.
In-Vehicle Announcers Four large urban transit systems reported the use of IVA. There was a wide range in the
length of time each system had used IVA. One system has used the technology less than
six months, while one system used the technology between one and three years, one
system has used IVA between three and five years, while the remaining system has used
the technology for more than five years (Figure 37). Of these systems reporting, the
transit system using IVA for more than five years reported a need for additional labor.
The system reported they experienced a slight increase in labor costs due to the need to
copy programs on to each bus when changes are made.

61
Less than 6 mnths25%
1 - 3 years25%
3 - 5 years25%
Over 5 years25%
Figure 37. Length of Time Large Urban Transit Systems Have Been Using IVA, N=4.
One of the transit systems reported an increase in capital and operating costs indicating
that purchasing a new bus with this technology has increased their costs. None of the
systems reported a change in revenues. The systems indicated that passengers,
particularly the elderly and handicapped, like the IVA. The systems perceive that
implementing this technology has enhanced services to system users.
Kiosks One of the large urban systems has been using Kiosks for more than five years. They did
not report any particular increase in service to their residents. However, one would
anticipate the residents could benefit from additional information made available to them.
Furthermore, the system did not report any change in their costs, this could be due to the
city or some other agency picking up the costs of the Kiosk or the fact it has been in place
for more than five years and no additional costs have been incurred.
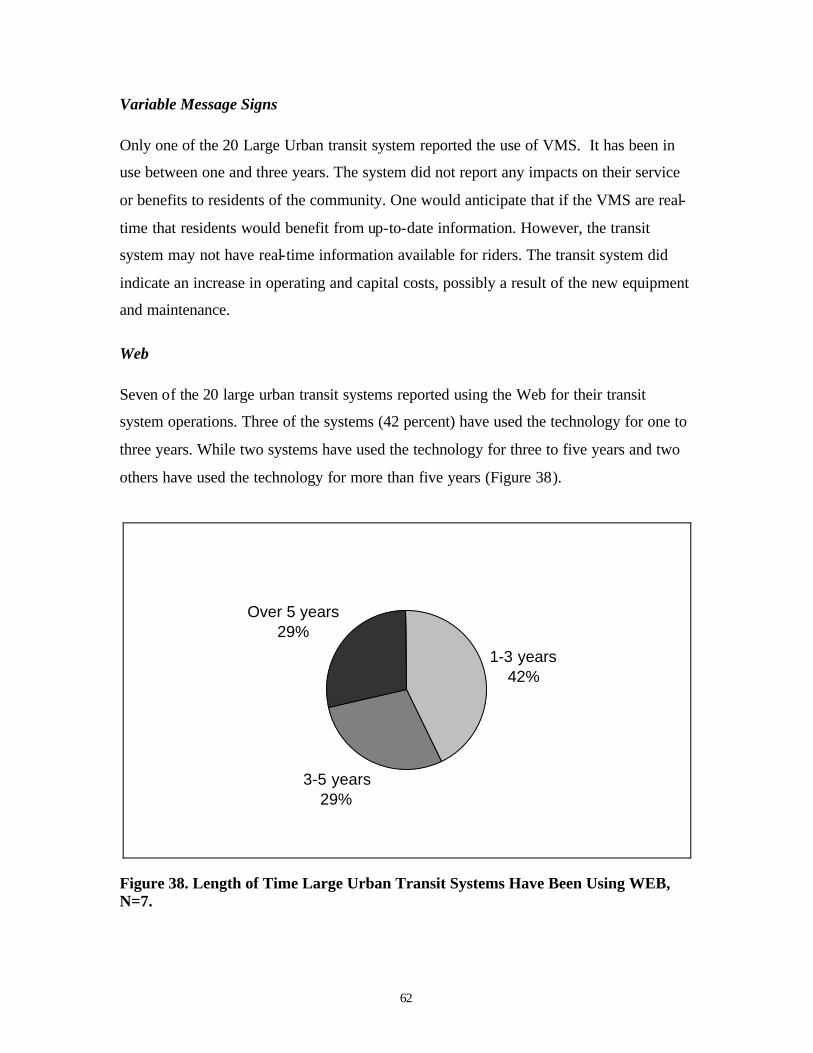
62
Variable Message Signs Only one of the 20 Large Urban transit system reported the use of VMS. It has been in
use between one and three years. The system did not report any impacts on their service
or benefits to residents of the community. One would anticipate that if the VMS are real-
time that residents would benefit from up-to-date information. However, the transit
system may not have real-time information available for riders. The transit system did
indicate an increase in operating and capital costs, possibly a result of the new equipment
and maintenance.
Web Seven of the 20 large urban transit systems reported using the Web for their transit
system operations. Three of the systems (42 percent) have used the technology for one to
three years. While two systems have used the technology for three to five years and two
others have used the technology for more than five years (Figure 38).
1-3 years42%
3-5 years29%
Over 5 years29%
Figure 38. Length of Time Large Urban Transit Systems Have Been Using WEB, N=7.

63
One system reported they required additional labor since incorporating Web technology
into their system. This was due to initiating and updating Web information for the
system. Operating costs also increased for this system due to hiring additional labor. All
systems reported there was no change in revenues as a result of implementing the Web
technology. However, if the Web is providing ATI for systems they may experience an
increase in revenues as reported for the ATI technology.
Electronic Fare Collection
Electronic Fare Collection Fourteen large urban transit systems of the 20 systems reporting or 70 percent use EFC.
Half of these systems have used the technology for more than five years while two
systems (14 percent) have used the technology between three and five years and five
systems (36 percent) have used the technology between one and three years (Figure 39).
1 - 3 years36%
3 - 5 years14%
Over 5 years50%
Figure 39. Length of Time Large Urban Transit Systems Have Been Using EFC, N=14.

64
Transit systems have reported mixed affects due to implementing EFC. Some systems
have experienced the need for increased labor primarily due to labor needed for
additional maintenance. The system reported that more sophisticated systems required
more labor than manual fare collection systems require. Three systems experienced
increased passengers, but did not provide reasons why they believed the passengers
increased. It is possible that employers provided electronic fare cards to their employees
to help defray their transportation costs of their employees and thereby encouraged the
use of public transportation (Figure 40).
0% 5% 10% 15% 20% 25% 30%
Percent
Meet routeschedule
Additional Coverage
Additional Labor
Less Labor
Increasepassengers
Figure 40. Results since Large Urban Transit Systems Have Implemented EFC, N=14.
Six systems (43 percent) reported increased operating costs. These increases were
reported to be due to increased maintenance. Three systems reported EFC reduced their
operating costs. It was reported by a system this reduction was because they no longer
needed to do “riding counts” to obtain their data, but could use the data provided by the
EFC. Capital costs increased for six systems (43 percent), due to the need for equipment.
One system reported a decrease in capital costs, but the reasoning was not clear. Five
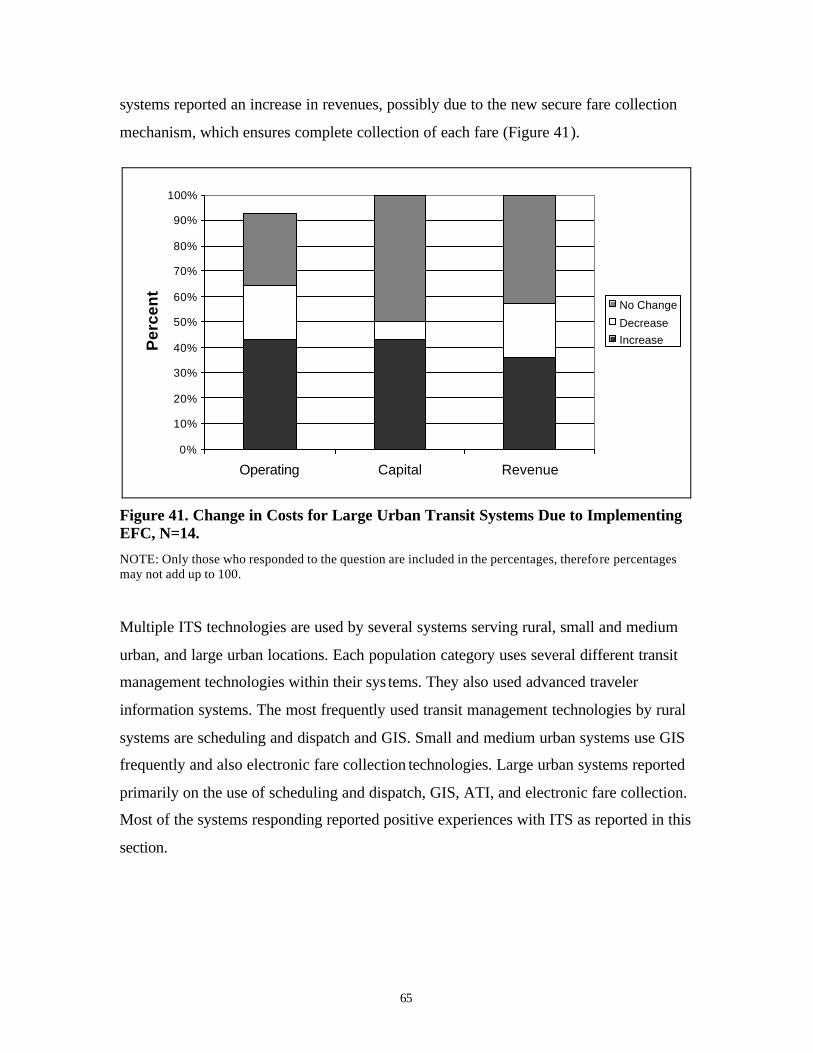
65
systems reported an increase in revenues, possibly due to the new secure fare collection
mechanism, which ensures complete collection of each fare (Figure 41).
0%
10%
20%
30%
40%
50%
60%
70%
80%
90%
100%
Operating Capital Revenue
Per
cen
t
No Change
DecreaseIncrease
Figure 41. Change in Costs for Large Urban Transit Systems Due to Implementing EFC, N=14.
NOTE: Only those who responded to the question are included in the percentages, therefore percentages may not add up to 100. Multiple ITS technologies are used by several systems serving rural, small and medium
urban, and large urban locations. Each population category uses several different transit
management technologies within their sys tems. They also used advanced traveler
information systems. The most frequently used transit management technologies by rural
systems are scheduling and dispatch and GIS. Small and medium urban systems use GIS
frequently and also electronic fare collection technologies. Large urban systems reported
primarily on the use of scheduling and dispatch, GIS, ATI, and electronic fare collection.
Most of the systems responding reported positive experiences with ITS as reported in this
section.
66
ITS AND WELFARE TO WORK
Many welfare recipients are dependent on public transportation, especially because so
few own vehicles. To make the Welfare to Work Initiative a success, efficient transit
systems with good community coverage is a necessity. ITS Technologies can help transit
systems increase efficiencies and improve system coverage (i.e., better and more
services).
Identifying transit systems that have implemented ITS and welfare to work recipients that
have benefited from the technologies was the focus of this study. However, identifying
the impacts on welfare to work recipients has been difficult. Most transit systems do not
keep track of the socio-economic characteristics of their riders. A few survey respondents
indicated that individuals on welfare already have enough problems with a stigma
attached to this socio-economic position. The transit managers do not want to contribute
to this stigma by issuing special cards that would identify these individuals according to
socio-economic class. Many of the transit systems responding indicated a willingness to
work with social service agencies to better meet the needs of the welfare recipients. The
results pertaining to welfare recipients on Survey I and Survey II were quite limited.
However, the results are described on the following pages.
Survey I Results
The questions on Survey I specific to welfare recipients included determining if welfare
recipients paid different fares and also if welfare recipients received adequate transit
services and coverage making it easier for them to begin work. Of the 122 transit systems
that use ITS which responded to Survey I, most do not offer lower fares to welfare
recipients. Only two systems (1.6 percent) indicated they offer a lower fare to welfare
recipients. Some social service agencies may pay for welfare recipients’ transit fares,
however, this information is not necessarily provided to the transit manager.
Transit systems were asked to provide an estimate of the percentage of welfare-to-work
employees that have access to travel from home to work by public transportation. Transit

67
managers were asked to define what they consider good access (relating to distance) to
bus service. Several of the systems indicated good service constitutes customers walking
approximately 0.25 to 0.50 miles to or from the bus stop. Fourteen (11 percent) of 122
systems that use ITS reported that more than 75 percent of the welfare recipients in their
service area have access between 0.25 and 0.5 miles of a bus stop. Three systems (2.5
percent) reported between 50 and 75 percent of the welfare recipients have this kind of
service while three other systems (2.5 percent) reported that less than 50 percent of the
welfare recipients have this kind of service. Many other systems reporting did not know
or could not offer this estimate. Although some of the welfare recipients have good
access, not all do and this creates problems trying to move them from welfare into the job
market.
Survey II Results
Seventy-four transit systems took part in Survey II. These transit managers were asked if
the particular ITS technologies implemented had helped the system offer better service to
welfare to work recipients. Respondents were asked to indicate if welfare recipients’
service was “increased,” “decreased,” or “do not know.” Not all ITS technologies would
have direct impact on the services provided to welfare recipients. The results of the
transit managers’ perceptions relating to relevant ITS technologies’ impact upon welfare
recipients are listed in Table 6. Six techno logies were considered to have the greatest
possible affect upon service to welfare to work recipients. These technologies include
AVL, S&D, EFC, GIS, ATI, and the Web. Transit managers viewed each of the six
technologies as beneficial to welfare to work recipients. GIS was the technology most
frequently identified to increase service to welfare recipients.

68
It is difficult to track the effectiveness of each technology upon the welfare to work
clientele so the results listed should be used with care when considering implementing
these technologies to better serve welfare to work clientele. Each of the six technologies
will be considered in this section. First, the population categories will be considered as a
whole and if they perceive the ITS technologies benefit service to welfare to work clients.
Second, each technology will be looked at more in-depth.
Each of the population categories, rural, small and medium urban, and large urban
viewed at least one of the technologies as beneficial to welfare to work clients. Of the
nine rural systems reporting, three systems (33 percent) perceived that welfare-to work
clients benefited from the technologies. Rural systems only reported use of three of the
six technologies considered. Scheduling and Dispatching was reported by six of the
systems and three of the systems (50 percent) perceived the technology benefited the
welfare clients. Of the 45 small and medium urban transit systems, 56 reported uses of
the six technologies (systems can use more than one technology). Twenty-five systems
(45 percent) reported they perceived that welfare clients benefited from the ITS
Table 6. Changes in Transit Service to Welfare Recipients as a Result of Implementing ITS Technology AVL S&D EFC GIS ATI Web Rural # Reporting 1 6 0 2 0 0 Increased 0 3 - 0 - - Do not know 1 3 - 2 - - Small & Med Urban # Reporting 3 34 5 11 4 1 Increased 2 12 2 8 0 1 Do not know 1 20 3 3 4 0 Large Urban # Reporting 8 16 14 9 9 7 Increased 2 4 4 6 5 1 Do not know 6 12 10 3 4 6 Totals Using Technology 12 56 19 22 13 8 NOTE 1: Table represents those systems reporting their perceptions of changes in services to welfare recipients as a result of implementing the technology. NOTE 2: The other technologies included in the survey, but were found not to have impact upon the service to welfare clientele include: automatic passenger counters, signal priority, in -vehicle announcers, variable message signs, and interactive kiosks.

69
technologies they implemented. Of the large urban systems responding to the survey,
there were 62 reported uses of the six technologies. There were 22 reports (35.5 percent)
where the technologies benefited welfare clients being served.
Automatic Vehicle Location
Of the 12 reported uses of AVL, four systems (33 percent) reported they believed the use
of AVL increased the service to those on welfare. These systems were in small and
medium urban and large urban locations. Although no specific reasons were given for the
increased service, it is probably due to increased performance of the transit systems,
which would result in better on-time service for transit riders including welfare recipients
that may be entering the workforce.
Scheduling and Dispatch Nineteen of 56 systems (34 percent) reported they believed that S&D increased service to
welfare recipients. Primarily rural and small and medium urban systems reported the
increase whereas most of the large urban systems reported they did not know if S&D
increased service to welfare to work recipients. The increased service to welfare clientele
is because of increased reliability and dependability of timely service. Some social
service agencies are sharing information with transit systems regarding clients’ needs so
transit systems are better able to plan and meet these clients’ needs. In addition, the
transit systems can coordinate trips more effectively with this information and better
utilize equipment because of improved planning efforts.
Electronic Fare Collection Six of the 19 systems (31.6 percent) using EFC reported an increase to service to welfare
to work recipients. Fourteen of the 20 large urban systems have implemented EFC. Four
of the systems (29 percent) thought the EFC helped service to welfare to work clientele.
The remaining systems simply did not know or did not feel comfortable indicating an
increase. Some systems set up specific programs to assist low-income individuals. For
example, some county social services departments purchased multiple trip passes for
70
welfare clients who can be used for going to job training, interview, and to work for a
certain period of time, e.g., 90 days.
Geographic Information Systems
Fourteen of the 22 transit systems (64 percent) using GIS thought the technology
increased the service to welfare to work recipients. It was the small and medium urban
and large urban systems that recognized these increases. The technology provides a great
tool to help identify route additions and changes to better meet needs of riders and target
specific riders. Geographic data available to some systems of where welfare recipients
live, employment opportunities, and day care facilities enables systems to modify routes
and offer more complete coverage of services.
Automated Trip Itinerary
Five of the 13 systems (38.5 percent) using ATI reported increased service to welfare to
work recipients as a result of implementing the technology. All of the systems reporting
this increase were classified as large urban systems. Database of routes is available for
individuals to retrieve trip information. Individuals, including welfare recipients, can
better plan their trips.
Web
Two of eight systems (25 percent) using the Web in their transit service indicated the
technology would benefit welfare to work recipients. Some systems show their routes and
schedules on the Web and clients are better able to access this information. They may feel
that welfare recipients may not have access to the Web so they may not benefit from this
technology.

71
PLANNED FUTURE ITS USE
The transit systems responding to questionnaires were asked to specify if they planned to
implement additional ITS technologies in the future, and if so, to specify which
technologies. Fifty-seven systems (77 percent) reported plans to implement multiple
technologies in the future (Table 7). Many systems planned to implement Transit
Management Technologies. These technologies include S&D, GIS, AVL, APC, and SP.
The table also reveals that large urban systems reported the most plans for implementing
additional ITS technologies. Although only six of the large urban systems mentioned
plans to implement EFC, 14 of the large urban systems already use this technology.
Therefore, all of the systems responding to this questionnaire does use or plans to use
EFC in the near future.
Table 7. Number of Future Technologies to be Implemented, by Population Category Rural Sm & Md Urban Large Urban Total Transit Management 11 46 47 104 Automated Traveler Information Systems 2 5 23 30 Electronic Fare Collection 2 12 6 20 Travel Demand Management 2 7 10 19 Total 17 70 86 173

72
SUMMARY The main focus of this study was to examine ITS technologies applicable to public
transportation systems. A mail questionnaire was developed and mailed to 2,459 rural,
small urban, and suburban transit systems to identify systems that use ITS technologies.
Of the 501 systems responding, 122 used one or more of the ITS technologies. A follow-
up Web-based survey was developed. One hundred sixteen of these systems were
contacted and asked to complete the Web based survey. Seventy-four systems responded.
Much of the analysis for this study was based on the information gathered from the Web-
based survey. The responding transit systems were classified by population size as
follows:
• nine systems were classified as rural, serving populations less than
50,000;
• 45 systems were classified as small and medium urban systems serving
populations between 50,000 and 400,000; and
• 20 systems were classified as large urban systems serving populations
greater than 400,000 people.
Geographic Information Systems (GIS) and Scheduling and Dispatching (S&D) were the
most widely used technologies by the rural transit systems responding to the
questionnaire. Several systems reported these technologies aided in increasing the
passengers. There were mixed responses in that some systems needed to hire additional
labor as a result of implementing the technology whereas other systems required less
labor. In general, the additional labor was needed because routes increased and more
drivers were needed. Also, some systems needed trained employees to work with the
technology. The report on capital costs, operational costs, and revenues were all mixed.
Nine different technologies are used by the small and medium urban systems responding
to the second survey. The most commonly reported technologies were GIS, EFC, and
S&D. Each of the technologies have been used by several transit systems for various
73
numbers of years. Many of the systems responding experienced many positive affects
from using the technologies. The impacts upon operating and capital costs were mixed.
Twenty transit systems responding were classified as large urban systems. These systems
used several of the technologies, but the technologies used most frequently include S&D,
EFC, and GIS. The systems reported several benefits including increased passengers,
better service, increased revenues, and reduced costs.
Six of the technologies, AVL, S&D, EFC, GIS, ATI, and the Web were found to have
increased some of the transit systems ability to better serve welfare-to-work clientele.
S&D and GIS received the highest number of systems indicating the technology helped
increase service to welfare to work recipients. Several of the transit systems are planning
to implement these technologies in the future. The technologies with the highest planned
implementation are APC, EFC, and GIS. Seventy-six percent of the systems already use
S&D and 20 percent more plan to implement the technology in the near future.

74
CONCLUSIONS Transit systems have experienced positive benefits in the use of ITS technologies. The
larger systems have implemented more variety of ITS technologies, and several systems
use multiple technologies. The specific findings are in the following paragraphs.
First, it can be concluded that larger systems more frequently use multiple applications of
ITS. These systems tend to be more sophisticated and have more staff that may have the
expertise or greater access to expertise than smaller more rural systems. Also, larger
systems have more community visibility and more demands placed upon their systems
which often justifies the additional expenses they may incur to implement ITS.
Second, S&D, GIS, and EFC were the most commonly reported ITS technologies used by
the responding transit systems. These technologies were reported to help increase
benefits to the transit system, as well as to increase service to residents and welfare-to-
work clientele. It is difficult to trace the impact these technologies have had on systems,
but the results are based on the transit managers’ perceptions.
Third, transit systems are satisfied with their ITS choices and want to incorporate
complementary or additional ITS technologies into their system. This is evident by the
large number of systems that reported their plans to implement additional technologies in
the future.
Finally, since these results are based on perceptions, to provide a more in-depth analys is
of the specific benefits of the impacts of ITS on public transportation systems would be
beneficial. Considering actual costs and benefits would help justify the future expansion
of ITS to more transit systems. Further, the results of this study do not take into
consideration the perceptions or idea of social service agencies working with the welfare
to work clientele. These agencies may have responses as to the effectiveness of ATI and
Web technologies when serving welfare to work clientele.

75
REFERENCES Advanced Public Transportation System Benefits, Federal Transit Administration,
January 1996. Crandall, W., Ph.D., B. Bentzen, Ph.D., L. Myers, M.Ed., and P. Mitchell, Ph.D., Remote
Infrared Signage for People Who are Blind or Print Disabled: A Surface Transit Accessibility Study-Project Action, The Smith-Kettlewell Eye Research Institute, San Francisco, April 1996.
Dining, Michael G. Volpe National Transportation Systems Center, Cambridge,
Massachusetts. “Intelligent Transportation is Here and Working,” Trek Talk, Issue 2, Spring 1997. ITS Technologies in Public Transit: Deployment and Benefits, ITS America, February
1995. Jones, W., ITS Technologies in Public Transit: Deployment and Benefits, US Department
of transportation ITS Joint Program Office, November 1995. Kloos, W., “Bus Priority at Traffic Signals in Portland: The Powell Boulevard Pilot
Project,” Submitted to ITE for the Compendium of Technical Paper, July 1994. Leete, L. Bania, N. The Impact of Welfare on Labor Markets. Cleveland: Center on
Urban Poverty and Social Change. Case Western Reserve University, 1996. Lindsay, Oliver. Non-Emergency Health Paratransit Planning and Operations Manual.
Community Transportation Association of America. (www.ctaa.org/ntrc/medical/pubs/hbc/dispatch.shtml)
McKendrick, Neil, City of Calgary Transportation Department, Calgary, Alberta,
Canada. “NJ Transit’s Customer Information Speeded Up by New System,” Passenger Transport,
24 January 1994. Remer, M., T. Atherton, and W. Gardner, “ITS Benefits, Evaluation and Costs: Results
and Lessons from the Minnesota Guidestar Travlink Operational Test, Draft, November, 1995.
Smart Card Prototype Demonstration Project, Final Report, IBI Group, June 1997. Time to Get Smart, article published in Mass Transit, November/December 1995.

76
U.S. Department of Transportation. Access to Jobs. Welfare to Work Initiative. Federal Transit Administration, Washington, DC, 1998.
U.S. Department of Transportation. ITS Deployment Guidance for Transit Systems:
Technical Edition. Federal Highway Administration, Washington, DC, 1997. U.S. Department of Transportation. A Guide to Innovative Practices: Access to Jobs.
Federal Transit Administration, Washington, DC, 1998. U.S. Department of Transportation, Advanced Public Transportation Systems: The State
of the Art Update ’98, Federal Transit Administration, Washington, DC, 1998. U.S. Department of Transportation. A Guide to Innovative Practices: Access to Jobs.
Federal Transportation Administration. Washington, DC, 1998.


