
Climatic ChangeDOI 10.1007/s10584-014-1202-4
Integrated models, scenarios and dynamics of climate,land use and common birds
Jean-Sauveur Ay · Raja Chakir · Luc Doyen ·Frederic Jiguet · Paul Leadley
Received: 14 May 2013 / Accepted: 26 June 2014© Springer Science+Business Media Dordrecht 2014
Abstract Reconciling food, fiber and energy productionwith biodiversity conservation is among the greatest chal-lenges of the century, especially in the face of climatechange. Model-based scenarios linking climate, land useand biodiversity can be exceptionally useful tools for deci-sion support in this context. We present a modeling frame-work that links climate projections, private land use deci-sions including farming, forest and urban uses and theabundances of common birds as an indicator of biodiver-sity. Our major innovation is to simultaneously integratethe direct impacts of climate change and land use on bio-diversity as well as indirect impacts mediated by climatechange effects on land use, all at very fine spatial resolu-tion. In addition, our framework can be used to evaluateincentive-based conservation policies in terms of land useand biodiversity over several decades. The results for ourcase study in France indicate that the projected effects of
Electronic supplementary material The online version of thisarticle (doi:10.1007/s10584-014-1202-4) contains supplementarymaterial, which is available to authorized users.
J. -S. Ay (�) · L. Doyen · F. JiguetCNRS, MNHN, UMR 7204 CESCO 55 rue Buffon,75005 Paris Francee-mail: [email protected]
J. -S. Ay · R. ChakirINRA, AgroParisTech, UMR 210 Economie Publique16 rue Claude Bernard, 75005 Paris France
L. DoyenGREThA, University Bordeaux IV, Avenue Leon Duguit,33600 Pessac France
P. LeadleyUniversity. Paris-Sud Laboratoire ESE UMR 8079CNRS UPS AgroParisTech, 91405 Orsay France
climate change dominate the effects of land use on birdabundances. As a conservation policy, implementing a spa-tially uniform payment for pastures has a positive effect inrelatively few locations and only on the least vulnerable birdspecies.
Keywords Integrated models · Land use · Incentivepolicy · Common birds
1 Introduction
Climate and land use changes are considered to be two of themain drivers of past and future variations in terrestrial bio-diversity (Millennium Ecosystem Assessment 2005; Pereiraet al. 2010; Willis and MacDonald G 2011). For medium-term projections (ca. 40 yrs into the future) these two driverscan be treated very differently in terms of scenarios andpossibilities of intervention for biological conservation pol-icy (de Chazal and Rounsevell 2009; Wintle et al. 2011).Global warming depends on international commitments toreduce greenhouse gas emissions, and much of the climatechange projected over the next four decades is already com-mitted due to long lag times socio-economic drivers andin the Earth system (IPCC 2013). By contrast, Land UseChanges (LUC) are potentially under much greater controlof national and local decision makers concerning impacts onbiodiversity over the next few decades (Schroter et al. 2005;Verburg et al. 2008 but see Radeloff et al. 2012).
However, present and future land uses are influencedby climate change, and this is rarely accounted for whenexploring the interactive effects of climate change andland use on biodiversity (de Chazal and Rounsevell 2009).Local opportunities and constraints appear when climatechanges, leading to adaptation in the use of land resources

Climatic Change
(Jeltsch et al. 2011; Bradley et al. 2012). Moreover, mod-els foresee that future climate change will result northwardshifts of maize area in the United States, or rice area inChina (Tubiello et al. 2002; Xiong et al. 2009). Conse-quently, effective and efficient conservation policy has to bebased on the direct climate effect on species and the indirecteffects induced by human adaptations, strategies and pub-lic policies (Hannah et al. 2002; Berrang-Ford et al. 2011;Johnston et al. 2013). This paper presents an integratedbio-economic framework to explore the interactions amongclimate change, land use and biodiversity. This frameworkis structured in three modeling blocks: Species DistributionModels (SDM) of bird abundances and distributions, econo-metric models of LUC and Ricardian models of returns fromland in response to climate change. This integrated struc-ture is then used to simulate climate change effects on futureland uses and bird distributions from the present to 2053based on climate and economic projections, and an exampleof spatially uniform conservation policy.
Firstly, in the SDM, the abundances of commonbird species are related to local environmental condi-tions (Furness and Greenwood 1993; Gregory et al.2005; Renwick et al. 2012). SDMs assume that habitatand climate requirements can be deduced from currentdistributions, and that future abundance and distributionscan then be extrapolated using projections of future cli-mate and habitat changes (Peterson et al. 2011). SDMfor this study are developed using avian data from theFrench Breeding Bird Survey (FBBS), a standardized mon-itoring scheme in which skilled volunteer ornithologistsidentify breeding birds by song or visual contact everySpring (Jiguet et al. 2012). Observations indicate that birdpopulations are decreasing for pasture habitat specialists(Devictor et al. 2008) and are shifting up in altitude andtowards the north as a result of recent climate warm-ing (Jiguet et al. 2010). Secondly, the econometric LUCmodel fits the private land use decisions as functions ofeconomic returns (Lubowski et al. 2008; Nelson et al. 2008;Radeloff et al. 2012). This model is based on a analysis ofobserved land use data from the TERUTI land use survey(France, 1993–2003). TERUTI data have already been usedfor econometric LUC models but not for the whole Franceat the fine level of spatial resolution used in this study(Chakir and Parent 2009; Chakir and Le Gallo 2013). Theeconometric model is then used in a step-by-step scenarioanalysis to isolate and illustrate the impacts of the indi-vidual drivers of bird species abundance and distribution.Finally, the Ricardian model uses observed co-variations ofland prices and climate to infer the potential future conse-quences of climate change on the economic returns fromland (Mendelsohn et al. 1994; Mendelsohn and Dinar 2009).This approach is developed at the scale of France on thebasis of land prices from the statistical services of French
Ministry of Agriculture and regionalized climate data(Deque 2007; Boe et al. 2009).
This paper addresses three main questions:
(i) What is the effect of climate change on common birdabundances, assuming either constant or economi-cally driven land use changes?
(ii) Does climate-induced land use change mitigate oramplify the direct effects of climate change on com-mon birds abundances?
(iii) What is the effect on LUC and common birdabundances of a uniform conservation payment tolandowners order to promote pastures?
First, our model projects a significant negative impactof climate change on bird abundances by mid-century. Thiseffect is strong relative to the effect of projected LUC.Locally, climate change is projected to result in a greaterelevation shift than northern shift in the distribution of birds.Second, climate-induced LUC is foreseen to amplify thenegative direct effects of climate change on birds. Thisis not the case everywhere, with some locations, particu-larly in southern France that are projected to benefit fromclimate-induced LUC. Third, we find that spatially uni-form payments of 200 euro.ha−1 to promote pastures onlyslightly counteract the negative effects of climate change.We foresee that these relatively high payments will have apositive effect in relatively few locations and only on theleast vulnerable species.
2 Models
2.1 Species Distribution Models
Bird abundance and distributions are modeled with an SDMthat accounts for the potential impact of climate and habi-tat (Pearson and Dawson 2003). For a general descriptionof the method, we note μtqs the abundance of species s inthe FBBS sampling square q at the time t and we assumethe following relationship between the outcome and itspredictors:
log(μqst
) = λs(cqt , hqt , xq, zq
) + δs · t, (1)
where the λs(·), s = 1, . . . , S are spline-basedsmoothing functions with an endogenous structure as iscommon for Generalized Additive Models (GAM, Hastieand Tibshirani 1990; Wood 2006). The smoothing func-tions have to be estimated, as the scalars δs that capturethe linear growth 2003–2009 for each species s (see OnlineResources 1.1 for more details about avian data). cqt standsfor the two principal axes at location q and time t ofa Principal Component Analysis of the climatic variables

Climatic Change
matrix. The Online Resources Figure 1 shows the relation-ships between the climate variables and these 2 principalaxes, which account for 87 % of the total variance. hqt
is the vector of habitat variables including a fragmentationindex, xq represents a vector of topographic variables (alsofrom a PCA of topographic variables reported in OnlineResources Figure 1) while zq is the spatial location of thecenter of gravity of each FBBS square. Including thesespatial coordinates in the smoothed functions allows usto separate the unobserved contextual effects (i.e., inter-species competition, spillovers from anthropogenic pertur-bations) from the direct topographic, climatic and habitateffects. Because bird abundances are over-dispersed posi-tive integers, they are modeled as a distribution from thenegative binomial family. The function gam() from theR package mgcv 1.7 was used to estimate such mod-els (Wood 2006). Because the impacts of climate changeon species distributions have been shown to vary depend-ing on choice of modeling technique (Buisson et al. 2010;Garcia et al. 2012) and of spatial structure (Dormann et al.2007), we have estimated other SDMs based on alternativeassumptions. We also fitted negative binomial mixed mod-els without including geographical coordinates (with the Rpackage glmmADMB, see Online Resources Table 5) andzero-inflated hurdle models with and without geographicalcoordinates (with the package pscl, see Online ResourcesTable 6). From the time dimension, Online ResourcesFigure 10 presents the predictions from 3 scenarios rely-ing on 4 different SDMs. From the space dimension, the 15Pearson correlation coefficients between the projections arecomprise between 0.50 and 0.98, with more than the halfgreater than 0.8 (Online Resources Figure 11). Includinggeographical coordinates increases the goodness-of-fit buthas a relative limited impact on abundance variations withinscenarios, we focus only on the results from the negativebinomial GAMs here for the sake of clarity.
2.2 Econometric model of Land Use Changes
We have reduced land use types to five (L = 5) mutuallyexclusive categories: annual crops, perennial crops, pas-tures, forests and urban areas (see Online Resources 1.2).Landowners are assumed to choose LUC in order to max-imize their utility1 and these choices are assumed to beindependent for each parcel. With this latter simplifyingassumption, each parcel is associated with a distinct deci-sion process. In particular, a stylized landowner i chooses
1 Rationality is not a necessary condition, as Train 2009 (Chap. 2, p.14)explains: “The derivation assures that the model is consistent with util-ity maximization; it does not preclude the model from being consistentwith other forms of behavior. The models can also be seen as simplydescribing the relation of explanatory variables to the outcome of achoice, without reference to exactly how the choice is made.”
the land use type �∗it on a parcel if this provides the highestutility over all possible uses:
�∗it = arg max�
{ui�t
}. (2)
This formulation for utility is forward-looking andaccounts for the possibility of multi-year land use such asperennial crops, forest or urban. Utility is typically assumedto be the expected one-period net returns that are the out-come of a dynamic optimization problem (Plantinga 1996;Lubowski et al. 2008). We exploit this result here by assum-ing a parametric but nevertheless flexible structure betweenthe expected returns and utility. At t , for each land use(∀� = 1, . . . , L) and for each sampled plot (∀i = 1, . . . , I ),we assume:
ui�t = α� + ritβ1� + citβ2� + xiβ3� + rit (cit + xi)β4� (3)
+hit−1η� + εi�t .
Where rit is the vector of net returns in t for each ofthe possible land uses on parcel i. These rent variablesare only available at the scale of the Small AgriculturalRegion (SAR, see Online Resources Table 4 for a synthe-sis of the spatial units used to match the data). As such,they are crossed with climate cit and constant biophysi-cal variables xi (elevation, slope and land quality) to allowparcel-level deviations from the aggregate effects. Conver-sion costs between uses are taken into account by includingL − 1 dummy variables representing the previous land useof a parcel i: hit−1. So, the vector η� estimates the costs tochange to land use �. Each vector of coefficients to estimate[α�; β·�; η�] is unique for each land use category �. Thismeans that expected economic returns, climate, biophysi-cal variables and conversion costs could have heterogeneouseffects on the utility, depending on the land use.
Because all the sources of landowner’s utility cannot beobserved, an error term εi�t is included in (4). McFadden(1974) identifies three criteria for using a multinomial logitmodel: independence, homoscedasticity and extreme valuedistribution (i.e., Gumbel). Assuming these criteria are met,one can show that the probabilities have simple closedforms, which correspond to the logit transformation of thedeterministic part of the utility function (ui�t ≡ ui�t − εi�t ).The probability that a parcel i is in use � at the period t is:
pi�t = exp(ui�t )∑k exp(uikt )
= f�(rit , cit , xi, hit−1
). (4)
The estimation was performed using nnet 7.3 on R.The unobserved factors are assumed to be uncorrelated overalternatives and periods, as well as having a constant vari-ance. These assumptions, used to provide a convenient formfor the choice probability, were found to be not restrictive(homoscedasticity cannot be rejected by a score test, p-value= 0.283). Moreover, these hypotheses are associatedwith the classical restriction of Independence of Irrelevant

Climatic Change
Alternatives (IIA) for which Hausman-McFadden speci-fication tests are performed, with mixed evidence. Theindependence is not rejected for three uses: pasture, peren-nial crop and urban (p-values are respectively 0.001, 0.005and 0.036) but rejected for annual crop and forest at 5 %. Inthe land use econometric literature, use of nested multino-mial logit is found not to change the results (Lubowski et al.2008).
2.3 Models of economic returns
In the Ricardian model, the price of land is used to computethe expected net returns from land uses. Land is consideredas a classical fixed asset, implying that its price v�t at time tfor the use � is equal to the net present value of all expectedfuture rents for land use �. Assuming flat interest ratesτt = τ and flat rates of capital gains gt = g, this reads asfollows:
v�t =∞∑
s=1
Et (r�t+1)(1 + g)s
(1 + τ)s= Et (r�t+1)
(τ − g). (5)
Et is the expectation operator at t . Thus, the expectedreturn of a land plot on the basis of its observed price,r�t = (τ − g) · v�t , can be calculated knowing the interestrate and the rate of capital gains (τ−g). This result dependson the assumption of well-functioning markets (i.e., com-petitive and balanced) and so has to be considered as atheoretically-consistent first approximation.
We use a Ricardian equation to model the effect of cli-mate change on land prices v�t or, equivalently, on theexpected net returns r�t of annual crop, pasture, perennialcrop and forest. The Ricardian equation relates the eco-nomic returns of land to climate, other biophysical variablesand geographical coordinates as follows:
log(ri�t ) = y�(cit , xi, zi
) + γ� · t. (6)
y�(·) is a spline-based smooth function with endoge-nous structure which depends on the type of land use�. Thus, these functions and the γ� are estimated on thecross-sectional variations between SAR and the time series1993–2003 (see Online Resources 1 for more details). TheRicardian equations are estimated separately for annualcrop, pasture, perennial crop and forest using GAM with adistribution from the Gaussian family and a natural loga-rithm link. For the dynamics of the urban returns, we use thespatialized projections of population growth by the Frenchdemographic institute. Because these projections are avail-able at the departement scale (departements are a Frenchadministrative division that range in size from ca. 600 to10,550 km2, see Online Resources Table 4), we have down-scaled them by assuming that each municipality keeps aconstant proportion of the aggregate values.
2.4 Scenarios of the interactions between land use, climateand biodiversity
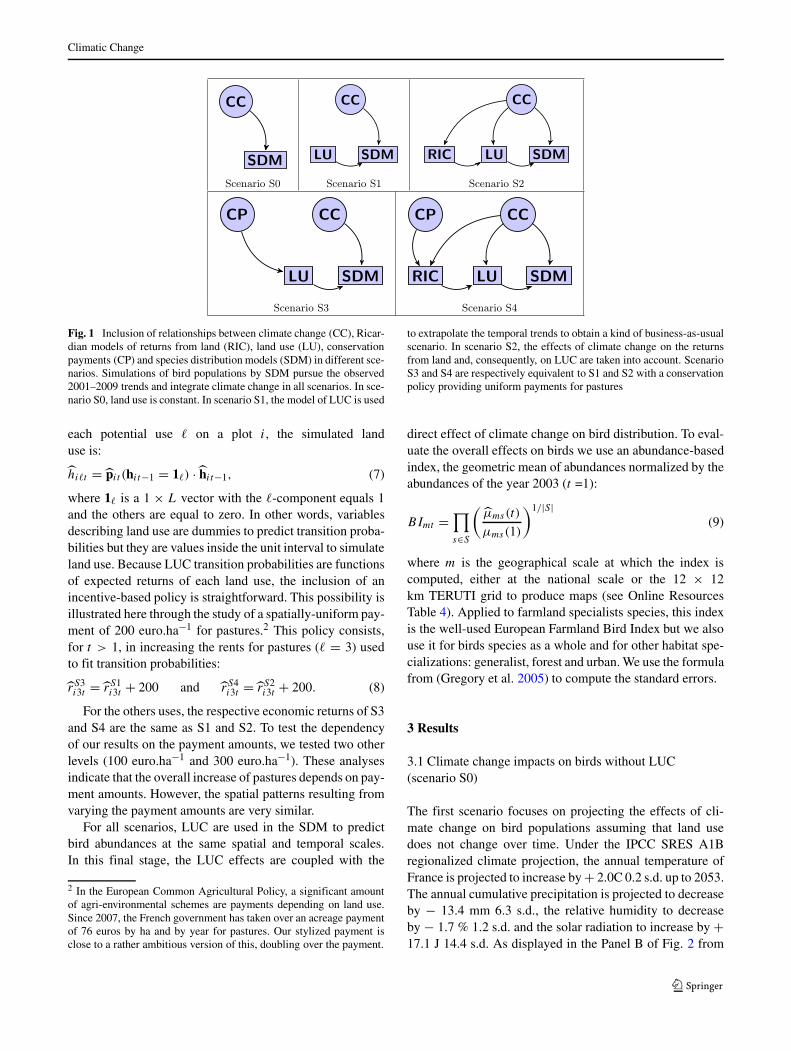
We explore several scenarios that differ in the dynam-ics of the deterministic part of landowners’ utilities of(4). The estimated logit regression function f� and thebiophysical variables xi are assumed to stay constant intime and are identical in all scenarios. But, dependingon the scenario, the economic returns rit and/or the cli-mate variables cit are allowed to change. We considerfive scenarios that are presented in Fig. 1. The scenar-ios contain two to five of the following components: cli-mate change (CC), species distribution models (SDM),land use (LU), Ricardian model of returns (RIC) andconservation payments (CP). The objective of this step-by-step analysis is to isolate and illustrate the impactsof the individual drivers of bird species abundance anddistribution.
The scenarios were carried out as follows. Once the LUCmodel is estimated based on past land use (hit−1), environ-mental and economic variables (cit , xi , and rit ), the directpredictions consist, for each parcel of land i, in a fitted prob-ability vector pit of being in each land use at t . Becausethe model is estimated on LUC 1993–2003, we consider1993 as the period t = 0 and 2003 as the period t = 1:our model is recursive with decennial steps. Since eachTERUTI parcel represents 100 ha, the predicted probabili-ties can be converted into spatially-explicit projected LUC.As an example, consider a parcel i which counts for 100 haof annual crop in period 0 and has a predicted probabilityvector for period 1 of pi1 = (0.8, 0.15, 0.03, 0.01, 0.01).This means that 80 ha are predicted to not change their use,15 ha to be converted to pasture, 3 ha to perennial crop, 1ha to forest and 1 ha to urban. Land use at t = 1 (2003)is common to all scenarios and, for S0, it is the same att = 2 (2013), t = 3 (2023), t = 4 (2033), t = 5 (2043)and t = 6 (2053).
For the other scenarios, LUC simulation for t =2 is performed by substituting the dynamics of certainexogenous variables in regression equations. For S1, onlyt is implemented in the Ricardian equation (6) to obtainthe economic returns rS1
i2 that are then used in the logisticequations (4). For S2, climate variables cit are imple-mented in the Ricardian equations (6) and in the logisticequations (4). For both scenarios, we predict a probabilitymatrix of land use in t = 2 conditionally on previousland use: hi2 = pi2(hi1). Calculations for the first timestep in the simulation are facilitated by the knowledgeof the previous use for each surveyed parcels in the2003 TERUTI survey: hi1. After t = 2, simulation ofLUC changes: instead of a single previous use for eachplot, there is a vector of probabilities: hi2. For t > 2,LUC is therefore computed in a different manner. For
Climatic Change
Fig. 1 Inclusion of relationships between climate change (CC), Ricar-dian models of returns from land (RIC), land use (LU), conservationpayments (CP) and species distribution models (SDM) in different sce-narios. Simulations of bird populations by SDM pursue the observed2001–2009 trends and integrate climate change in all scenarios. In sce-nario S0, land use is constant. In scenario S1, the model of LUC is used
to extrapolate the temporal trends to obtain a kind of business-as-usualscenario. In scenario S2, the effects of climate change on the returnsfrom land and, consequently, on LUC are taken into account. ScenarioS3 and S4 are respectively equivalent to S1 and S2 with a conservationpolicy providing uniform payments for pastures
each potential use � on a plot i, the simulated landuse is:
hi�t = pit (hit−1 = 1�) · hit−1, (7)
where 1� is a 1 × L vector with the �-component equals 1and the others are equal to zero. In other words, variablesdescribing land use are dummies to predict transition proba-bilities but they are values inside the unit interval to simulateland use. Because LUC transition probabilities are functionsof expected returns of each land use, the inclusion of anincentive-based policy is straightforward. This possibility isillustrated here through the study of a spatially-uniform pay-ment of 200 euro.ha−1 for pastures.2 This policy consists,for t > 1, in increasing the rents for pastures (� = 3) usedto fit transition probabilities:
rS3i3t = rS1
i3t + 200 and rS4i3t = rS2
i3t + 200. (8)
For the others uses, the respective economic returns of S3and S4 are the same as S1 and S2. To test the dependencyof our results on the payment amounts, we tested two otherlevels (100 euro.ha−1 and 300 euro.ha−1). These analysesindicate that the overall increase of pastures depends on pay-ment amounts. However, the spatial patterns resulting fromvarying the payment amounts are very similar.
For all scenarios, LUC are used in the SDM to predictbird abundances at the same spatial and temporal scales.In this final stage, the LUC effects are coupled with the
2 In the European Common Agricultural Policy, a significant amountof agri-environmental schemes are payments depending on land use.Since 2007, the French government has taken over an acreage paymentof 76 euros by ha and by year for pastures. Our stylized payment isclose to a rather ambitious version of this, doubling over the payment.
direct effect of climate change on bird distribution. To eval-uate the overall effects on birds we use an abundance-basedindex, the geometric mean of abundances normalized by theabundances of the year 2003 (t =1):
BImt =∏
s∈S
(μms(t)
μms(1)
)1/|S|(9)
where m is the geographical scale at which the index iscomputed, either at the national scale or the 12 × 12km TERUTI grid to produce maps (see Online ResourcesTable 4). Applied to farmland specialists species, this indexis the well-used European Farmland Bird Index but we alsouse it for birds species as a whole and for other habitat spe-cializations: generalist, forest and urban. We use the formulafrom (Gregory et al. 2005) to compute the standard errors.
3 Results
3.1 Climate change impacts on birds without LUC(scenario S0)
The first scenario focuses on projecting the effects of cli-mate change on bird populations assuming that land usedoes not change over time. Under the IPCC SRES A1Bregionalized climate projection, the annual temperature ofFrance is projected to increase by + 2.0C 0.2 s.d. up to 2053.The annual cumulative precipitation is projected to decreaseby − 13.4 mm 6.3 s.d., the relative humidity to decreaseby − 1.7 % 1.2 s.d. and the solar radiation to increase by +17.1 J 14.4 s.d. As displayed in the Panel B of Fig. 2 from

Climatic Change
a national viewpoint, the effect of climate change on theaggregate bird index is first positive (+ 5 % up to 2023), notsignificant for 2033–2043 and strongly negative from 2043onward (− 10 % at 2053).
The spatial precision of the projected climate (8 × 8 km)allows us to model more precisely than usual the geograph-ical shifts in bird distributions. As shown by the panel Aof Fig. 2, the Mediterranean coast at the southeast and thecenter of the southwest are two regions of important declinein bird populations. Detrimental effects, albeit less strong,
appear in the northwest of France. In contrast, bird popu-lations in the continental part of the country – the east andcenter – have positive growth rates (up to + 40 %). Thesedynamics of bird populations are best explained by aver-age 2003 temperatures and average elevation (respectivePearson’s correlations of − 0.51 and + 0.42, bothp-values <0.001).
In this scenario, land use is constant but plays an impor-tant role in determining the dynamics of bird populations.The Online Resources Figure 2 shows that the direct effect
Fig. 2 The effects of climateand land use changes on theindex of bird abundances for thescenarios without conservation:S0, S1 and S2
A
0.6
0.7
0.8
0.9
1.0
1.1
1.2
1.3
1.4
B
NAT
ION
AL
BIR
D A
BU
ND
AN
CE
IND
EX
C
0.6
0.7
0.8
0.9
1.0
1.1
1.2
1.3
1.4
DN
ATIO
NA
L B
IRD
AB
UN
DA
NC
E IN
DE
X
E
0.6
0.8
1.0
1.2
1.4
2010 2020 2030 2040 2050
2010 2020 2030 2040 2050
2010 2020 2030 2040 2050
0.85
0.90
0.95
1.00
1.05
1.10
1.15
0.85
0.90
0.95
1.00
1.05
1.10
1.15
0.85
0.90
0.95
1.00
1.05
1.10
1.15
F
NAT
ION
AL
BIR
D A
BU
ND
AN
CE
IND
EX

Climatic Change
of climate on bird species depends on their land use pref-erence. Climate change for the last period of analysis,2053, has a significant negative impact on generalist species(about − 10 index points), forest specialists (about − 30index points) and urban specialists (about − 2.5 indexpoints). By contrast, the model predicts that the abundancesof farmland specialists increase by about + 10 % over thisperiod. The mechanisms driving this effect are that climate-induced shifts in bird species distributions are toward areasof more favorable land uses for farmland specialists. Pas-tures are generally at higher elevation than annual cropsand climate change drives bird distributions towards thesehigher elevations. The Online Resources Figure 3 providesthe individual rates of variation for each bird species abun-dances 2003–2053. Climate change significantly affectsthe large majority of species (the variations of only 2species are not significant while 21 species increase and 39decrease).
3.2 Climate change impacts on birds with extrapolatedtrends of LUC (scenario S1)
The first scenario including LUC was simulated by extrap-olating the 1993–2003 trends of economic returns to futureLUC. This scenario accounts for climate change impacts onbirds as in S0, but not on land use. Panel (a) of Table 1presents the national land allocation 2003–2053 with decen-nial steps for this scenario. This simulation projects anextension of recent trends: an increase of annual crop, for-est and urban area (respectively + 3.17 %, + 9.11 % and +33.4 %) and a decrease in pasture and perennial crop area(both of − 17.7 %). The urbanization of land is the largesttrend in relative terms. The dynamics of annual crops isless monotone with a small loss for 2003–2013, an increasein the period 2013–2033 and stagnation between 2033–2053.
The effect of LUC on birds in the scenario S1 is globallyneutral: the differences with S0 are small and not significant(see Panel D of Fig. 2). In S1, the aggregate bird populationindex is influenced almost exclusively by climate change.Spatially, the general pattern of S0 is maintained but thereis some mitigation of impacts in certain parts of the southof France and an amplification at the northwest (see PanelC of Fig. 2). To disentangle the effects of S1 LUC fromthe climate effects, the Online Resources Figures 4 and 5present the net effects of S1 LUC with constant climate. Itappears that S1 LUC effects are much smoother and morehomogeneous between species with the same habitat prefer-ences (compared to the effects plotted in Online ResourcesFigure 2). They are positive and significant for urban spe-cialists and generalists, not significant for forest specialistsand negative and significant for farmland specialists. Fromindividual species point of view, populations significantly
grow for 15 species as a result of S1 LUC, 10 decreasesignificantly and 37 do not exhibit significant change.
3.3 Climate change impacts on birds with climate-inducedLUC (scenario S2)
The integration of the effects of climate on the returns ofland by the Ricardian models is presented in Table 2. Upto 2053, the returns are predicted to increase for annualcrops (md.= + 117 %), pastures (md.= + 74 %) andperennial crops (md.= + 13 %). The median increaseof the density of population is + 28 % but the medianrate of variation for returns from forest is negative: −13 %. Climate change is also found to flatten the dis-tribution of returns (i.e., it increases standard errors) interms of economic returns for annual crops, pastures andurban.
Panel (c) of Table 1 presents the consequences of thesevariations of economic returns on LUC. Except for peren-nial crops, climate-induced LUC are in the same directionscompared to the scenario S1: annual crops, forests andurban increase and pastures decrease. The effect of climatechange on perennial crops is strong (+ 177 %) and is mainlyexplained by the high growth rate at the top of the distri-bution of returns. As a consequence, this growth regardsonly a few locations already specialized in perennial crops(southeast in particular). The important decrease of pastures(−55 %) is mainly explained by the expansion of annualcrops and urban areas. The growth rate of urbanization in S2is twice the rate of S1 although the same scenario in terms ofdemographic growth was used. This indicates an increase oflow-density exurban housing which was already been shownto be an important threat to breeding birds (Jongsomjit et al.2013).
The Panel (f) of Fig. 2 shows that climate-induced LUCamplifies the negative effect of climate change on the aggre-gate bird index. With climate-induced LUC, the nationalbird index shows a decrease of 14 % of abundances in 2053,compared to 10 % in the case of constant land use S0.Panel E of Fig. 2 indicates a strong spatial redistributionof the loss in terms of abundances. An important part ofthe most detrimental effects of climate change in the south-east are mitigated by climate-induced LUC. In contrast, anamplification of the effect of climate change appears in thenortheast. Climate change induces a northern shift of annualcrops and an increase of urban areas and perennial crops inthe south which explain these results.
The effects of S2 LUC on bird species grouped byhabitat preference and for each species separately areshown in Online Resources Figures 6 and 7, for bird speciesgrouped by habitat preference and for each species sepa-rately. In this scenario, only urban specialists benefit fromclimate-induced LUC: + 10.5 %. Other groups undergo a

Climatic Change
Tabl
e1
Nat
iona
lac
reag
esof
land
uses
inth
ousa
ndkm
2an
das
soci
ated
grow
thra
tes
for
scen
ario
sS1
,S2,
S3an
dS4
AN
CR
area
sfo
ran
nual
crop
s,FO
RE
for
fore
sts,
PEC
Rfo
rpe
renn
ial
crop
s,PA
STfo
rpa
stur
esan
dU
RB
Afo
rur
ban.
The
two
last
row
s,na
med
�(%
),pr
esen
tthe
grow
thra
tes
2003
–205
3
Ext
rapo
lati
ngcu
rren
ttre
nds
ofla
ndus
ech
ange
s
(a)
S1:W
itho
utco
nser
vati
on(b
)S3
:Wit
hco
nser
vati
on
YE
AR
PEC
RA
NC
RPA
STFO
RE
UR
BA
PEC
RA
NC
RPA
STFO
RE
UR
BA
2003
141.
31,
573.
51,
529.
81,
580.
431
5.7
141.
31,
573.
51,
529.
81,
580.
431
5.7
2013
135.
11,
571.
71,
472.
61,
610.
135
1.3
130.
31,
397.
21,
718.
21,
561.
333
3.8
2023
128.
21,
606.
61,
390.
01,
643.
937
1.9
119.
91,
334.
11,
789.
11,
555.
334
2.4
2033
123.
21,
621.
51,
332.
41,
673.
638
9.9
112.
41,
292.
81,
832.
71,
551.
235
1.6
2043
119.
31,
625.
41,
290.
21,
700.
140
5.6
106.
81,
265.
31,
859.
51,
548.
236
1.0
2053
116.
21,
623.
01,
258.
11,
724.
241
9.3
102.
61,
246.
41,
875.
71,
546.
037
0.1
�(%
)−
17.7
+3.
17−
17.7
+9.
11+
33.4
−27
.6−
20.7
9+
22.6
−2.
15+
17.5
Cli
mat
e-in
duce
dla
ndus
ech
ange
s
(c)
S2:W
itho
utco
nser
vati
on(d
)S4
:Wit
hco
nser
vati
on
YE
AR
PEC
RA
NC
RPA
STFO
RE
UR
BA
PEC
RA
NC
RPA
STFO
RE
UR
BA
2003
141.
31,
573.
51,
529.
81,
580.
431
5.7
141.
31,
573.
51,
529.
81,
580.
431
5.7
2013
185.
81,
687.
01,
327.
51,
593.
634
6.9
184.
11,
611.
61,
436.
01,
573.
832
5.2
2023
181.
41,
833.
41,
146.
01,
614.
036
5.9
176.
21,
579.
81,
519.
71,
541.
633
3.4
2033
198.
51,
935.
697
3.9
1,63
0.8
401.
818
3.2
1,63
5.8
1,47
7.2
1,51
4.8
339.
7
2043
217.
42,
096.
675
4.8
1,62
5.9
446.
119
3.7
1,83
6.2
1,27
8.5
1,48
6.4
345.
9
2053
306.
62,
038.
668
0.8
1,60
7.5
507.
325
9.7
1,82
7.1
1,23
3.5
1,43
1.3
389.
1
�(%
)+
177
+27
.15
−55
.5+
1.71
+60
.1+
83.7
+16
.15
−19
.36
−9.
43+
23.5

Climatic Change
Table 2 The Ricardian effects of climate change on the economic returns from land: amounts in current euros and in variations The mean valuesof returns are in current euros/ha for the first 4 rows and hab/km2 for the last. SE is for standard errors, variations are expressed in (%). ANCRcounts for annual crops, FORE for forests, PECR for perennial crops, PAST for pastures and URBA for urban
2003 2053 Variations 2003–2053
Land Use Mean SE Mean SE Min Q1 Q2 Q3 Max
ANCR 265.4 92.27 587.7 346.2 − 100.0 + 72.05 + 116.8 + 159.4 + 323.5
PAST 113.9 73.35 191.7 103.8 − 24.10 + 52.62 + 73.81 + 98.21 + 341.7
PECR 177.3 730.1 185.6 699.4 − 75.18 + 4.474 + 13.35 + 19.01 + 196.0
FORE 80.90 60.07 69.92 53.31 − 44.76 − 16.25 − 13.18 − 8.742 + 45.36
URBA 81.98 291.8 103.0 386.8 − 29.10 + 13.99 + 28.31 + 46.81 + 109.4
significant decrease in abundance for 2053: respectively −5 %, − 7.5 % and − 8.5 % for generalist, farmland and for-est specialists. The effects of S2 LUC, not including directclimate impacts on birds, are negative and significant for41 species and positive for only 12 species. The latter areall urban specialists except the Eurasian skylark (Alaudaarvensis) that is a farmland specialist.
3.4 Climate change impacts on birds and land usewith payments for pastures (scenarios S3 and S4)
An annual, spatially-uniform, payment of 200 euro.ha−1
was coupled with scenario S1 to produce S3 (see Fig. 1).In this scenario, the payments for pasture are sufficient toreverse the predicted decline of pasture over the next fewdecades, see the Panel (b) of Table 1. This payment resultsin a projected net increase of + 22.6 % of pasture areain the period 2003–2053. Urbanization still occurs but ina more moderate way relative to S1 (+ 17.5 %). Pasturesinduced by such a policy (new pastures but also pasturesthat are not converted) replace principally annual and peren-nial crops in the scenario S1. This scenario projects adecrease forest share, but the loss is small, − 2.15 %. Thespatial distribution of these payment-induced pastures arepresented in the panel A of Fig. 3. Areas of annual cropspecialization (around Paris at the northern center) and offorest specialization (extremes southwest and southeast) arenot heavily affected by the policy which are well spreadover locations.
However, when climate change impacts on LUC areaccounted for (i.e., when pasture payments are included inS2 to obtain S4), the payments for pasture do no longerentail a net increase in pastures, see the Panel (d) of Table 1.Nevertheless, the predicted loss is highly restricted rela-tively to S2, and the 2053 area of pastures with conservationpolicy (S4) is nearly than twice that without conservation(S2). The payments for pasture in this scenario are stillaccompanied by an increase of annual crops because, asnoted above, crops returns increase both by the extrapola-tion of trends and the benefit from climate change by the
Ricardian effect. Payments for pastures lower the rate ofincrease in urbanization3 even though this land conversionremains high (+ 23.5 %). This scenario S4 leads to the high-est loss of forest area (− 9.4 %) due to decreasing returnsof forests induced by climate change and competition withpastures arising from payments.
For both policy scenarios S3 and S4, the payments forpasture are projected to significantly increase the nationalbird population index but are not sufficient to counter-act the negative effects of climate change (Panels B andD of Fig. 4). The national trend in bird abundances isalways primarily shaped by climate change (i.e., first asmall increase then a bigger decrease) even when effects ofpayments for pastures are statistically significant. For S3,the negative effects of climate are delayed to 2045 insteadof occurring by 2030 for S1. For S4, the policy of pay-ments for pastures results in 2053 bird abundances closeto S0 (about − 10 %), indicating that it partially coun-teracts the negative effects of climate-induced LUC. It isalso interesting that the effects of the 200 euros.ha−1 pay-ment on the differences between S3 and S1 and betweenS4 and S2 are relatively similar: about + 2.5 points of thenational bird index.
Online Resources Figures 8 and 9 present the neteffects of both scenarios with payments for pastures atthe level of bird species. For S3, the effects of pay-ments are generally positive. They involve detrimentaleffects only for 10 species across all habitat prefer-ences. The biggest improvements due to conservationregard farmland specialists: Whinchat (Saxicola rubetra),Hoopoe (Upupa epops), European Stonechat (Saxicolarubicola) and Red-backed Shrike (Lanius collurio). For S4,
3The high proportions of change (− 1/2 both for S3 and S4 relativelyto S1 and S2) are somewhat surprising but have to be put in perspectivein terms of acreages. They represent respectively 50,000 and 110,000ha where the differences for pastures are around 550,000 ha betweenscenarios. The differences in urban areas are nevertheless sufficientlymarked to highlight a competition for space between urban and pas-tures, and between urban and conservation. The low opportunity costof pasture is probably the reason for this result.

Climatic Change
Fig. 3 The net effects of thepayments for pastures of 200euros/ha on pastures inscenarios S3 and S4, relative toS1 and S2 respectively
New pasture acreages from S3 compared to S1, in points of pc
0.5
1.0
1.5
2.0
2.5
3.0
3.5
4.0
4.5
New pasture acreages from S4 compared to S2, in points of pc
0.0
0.5
1.0
1.5
2.0
2.5
3.0
3.5
4.0
4.5
A B
conservation negatively affects 20 species from all habi-tat preferences. But strong positive effects are found forcertain species, in particular species that are strongly declin-ing in S2 (see of the bottom of the Online ResourcesFigure 9). This mitigation effect from habitat-based conser-vation is insufficient to counteract the patterns induced byclimate change.
4 Discussion and conclusion
This study compares 5 different model-based scenarios ofland use and climate impacts on an index of bird abundancefor France over the period 2013–2053, driven by a down-scaled IPCC A1B climate projection. The scenarios differin the way they account for land use impacts and in the role
Fig. 4 The effects of climate,land use changes andconservation policy on the indexof birds abundances forscenarios S3 and S4
Spatial distribution of bird index 2003−2053, scenario S3
0.6
0.7
0.8
0.9
1.0
1.1
1.2
1.3
1.4
2010 2020 2030 2040 2050
0.85
0.90
0.95
1.00
1.05
1.10
National trend of bird index, scenarios S3 and S1
NA
TIO
NA
L B
IRD
AB
UN
DA
NC
E IN
DE
X
1.15
2010 2020 2030 2040 2050
0.85
0.90
0.95
1.00
1.05
1.10
1.15
Only Climate (S0)Land use as usual without conservation (S1)Land use as usual with conservation (S3)
Spatial distribution of bird index 2003−2053, scenario S4
0.6
0.8
1.0
1.2
1.4
National trend of bird index, scenarios S4 and S2
NA
TIO
NA
L B
IRD
AB
UN
DA
NC
E IN
DE
X
Only Climate (S0)Climate + Climate−induced land use (S2)S2 with conservation (S4)
A B
C D

Climatic Change
played by economic returns, public policies, and climate onLUC.
A first result of our scenario analysis is that thebird community dynamics are projected to be more heav-ily impacted by climate change than by LUC in France.This contradicts global studies suggesting that land use willdominate biodiversity dynamics over the next few decadesas compared to climate change (Pereira et al. 2010) but inaccordance with other recent local scale evidence (Martinet al. 2013). There are several possible explanations for this.Firstly, the SDMs predict that bird species are generallymore sensitive to climate variables than habitat or topo-graphic variables. Second, the projected land use changesfor France over the next four decades are relatively mod-est, while projected climate change is relatively large in theclimate scenario that we used. However, the robustness ofthese results need to be further evaluated for several rea-sons. In this study, we used bird abundance data only fromFrance meaning that some climatic and habitat niches ofbirds are truncated, potentially leading to an overestima-tion of the risk of local decline or extinction (Barbet-Massinet al. 2010). In this respect, the refinement and reinforce-ment of models by expanding the dataset, in particular theextension to the European scale, could be valuable (Barbet-Massin et al. 2011). Moreover, using common birdsabundance as a proxy for biodiversity has important lim-its (Renwick et al. 2012) but birds are a highly sensitiveindicator of climate change and habitat due to their rapidpopulation and range responses to both drivers (Jiguet et al.2010; Renwick et al. 2012).
A second contribution of the paper is to provide aneconometric model of LUC and to account for the economiceffects of returns from land and market-based policies onprivate decisions (Lewis et al. 2011). In particular, changingthe monetary returns from land is projected to be suffi-cient to induce significant differences in terms of LUC.Although the LUC models in this paper provide impor-tant insights into the factors mediating future land use, theycould be improved in several ways. One possible improve-ment is to explicitly take into account spatial autocorrelationof the outcome variables (Chakir and Parent 2009; Chakirand Le Gallo 2013). Another improvement relates to thelegitimate concern that the correlations underlying the rela-tionships in the econometric equations may change overthe long-run, and that this problem may be even moreacute for the Ricardian equation. The robustness of ourresults in terms of climate change impacts also need tobe further evaluated because we have used a single cli-mate projection. We have used a climate change scenariowith a mean annual temperature increase that is close tothe multi-model IPCC AR4 projections for A1B emissionsscenarios; however, the scenario we used is one of the dri-est AR4 climate projection for France (Cheaib et al. 2012).
However, accounting for broader range of projected cli-mate changes would substantially increase uncertainty inprojections of bird population change and LUC comparedto those explored here (Katz et al. 2013). In addition, cli-mate impacts are highly dependent on the spatial scaleof climate projections, especially in mountainous areas(Franklin et al. 2013).
Thirdly, our results also suggest that there are largespecies-specific differences in the response of birds to cli-mate change (Jiguet et al. 2010). For conservation policies,this stresses the complex, coupled responses of biodiversityand land use to climate change and policies affecting LUC(Bradley et al. 2012; Johnston et al. 2013). By contrast,the conservation policies must remain simple for the sakeof clarity with respect to stakeholders, especially landown-ers, and for avoiding prohibitive implementation andmonitoring costs (Wintle et al. 2011). The incentive-basedpolicies with a fixed-amount payment for pasture at thenational scale is a first step towards such a balance in thevein of Lewis et al. (2011) and Mouysset et al. (2011).Moreover, we found that such payments can help counter-act the impacts of land-use change, but fully counteractingthe negative effects of climate change on bird popula-tions would require additional measures. The use of opti-mal or viable (Mouysset et al. 2014) levels of incentivesappear to make it possible to improve this trade-off andmore generally the ecological-economic outcomes. In addi-tion to the national incentive-based policy considered here,at least two main alternative policies could be examined.A first option would consist in spatializing the conser-vation policy by applying payments to landowners basedon the location of their parcels or to the density ofvulnerable species (current or future). A second optioninspired by a the well used command-and-control regula-tion relies on the use of quota or constraint in terms ofland use that implies external, regular controls on LUCat farm scale. Exploring and implementing these optionswould require more economical and ecological informa-tions than the conservation policy proposed here, rein-forcing the interest in further development of prospec-tive tools like the models and scenarios described inthis paper.
Acknowledgements This research has been founded by the FRB(Fondation de Recherche sur la Biodiversit) and GDF–SUEZ throughthe MOBILIS project. R. Chakir also acknowledges the financialsupport from French Agence Nationale de la Recherche through theModULand project (ANR–11–BSH1–005). The authors also acknowl-edge volunteer ornithologists, French Ministry of Agriculture (Servicede la Statistique et de la Prospective), IGN, INRA InfoSol, and MtoFrance for the production of data that allow such work. We are grate-ful to Laurent Terray, Christian Page and Julian Boe for the regionalclimate scenarios, Vincent Badeau for the development of the 8km soildata set and Christophe Francois for his assistance in the use of climateand soils data sets.

Climatic Change
References
Barbet-Massin M, Thuiller W, Jiguet F (2010) How much do we over-estimate future local extinction rates when restricting the range ofoccurrence data in climate suitability models? Ecography 33:878–886
Barbet-Massin M, Thuiller W, Jiguet F (2011) The fate of Europeanbreeding birds under climate, land-use and dispersal scenarios.Glob Chang Biol 18
Berrang-Ford L, Ford JD, Paterson J (2011) Are we adapting to climatechange? Glob Environ Chang 21:25–33
Boe J, Terray L, Martin E, Habets F (2009) Projected changes in com-ponents of the hydrological cycle in French river basins during the21st century. Water Resour Res 45:W08426
Bradley BA, Estes LD, Hole DG, Holness S, Oppenheimer M, TurnerWR, Beukes H, Schulze RE, Tadross MA, Wilcove DS (2012)Predicting how adaptation to climate change could affect eco-logical conservation: Secondary impacts of shifting agriculturalsuitability. Divers Distrib 18:425–437
Buisson L, Thuiller W, Casajus N, Lek S, Grenouillet G (2010) Uncer-tainty in ensemble forecasting of species distribution. Glob ChangBiol 16:1145–1157
Chakir R, Le Gallo J (2013) Predicting land use allocation in France:A spatial panel data analysis. Ecol Econ 92:114–125
Chakir R, Parent O (2009) Determinants of land use changes:A spatial multinomial probit approach. Pap Reg Sci 88:327–344
Cheaib A, Badeau V, Boe J, Chuine I, Delire C, Dufrene E, FrancoisC, Gritti ES, Legay M, Page C, Thuiller W, Viovy N, Leadley P(2012) Climate change impacts on tree ranges: Model intercom-parison facilitates understanding and quantification of uncertainty.Ecol Lett 15:533–544
de Chazal J, Rounsevell MD (2009) Land-use and climate changewithin assessments of biodiversity change: A review. Glob Envi-ron Chang 19:306–315
Deque M (2007) Frequency of precipitation and temperature extremesover France in an anthropogenic scenario: Model results and statis-tical correction according to observed values. Glob Planet Chang57:16–26
Devictor V, Julliard R, Clavel J, Jiguet F, Lee A, Couvet D (2008)Functional biotic homogenization of bird communities in dis-turbed landscapes. Glob Ecol Biogeogr 17:252–261
Dormann C., McPherson JM, Araujo MB, Bivand R, Bolliger J,Carl G, Davies RG, Hirzel A, Jetz W, Daniel Kissling W,et al. (2007) Methods to account for spatial autocorrelation inthe analysis of species distributional data: A review. Ecography30:609–628
Franklin J, Davis FW, Ikegami M, Syphard AD, Flint LE, Flint AL,Hannah L (2013) Modeling plant species distributions under futureclimates: How fine scale do climate projections need to be? Globalchange biol 19:473–483
Furness RW, Greenwood JJD (1993) Birds as Monitors of Environ-mental Change. Chapman Hall, London
Garcia RA, Burgess ND, Cabeza M, Rahbek C, Araujo MB (2012)Exploring consensus in 21st century projections of climati-cally suitable areas for african vertebrates. Global Change Biol18:1253–1269
Gregory RD, van Strien A, Vorisek P, Meyling AWG, Noble DG,Foppen RPB, DW Gibbons (2005) Developing indicators for euro-pean birds. Phylosophical Transactions of the Royal Society B360:269–288
Hannah L, Midgley GF, Millar D (2002) Climate change-integratedconservation strategies. Glob Ecol Biogeogr 11:485–495
Hastie T, Tibshirani R (1990) Generalized additive models. Chapmanand Hall, New York
IPCC (2013) Climate Change 2013: The Physical Science Basis. FifthAssessment Report. Cambridge, United Kingdom and. CambridgeUniversity Press, New York, NY, USA
Jeltsch F, Moloney KA, Schwager M, Korner K, Blaum N (2011)Consequences of correlations between habitat modifications andnegative impact of climate change for regional species survival.Agriculture, Ecosystems and Environment 145:49–58
Jiguet F, Devictor V, Julliard R, Couvet D (2012) French citizensmonitoring ordinary birds provide tools for conservation andecological sciences. Acta Oecol 44:58–66
Jiguet F, Devictor V, Ottvall R, Van Turnhout C, Van der Jeugd H, AkeLindstrom (2010) Bird population trends are linearly affected byclimate change along species thermal ranges. Proceedings of theRoyal Society B: Biological Sciences 51:676–690
Johnston A, Ausden M, Dodd A, Bradbury R, Chamberlain D, JiguetF, Thomas C, Cook A, Newson S, Ockendon N, Rehfisch M, RoosS, Thaxter C, Brown A, Crick H, Douse A, McCall R, PontierH, Stroud D, Cadiou B, Crowe O, Deceuninck B, Hornman M,Pearce-Higgins J (2013) Observed and predicted effects of climatechange on species abundance in protected areas. Nat Clim Chang9:769–771
Jongsomjit D, Stralberg D, Gardali T, Salas L, Wiens J, Between arock and a hard place: the impacts of climate change and hous-ing development on breeding birds in california. (2013) LandscapeEcology 28:187–200
Katz RW, Craigmile PF, Guttorp P, Haran M, Sanso B, Stein ML(2013) Uncertainty analysis in climate change assessments. NatClim Chang 3:769–771
Lewis DJ, Plantinga AJ, Nelson E, Polasky S (2011) The efficiencyof voluntary incentive policies for preventing biodiversity loss.Resour Energy Econ 33:192–211
Lubowski RN, Plantinga AJ, Stavins RN (2008) What drives land-use change in the United States? A national analysis of landownerdecisions. Land Econ 84:529–550
Martin Y, Van Dyck H, Dendoncker N, Titeux N (2013) Testinginstead of assuming the importance of land use change scenariosto model species distributions under climate change. Glob EcolBiogeogr 22:1204–1216
McFadden D (1974) Conditional logit analysis of qualitative choicebehavior. Academic Press, New York, pp 105–142
Mendelsohn R, Dinar A (2009) Climate change and agriculture: Aneconomic analysis of global impacts, adaptation and distributionaleffects. Northampton:Edward Elgar.
Mendelsohn R, Nordhaus WD, Shaw D (1994) The impact of globalwarming on agriculture: A Ricardian analysis. Am Econ Rev84:753–771
Millennium Ecosystem Assessment (2005) Ecosystems and humanwell-being: Biodiversity. World Resources Institute, Washington,DC, USA
Mouysset L, Doyen L, Jiguet F (2014) From population viabilityanalysis to coviability of farmland biodiversity and agriculture.Conserv Biol 28:187–201
Mouysset L, Doyen L, Jiguet F, Allaire G, Leger F (2011) Bio-economic modeling for sustainable management of biodiversityand agriculture. Ecol Econ 70:617–626
Nelson E., Polasky S, Lewis DJ, Plantinga AJ, Lonsdorf E, WhiteD, Bael D, Lawler JJ (2008) Efficiency of incentives to jointlyincrease carbon sequestration and species conservation on a land-scape. Proc Natl Acad Sci 105:9471–9476
Pearson RG, Dawson TP (2003) Predicting the impacts of climatechange on the distribution of species: Are bioclimate envelopemodels useful? Glob Ecol Biogeogr 12:361–371
Pereira HM, Leadley PW, Proenca V, Alkemade R, ScharlemannJPW, Fernandez-Manjarres JF, Araujo MB, Balvanera P, BiggsR, Cheung WWL, Chini L, Cooper HD, Gilman EL, Guenette S,

Climatic Change
Hurtt GC, Huntington HP, Mace GM, Oberdorff T, Revenga C,Rodrigues P, Scholes RJ, Sumaila UR, Walpole M (2010) Scenar-ios for global biodiversity in the 21st century. Science 330:1496–1501
Peterson AT, Soberon J, Pearson RG, Anderson RP, Martınez-MeyerE, Nakamura M, Araujo MB (2011) Ecological Niches andGeographic Distributions. Princeton University Press
Plantinga AJ (1996) The effect of agricultural policies on land use andenvironmental quality. Am J Agric Econ 78:1082–1091
Radeloff V, Nelson E, Plantinga A, Lewis D, Helmers D, Lawler J,Withey J, Beaudry F, Martinuzzi S, Butsic V, Lonsdorf E, WhiteD, Polasky S (2012) Economic-based projections of future landuse in the conterminous United States under alternative policyscenarios. Ecol Appl 22:1036–1049
Renwick AR, Massimino D, Newson SE, Chamberlain DE, Pearce-Higgins JW, Johnston A (2012) Modelling changes in species’abundance in response to projected climate change. Divers Distrib18:121–132
Schroter D, Cramer W, Leemans R, Prentice IC, Araujo MB, ArnellNW, Bondeau A, Bugmann H, Carter TR, Gracia CA, et al. (2005)Ecosystem service supply and vulnerability to global change ineurope. Science 310:1333–1337
Train K (2009) Discrete Choice Methods with Simulation SecondEdition. Cambridge University Press
Tubiello FN, Rosenzweig C, Goldberg RA, Jagtap S, Jones JW (2002)Effects of climate change on US crop production: Simulationresults using two different GCM scenarios. part I: Wheat, potato,maize, and citrus. Climate Research 20:259–270
Verburg PH, Eickhout B, van Meijl H (2008) A multi-scale, multi-model approach for analyzing the future dynamics of europeanland use. The Annals of Regional Science 42:57–77
Willis K, MacDonald G (2011) Long-term ecological records and theirrelevance to climate change predictions for a warmer world. AnnRev Ecol, Evol Syst 42:267–287
Wintle BA, Bekessy SA, Keith DA, van Wilgen BW, Cabeza M,Schroder B, Carvalho SB, Falcucci A, Maiorano L, ReganTJA (2011) Ecological-economic optimization of biodiversityconservation under climate change. Nat Clim Chang 1:355–359
Wood S (2006) Generalized Additive Models : An introduction with RChapman & Hall / CRC, 1st ed.
Xiong W, Conway D, Lin E, Holman I (2009) Potential impacts ofclimate change and climate variability on China’s rice yield andproduction. Clim Res 40:23–35


