
Integrated Medical Model (IMM) 4.0 –Enhanced FunctionalitiesM. Young1, A. B. Keenan1, L. Saile1, L. A. Boley1, M. E. Walton1, R. V. Shah2, E. L. Kerstman2, J. G. Myers3
1Wyle Science, Technology and Engineering Group, Houston, TX; 2University of Texas Medical Branch, Galveston, TX; 3Glenn Research Center, Cleveland, OH
1
National Aeronautics and Space Administration
www.nasa.gov
https://ntrs.nasa.gov/search.jsp?R=20150002715 2020-06-03T19:56:25+00:00Z

IMM v4.0 Overview
• Consider data for 100 medical conditions from the Integrated Medical Evidence Database (iMED)
• Simulate medical event occurrences over large number of missions via Monte Carlo methodology
• For each medical condition:
2
Incidence Rate
Time to occurrence
Best Case or Worst Case?
Treated or Untreated?
FI, duration, EVAC, LOCL
National Aeronautics and Space Administration

Incidence Rate (IR)• Fixed, lognormal and gamma distributions
defined in iMED• Generate IR for each medical condition-
crewmember combination• Example: Sepsis Incidence: Data category: Fixed
Space Adaptation: NoIncidence type: RateModel Data Path: Incidence Rate: 0.0024Distribution Data: Incidence Distribution: FixedOccurrence Distribution: PoissonCharacteristics Specific: none
3
Incidence Rate
Time to occurrence
Best Case or Worst Case?
Treated or Untreated?
FI, duration, EVAC, LOCL
National Aeronautics and Space Administration
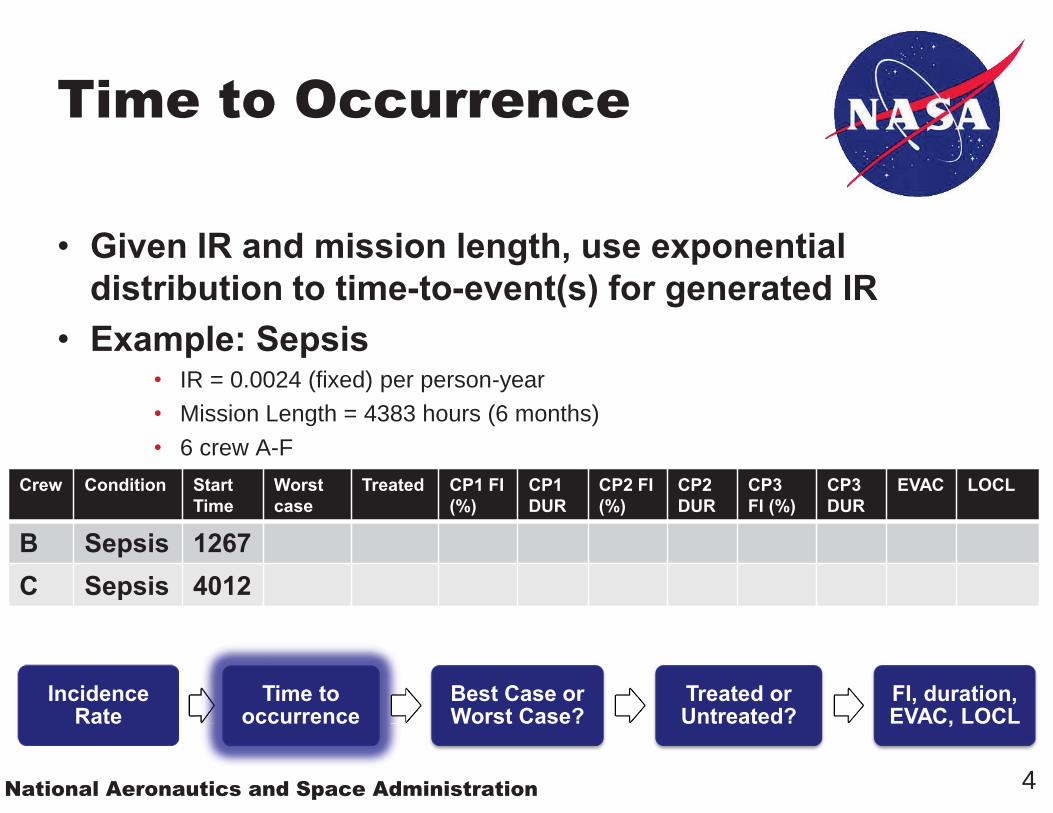
Time to Occurrence
• Given IR and mission length, use exponential distribution to time-to-event(s) for generated IR
• Example: Sepsis• IR = 0.0024 (fixed) per person-year• Mission Length = 4383 hours (6 months)• 6 crew A-F
Crew Condition Start Time
Worstcase
Treated CP1 FI (%)
CP1DUR
CP2 FI (%)
CP2DUR
CP3 FI (%)
CP3DUR
EVAC LOCL
B Sepsis 1267C Sepsis 4012
4
Incidence Rate
Time to occurrence
Best Case or Worst Case?
Treated or Untreated?
FI, duration, EVAC, LOCL
National Aeronautics and Space Administration
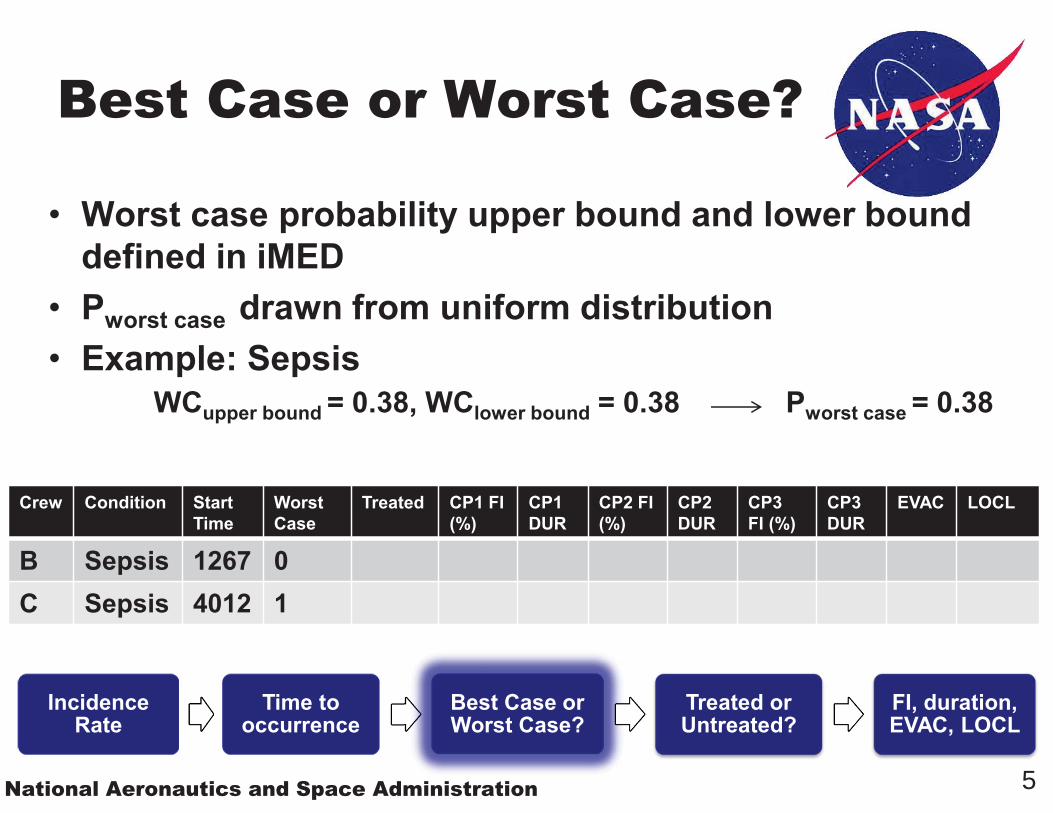
Best Case or Worst Case?
• Worst case probability upper bound and lower bound defined in iMED
• Pworst case drawn from uniform distribution• Example: Sepsis
WCupper bound = 0.38, WClower bound = 0.38 Pworst case = 0.38
Crew Condition Start Time
WorstCase
Treated CP1 FI (%)
CP1DUR
CP2 FI (%)
CP2DUR
CP3 FI (%)
CP3DUR
EVAC LOCL
B Sepsis 1267 0C Sepsis 4012 1
5
Incidence Rate
Time to occurrence
Best Case or Worst Case?
Treated or Untreated?
FI, duration, EVAC, LOCL
National Aeronautics and Space Administration
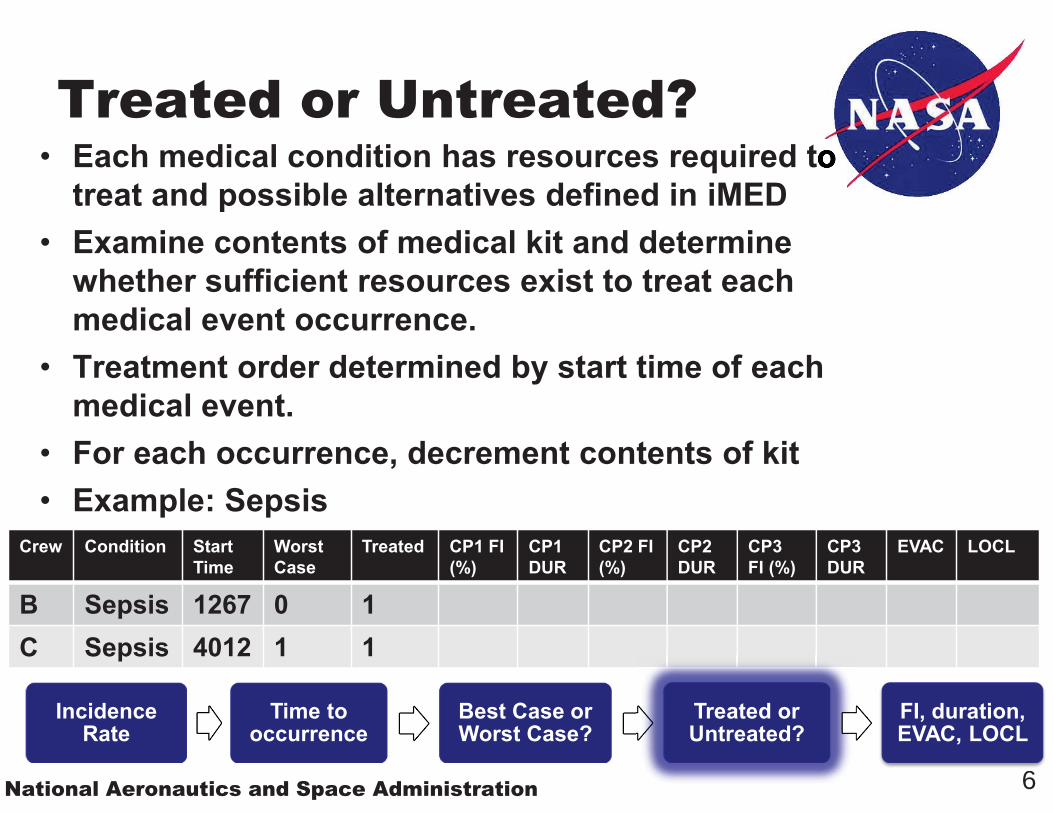
Treated or Untreated?• Each medical condition has resources required to
treat and possible alternatives defined in iMED• Examine contents of medical kit and determine
whether sufficient resources exist to treat each medical event occurrence.
• Treatment order determined by start time of each medical event.
• For each occurrence, decrement contents of kit• Example: Sepsis
Crew Condition Start Time
WorstCase
Treated CP1 FI (%)
CP1DUR
CP2 FI (%)
CP2DUR
CP3 FI (%)
CP3DUR
EVAC LOCL
B Sepsis 1267 0 1C Sepsis 4012 1 1
6
Incidence Rate
Time to occurrence
Best Case or Worst Case?
Treated or Untreated?
6
FI, duration, EVAC, LOCL
National Aeronautics and Space Administration

Outcomes: Functional Impairment and Duration
Sepsis Outcomes Clinical Phase 1 Clinical Phase 2 Clinical Phase 3FI Duration FI Duration FI EVAC LOCL
Treated, Best case 100 1 2-36 24-168 0 0 0Treated, Worst case 100 1-2 16-58 48-72 0-58 100 29-70Untreated, Best case 16-58 48-72 16-58 100 0-100Untreated, Worst case 38-75 48-72 38-75 100 100
Upper and lower bounds of beta pert distributions defined in iMED:
Crew Condition Start Time
WorstCase
Treated CP1 FI (%)
CP1DUR
CP2 FI (%)
CP2DUR
CP3 FI (%)
CP3 DUR EVAC LOCL
B Sepsis 1267 0 1 100 1 12 97 0 3010 0 0C Sepsis 4012 1 1 100 1.4 28 64 100 305.6 1 0
7
Incidence Rate
Time to occurrence
Best Case or Worst Case?
Treated or Untreated?
5.6 1 0
7777777777777777777777
FI, duration, EVAC, LOCL
National Aeronautics and Space Administration

Summarizing Results
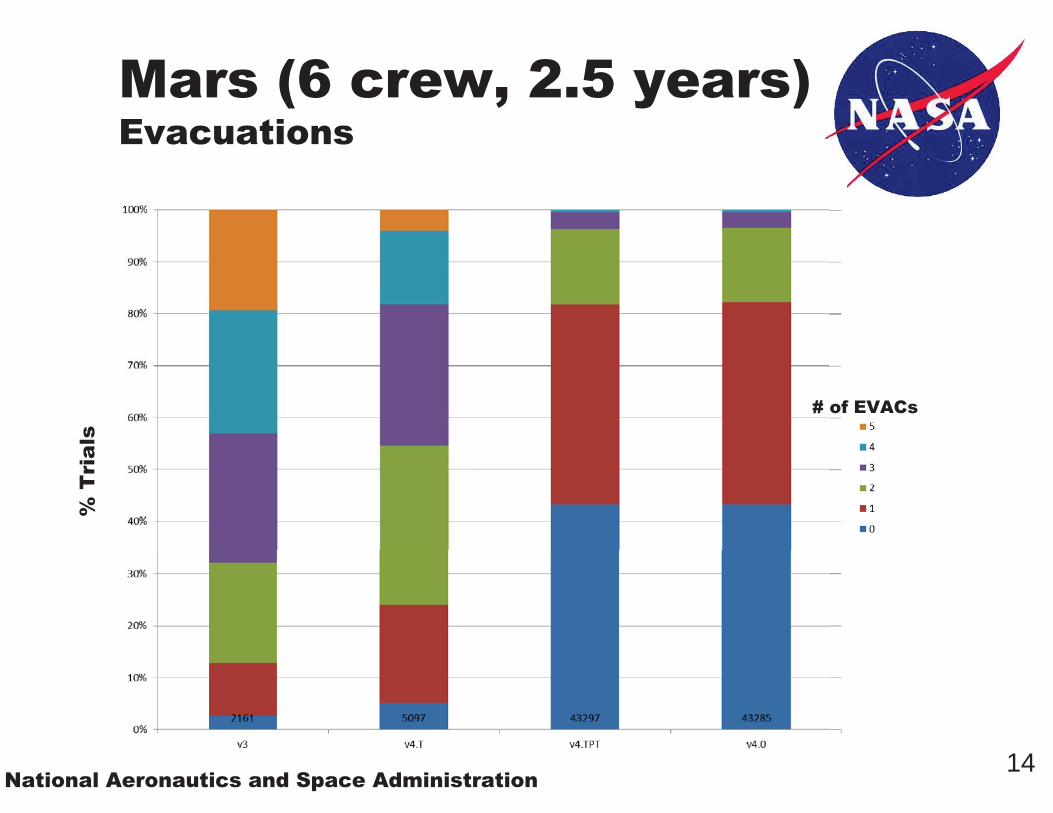
• Probability of evacuation (pEVAC)• Proportion of simulated missions with one or more
evacuations• Confidence limits are estimated with bootstrap resampling
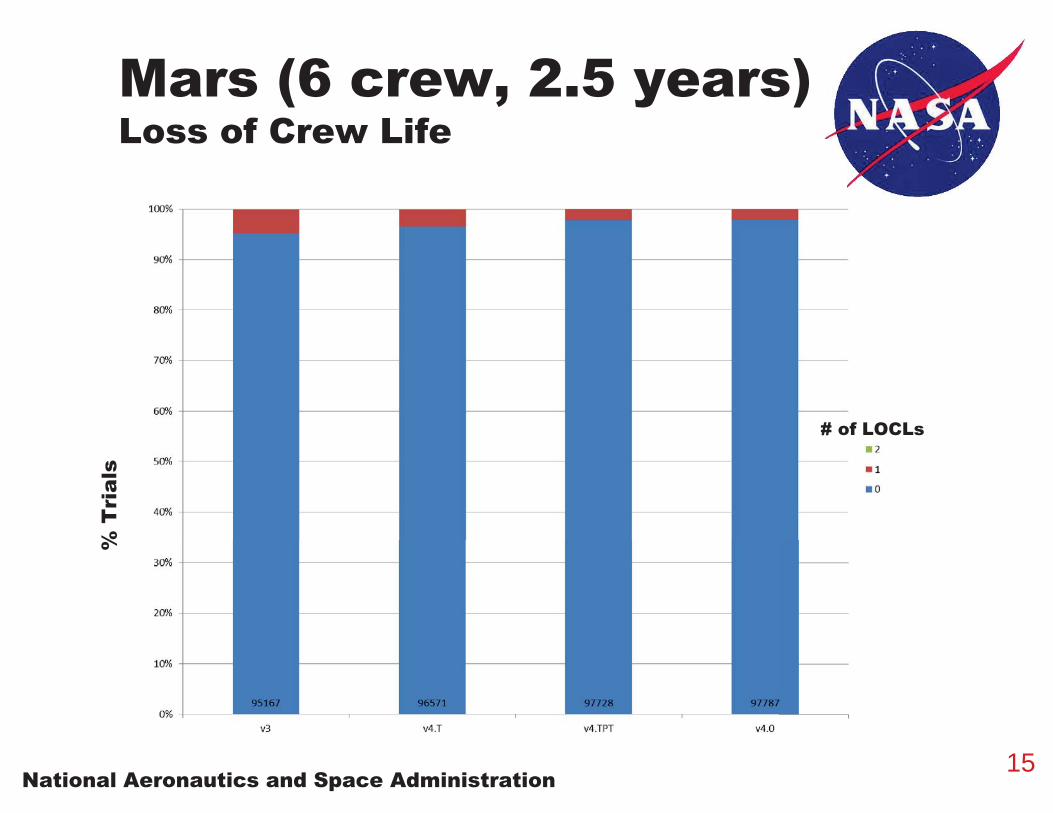
• Probability of loss of crew life (pLOCL)• Proportion of simulated missions with one or more loss of
crew life• Confidence limits are estimated with bootstrap resampling
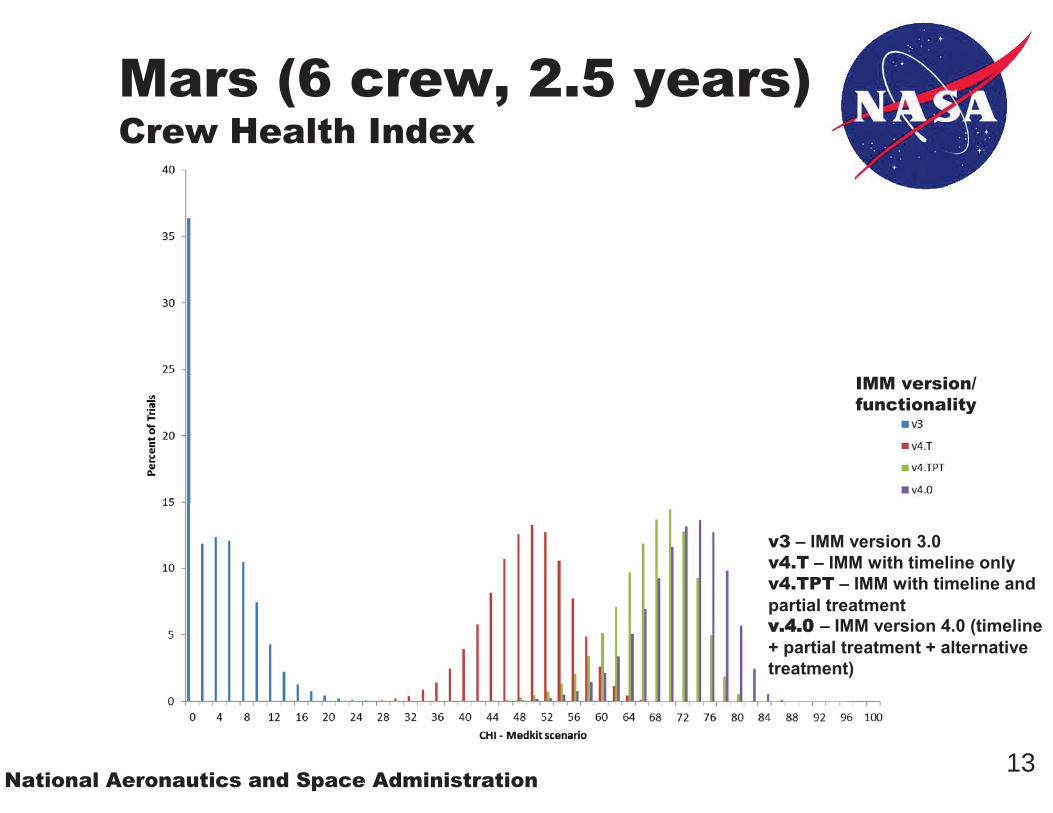
• Crew Health Index (CHI)• Proportion of mission time not lost to medical events
Where n= # crew, L = mission length, QTL=quality time lost; is a function of functional impairment and duration
8National Aeronautics and Space Administration

Timeline
9National Aeronautics and Space Administration
IMM v3.0:All medical events occur at beginning of missionLimitations:• Overestimation of
quality time lost due to CP3 functional impairment
• Must impose artificial order of treatment
IMM v4.0:• Generate time-to-event
for each medical event• Crewmember cannot
have medical events following EVAC or LOCL
Impacts:• Probability of LOCL and
EVAC• CHI• Resource utilization
10
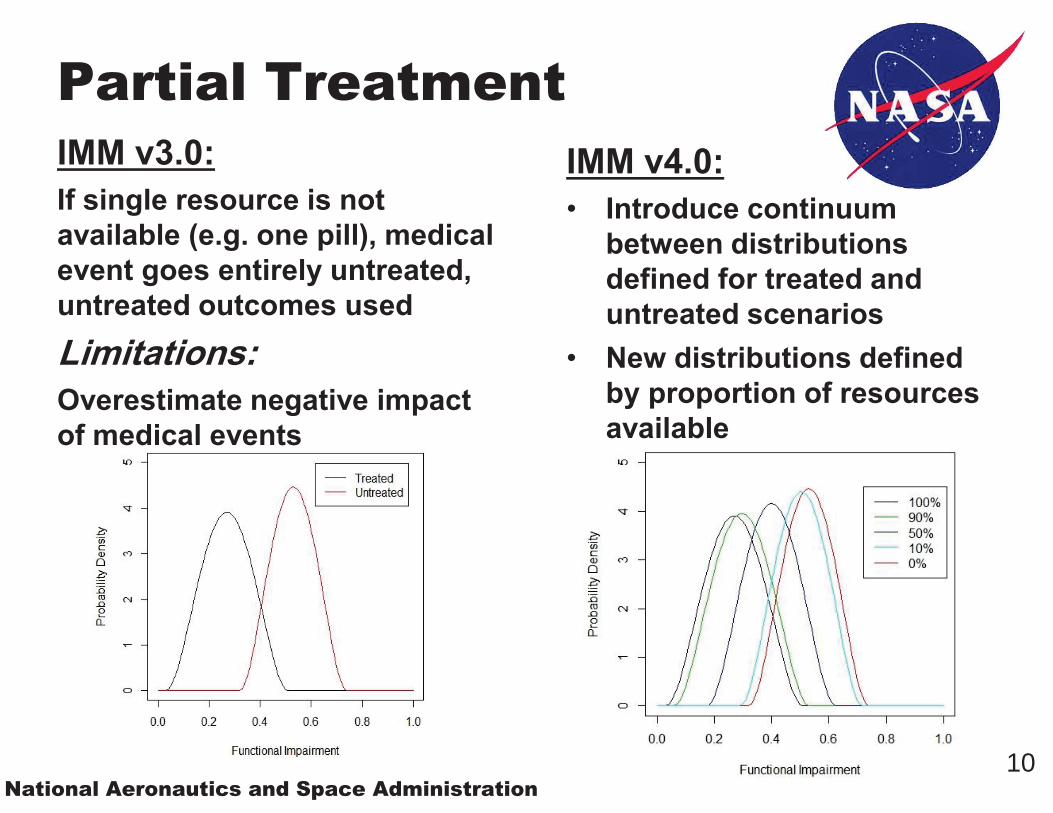
Partial Treatment
National Aeronautics and Space Administration
IMM v3.0:If single resource is not available (e.g. one pill), medical event goes entirely untreated, untreated outcomes usedLimitations:Overestimate negative impact of medical events
IMM v4.0:• Introduce continuum
between distributions defined for treated and untreated scenarios
• New distributions defined by proportion of resources available

Alternative Treatment
11National Aeronautics and Space Administration
IMM v3.0:Only primary resources designated for each medical condition may be used to treat
Limitations:Does not reflect real-world system.
IMM v4.0:Alternative resources are designated in iMED and may be used for treatment
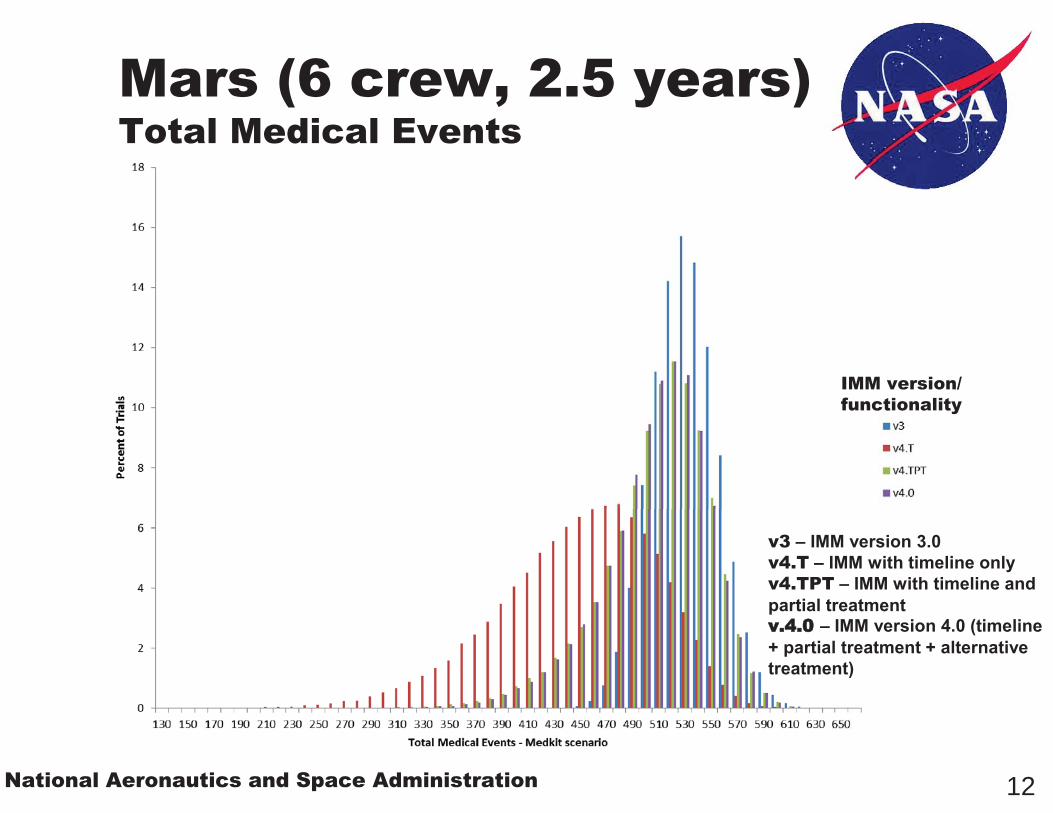
Mars (6 crew, 2.5 years)Total Medical Events
12National Aeronautics and Space Administration
IMM version/functionality
v3 – IMM version 3.0v4.T – IMM with timeline onlyv4.TPT – IMM with timeline and partial treatmentvv.4.0 – IMM version 4.0 (timeline + partial treatment + alternative treatment)
13National Aeronautics and Space Administration
Mars (6 crew, 2.5 years)Crew Health Index
IMM version/functionality
v3 – IMM version 3.0v4.T – IMM with timeline onlyv4.TPT – IMM with timeline and partial treatmentvv.4.0 – IMM version 4.0 (timeline + partial treatment + alternative treatment)
14National Aeronautics and Space Administration
Mars (6 crew, 2.5 years)Evacuations
% T
rial
s
# of EVACs
15National Aeronautics and Space Administration
Mars (6 crew, 2.5 years)Loss of Crew Life
% T
rial
s
# of LOCLs

16National Aeronautics and Space Administration
ISS (6 crew, 6 months)Total Medical Events
v3 – IMM version 3.0v4.T – IMM with timeline onlyv4.TPT – IMM with timeline and partial treatmentvv.4.0 – IMM version 4.0 (timeline + partial treatment + alternative treatment)
IMM version/functionality

17National Aeronautics and Space Administration
ISS (6 crew, 6 months)Crew Health Index
v3 – IMM version 3.0v4.T – IMM with timeline onlyv4.TPT – IMM with timeline and partial treatmentvv.4.0 – IMM version 4.0 (timeline + partial treatment + alternative treatment)
IMM version/functionality

18National Aeronautics and Space Administration
ISS (6 crew, 6 months)Evacuations
% T
rial
s
# of EVACs

19National Aeronautics and Space Administration
ISS (6 crew, 6 months)Loss of Crew Life
% T
rial
s
# of LOCLs
20National Aeronautics and Space Administration
Conclusions
• Total Medical Events• Decrease because no events may occur following loss of
crew life or evacuation• Crew Health Index
• Increase due to:• More medical events being treated due to partial
treatment and alternative treatment functionalities• Timelined medical events causing duration of
lingering functional impairment to be shortened• Probabilities of Evacuation and Loss of Crew Life
• Decrease due to due to partial treatment and alternative treatment functionalities

Questions?
21


