NBER WORKING PAPER SERIES
INSTITUTIONS AND FOREIGN INVESTMENT:CHINA VERSUS THE WORLD
Joseph P.H. FanRandall MorckLixin Colin XuBernard Yeung
Working Paper 13435http://www.nber.org/papers/w13435
NATIONAL BUREAU OF ECONOMIC RESEARCH1050 Massachusetts Avenue
Cambridge, MA 02138September 2007
The views expressed herein are those of the author(s) and do not necessarily reflect the views of theNational Bureau of Economic Research.
© 2007 by Joseph P.H. Fan, Randall Morck, Lixin Colin Xu, and Bernard Yeung. All rights reserved.Short sections of text, not to exceed two paragraphs, may be quoted without explicit permission providedthat full credit, including © notice, is given to the source.

Institutions and Foreign Investment: China versus the WorldJoseph P.H. Fan, Randall Morck, Lixin Colin Xu, and Bernard YeungNBER Working Paper No. 13435September 2007JEL No. F21,F23,G15,G38,O19,O43,O53,P34
ABSTRACT
Weak institutions ought to deter foreign direction investment (FDI), and mass media stories highlightChina's institutional deficiencies, yet China is now one of the world's largest FDI destinations. Thisincongruity characterizes China's paradoxical growth. Cross-country regressions show that China'sFDI inflow is not exceptionally large, given the quality of its institutions and its economic track record.Institutions clearly determine a country's allure as an FDI destination, but standard measures of institutionalquality can be problematic for countries undergoing rapid institutional development, and can usefullybe augmented by economic track record measures. Deng Xiaoping's 1993 "southern tour" heraldedsweeping reforms, and this regime shift is insufficiently reflected in commonly used measures of institutionalquality. China's FDI inflow surge after these reforms resembles similar post-regime shift surges inthe East Bloc, and so is also unexceptional. Recent arguments that China's FDI inflow is inefficientlylarge because weak institutions deter domestic investment while special initiatives attract FDI are thuseither unsupported or not unique to China.
Joseph P.H. FanSchool of AccountancyChinese University of Hong KongShatin, N.T.Hong Kong [email protected]
Randall MorckFaculty of BusinessUniversity of AlbertaEdmonton, CANADA T6G 2R6and [email protected]
Lixin Colin XuThe World Bank1818 H Street, NWWashington, DC [email protected]
Bernard YeungStern School of BusinessNew York University44 West 4th Street, Room 7-87New York, NY [email protected]

1
1. Introduction China now receives more foreign capital in the form of foreign direct investment (FDI) than any
other country, despite ongoing and sometimes vociferous criticism of the quality of its
government in the foreign media. This is curious because FDI involves much irreversible fixed
investment, which is sensitive to investors’ perceptions of public policies and property rights.
Does the quality of China’s government explain its FDI allure, or is China’s inflow of FDI in
some sense “exceptional” given the quality of its government?
This question has broad implications. The development literature shows financial
development, investment, and thus growth depending critically on the construction and
maintenance of sound institutions – fundamental tasks of government and defining norms of
“good government”. FDI can be less affected by institutional deficiencies than domestic
investment if foreign investors have better access to capital, or backing from their home
governments in protecting their property rights. In such situations, FDI can serve a critical
development role. Of course, arguments to the contrary are also plausible, for foreign investors
can confront information asymmetries and discriminatory sentiments. Hence this paper has
multiple objectives. On a broad level, it explores the relationships between various aspects of
government quality and inward FDI. On a country-specific level, it explores, within the context
of such relationships, possible differences between FDI inflows to China and other countries at
similar levels of development (as captured by per capita GDP).
We first show how FDI inflows correlate across countries with three key dimensions of
“good government.” These are
1. The general quality of government. To measure this, we use appraisals of official respect
for private property rights and freedom from official corruption.
2. The strength of constraints on executive power. Here again we use appraisals, but
focusing specifically on the freedom of action the country’s institutions accord its head of

2
government. Intuitively, constraints on executive power prevent a country’s head of
government from ruling by decree, arbitrarily nullifying or modifying contracts or
property rights, and capriciously altering the rules of the economic game in other ways.
If executive actions hinge on legislatures being consulted and court rulings being sought
amid an open competition for the right to govern, a country’s future policy direction is
less likely to be arbitrary and opportunistic.
3. The government’s track record. A government that has overseen more impressive
economic growth in the past is likely to draw more FDI than other countries with
similarly appraised institutions. We therefore consider past economic growth as an
implicit measure of government track record.
Within this framework, we show that FDI inflow correlates with a country’s economic
growth track record, both its magnitude and stability, and with its general institutional quality, as
captured by the “rule of law.” We find no China effect; for China dummies are insignificant –
both as intercept adjusters and slop shifters for institutional quality variables. We confirm an FDI
inflow surge into China following a marked regime change in 1993, but the effect readily fades
with time; and a like pattern is evident in Eastern Bloc transition economies. Any apparently
anomalous ‘China effect’ is readily explained by conditioning FDI inflow on track record in
sustaining past growth, as well as obvious controls for log population size, adults as a fraction of
total population, trade over GDP, exchange rates, and time dummies.
We surmise three conclusions from our findings:
1. High quality government attracts FDI. The most significant such qualities are respect for
the “rule of law” and a solid track record in overseeing strong and stable economic
growth. We find that “limits” on executive power” matter less clearly, perhaps reflecting
difficulties in quantifying that variable or an unstable relationship with FDI.
3
2. China’s large FDI inflow is not mysterious. Its high level is concordant with its growth
track record and its size, demographic appeal, openness, etc. The institutional variables
are not important in explaining China’s high FDI inflow because China’s institutions are
rated only slightly higher than those of other countries at similar per capita GDP levels.
3. These results suggest that China’s FDI inflow is not abnormally large. In particular, it
does not accord with China’s pro-inward FDI policies letting foreigners grab excessive
shares of China’s investment opportunities while China’s poor institutions discourage
domestic capital formation. (See Huang 2003.) Or, if such a phenomenon is present, it is
also present in enough other countries to render Chinese data non-anomalous.
The next section motivates our research question. Section three describes our general
views on inward FDI and the quality of governments and institutions. Section four reports the
empirical tests that educe our conclusions. Section five uses these results to understand China’s
high FDI inflows relative to those into countries with comparable incomes. Section six discusses
issues regarding the institutional variables their effects on regression explaining inward FDI.
Section seven concludes that “too much” FDI is not flowing into China.
2. Issues
The importance of sound institutions to economic development is now received wisdom. Solid
property rights protection and respect for the rule of the law are viewed as basic factors that
determine macroeconomic stability, capital market development, business sector development,
and investment in innovation – see La Porta et al. (1997, 1998), Acemoglu et al. (2003), Durnev
et al. (2004), Acemoglu et al. (2005), and many others. The successful development and
maintenance of sound institutions is therefore now seen as a critical function of government;
indeed, as a fundamental test of “good government”.

4
From this perspective China’s economic growth seems a puzzle. China features a one
party political monopoly. By most reckoning, democracy and political transparency are not
integral to the Chinese polity. Stories of corruption, scandals, and embezzlement starring
government bureaucrats, bank executives and corporate insiders contribute to a general
perception of weak property rights. More formal evaluations of the quality of Chinese
institutions concur with these impressions.
Table 1 shows China’s ‘rule of law’ exceeding levels in both the former Eastern Bloc and
Latin America, though its score on corruption is weaker. But China’s growth outpaces both of
these other regions. This success understandably draws economists, such Allen, Qian, and Qian
(2005) and others, to envision a “Chinese model” of development that permits vigorous growth
despite feeble institutions.
But Table 1 also sounds a note of caution. China’s per capita GDP is markedly lower
than the averages for either the Eastern Bloc or Latin America. This low starting point gives
China more room than most countries to grow simply by catching up. Even though many equally
poor countries do not manage to grow rapidly, a low starting point makes China’s rapid per capita
GDP growth rate less impressive: any capital allocated to any entrepreneur may well generate
quick economic growth.
A full analysis of the importance of political economy to economic development is
clearly beyond the scope of this study. We focus on only one factor in economic development –
FDI inflow – and thus investigate only one small part of a greater picture. We adopt this focus
because investment is a key determinant of growth. Foreigners’ capital is more footloose than
domestic capital, and is thus more sensitive to outside opportunities. Foreign investment ought
therefore to be more sensitive to institutional deficiencies.
If foreign capital flowing into China is unaffected by the institutional factors that
determine the allocation of foreign capital elsewhere, there may well be a distinct “Chinese
model”. One plausible possibility is that foreign investors are undeterred by China’s inadequate

5
institutions because the Chinese government favors them (Huang 2003). Another is that foreign
investors are overenthusiastic about China’s potential. But if the same determinants affect FDI
allocation in China as elsewhere, Chinese exceptionalism is rendered dubious. Of course, its
domestic savings might still be allocated uniquely; but even if this were so, our study narrows the
scope for any possible Chinese singularity.
China surpassed the U.S. as the world’s largest FDI recipient in 2001. But China is a very
large country – economically and geographically as well as in terms of population. Comparisons
across countries must be scaled by country size. Table 1 shows China’s inward FDI as a fraction
of GDP is larger than in either Latin America or the former Eastern Bloc, but smaller if measured
per capita. This makes sense because China’s low per capita GDP and large population make its
absolute FDI inflow seem large, just as its rapid per capita GDP growth rates seem large, in part,
because of its extremely low starting point
Figure 1 pursues this issue further. Before 1993, China’s FDI falls short of the global
average, regardless of whether it is expressed per capita or as a fraction of GDP. But after a
series of reforms begun in 1993, China’s FDI inflow surges. From 1990 through 2003, FDI
inflow averages 4.3% of GDP – double the world average of 2.1%. But, FDI inflow per capita
remains low. Even the highest level it achieves in the data underlying Figure 1, about US$40 per
capita, is only about one-fifth of the world average. The world mean is heavily skewed by very
high-income countries, like Canada, the U.K. and the U.S. Only when judged against other
countries with comparably low starting points does China’s FDI inflow seem impressive. For
example, for the period 1993 and beyond, China exceeds by almost 50% the average FDI per
capita of the countries with comparable GDPs per capita.1
Thus, whether China’s performance is exceptional or not depends critically on how it is
measured, against which benchmarks it is compared, and on how much of China’s economic
1 This point is elaborated in Table 2, discussed below.

6
performance can be dismissed as “easy growth” as the country catches up after decades of
stagnation under Maoist socialism.
But let us accept that China’s ability to attract FDI is of economic interest, and seek an
economic explanation of it. Given this motivation, we use a straightforward empirical
specification to consider two questions:
1. Is FDI allocation affected by government quality?
2. Is China’s FDI inflow exceptional, given the result in 1?
To lay the groundwork for answering these questions, we next consider the determinants of FDI
inflow.
3. The role of “good government” in attracting FDI
The literature on FDI, though voluminous, points towards a relatively simple generic empirical
specification.
The starting point of the modern FDI literature is the Coasean Theory of the Firm (Coase
1937, Caves 1971, Buckley and Casson 1975, Caves 1982, and others). In essence, prospective
multinational firms are envisioned as possessing information-based firm-specific capabilities that
they could profitably apply in foreign countries. Indeed, these capabilities compensate for local
firms’ “home court advantage” to let multinationals earn returns high enough to justify their
investments abroad (Morck and Yeung 1991, 1992). Agency problems, information asymmetries,
and property rights protection problems render information-based assets inalienable, and so
prevent these firms from selling or leasing their capabilities to foreign firms. To apply their
unique capabilities abroad profitably, multinationals must thus establish controlled foreign
operations – i.e. engage in FDI. The fundamental principle, however, is that FDI is an investment
like any other – aiming to capture quasirents to realize a positive net present value (NPV).
The NPV of a corporate investment project of this sort depends on a multitude of factors.
Caves (1982) draws attention to economy size in this context: a larger economy gives an

7
investment projects with higher fixed costs a higher NPV; so FDI inflow, all else equal, should be
larger into larger economies. The NPV a firm foresees also depends positively on local product
and factor market development, growth potential, and the availability of financing; and negatively
on market risks and costs of doing business. The last is especially emphasized, and linked to high
taxes, high wages relative to productivity, and generally poor infrastructure.2
All these factors, including the development of the financial system, depend on an
economy’s institutional environment – its rules, regulations, and informal codes of behavior. As
described above, the commercial success of FDI hinges on how well a firm protects its property
rights and overcomes a range of agency and information asymmetry problem; and foreign firms
are particularly handicapped in achieving these goals, giving local firms their above mentioned
home court advantage (Zaheer and Mosakawski 1997). But, if locals make transparent and
predictable use of practicable norms, legal systems, and political institutions to adjudicate
disputes, this home court advantage diminishes and FDI flows in more abundantly. This
consideration echoes the more general finance and growth literature, which emphasizes how
sound and well-enforced rules and regulations, like property rights protection and information
disclosure, encourage economic development in general and capital market development in
particular (La Porta et al., 1997 and 1998; King and Levine, 1993). This is because such rules
and regulations constrain opportunistic behavior and build transactional trust between contracting
parties (North 1991).
Establishing and administering sound rules and regulations requires “good government”.
Governments that are less corrupt, have more efficient bureaucracies, and that impose less
2 Coughlin, Terza, and Arromdee (1991) provide empirical support for these factors influencing inward FDI, though they do not consider financial development. Froot and Stein (1991), while showing that undervalued host country currencies attract inward FDI, also stress barriers firms confront in raising capital to finance new investment projects. These barriers are particularly daunting for domestic firms in economies with underdeveloped capital markets. In such countries, foreign firms could have an advantage in capturing the NPVs of new investment projects because of their access to better functioning foreign capital markets (Foley, Mahir, and Hines, 2004). See also Dunning (1993) and Dunning and Zhang (2007) for the relationship between FDI, locational competitiveness, and other factors.

8
burdensome regulations foster economic development. Alfaro et al. (2005) show that weak
institutions explain why very little capital flows from rich to poor countries. Globerman and
Shapiro (2002) find preliminary evidence that FDI flows towards locations with sounder
governance infrastructure, which includes how well the legal system enforces contracts and
protects property rights, how free the government is from corruption, and how efficient the
government is; that is, how well regulators and other bureaucrats avoid imposing unnecessarily
burdensome regulations3. Their result could reflect countries with better institutions having
stronger growth opportunities, which attract more FDI.
Governments are, of course, staffed by people. Sound institutions require high quality
government, and this requires well-qualified politicians and civil servants. Just as good corporate
executives are products of good internal corporate governance, high quality politicians and civil
servants arise from sound public institutions. This circularity can lock in either good or bad
government.
The sort of circle into which a country fits determines critically its appeal as an FDI
destination. Transparent and orderly political competition, along with constraints on executive
power, seems paramount. Acemoglu and Johnson (2005) find stronger constraints on government
associated with less corruption and more predictable policies and regulations. They unbundle
institutions into those protecting contracts and those protecting property. The former facilitate
contractual arrangements between transacting parties; the latter constrain public officials from
acting arbitrarily for personal gains. Investment and growth appear better explained by property
rights protection, while the former influence mainly the form of contracting that occurs.
Constraints on executive power may be particularly worthy of attention when we
examine countries that feature recent phenomenal growth. These countries, of which China is
one, need external capital to capture their growth opportunities. To attract foreign capital, their
3 Their empirical results do not control for expected growth, so institutional factors might proxy for this, or for government behavior associated with expected future growth and thus with a need for FDI.

9
governments should be particularly enthusiastic about implementing and enforcing property
rights, honoring policy commitments, and avoiding burdensome regulations. But foreign
investors’ concern is often not about such governments’ current stances, but about how they
might act once the investments are in place – especially if growth and investment opportunities
become less profuse. Constraints on executive power prevent heads of government from abruptly
altering property rights, revising policies, reneging on commitments, and capriciously imposing
new regulations. In short, they prevent short-term actions, like precipitous expropriations, in the
event of negative shocks. Executive constraints, especially if safeguarded by political
competition, should reinforce the attractiveness of current sound policies to FDI by credibly
assuring the permanence of those policies.
In summary, basic economic and institutional factors attract FDI inflow. The economic
factors include the size of the market, the current level of development, and factors like education
and infrastructure development that affect productivity and future development potential.
Obviously, other economic factors, notably trade openness and the host country’s currency (see,
e.g., Froot and Stein 1991), affect the FDI flows too. The institutional factors include general
measures of “good government” such as the instillation of law and order in the public, high
quality public officials, and the strength of constraints on executive power.
4. Empirical findings
This section examines the international allocation of inward FDI, as tabulated the World Bank
WDI database. Our dependent variable is per capita FDI in constant 2000 US dollars, winsorized
at five percent.4 We add a constant to this quantity because some countries have negative FDI
4 Winsorization prevents disproportionate influence of outliers due to measurement errors. This variable is highly skewed: its fifth and first percentiles value are -0.46 and -79.0, while its ninety-fifth and ninety-ninth percentiles are 527.8 and 1064.0. Its minimum is -2615 and its maximum is 259837. The results are qualitatively similar when we winsorize at the first or fifth percentiles. However, giving the five percent threshold is around 0 (instead of -79 at the one percent level), interpreting magnitudes is simpler, for

10
inflows (negative FDI inflow represents repatriation of previous investment).5 Dropping the
negative FDI inflow observations leads to qualitative similar results. However, we are not aware
of persuasive economic reasons to exclude these observations.
We reiterate here our twofold intentions. First, we wish to investigate empirically our
thesis that “good government” attracts FDI. Second, we wish to see if the FDI flowing into China
behaves similarly to that flowing into other countries. To these ends, following the discussion
above, we regress each country’s FDI inflow on a set of country characteristics associated with
the quality of government, along with some basic measures of the level of development and other
country characteristics such as the population size, demographic characteristics and trade policies.
We include China in these regressions and then ask whether China-specific dummies are
significant.
Focal independent variables
Our focal independent variables are “quality of government” measures. Following the discussion
above, we include three sets of these.
Constraints on executive power
We use two variables to capture the strength of constraints on executive power.
Executive constraints, from the Polity IV database, ranges from 1 to 7. It is composed of
indexes that gauge barriers to political entry (monarchy through dictatorship to open entry), the
nature of political transitions (orderly or military), and the selection of successors (genetics
through appointment to open election). This variable therefore captures the strength of
log(FDI per capita + constant) is closer to log(FDI per capita) if the constant is 0.5, instead of 80, and log differences can be interpreted as percentage differences. 5 In total, 6.3% of the observations are negative. We add 0.5 to FDI per capita so the minimum of the winsorized FDI per capita is positive.
11
institutionalized constraints on the decision making power of a country’s chief executives. The
larger the number is, the stronger the constraints.
Responsible government is constructed from the Polity IV database and rates each
country on a democracy-autocracy scale. First, in the data base an autocracy variable is available,
ranging from 0 to 10, with a larger number indicating a more autocratic government. Also
available is an analogous democracy index ranges from 0 to 10, but with a larger number means a
more democratic government. Our responsible government variable is the democracy index
minus the autocracy index, a measure called polity2 in the database. It captures the extent to
which a political regime is responsible to its people, the larger the number the stronger the
democratic checks on the political system.
General institutional quality
In addition to our executive power limitation variables, we consider a commonly-used measure of
the general quality of government: the rule of law index from ICRG. This is a survey result
gauging the state of law and order in each country. It ranges from 1 to 6, with higher values
connoting greater general respect for the rule of law.6 It contains a law component, which
captures the strength and impartiality of the legal and political establishment in judicial matters,
and an order component, which captures the extent to which residents of a country accept
established legal and political institutions as the solely legitimate way to make and implement
laws and to adjudicate disputes.
We also adopt International Country Risk Guide’s corruption index as our freedom from
corruption index; this measure is most commonly used in the related economics literature, and
also has the widest coverage of the standard corruption indices. This variable gauges corruption
as the incidence of high government officials demanding special payments, and of illegal
6 ICRG data has the advantage of covering the majority of countries from 1982 on. For details, see Knack and Rahman (2007).

12
payments being expected throughout low levels of government. In addition to being consistent
with previous studies, the variable has the advantage of having the broadest coverage of
countries, which maximizes our sample size. The index itself takes on values ranging from zero
(most corrupt) to six (least corrupt); and hence falls with rising corruption.
Government track record
A government’s track record plays an interesting role. As explained in the previous section, FDI
is large where foreign corporate investors regard investment opportunities highly. Obviously,
investment opportunities are more abundant where institutions are better, where government
officials less corrupt, bureaucracies more efficient, and the rule of law more generally upheld.
Yet positive shocks to investment opportunities can also entice governments seeking to attract
foreign capital to provide such institutions. Hence, a simple relationship between measures of
government quality and FDI could be misleading. At the very least, to sort this out, our empirical
investigation should incorporate a proxy for the presence of profitable investment opportunities.
This is the track record of the government, which we measure in two ways.
Growth trend is a country’s per capita GDP growth rate, averaged over the prior five
years. We interpret rapid past growth as indicative of both profitable investment opportunities
and a government able to foster, or at least not impede, their exploitation.
Macro volatility is the standard deviation of per capita GDP growth over the prior five
years. Less stable growth, all else equal, is less conducive to FDI, and less indicative of sound
and predictable government policies.
Control variables
Alongside our focal independent “quality of government” measures, we also include set of
variables capturing other economy characteristics likely to be associated with higher FDI inflow.
These are:

13
General economy development
We gauge general development using the following variables: log of per capita GDP in 2000
constant US dollars; education measured by the log of years of schooling, averaged across all the
country’s residents; infrastructure quality, represented by telephones per thousand residents; and
level of urbanization,7 urban population as a fraction of total population. This set of variables is
commonly used elsewhere in the literature (see e.g. Coughlin et al. 1991).
Other economy characteristics
Based on the discussion in the previous section, we include set of country characteristics. We
include country size, measured as the log of total population, to control for scale economies
attainable in each country. Because a country’s productivity and growth are positively associated
with the proportion of its population who are working age adults (Mason 2007), we also include
adults as a fraction of the population.8 China is currently enjoying a demographic growth
dividend; the decline in its birth rate since 1949, and particularly so since 1959, is now swelling
its working age adult population.
We further include a measure of openness, import plus export as a fraction of GDP, for
two reasons.9 Openness reduces the utility of FDI for jumping trade barriers. But more open
countries are also more attractive places to site e.g. vertically related FDI. Openness might also
reduce information asymmetry for potential foreign investors, and might correlate with a variety
of positive economy features. The variable is lagged one period to mitigate endogeneity issues.
We also include the exchange rate of each country’s currency relative to the US dollar,
normalized by the 2000 rate. This means a higher value of exchange rate implies a more
7 We have also tried including the percent of GDP accounted by manufacturing and services, and found that they don't matter for attracting FDI after controlling for GDP per capita, urbanization, and other controls. 8 Adults are defined to be between the age of 15 and 64. 9 We thank an anonymous referee for the suggestion.

14
depreciated local currency. Countries with undervalued currencies, all else equal, attract more
FDI (see e.g. Froot and Stein, 1991).
While we introduce these variables as controls, they are also, in part at least, reflections
on the quality of each country’s government and institutions. Better governed countries typically
have more telephones per capita, more educated people, more trade openness, and currencies that
better hold their values. This may even apply to population, for emigration is a common
response to misrule. Including these controls thus biases our analysis against finding significant
results for our focal ‘quality of government’ variables.
China dummies
Because our objective is to see if China’s FDI inflow is “exceptional”, we include a China
dummy, δChina, in the regressions. If this variable is significant, China differs on average from
other countries after conditioning on the variables mentioned above.
We further employ a regime shift dummy. Observers of Chinese economy know that
1993 marks a turning point – Deng Xiaoping's Southern Tour – which sent a strong signal to the
world of China’s commitment to economic liberalization. Such a regime shift can cause a surge
of investment (Henry, 2000) that subsequently abates over time. We therefore create a post 1993
dummy, δ t > 1993, and include in the regression two additional variables: China post 1993 ≡ δChina
× δ t > 1993,, and China post 1993 trend ≡ δChina × δ t > 1993 × (t – 1993), where t measures time; the
former captures the response of FDI to a significant regime shift, and later detects the extent to
which the effect fades with time.
Regression Specification and sample
Our regression specification is thus:
ititit
itititchinait
tetrendpostChinadpostChinadaaPCFDI
εδ
+++++++=
19931993)_ln(
10
10 c'Zb'X (1)

15
where Xit is a vector of variables related to general development and economy characteristics –
including log GDP per capita, log(mean years of schooling), telephone density, urban share of
population, adult share of population, log population, exchange rate, and openness – and Zit is a
vector of institutional quality measures. We divide these into two parts: inst, containing
responsible government, executive constraint, rule of law, and control of corruption, and track,
containing measures of the government's track record – the growth trend of a country and the
volatility of growth rate in the prior five years. Since our institutional variables exhibit little
variation over time, and fixed effects would exacerbate measurement problem (Griliches and
Hausman, 1986), we rely on ordinary least square to estimate our regressions, but cluster by
country when estimating standard errors (Moulton, 1986). Using random-effects estimation
generates qualitatively similar results.
Data from 1961 to 2003 for the following 61 countries are included in specifications
using the institutional variables executive constraints or responsible government (both from the
PolityIV database): Albania, Argentina, Armenia, Australia, Azerbaijan, Belarus, Belgium, Benin,
Bolivia, Brazil, Canada, Chile, China, Colombia, Dominican Republic, Ecuador, Egypt, El
Salvador, Eritrea, Estonia, Ethiopia, Finland, Gabon, Ghana, Greece, Guinea-Bissau, Hungary,
India, Iran, Israel, Italy, Jamaica, Japan, Jordan, Kenya, Lao PDR, Liberia, Mali, Mexico,
Nicaragua, Norway, Pakistan, Panama, Papua New Guinea,, Peru, Poland, Russian Federation,
Rwanda, Saudi Arabia, Senegal, Swaziland, Syrian, Tunisia, Turkey, Turkmenistan, Uganda,
Ukraine, United States, Uzbekistan, Venezuela, Yemen. In specifications for which the
institutional variable is the rule of law (from ICRG), we can use data for 120 countries from 1982
and 2001 for the -based regressions.10 Our sample is thus constrained by the differing coverage
of the two datasets. Observations with missing data for any variables are dropped. Rule of law is
missing less frequently than executive constraint or responsible government; but is available over
10 The list of countries is available upon request.

16
a shorter panel – 1982 through 2001. Restricting all our regressions to this shorter period
generates qualitatively identical results.
Summary Statistics
Table 2 reports standard descriptive statistics for our variables across the relevant samples of
countries. We present four samples: a pooled sample excluding China (using the combined
sample for regressions with the polity IV variables and with rule of law), China before 1993,
China after 1993, and a “similar income countries” subsample after 1993. The last consists of
1993 - 2003 data on countries whose GDP per capita is bounded by China's minimum and
maximum GDP between 1993 and 2003 (excluding China, of course).
The interesting observations from Table 2 are as follows. First, China’s FDI inflow
clearly rises substantially after 1993 – more than thirty-fold. Obviously, China’s per capita
income also gallops forward during this period, as the country starts catching up with the rest of
the world. Second, while China’s limits on executive power (as captured by responsible
government and executive constraints) change little, and remain below the average and the
average for countries at similar income levels, its general institutional quality (as captured by the
rule of law and control of corruption) paints a more complicated picture. China’s rule of law
rises from well below the global average and the average for countries at similar income levels to
well above both. China’s freedom from corruption, however, deteriorates over time, falling to
levels typical of countries with comparable incomes per capita.
Regression results
Table 3 describes our cross-country regressions. For each institutional variable, we present
results both with and without the China 1993 dummy and China 1993 trend – with the former in
odd and the latter in even number columns.

17
High scores for good government generally accompany high FDI inflows. A good
government track record also accompanies a high FDI inflow, for past average growth attracts a
positive significant coefficient and elevated growth rate volatility attracts a negative coefficient.
General government quality, our rule of law variable, is statistically significantly associated with
higher FDI inflows. Overall, FDI inflows correlate positively with a government’s track record
and the prevalence of the rule of law – the quality of government matters.
The strength of limits on executive power is statistically insignificant in explaining FDI
inflow. This may reflect mismeasurement; for the variables in this category are revised slowly
despite obvious changes in reality. Take China as a case in point – while Chinese governance
changed markedly over the past two decades, this is reflected in neither of the two indicators in
Table 2. In contrast, the rule of law variable captures subjective impressions by foreign investors,
and is perhaps a more up-to-date snapshot of reality.
Another puzzle is the utter insignificance of freedom from corruption, contrary to our
expectations. A possible interpretation is that corruption is less damaging to FDI than the popular
press claims. If foreign investors regard bribery as a cost of doing business, and high bribes are
repaid with other breaks, like low formal taxes or regulatory privileges, FDI might proceed apace.
While opaque and unpredictable government is detrimental to efficient and effective business
operations, this effect is also perhaps better captured by the rule of law variable.
Some evidence links trade orientation to FDI. While lagged trade over GDP is
insignificantly associated with FDI per capita if the institutional variables are executive constraint
or responsible government, it becomes highly positive and significant if rule of law is used.
Intriguingly, the other variables are rarely consistently significant and robust. Two exceptions are
that greater urbanization is associated with more FDI inflow per capita that FDI inflow per capita
exhibits a strong positive global time trend.
To account for China’s 1993 regime shift, we use our China post 1993 dummy and China
post 1993 trend. The former captures any discrete FDI response to the regime shift, while the

18
latter gauges how fast any FDI impulse fades over time. These terms attract positive and a
negative significant coefficient respectively. After 1993 China’s FDI inflow per capita jumps by
108 to 172 log points, all else equal, and its growth rate in FDI per capita drops by 11 to 15
percent per annum subsequently. Thus by the end of our sample period, the jump is largely
dissipated.11
Chinese data appear unexceptional, for the China dummy is statistically insignificant and
unstable of sign. This is so regardless of whether or not we include or exclude regime change
variables. Thus, China seems little different from other countries in terms of its FDI inflow per
capita once we incorporate appropriate controls. There is no Chinese exceptionalism.
A reasonable concern here is that we ignore regime changes in other countries, but not in
China. If regime changes are correlated across countries, our regression results may be biased. A
full fledged inquiry into worldwide policy regime changes and FDI allocation is far beyond the
scope of this study, but we can explore how our estimates might be affected by incorporating
other countries’ well-known policy regime changes. Also, we can check if the impulse response
to China’s regime shift is similar to that accompanying other countries’ regime shifts. We focus
on the transition to market economy by former Eastern Bloc countries, and construct three
variables: Eastern Bloc (a dummy marking Eastern European and former Soviet Union countries),
Eastern Bloc post-1990, and Eastern Bloc post-1990 trend, defined precisely analogously to
China post 1993 and China post 1993 trend. The Berlin Wall fell on Nov 9, 1989 so we take
1990 as the defining moment for regime change in the Eastern Bloc.
Table 4 shows that Eastern Bloc countries resemble China. Their 1990 transition
presages an immediate jump in FDI inflow per capita. This jump is larger than China’s – 500 to
620 log points. A decline in growth rates after 1990 is also evident, and is again more dramatic
11 For example, using column six, the jump effect and the time trend effect offset each other in between the 7th and the 8th year, i.e., around 2000.

19
than in China. The Eastern Bloc dummy itself attracts a negative and significant coefficient, and
impulse response does not dissipate totally within our sample period, as China’s does.
While all these findings are interesting per se, and clearly warrant further investigation,
we return to our main focus. Allowing for similar important regime shifts elsewhere does not
alter our results regarding China. The China dummy remains broadly insignificant (except in
column 2, where it is negative and marginally significant). Our other results also remain intact:
track record and the rule of law remain positive and significant; limits on executive power and
freedom from corruption remain insignificant; and the China impulse response coefficients are
not materially changed.
Another angle from which to explore China’s possible uniqueness is that the institutional
variables might matter differently for China versus other countries. To explore this, we interact
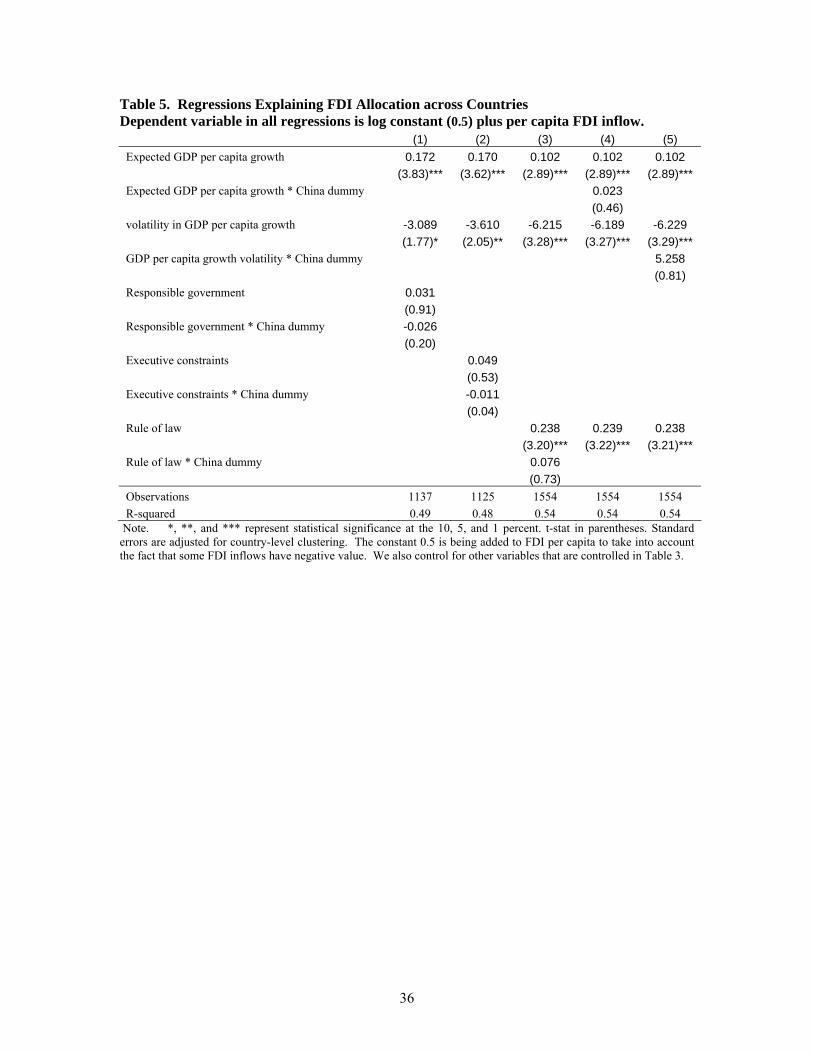
the institutional and government track record variables with the China dummy. Table 5 shows
that none of these interaction terms are statistically significant.
In summary, we find FDI attracted to countries with good government track records, as
indicated by stable and high prior growth, and with high quality governments, as captured by the
prevalence of the rule of law. Other popular measures of the quality of government – freedom
from corruption and limits on executive power – do not significantly affect FDI inflows.
Important pro-business policy regime shifts have the expected effect of attracting surges of FDI,
which fade over time. Most importantly, we find no Chinese exceptionalism regarding FDI
inflow. China’s FDI inflow is neither higher than in other countries nor differently related to
institutional quality variables once obvious controls are included.
5. FDI allocation – China and the world compared
We now turn to the economic significance of our regression findings in comparing FDI inflows
into China and other countries. For comparison, we select a comparison group (CG) of countries

20
whose GDP per capita between 1993 and 2003 is bounded by China's minimum and maximum
GDP in the same period. China's FDI per capita exceeds that for the comparison group by 101
log points in 1993, and 121 log points in 2001.12 Given this, how do our regression results
explain China’s per capita FDI premium with differences in the values of the regressors?
Regression [1] lets us decompose the per capita FDI inflow differential between China
and the CG into a component explained by the observable variables, Z (limits on executive power,
general government quality, government track record, general development proxies, and proxies
for other characteristics) and by the China specific unobservables as captured by the China
dummies in equation 1. For expository convenience, we focus on two years: 1993, is the water
shed year of China’s commitment to economic reforms signaled by Deng Xiaoping’s Southern
Tour and 2001, and the end of the year of our sample. In percentage terms, the observables
explain the premium by )()( ,,,, tCGtchinatCGtchinaZ YYZZ −−β while the unobservable explains
the premium by )()( ,,1 tCGtchinachina YY −+ γα in 1993 and by
)()8( ,,21 tCGtchinachina YY −×++ γγα in 2001. The results are reported in Table 6, the four
column panels correspond to the regressions 2, 4, 6, and 8 in Table 3, respectively.
First, most obviously the chief factor that propels China’s per capita FDI above countries
of similar income is its economic track record – the past high and stable average growth account
for about 46% to more than 100% of the FDI premium. The effect is larger in the 2001 year than
in the 1993 year.
Second, equally impressive is the contribution of adult (age 15 to 64) population share to
China’s FDI premium, which accounts for 45% to 80% of China’s FDI premium over similar
income countries. While the magnitude is slightly small in 2001 than in 1993, the difference is
limited. Clearly, the attraction of China’s working age adult for FDI exists. Perhaps, that is part
12 This is only approximately true. Our dependent variable is ln(0.5+FDI per capita), which is very close to ln(FDI per capita) when FDI per capita is around 20 to 30 dollars per capita.

21
of China’s demographic dividends. The track record on growth and the demographic attraction
together essentially accounts for more than a hundred percent of the China FDI inflow premium.
Third, China’s large population naturally serves to dampen the magnitude of China’s per
capita FDI inflow. When we combine this factor with the demographic composition factor,
which provides the opposite effect, the net magnitude is very “tame,” about 21% in 1993 and
15% on the down size of the difference between FDI inflow in China and similar income
countries. However, we add the caveat here that both the population and the adult population
share variables are not significant explanatory variables in the base regressions in Table 3.
Fourth, the collection of the general development factors serves to press China’s per
capita FDI inflow below similar income countries in 1993 but the effect reverses sign in 2001 as a
result of China’s fast development. Among the factors, urbanization is the most critical factor: in
1993, the lack of urbanization presses China’s FDI inflow down by 28% of the gap it has with
similar income countries; the magnitude shrinks to 9.5% in 2001. Our most preferred set up,
which is the third panel where the institutional variable used, the rule of law, is significant in the
original regression reported in Table 3. In this set up, the general development factors lift China
per capital FDI above similar countries and account for 30% of the premium.
Fifth, China’s lower degree of openness reduces its FDI attraction, compared to similar
countries. But the effect is rather limited; it presses China’s FDI inflow down the gap it has with
similar income countries by 16% and 13% in 1993 and 2001, respectively. But these magnitudes
are much smaller than that those due to China’s growth track record. Note that the exchange rate
factor has negligible economic significance.
Six, the set of China dummies reveals that the “impulse response” to China’s 1993 strong
signal for economic reforms raises the FDI inflows but the effect is dampened substantially in
2001. In our most preferred set up, reported in the third column panel, the effect all but
disappeared, as we also described earlier.

22
Seven, institutions do not play any significant role in causing the gap between the FDI
inflow to China and similar income countries. Compared with similar income countries, China
has worse limits on executive power but actually a better survey record on the rule of law, the
former negatively and the latter positively impact on China’s inflow FDI premium over similar
income countries. The control for corruption gives a more mixed picture: China was on record
better than similar income country in 1993 and worse in 2001. Given that among the four
variables only the rule of law is significant (see Table 3), we focus on it. The variable contributes
44% to China’s inflow FDI premium over similar countries in 1993 and only 17% in 2001. These
magnitudes, while not negligible, are substantially smaller than the effects due to China’s growth
track record and demography, especially in 2001.
In summary, we find that China's per capita FDI premium over similar income countries
is largely due to its record of high and stable growth rate and its demographic appeal. China’s
fast growth allows it to catch up with similar income countries in infrastructure development, and
urbanization so that these factors do not cause much difference between per capita FDI inflows
into China and similar income countries. The same applies to China’s openness and exchange
rate policies. Finally, while we find that the rule of law attracts FDI, survey record on China’s
rule of law is actually better than similar income countries and it positively impacts on China’s
FDI premium, although the dominant forces are still China’s highly regarded growth record and
demographic appeal.
6. Do institutions matter?
One prime objective of our investigation is on whether FDI allocation is affected by the quality of
government and more broadly institutions. Answer to the question is not obvious. On the one
hand, the law and development literature leads many to believe that a positive relationship exists;
in particular, foreign investors face exacerbated information asymmetry and institutional
discrimination problems. On the other hand, FDI, compared to domestic investment, might be
23
less affected by inadequate institutions because foreign investors may have better access to
capital and may have home authorities’ backing in protecting their rights. Multinationals often
have a large network of subsidiaries and can utilize the extensive system to raise its bargaining
power against rent-extracting politicians and thus its ability to protect property rights (Zhao,
2006). Moreover, while poor institutions discourage domestic capital formation, politicians may
actually show favoritism to foreign direct investors (see Huang (2003) for the case in China).
Our results show a qualified affirmative answer: based on cross country panel data, we
show that both “rule of law” and a good government track record, as registered by high and stable
prior growth, attract FDI. A more conservative interpretation of the result is that, controlling for
past growth record to proxy for expectations of future growth, “rule of law” attracts FDI.
However, FDI inflows are not reliably related to limits on executive power or freedom from
corruption. These mixed results are worthy of further discussion.
The insignificance of freedom from corruption is not inexplicable. Bribes can become
part of the cost of doing business; and for foreign firms with bargaining power, high bribes can be
offset with tax or regulatory privileges. This does not necessarily undermine previous work
relating government transparency and predictability to efficient and effect business operations,
but this effect might be more effectively captured by rule of law, which contains more time
variation in our panel data.
Several important considerations arise in linking institutional variables to FDI inflows.
In the following discussion, China is often an instructive case in point.
How representative are the variables?
The significance of the rule of law and insignificance of executive constraints and responsible
government variables are revealing, for measurement errors can render the relationship between a
proxy and FDI insignificant even if the relationship between the unobservable underlying variable

24
and FDI does exist. In other words, the rule of law may perform well because it more adequately
represents true institutional quality than the other two.
Consider China’s responsible government index: which is invariant at -7.0 (from a range
of -10 to 10) throughout our sample period. Similar income countries’ average score is 4.35; and
needless to say China’s score is poor. Similarly, China scores a 3.0 (from a range of 1 to 7) in
constraints on executive power every year. Similar income countries’ score is 5.42. These data
clearly suggest that throughout our sample period, Chinese leaders face few constraints and little
political competition, even compared to similar income countries.
Now consider China’s rule of law index, which averages 3.12 (from a range of 1 to 6)
between 1982 and 1993, but rises to average 4.86 between 1994 to 2001. Similar income
countries’ scores average only 3.13.
The values of these indexes, benchmarked against averages for other weak institution
countries, warrant suspicion. Why do China’s miserable responsible government and constraints
on executive power scores not match its decent rule of law score? Why are the former two
invariant over time, while the later rises robustly? One possibility is that the first two are based
on “expert assessments” while the “rule of law” score is a survey result.
Obviously, China’s wretched responsible government score derives from being a
communist country. But the Chinese Communist Party (CCP) is far from homogeneous. It has
numerous factions at both the central and provincial levels. This internal competition resembles,
in some ways, the factional disputes in, for example, Japan’s Liberal Democratic Party. Just as
LDP factional struggles constrain the Japanese prime minister’s freedom of action, disagreements
within the CCP increasingly constrain the discretionary power of China’s top leaders. Although
these disputes were present to some degree through most of the history of the People’s Republic,
the secretive and sometimes bloody power struggles of the 20th century seem to be giving way to
more orderly ways of debating policy and handling, for example, the succession of power (see
Keefer, 2006). Perhaps China’s leaders really do not have the same unbridled executive powers

25
wielded by dictators elsewhere in the developing world. Perhaps the construction of neither the
constraints on executive power nor the responsible government variables (section 4) adequately
captures this rising competition within the Party. It seems likely that competition within the CCP
reflects competition to bolster the proceeds of economic growth accruing to various factions of
the population and economic interest groups. If so, China’s responsible government and
constraints on executive power scores might genuinely be “too low”? And if China’s responsible
government and constraints on executive power scores are unrepresentative, might those of other
countries be questioned too?
The rule of law score tells a different story. Again, we use China as a case in point.
While the executive constraints variables are constructed mechanically by applying rules
assembled by experts to variables reflecting the formal structures of governments, the rule of law
variable is a survey result. The former may well miss practical changes of the sort discussed
above, but we must also concede potential problems with survey data. The survey variable, of
necessity, reflects foreign investors’ post-entry rationalizations, not their pre-entry fears. By self-
selection and through the power of cognitive dissonance, the former are generally more positive
than the latter. Foreign investors with very negative views likely stay away, or leave early.
Those with excessively positive views likely enter and stay on, and having done so, rationalize
their decisions ex post. Also, foreigners might select locations within China where the rule of law
is unusually strong; or government officials might treat foreigners with greater respect. In these
ways, survey scores might actually overestimate rule of law and, since foreigners with more
positive ex post views may well have invested more, risk inducing a mechanical positive ex post
relationship between FDI and survey scores. Further distortions might arise because of typical
endogeneity problems.

26
Options on Institutions
Another plausible explanation of insignificance of constraints on executive power is that foreign
corporate investors anticipate increasingly effective constraints on executive power in the near
future. Again, China is a case in point. This is a bet on a country’s future institutional
development, but such bets can be sound investments for their upside potential can greatly
outweigh their downside risks. Indeed many corporate investments derive at least part of their
values from such real options. Option-based investments could also weaken the relationship
between FDI and checks on executive power.
7. Is “Too Much” FDI Flowing into China?
Our primary research question is whether or not China is attracting too much FDI given its well-
known institutional inadequacies and questionable government quality. Our answer is “probably
not.”
We estimate a cross-country FDI model that explains inward FDI using measures of the
strength of constraints on executive power along with more general measures of government
quality and track record at fostering growth plus controls for general development levels and key
country characteristics. In this model, we also incorporate an “impulse” response to China’s
major 1993 economic reforms. We find that China’s FDI inflow aligns well with what our model
predicts – as regards both its level and its relationship to institutional quality and government
track record variables. Although the 1993 reforms clearly induce and FDI impulse response,
which declined significantly over time, a similar phenomenon is evident in former Eastern Bloc
countries. Again, China is unexceptional.
What the regressions reiterate is that FDI is attracted by sound track records of
governments overseeing high and stable growth. This clearly favors China, and predominates in
explaining China’s FDI inflow. High rule of law scores also attract FDI, but China scores little

27
worse in rule of law than other countries at similar income levels. If there is any Chinese
exceptionalism, it is that country’s relatively high and relatively stable prior growth. Parsing the
difference between FDI into China and into countries at similar income levels supports no other
conclusion.
Our results cast doubt on the hypothesis of a uniquely Chinese institutional bias favoring
inward FDI (Huang 2003). This bias is hypothesized because China’s weak institutions may
deter domestic firms from realizing investment opportunities even as tax incentives, special
property rights protection, and other government policies favoring FDI present those same
opportunities to foreign firms. If this were the case, our China dummy should have attracted a
significant positive coefficient, or significantly shifted the slopes of key institutional variables.
This is not observed. Either FDI is not crowding out domestic firms’ investment in China or a
similar phenomenon is sufficiently widespread in other developing economies as to render China
again unexceptional.

28
References Acemoglu, Daron, and Simon Johnson, 2005., “Unbundling Institutions,” Journal of Political
Economy, Vol. 113, (October), pp. 949-995.
Acemoglu, Daron, Simon Johnson, James Robinson, 2005. “Institutions as the Fundamental
Cause of Long-run Growth,” NBER wp 10481, the Handbook of Economic Growth,
Elsevier, North-Holland.
Acemoglu, Daron, Simon Johnson, James Robinson, and Yunyong Thaicharoen, 2003.
“Institutional Causes, Macroeconomic Symptoms: Volatility, Crises, and Growth,”
Journal of Monetary Economics, Volume 50 (January) pp. 49-123.
Alfaro, Laura, Sebnem Kalemli-Ozcan, and Vadym Volosovych, 2005. “Why doesn’t capital
flow from rich to poor countries? An Empirical investigation,” NBER WP 11901.
Allen, Franklin, Jun Qian and Meijun Qian, 2005., “Law, Finance, and Economic Growth in
China,” the Journal of Financial Economics Vol. 77, pp. 57–116.
Buckley, Peter J. and Mark Casson, 1976. The Future of Multinational Enterprise, Holmes &
Meier Publishers Inc. New York.
Caves, Richard, 1971, “International Corporations: the Industrial Economics of Foreign
Investment,” Economica, Vol. 38, (Feb), pp. 1-27.
Caves, Richard, 1995, Multinational Enterprise and Economic Analysis, 2nd edition, Cambridge:
Cambridge University Press.
Coase, Ronald, (1937) "The Nature of the Firm," Economica, Vol. 4, pp. 386-405.
Coughlin, Cletus C., Joseph V. Terza, and Vachira Arromdee, 1991. "State Characteristics and
the Location of Foreign Direct investment within the U. S.," Review of Economics and
Statistics, Vol. 73, p. 675 – 683.
Dunning, J. 1993. Multinational Enterprises and the Global Economy. MA: Addison-Wesley.

29
Dunning, J., and Zhang F. 2007. "Foreign Direct Investment and the Locational Competitiveness
of Countries," Paper presented at the Meeting of Experts on FDI, Technology and
Competitiveness, UNCTAD, Geneva.
Durnev, Artyom, Kan Li, Randall Morck, and Bernard Yeung. 2004. “Capital Markets and
Capital Allocation: Implications for Economies in Transition,” Economics of Transition,
Vol. 12 (4) 2004, 593–634.
Foley, C. Fritz, Mihir A. Desai, and James R. Hines Jr. 2004. "A Multinational Perspective on
Capital Structure Choice and Internal Capital Markets." Journal of Finance, 59, no. 6
(December 2004): 2451-2488.
Froot, Kenneth A. and Jeremy C. Stein, (1991) "Exchange Rates and Foreign Direct Investment
and Imperfect Capital Market Approach," Quarterly Journal of Economics, Nov, p.
1191 – 1217.
Globerman, Steven, and Daniel Shapiro, 2002, “Global Foreign Direct Investment Flows: the
Role of Governance Infrastructure,” Industry Canada.
Griliches, Zvi, and Jerry Hausman. 1986. "Errors in Variables in Panel data" Journal of
Econometrics 31(1), pp. 93-118.
Henry, Peter Blair, 2000. “Do Stock Market Liberalizations Cause Investment Booms?" Journal
of Financial Economics, 58(1-2), 301-34.
Huang, Yasheng, Selling China, Cambridge University Press, 2003.
Keefer, 2006, “Governance and Economic Growth in China and India,” 2006. Worldbank
working paper.
King, Robert G and Ross Levine. 1993. “Finance, Entrepreneurship, and Growth: Theory and
Evidence,” Journal of Monetary Economics 32:3, pp. 513-42.
Knack, Stephen; Rahman, Aminur. 2007. "Donor Fragmentation and Bureaucratic Quality in Aid
Recipients," Journal of Development Economics 83(1), 176-97.

30
La Porta, Rafael, Florencio Lopez-de-Silanes, Andrei Shleifer and Robert Vishny. 1997. “Legal
Determinants of External Finance,” Journal of Finance 52:3, pp. 1131-50.
La Porta, Rafael, Florencio Lopez-de-Silanes, Andrei Shleifer, and Robert Vishny. 1998. “Law
and Finance,” Journal of Political Economy. 106:6, pp. 1113-55.
Lee, Chi-wen Jevons, and Xing Xiao, Tunneling Dividends, 2005 paper presented in Chinese
University of Hong Kong, China Research Conference, Center for Institutions and
Governance and School of Accountancy, CUHK.
Markusen, J.R. 2001. Multinational Firms and the Theory of International Trade. Cambridge, MA:
MIT Press.
Mason, Andrew, 2007. “Demographic Dividends: The Past, the Present, and the Future”, in
Population Change, Labor Markets and Sustainable Growth: Towards a New Economic
Paradigm, Andrew Mason and Mitoshi Yamaguchi (eds) Elsevier Press.
Morck, Randall and Bernard Yeung (1992) “Internalization: An Event Study Test,” Journal of
International Economics, Vol. 33, (August), p. 41-56.
Morck, Randall and Bernard Yeung (1991) “Why Investors Value Multinationality,” Journal of
Business, 64(2): 165-87.
Moulton, Brent. 1986. "Random group effects and the precision of regression estimates," Journal
of Econometrics 32, 385-397.
North, Douglass C. 1990. Institutions, Institutional Change, and Economic Performance,
Cambridge University Press, New York.
Qian, Y., 1995, Reforming corporate governance and finance in China, in Masahiko Aoki and
Hyung-Ki Kim eds., Corporate Governance in Transitional Economies, Washington DC:
World Bank.
Wheeler, David, and Ashoka Mody (1992), “International investment location decisions,”Journal
of International Economics, 33, pp. 57-76.

31
Zaheer, Sri., Mosakowski, Ellen., 1997. The Dynamics of the Liability of Foreignness: A Global
Study of Survival in Financial Services. Strategic Management Journal, 18, 439-464.
Zhao, Minyuan (2006), “Doing R&D in Countries with Weak Intellectual Property Rights
Protection,” Management Science, vol. 56 (7) pp. 1185-1199.

32
Table 1. Key Statistics for China, the Former Eastern Bloc, and Latin America
Figures are averages over 1993 through 2003, and across all countries in Latin American or the former Eastern Bloc.
China Former
Eastern Bloc Latin
American Economic performance
Per capita GDP (US dollars) 761.8 2251.9 2923.8 Average annual GDP growth 8.4% 2.7% 0.7%
Foreign investment Inward FDI per capita (US Dollars) $34.4 $89.6 $87.3 FDI/GDP 4.7% 4.3% 3.1%
Institutional development Respect for the rule of law 4.9 4.5 3.1 Freedom from corruption 2.5 3.3 2.9 Responsible government -7.0 3.0 7.6 Constraints on executive power 3.0 4.4 6.1
“Respect for the rule of law” is an ICRG survey result gauging the state of law and order in each country. It ranges from 1 to 6, with higher values connoting greater general respect for the rule of law. It contains a law component, which captures the strength and impartiality of the legal and political establishment in judicial matters, and an order component, which captures the extent to which residents of a country accept established legal and political institutions as the sole legitimate way to make and implement laws and to adjudicate disputes. We report the average of the variable from 1993 to 2002. We also adopt International Country Risk Guide’s corruption index as our “freedom from corruption” index; this measure is most commonly used in the related economics literature, and also has the widest coverage among standard corruption indices. This variable captures the likelihood that high government officials demand special payments, and the extent to which illegal payments are expected throughout low levels of government. In addition to bringing consistency with previous studies, the broad coverage of countries preserves our sample size. The index takes values ranging from zero (most corrupt) to six (least corrupt); and so falls with rising corruption. “Responsible government” is constructed from the Polity IV database and rates each country on a democracy-autocracy scale. The database has an autocracy variable ranging from 0 to 10, with a larger number indicating a more autocratic government. It also has analogous democracy index ranges from 0 to 10, but with a larger number indicating more democratic government. Our responsible government variable is the democracy index minus the autocracy index, a measure called polity2 in the database. It captures the extent to which a political regime is responsible to its people, the larger the number the stronger the democratic checks on the political system. “Constraints on executive power” is also from the Polity IV database, and ranges from 1 to 7 with higher values indicating stronger checks on heads of government. It is composed of indexes that gauge barriers to political entry (monarchy to dictatorship to open entry), the nature of political transitions (orderly or military), and the selection of successors (genetics to appointment to open election).

Table 2. Summary statistics China and Comparison Countries
Countries other
than China China before ‘93 China after ‘93
Similar income countries after‘93
variable mean sd mean Sd mean sd mean sd Foreign Direct Investment FDI per capita $99.62 157.47 $1.33 2.75 $33.9 3.51 $23.09 30.45 Limits on Executive Power Executive constraints 5.03 2.3 2.42 0.66 3 0 5.42 2.44 Responsible government 3.98 6.98 -7.58 0.66 -7 0 4.35 7.28 General Institutional quality Rule of law 3.63 1.64 3.12 0.41 4.86 0.33 3.13 0.91 Freedom from corruption 3.49 1.46 3.88 0.42 2.51 1.31 2.9 0.96 Government track record Growth trend (per capita GDP) 1.27 2.78 6.01 2.52 8.31 1.49 0.81 2.89 GDP growth standard dev 0.06 0.05 0.12 0.08 0.04 0.03 0.06 0.05 General development Log of per capita GDP 7.78 1.58 5.04 0.55 6.65 0.27 6.64 0.25 Log(mean years of school) 1.47 0.72 1.37 0.15 1.71 0.03 1.37 0.37 Telephones per 1000 people 162.76 199.24 3.53 2.16 86.46 63.12 28.01 23.24 urban share of population 54.59 22.63 20.07 3.84 34.53 3.23 41.41 14.22 Other characteristics log(population) 2.63 1.32 6.8 0.18 7.12 0.03 2.75 1.34 adult share of population 58.97 6.5 59.45 4.32 67.96 0.72 56.17 4.26 trade_GDP1 61.39 33.7 19.74 10.9 43.88 5.79 70.96 27.37 exchange rate 0.61 0.41 0.32 0.12 0.98 0.09 0.79 0.27
Note. Similar income countries are defined as countries whose GDP per capita is bounded above and below by the maximum and minimum levels of China’s GDP per capita between 1993 and 2001.

34
Table 3. Regressions Explaining FDI Allocation across Countries Dependent variable in all regressions is log constant (0.5) plus per capita FDI inflow.
(1) (2) (3) (4) (5) (6) (7) (8) Limits on Executive Power Responsible government 0.031 0.032 (0.91) (0.94) Executive constraints 0.049 0.052 (0.53) (0.56) General gov quality Rule of Law 0.239 0.236 (3.21)*** (3.17)*** Freedom from corruption 0.088 0.089 (0.99) (0.98) Government track record Growth trend (per capita GDP) 0.172 0.171 0.170 0.169 0.102 0.102 0.114 0.114 (3.82)*** (3.79)*** (3.62)*** (3.58)*** (2.89)*** (2.89)*** (3.08)*** (3.08)*** GDP growth standard dev. -3.089 -3.085 -3.610 -3.613 -6.198 -6.231 -6.064 -6.097 (1.77)* (1.75)* (2.04)** (2.03)** (3.28)*** (3.29)*** (3.12)*** (3.13)*** China dummies China 0.184 -0.267 -0.035 -0.450 0.239 0.002 0.328 -0.095 (0.20) (0.30) (0.04) (0.54) (0.54) (0.00) (0.70) (0.19) China post 1993 1.723 1.661 1.076 1.420 (4.98)*** (4.85)*** (4.44)*** (6.79)*** China post 1993 trend -0.105 -0.114 -0.149 -0.145 (4.10)*** (4.26)*** (5.65)*** (3.10)*** General development Log of per capita GDP 0.069 0.038 0.093 0.065 0.153 0.151 0.190 0.184 (0.17) (0.09) (0.22) (0.15) (0.52) (0.51) (0.63) (0.61) Log(mean years of school) -0.247 -0.231 -0.261 -0.248 0.181 0.181 0.139 0.140 (0.72) (0.67) (0.72) (0.68) (0.73) (0.73) (0.53) (0.54) Telephones per 1000 people 0.002 0.002 0.002 0.002 0.001 0.001 0.002 0.002 (1.11) (1.17) (1.05) (1.10) (0.98) (0.99) (1.28) (1.30) urban share of population 0.030 0.030 0.029 0.030 0.019 0.019 0.018 0.018 (2.06)** (2.09)** (1.99)* (2.02)** (1.77)* (1.78)* (1.64) (1.65) Other characteristics Log of population -0.225 -0.226 -0.235 -0.236 -0.170 -0.170 -0.177 -0.178 (1.57) (1.57) (1.60) (1.60) (1.47) (1.47) (1.44) (1.44) adult share of population 0.064 0.063 0.074 0.073 0.045 0.045 0.055 0.055 (1.23) (1.22) (1.43) (1.42) (1.27) (1.27) (1.52) (1.53) trade_GDP-1 0.004 0.004 0.004 0.004 0.008 0.008 0.008 0.008 (0.85) (0.84) (0.80) (0.78) (2.29)** (2.28)** (2.25)** (2.24)** exchange rate -0.284 -0.291 -0.288 -0.293 -0.302 -0.305 -0.190 -0.197 (0.78) (0.80) (0.78) (0.79) (0.85) (0.85) (0.50) (0.52) Year 0.050 0.048 0.053 0.051 0.076 0.076 0.083 0.082 (2.93)*** (2.74)*** (3.03)*** (2.84)*** (4.85)*** (4.81)*** (5.01)*** (4.97)*** Observations 1137 1137 1125 1125 1554 1554 1554 1554 R-squared 0.49 0.49 0.48 0.49 0.54 0.54 0.53 0.53
*, **, and *** represent statistical significance at the 10, 5, and 1 percent. t-stat in parentheses. Standard errors are adjusted for country-level clustering. The constant 0.5 is being added to FDI per capita to take into account the fact that some FDI inflows have negative value.

35
Table 4. Regressions Explaining FDI Allocation across Countries Dependent variable in all regressions is log constant (0.5) plus per capita FDI inflow.
(1) (2) (3) (4) Limits on Executive Power Responsible government 0.002 (0.08) Executive constraints -0.021 (0.30) General government quality Rule of law 0.250 (3.34)*** Freedom from corruption 0.083 (0.90) Government track record Growth trend (per capita GDP) 0.178 0.181 0.103 0.116 (4.11)*** (4.07)*** (2.89)*** (3.13)*** GDP per capita growth standard deviation -3.991 -4.335 -6.537 -6.390 (2.58)** (2.69)** (3.50)*** (3.32)*** China effects China -1.081 -1.188 -0.050 -0.120 (1.52) (1.75)* (0.11) (0.23) China post-1993 1.554 1.516 1.077 1.443 (4.95)*** (4.85)*** (4.43)*** (6.95)*** China post-1993 trend -0.094 -0.097 -0.146 -0.147 (3.82)*** (4.01)*** (5.39)*** (3.05)*** Eastern Bloc dummies Eastern Bloc -4.199 -4.564 -3.512 -3.110 (11.71)*** (12.87)*** (10.83)*** (8.72)*** Eastern Bloc post-1990 5.859 6.226 5.073 5.115 (14.78)*** (18.40)*** (27.42)*** (22.93)*** Eastern Bloc post-1990 trend -0.169 -0.174 -0.144 -0.192 (4.34)*** (4.40)*** (3.84)*** (4.22)*** General development Log of per capita GDP 0.051 0.053 0.153 0.191 (0.12) (0.12) (0.51) (0.63) Log(mean years of schooling) -0.031 -0.004 0.191 0.142 (0.11) (0.01) (0.77) (0.54) Telephones per 1000 people 0.001 0.001 0.001 0.002 (0.69) (0.66) (0.80) (1.21) urban share of population 0.024 0.024 0.019 0.018 (1.77)* (1.71)* (1.78)* (1.65) Other Characteristics Log of population, adult share of population, Trade/GDPt-1, exchange rate, year
yes
yes
yes
yes
Observations 1137 1125 1554 1554 R-squared 0.52 0.53 0.55 0.54
Note. *, **, and *** represent statistical significance at the 10, 5, and 1 percent. t-stat in parentheses. Standard errors are adjusted for country-level clustering. The constant 0.5 is being added to FDI per capita. The coefficients of "other characteristics" are similar to in Table and unreported.
36
Table 5. Regressions Explaining FDI Allocation across Countries Dependent variable in all regressions is log constant (0.5) plus per capita FDI inflow. (1) (2) (3) (4) (5) Expected GDP per capita growth 0.172 0.170 0.102 0.102 0.102 (3.83)*** (3.62)*** (2.89)*** (2.89)*** (2.89)*** Expected GDP per capita growth * China dummy 0.023 (0.46) volatility in GDP per capita growth -3.089 -3.610 -6.215 -6.189 -6.229 (1.77)* (2.05)** (3.28)*** (3.27)*** (3.29)*** GDP per capita growth volatility * China dummy 5.258 (0.81) Responsible government 0.031 (0.91) Responsible government * China dummy -0.026 (0.20) Executive constraints 0.049 (0.53) Executive constraints * China dummy -0.011 (0.04) Rule of law 0.238 0.239 0.238 (3.20)*** (3.22)*** (3.21)*** Rule of law * China dummy 0.076 (0.73) Observations 1137 1125 1554 1554 1554 R-squared 0.49 0.48 0.54 0.54 0.54
Note. *, **, and *** represent statistical significance at the 10, 5, and 1 percent. t-stat in parentheses. Standard errors are adjusted for country-level clustering. The constant 0.5 is being added to FDI per capita to take into account the fact that some FDI inflows have negative value. We also control for other variables that are controlled in Table 3.

37
Table 6. The relative importance of various factors in explaining China's FDI premium over countries with similar GDP per capita
Institutional variable is:
responsible government
executive constraint
rule of law
control of corruption
china 1993 vs similar
countries
china 2001 vs similar
countries
china 1993 vs similar
countries
china 2001 vs similar
countries
china 1993 vs similar
countries
china 2001 vs similar
countries
china 1993 vs similar
countries
china 2001 vs similar
countries Difference in ln(FDI per capita) 1.01 1.21 1.01 1.21 1.01 1.21 1.01 1.21
Government track record (1) Expected growth 103.9 91.4 102.3 89.9 62.1 54.6 69.4 61 (2) GDP growth std. dev. -8.1 11.9 -9.5 13.9 -16.3 24 -16 23.5 (1+2) 95.8 103.3 92.8 103.8 45.8 78.6 53.4 84.5 (3)adult share of pop. 69.4 62.6 80 72.1 49.4 44.6 60.3 54.4 (1+2+3) 165.2 165.8 172.8 175.9 95.2 123.2 113.7 138.9
(4) China dummy effects total 143.4 50.7 119.4 24.6 106.3 -9.7 130.5 13.8
General development (5) ln(GDP per capita) -1.6 0.6 -2.8 1 -6.4 2.2 -7.9 2.7 (6) Log(mean years of school) -6.4 -7.2 -6.9 -7.7 5 5.6 3.9 4.4 (7) Telephones per 1000 -2.9 20 -2.8 19 -1.5 10.2 -2.2 15.2 (8) urban share of population -34.9 -11.8 -34.4 -11.6 -22.2 -7.5 -21 -7.1 (5+6+7+8) -45.8 1.6 -46.9 0.7 -25.1 30.3 -27.2 15.2
Other characteristics (9) ln(population) -96.1 -82.2 -100.5 -86 -72.4 -62 -75.7 -64.8
(10) trade_GDPt-1 -10.5 -8.6 -9.8 -8 -21.7 -17.6 -22.1 -17.9 (11) exchange rate 2.8 -5 2.8 -5 2.9 -5.2 1.9 -3.4 (9+10+11) -103.8 -68.6 -107.5 -99.0 -91.2 -84.8 -95.9 -86.1
Institution variable -36.1 -30.4 -12.5 -10.5 43.6 17 14 -14
Note. The numbers, starting from the second row with numbers, are percentage.

38
Figure 1. Foreign Direct Investment Inflows to China, the US and the World Foreign direct investment inflow is expressed as per capita (in US dollars deflated to 2000).


