Innovations in Ammonia
Trevor BrownNH3 Fuel Association (Ammonia Energy Association)
US Department of Energy, H2@Scale R&D Consortium Kick-Off Meeting Chicago, August 1, 2018
1

Ammonia: >Half Today’s Hydrogen Market
2
• Ammonia production, 2017:183 million metric tons
• Hydrogen-to-ammonia, 2017:32.6 billion kg
• Hydrogen is captive: SMR / POX from gas, coal, etc
• Ammonia is captive:Urea, nitric acid, AN, UAN, etc
• 80% fertilizer, ~2% CAGR<10% traded: 16-17 million tons

Ammonia History: Energy Efficiency
0
20
40
60
80
100
120
1910 1925 1940 1955 1970 1985 2000 2015
MW
h pe
r met
ric to
n am
mon
ia
Year
Ammonia Technology Evolution, 1910-2015Various sources, AmmoniaIndustry.com, March 2018
3

Ammonia Future : Diminishing Returns
• Potential 25% improvement: in energy efficiency:Asset turnover, oldnewFeedstocks, coalgas
• At best, 2050 global average could be similar to 2015 BAT
• Haber-Bosch is optimized for energy efficiency already
• 25% improvement fails to meet industry targets
Global average
HB Theoretical Minimum
7.78 Optimal
6.81 Low
13.72 High
0
2
4
6
8
10
12
14
2000 2010 2020 2030 2040 2050
MW
h pe
r met
ric to
n am
mon
ia
Year
Ammonia Technology Evolution, 2000-2050IFA Benchmarks, AmmoniaIndustry.com, March 2018
4

Energy Efficiency is not Sufficient
• Best Available Technology (BAT) is not good enough: we need new technologies
• But new technologies do not improve energy efficiency …
• Therefore “energy efficiency” cannot be the only driver of innovation and investment
• A diverse technology portfolio also rewards carbon efficiency
HB Theoretical Minimum
7.78 BAT SMR
9.72 BAT Nptha
10.56 BAT HFO
11.67 BAT Coal
7.22 SMR 20507.50 Electroch./
11.67 Biomass
8.61 Electrolys.
6.94 Nuclear /7.50 SMR-CCS
0
2
4
6
8
10
12
14
2000 2010 2020 2030 2040 2050
MW
h pe
r met
ric to
n am
mon
ia
Year
Ammonia Technology Evolution, 2000-2050IFA Benchmarks / CEFIC, AmmoniaIndustry.com, March 2018
5

Green Ammonia Technology Portfolio
• Low carbon technologies become competitive when carbon efficiency is rewarded
2003Global Average
2050
BAT SMR
BAT Naphtha
BAT HFO
BAT Coal
SMR 2050Electrochemical
Biomass 2050
Electrolys. 2050
Nuclear
SMR-CCS
0
2
4
6
8
10
12
14
0.00 0.50 1.00 1.50 2.00 2.50 3.00 3.50 4.00
MW
h pe
r met
ric to
n am
mon
ia
tons CO2 per metric ton ammonia
Ammonia Technology Evolution, 2000-2050IFA Benchmarks / CEFIC, AmmoniaIndustry.com, March 2018
6

Showa Denko: Low-Carbon Ammonia (2003)
• Kawasaki, Japan• 65% hydrogen is from recycled plastic
(i.e., 100% feedstock but no fuel)• Commercial:
Ecoann™ ammonia sold as premium green deNOx product
“Approved and rated high as ‘eco-friendly goods for procurement’ by major electric power companies.”
7

U.Minnesota: Wind-to-Ammonia Pilot (2013)
• Morris, MN, USA• R&D innovation:
Scaling down Haber-Boschto match wind
8
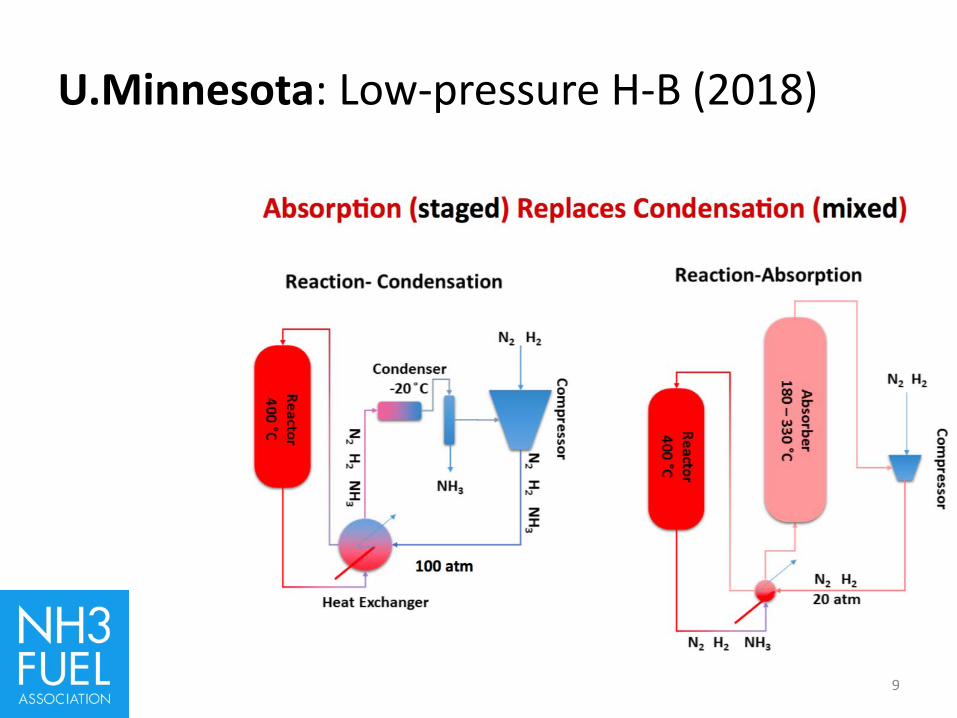
U.Minnesota: Low-pressure H-B (2018)
9

FREA: Renewable Ammonia Pilot (Q2 2018)
• Fukushima, Japan• R&D innovation:
Catalyst development for low-pressure electrolytic hydrogen
10

Siemens: Green Ammonia Pilot (Q2 2018)
• Oxford, UK• R&D innovation:
Business Models: ancillary grid services (DSM), energy storage, electrofuels, electricity markets
11

Siemens: Green Ammonia Pilot (Q2 2018)
12

Haldor Topsoe: SOEC+HB Pilot (2025)
• Denmark• R&D innovation:
Electrification of industry, SMR asset revamp
13

ThyssenKrupp: Hydrogen Utility Pilot (2020)
• Port Lincoln, South Australia
• R&D innovation:Market development for ammonia exports as energy commodity
14

ThyssenKrupp: Modular Ammonia (2018)
• Port Lincoln, South Australia
• R&D innovation:Market development for ammonia exports as energy commodity
15

ThyssenKrupp: Offshore Ammonia (concept)
16

Yara / BASF: Freeport Ammonia (Q2 2018)
• Freeport, TX• R&D innovation:
Byproduct hydrogen from Dow’s 2017 ethylene cracker
• 170 million scf per day, H2750,000 tons per year, NH3
• $600 million plant capex25% reduction v SMR
17
Source: Amgad Elgowainy presentation, H2@Scale Workshop (May 2017) https://www.energy.gov/sites/prod/files/2017/05/f34/fcto_may_2017_h2_scale_wkshp_elgowainy.pdf

Innovations in Ammonia
• Nitrogen Commodity Hydrogen Commodity• Homogenous Commodity Heterogeneous Commodity
$ Price Premium = $ Local Function[Carbon Footprint] • Green Ammonia (Energy Markets) Green Ammonia (Ag Markets)
Low-Carbon Leakage: supply creates demand • Green Hydrogen demand:
32.6 billion kg / year, installed base 2017 (feedstock only)0.65 billion kg / year, annual additions (BAU @ 2% CAGR)
https://ammoniaindustry.comhttps://nh3fuelassociation.org
18

ReferencesAmmonia Market: US Geological Survey, Mineral Yearbook, Nitrogen (2018). https://minerals.usgs.gov/minerals/pubs/commodity/nitrogen/. Global Usage of Hydrogen chart: Shell Hydrogen Study, 2017. www.shell.de/h2studyHaber-Bosch Efficiency & Emissions: Historical / technical limit: Technology Roadmap: Energy and GHG Reductions in the Chemical Industry via Catalytic Processes, IEA / ICCA / DECHEMA (2013) https://www.iea.org/publications/freepublications/publication/Chemical_Roadmap_2013_Final_WEB.pdf. 2009 BATs: Industrial Efficiency Technology Database, citing International Fertilizer Association: Fertilizers, Climate Change and Enhancing Agricultural Productivity Sustainably (2009) http://ietd.iipnetwork.org/content/ammonia#benchmarks. IFA Benchmarks (2003, 2009, 2015) http://fertilizer.org. 2050 technologies: CEFIC (The European Chemical Industry Council): European Chemistry for Growth (2013) http://www.cefic.org/Documents/RESOURCES/Reports-and-Brochure/Energy-Roadmap-The%2520Report-European-chemistry-for-growth.pdfShowa Denko: http://www.sdk.co.jp/english/news/2015/14469.htmlUniversity of Minnesota: Demonstration plant: West Central Research and Outreach Center, https://wcroc.cfans.umn.edu/research-programs/renewable-energy/wind-hydrogen . Low-pressure R&D: Malmali et al, Lower Pressure Ammonia Synthesis, AIChE/NH3 Fuel Conference (2017) https://nh3fuelassociation.org/2017/10/01/lower-pressure-ammonia-synthesis/ and https://ammoniaindustry.com/improvement-of-haber-bosch-adsorption-vs-absorption/FREA: Fukushima Renewable Energy Institute – AIST (2018). Photo by Trevor Brown. Siemens: Wilkinson: The Role of “Green” Ammonia in Decarbonising Energy Systems, AIChE/NH3 Fuel Conference (2017) https://nh3fuelassociation.org/2017/09/26/the-role-of-green-ammonia-in-decarbonising-energy-systems-practical-demonstration-and-economic-considerations/. Photo by Siemens.Haldor Topsoe: Pat Han presentation, NH3 Event (May 2018) http://nh3event.comThyssenKrupp / Hydrogen Utility: Government of South Australia news release (2018) https://www.premier.sa.gov.au/index.php/tom-koutsantonis-news-releases/8677-green-hydrogen-facility-to-be-constructed-near-port-lincoln and https://ammoniaindustry.com/renewable-ammonia-demonstration-plant-announced-in-south-australia/ Markus Will presentation, NH3 Event (May 2018) http://nh3event.com. Pilot project: https://ammoniaindustry.com/thyssenkrupps-green-hydrogen-and-renewable-ammonia-value-chain/ and https://www.thyssenkrupp-industrial-solutions.com/en/press_detail_48384.html. Offshore Ammonia image by ThyssenKrupp. Yara / BASF: https://ammoniaindustry.com/yara-and-basf-open-low-carbon-ammonia/. Byproduct hydrogen emissions: Amgad Elgowainypresentation, H2@Scale Workshop (May 2017) https://www.energy.gov/sites/prod/files/2017/05/f34/fcto_may_2017_h2_scale_wkshp_elgowainy.pdf
19


