
Business
Update
DECEMBER 2017
OU
R P
OTE
NTI
AL

© Fonterra Co-operative Group Ltd.Page 2
Disclaimer
This presentation may contain forward-looking statements and projections. There can be no certainty of outcome in relation to the matters to which the
forward-looking statements and projections relate. These forward-looking statements and projections involve known and unknown risks, uncertainties,
assumptions and other important factors that could cause the actual outcomes to be materially different from the events or results expressed or
implied by such statements and projections. Those risks, uncertainties, assumptions and other important factors are not all within the control of
Fonterra Co-operative Group Limited (Fonterra) and its subsidiaries (the Fonterra Group) and cannot be predicted by the Fonterra Group.
While all reasonable care has been taken in the preparation of this presentation none of Fonterra or any of its respective subsidiaries, affiliates and
associated companies (or any of their respective officers, employees or agents) (Relevant Persons) makes any representation, assurance or
guarantee as to the accuracy or completeness of any information in this presentation or likelihood of fulfilment of any forward-looking statement or
projection or any outcomes expressed or implied in any forward-looking statement or projection. The forward-looking statements and projections in
this report reflect views held only at the date of this presentation.
Statements about past performance are not necessarily indicative of future performance.
Except as required by applicable law or any applicable Listing Rules, the Relevant Persons disclaim any obligation or undertaking to update any
information in this presentation.
This presentation does not constitute investment advice, or an inducement, recommendation or offer to buy or sell any securities in Fonterra or the
Fonterra Shareholders’ Fund.

© Fonterra Co-operative Group Ltd.Page 3
10
20
30
40
50
60
70
80
90
100
Jun Jul Aug Sep Oct Nov Dec Jan Feb Mar Apr May
Vo
lum
e (
m l
itre
s/d
ay)
Low spring volumes – improved peak collectionMilk collection forecast for the season maintained
Season Total Milk Solids (kgMS) Peak Day Milk
— 2015/16 1,566m (down 3%) 87m litres
— 2016/17 1,526m (down 3%) 80m litres
— 2017/18F 1,525m (flat) 82m litres
• Wet conditions have
impacted milk production
volumes through spring
• Volumes recovered in
October with the quarter
in line with last season
• Forecast reduced to
1,525m kgMS, same as
last season
• Lower production
volumes impacted costs
and sales this quarter
© Fonterra Co-operative Group Ltd.Page 4
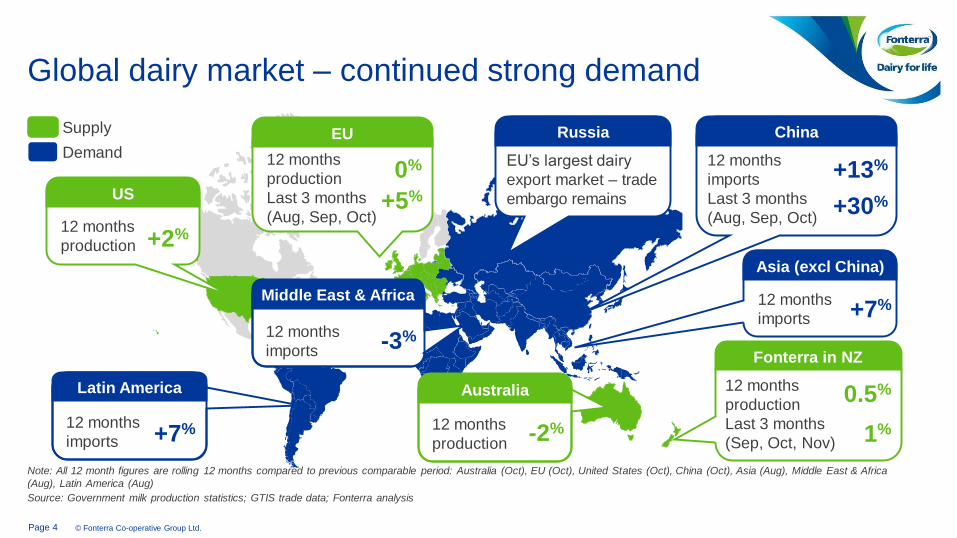
Global dairy market – continued strong demand
Note: All 12 month figures are rolling 12 months compared to previous comparable period: Australia (Oct), EU (Oct), United States (Oct), China (Oct), Asia (Aug), Middle East & Africa
(Aug), Latin America (Aug)
Source: Government milk production statistics; GTIS trade data; Fonterra analysis
Demand
Supply Russia
EU’s largest dairy
export market – trade
embargo remainsUS
12 months
production +2%
Australia
12 months
production-2%
Fonterra in NZ
12 months
production
Last 3 months
(Sep, Oct, Nov) 1%
0.5%
Asia (excl China)
12 months
imports +7%Middle East & Africa
12 months
imports -3%
EU
12 months
production
Last 3 months
(Aug, Sep, Oct)
0%
+5%
Latin America
12 months
imports +7%
China
12 months
imports
Last 3 months
(Aug, Sep, Oct)
+13%
+30%

© Fonterra Co-operative Group Ltd.Page 5
1,500
2,500
3,500
4,500
5,500
Aug Sep Oct Nov Dec Jan Feb Mar AprMay Jun Jul Aug Sep Oct
2,000
4,000
6,000
Aug Sep Oct Nov Dec Jan Feb Mar AprMay Jun Jul Aug Sep Oct
Products informing the milk price Other key products
Note: All prices in US dollars per MT; Changes shown for FY17 and Q1 FY18 respectively
Source: GDT data
Dairy prices at higher levelsCurrently neutral outlook for stream returns
Butter
Cheddar
Rennet Casein
+109%
Whole Milk Powder
+38% -4%
-0.2%
2,000
3,000
4,000
5,000
6,000
Aug Sep Oct Nov Dec Jan Feb Mar AprMay Jun Jul Aug Sep Oct
4,000
6,000
8,000
10,000
12,000
Aug Sep Oct Nov Dec Jan Feb Mar AprMay Jun Jul Aug Sep Oct
+3%
+42% +4%
-8%

© Fonterra Co-operative Group Ltd.Page 6
Continued focus on more volume to higher value
Note: Wheel shows percentage of total YTD external sales (LME)
Deliver on Foodservice potential
Selectively invest in milk pools
Grow our active living business
Develop leading positions in paediatric & maternal nutrition
Optimise NZ milk
1
Alignour business and organisation
Build and growbeyond our current consumer positions
3
2
4
5
6
7
DIRA
GDT
Advanced
Ingredients
Foodservice
Consumer
YTD
3.9b
LME
• Ingredients
– Lower sales due to low
opening inventory and
production phased to the end
of the first quarter
– Advanced Ingredients target of
additional 400m LME remains
• Consumer & Foodservice
– Slightly below first quarter
last year
– Growth in Greater China and
Asia volumes
– Full year target of an additional
400m LME remains
Base
Ingredients

© Fonterra Co-operative Group Ltd.Page 7
FY18 Q1 performance summary
1. 2017 comparative impacted by one off sale of inventory below cost – gross margin excluding this input was 4%.
Note: Volume is in billion LME. All changes are expressed relative to the first quarter of FY17
$142M3.9B $4.0B
CAPEX
Consumer & Foodservice
Volume (LME) 1.3B
Gross Margin 24.0%
Ingredients
Volume (LME) 3.6B
Gross Margin 8.1%
VOLUME (LME) REVENUE
20% 4% 22%
16.7%
GROSS MARGIN
$636M
OPEX
2% FROM 21.9%
FROM 12.1% FROM 31.2%
DOWN 19% DOWN 3%
China Farms
Volume (LME) 0.1B
Gross Margin¹ 7.3%FROM -11.6%
UP 6%

© Fonterra Co-operative Group Ltd.Page 8
4.5 3.6
Q1 FY17 Q1 FY18
• Sales volumes lower due to low product levels
– Record low opening inventory
– Delayed product availability due to lower milk
collection volumes early in the quarter
Value• Lower margin percentage due to higher
commodity prices
• Margins in line with second half of last year
– Lower regulated return due to a decrease in the milk
price model cost of capital
– Pressure from fixed costs given lower volumes
• Slow start to price achievement
• Strong performance from Australia
Volume (B LME)¹ Volume
Gross Margin (%)
1. Includes sales to other strategic platforms.
Note: Volume is in billion LME. All changes are expressed relative to the first quarter of FY17
IngredientsChallenging first quarter
(19%)
12.1%8.1%
Q1 FY17 Q1 FY18

© Fonterra Co-operative Group Ltd.Page 9
1.3 1.3
Q1 FY17 Q1 FY18
• Slight decline for the period with higher prices affecting
consumer behaviour
• Greater China and Asia volumes both up
• Full year target of moving an additional 400m LME into
higher value products remains
Value• Higher input costs continue to put pressure on margins
• Gross margin percentage up on Q4 FY17 but down on
Q1 FY17
Volume (B LME)¹ Volume
Gross Margin (%)
1. Includes sales to other strategic platforms; Q1 FY17 included sales from discontinued / transferred business in Oceania – on a like for like basis, Consumer and Foodservice volumes
declined 2%
Note: Volume is in billion LME. All changes are expressed relative to the first quarter of FY17
Consumer & FoodserviceSolid first quarter
(3%)
31.2%24.0%
Q1 FY17 Q1 FY18

© Fonterra Co-operative Group Ltd.Page 10
Asia
Oceania Latin America
1. Q1 FY17 included sales from discontinued/transferred business in Oceania – on a like-for-like basis, Oceania volumes declined 8%.
Note: All volumes include intercompany sales. Volume is in million LME. All changes are expressed relative to the first quarter of FY17
Consumer and FoodserviceContinued growth in Greater China and Asia
271 273
Q1 FY17 Q1 FY18
184 181
Q1 FY17 Q1 FY18
469 412
Q1 FY17 Q1 FY18
414 427
Q1 FY17 Q1 FY18
Volume¹ Volume(12%) (1%)
Volume Volume3% 1%
23%
Gross Margin
FROM 33%
18%
Gross Margin
FROM 24%
29%
Gross Margin
FROM 39%
29%
Gross Margin
FROM 33%
Greater China
© Fonterra Co-operative Group Ltd.Page 11
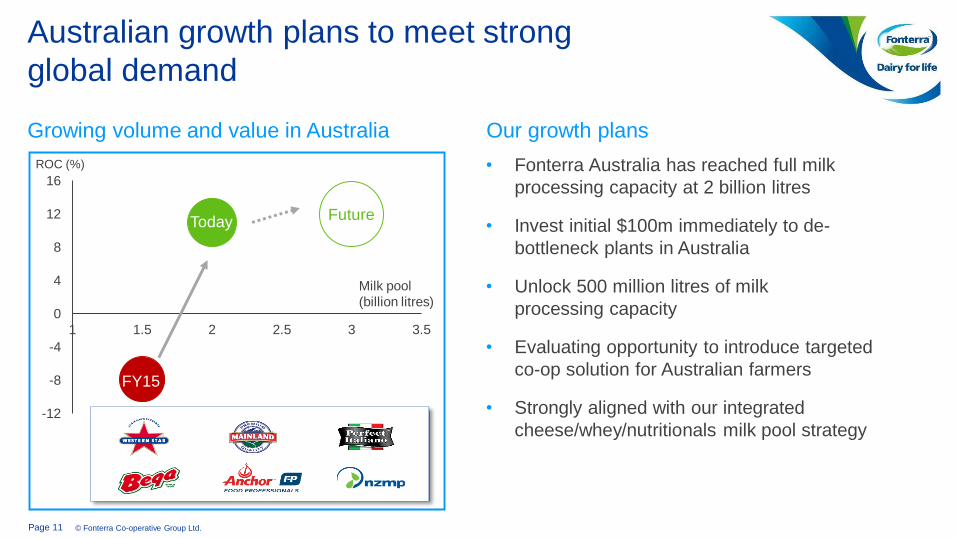
Australian growth plans to meet strong
global demand
-12
-8
-4
0
4
8
12
16
1 1.5 2 2.5 3 3.5
• Fonterra Australia has reached full milk
processing capacity at 2 billion litres
• Invest initial $100m immediately to de-
bottleneck plants in Australia
• Unlock 500 million litres of milk
processing capacity
• Evaluating opportunity to introduce targeted
co-op solution for Australian farmers
• Strongly aligned with our integrated
cheese/whey/nutritionals milk pool strategy
Growing volume and value in Australia Our growth plans
ROC (%)
Milk pool
(billion litres)
Today Future
FY15

© Fonterra Co-operative Group Ltd.Page 12
Page 12Confidential to Fonterra Co-operative Group
Outlook
© Fonterra Co-operative Group Ltd.Page 13
Outlook for balance of 2018
• Forecast Farmgate Milk Price of $6.40 per kgMS
– Global demand remains stable
– Increased global supply placing pressure on prices, as reflected in GDT events
since September
– NZD weakening against USD, has provided some offset
– Full year NZ milk collection forecast same as last year, 3% below initial forecast
• Reduced forecast earnings from 45-55 cents to 35-45 cents per share
– Following the outcome of the WPC80 arbitration with Danone
– Half year earnings expected to be down on last year with earnings weighted towards
the second half of the year
– Stream returns to remain neutral
– Expect some strengthening in Consumer and Foodservice margins later in the year

© Fonterra Co-operative Group Ltd.Page 14
Glossary
AMF
Anhydrous Milk Fat
BMP
Butter Milk Powder
Base Price
Prices used by Fonterra’s sales team as referenced
against GDT prices and other relevant benchmarks
DIRA
Dairy Industry Restructuring Act 2001 (New Zealand)
GDT
GlobalDairyTrade, the online provider of the twice
monthly global auctions of dairy ingredients
Gearing Ratio
Economic net interest bearing debt divided by
economic net interest bearing debt plus equity
excluding cash-flow hedge reserves
Farmgate Milk Price
The price for milk supplied in New Zealand to
Fonterra by farmer shareholders
Fluid and Fresh Dairy
The Fonterra grouping of skim milk, whole milk and
cream – pasteurised or UHT processed, concentrated
milk products and yoghurt
kgMS
Kilogram of milk solids, the measure of the amount of
fat and protein in the milk supplied to Fonterra
LME (Liquid Milk Equivalent)
A standard measure of the amount of milk (in litres)
allocated to each product based on the amount of fat
and protein in the product relative to the amount of fat
and protein in standardised raw milk
Non-Reference Products
All dairy products, except for Reference, produced by
the NZ Ingredients business
Price Achievement
Revenue achieved over the base price less
incremental supply chain costs above those set out in
the Milk Price model
Reference Products
The dairy products used in the calculation of the
Farmgate Milk Price, which are currently WMP, SMP,
BMP, butter and AMF
Regulated Return
The earnings component of Milk Price generated from
a WACC return on an assumed asset base
Season
New Zealand: A period of 12 months to 31 May in
each year
Australia: A period of 12 months to 30 June in
each year
SMP
Skim Milk Powder
Stream Returns
The gross margin differential between Non-Reference
Product streams and the WMP stream (based on
base prices)
WACC
Weighted Average Cost of Capital
WMP
Whole Milk Powder
Acronyms and Definitions

© Fonterra Co-operative Group Ltd.Page 15
Glossary
Ingredients
The Ingredients platform comprises bulk and specialty dairy products such as milk powders, dairy fats, cheese and proteins manufactured in New Zealand, Australia,
Europe and Latin America, or sourced through our global network, and sold to food producers and distributors in over 140 countries. It also includes Fonterra Farm
Source™ retail stores.
Consumer
The Consumer platform comprises branded consumer products, such as powders, yoghurts, milk, butter, and cheese. Base products are sourced from the ingredients
business and manufactured into higher-value consumer dairy products.
Foodservice
The Foodservice platform comprises a range of branded products and solutions for commercial kitchens, including bakery butter, culinary creams, and cheeses.
China Farms
The China Farms platform comprises the farming operations in China, which produce high quality fresh milk for the Chinese market.
Fonterra Strategic Platforms


