
Influence of Soil Surface Sealing and
Hydrophobicity on Water Infiltration
Vincenzo Alagna
Tutor:
Prof. M. Iovino
Co-tutor:
Prof. G. Giordano

Problem definitions
Infiltration is the physical process involving downward movement of water through
the boundary surface where the atmosphere interfaces with the soil. The
phenomenon has many important implications:
partition of rainfall between infiltration and runoff
profile recharge rate
solute transport
Furthermore, it is essential to agricultural production.
The unimpeded flow of water through the soil depends by its transmission properties
which are related to soil texture and structure but also influenced by soil water content
and organic matter
Organic
matter
Weak aggregates
stability
+
Raindrops kinetic
energy
Hydrophobic organic
compounds
+
Dry conditions
Surface
sealing or
crust
Soil water
repellency
(SWR)
Hydrological
processes
• Runoff
• Soil erosion
Problem definitions
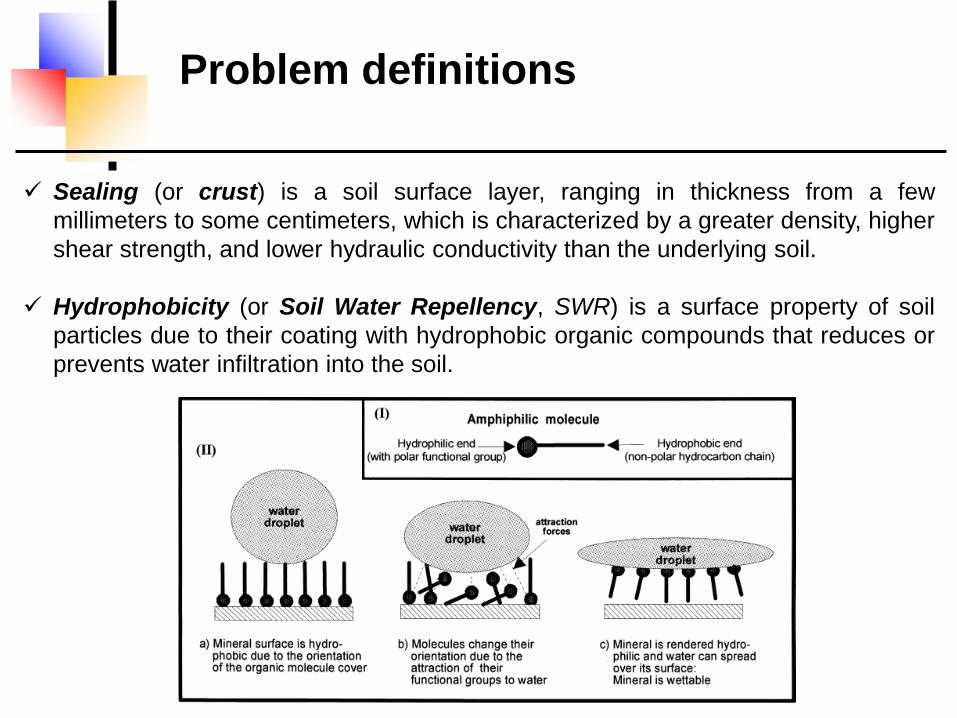
Sealing (or crust) is a soil surface layer, ranging in thickness from a few
millimeters to some centimeters, which is characterized by a greater density, higher
shear strength, and lower hydraulic conductivity than the underlying soil.
Hydrophobicity (or Soil Water Repellency, SWR) is a surface property of soil
particles due to their coating with hydrophobic organic compounds that reduces or
prevents water infiltration into the soil.

Problem definitions
Why this research?
Soil hydraulic properties, i.e. the water retention curve and the hydraulic conductivity
function, can be altered by the occurrence of the two phenomena.
Soil hydraulic characterization can be conducted both in laboratory and field but the
use of field methods are mandatory on crusted or hydrophobic soils in order to
accurately account for the effects of these two phenomena and evaluate the influence
that they have on the infiltration process.
Several field infiltrometer techniques have been developed but the choice of the
most appropriate measuring method depending on its peculiarities and on the
phenomenon to be quantified.
Assessing the negative impact of surface crust and SWR on hydrological processes
is particularly important in Mediterranean regions where the weather conditions are
frequently extreme with hot and dry spells in summer time and high intensity rainfalls
in autumn which can cause flooding and soil erosion.
Objectives
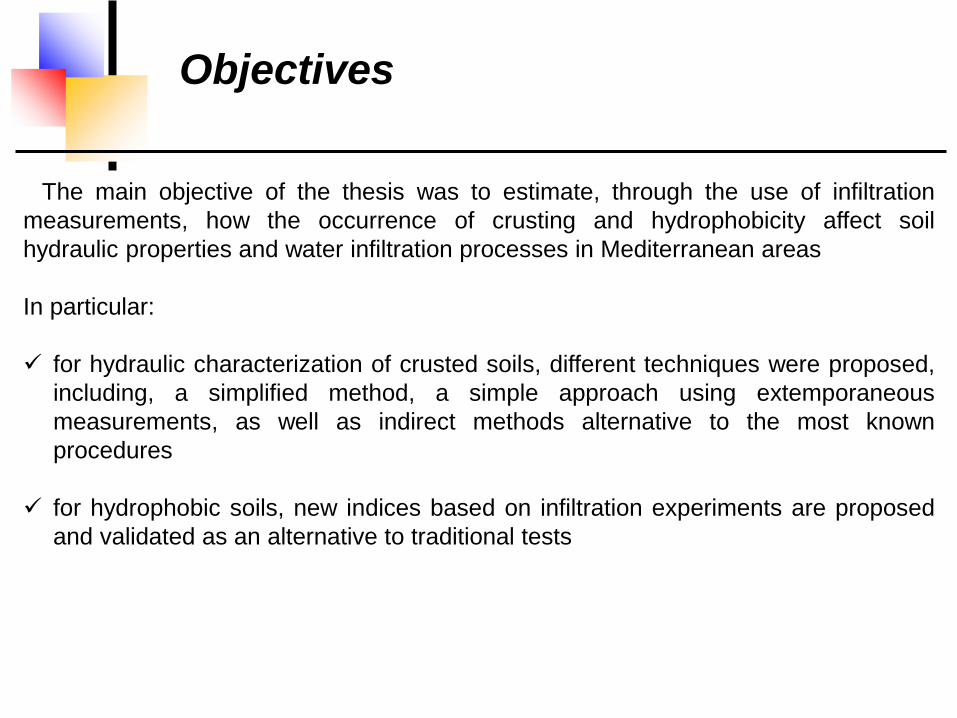
The main objective of the thesis was to estimate, through the use of infiltration
measurements, how the occurrence of crusting and hydrophobicity affect soil
hydraulic properties and water infiltration processes in Mediterranean areas
In particular:
for hydraulic characterization of crusted soils, different techniques were proposed,
including, a simplified method, a simple approach using extemporaneous
measurements, as well as indirect methods alternative to the most known
procedures
for hydrophobic soils, new indices based on infiltration experiments are proposed
and validated as an alternative to traditional tests
Contents
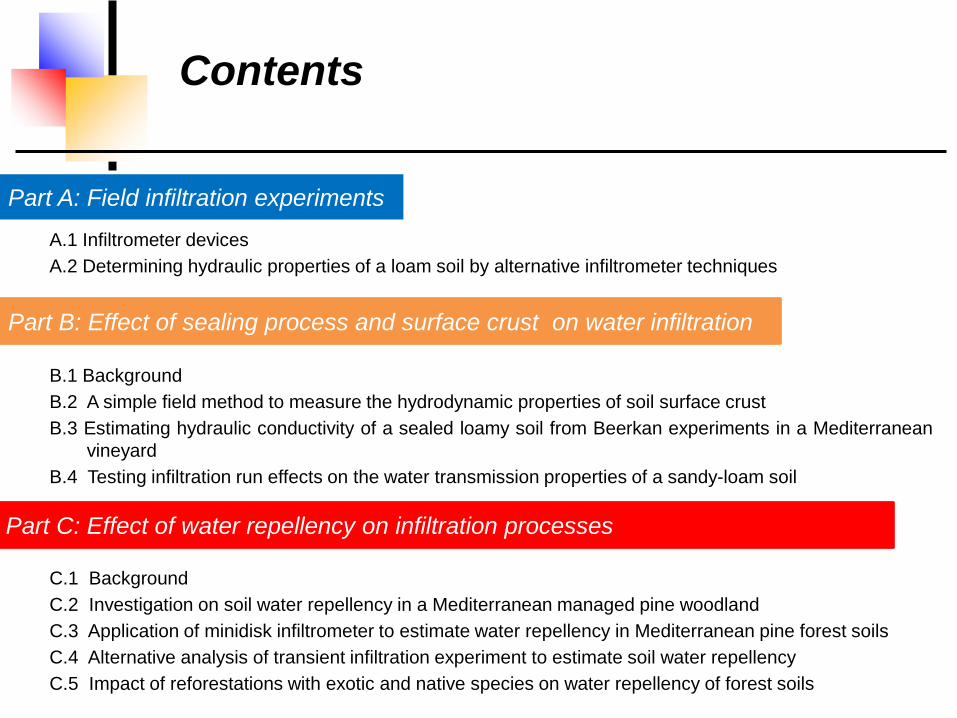
A.1 Infiltrometer devices
A.2 Determining hydraulic properties of a loam soil by alternative infiltrometer techniques
B.1 Background
B.2 A simple field method to measure the hydrodynamic properties of soil surface crust
B.3 Estimating hydraulic conductivity of a sealed loamy soil from Beerkan experiments in a Mediterranean
vineyard
B.4 Testing infiltration run effects on the water transmission properties of a sandy-loam soil
C.1 Background
C.2 Investigation on soil water repellency in a Mediterranean managed pine woodland
C.3 Application of minidisk infiltrometer to estimate water repellency in Mediterranean pine forest soils
C.4 Alternative analysis of transient infiltration experiment to estimate soil water repellency
C.5 Impact of reforestations with exotic and native species on water repellency of forest soils
Part A: Field infiltration experiments
Part B: Effect of sealing process and surface crust on water infiltration
Part C: Effect of water repellency on infiltration processes

Part A: Field infiltration experiments for soil hydraulic characterization
A. 1 Infiltrometer devices
a
b
c d
e f
The infiltration methods can be divided in ponded and tension infiltration
techniques according to the specific devices used. These methods are engineered to
monitor the cumulative volume of infiltrating water, I (L), into the porous media
against the time, t (T).
BEST, SFH, BB
PI
TI
MDI

Part A: Field infiltration experiments for soil hydraulic characterization
A. 1 Infiltrometer devices
Theory
Philip’s (1957) one-dimensional infiltration model
Haverkamp et al. (1994) 3D infiltration equation
tCtCI 21
01 SC
ir
SKC
0
20
03
2
2
(1)
(2)
(3)
t
ir
SKtSI
0
20
03
2
0 (4)
Vandervaere et al. (2000) proposed two
approaches for data linearization Cumulative
Linearization, CL, and Differentiated
Linearization, DL:
tCCt
I
21
tCCtd
dI
221
(5)
(6)
Vertical
capillary
flow
Gravity
flow Lateral
capillary
flow

Part A: Field infiltration experiments for soil hydraulic characterization
A. 1 Infiltrometer devices
Beerkan estimation of Soil Transfer parameters (BEST)
mn
gh
h
rs
r
1
nm
21
rs
r
sK
K )(
pnm
22
Shape parameters:
• n, m, η PSD + pedotransfer function
Scale parameters:
• θs rb
• h
van Genuchten (1980)
Brooks and Corey (1964)
s
K
s
iis
mnp
c
siS
gh
1,,
,2
• S, Ks Infiltration experiment + Haverkamp eq.
• θr 0
Part A: Field infiltration experiments for soil hydraulic characterization
A. 2 Determining hydraulic properties of a loam soil by alternative infiltrometer techniques
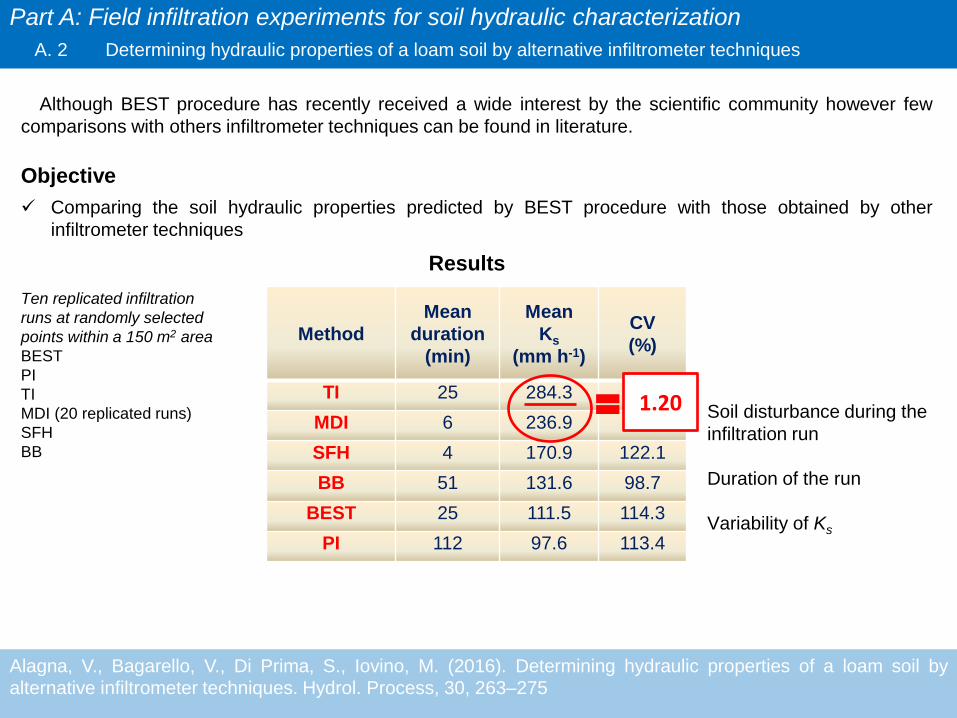
Alagna, V., Bagarello, V., Di Prima, S., Iovino, M. (2016). Determining hydraulic properties of a loam soil by alternative infiltrometer techniques. Hydrol. Process, 30, 263–275
Although BEST procedure has recently received a wide interest by the scientific community however few
comparisons with others infiltrometer techniques can be found in literature.
Objective
Comparing the soil hydraulic properties predicted by BEST procedure with those obtained by other
infiltrometer techniques
Ten replicated infiltration
runs at randomly selected
points within a 150 m2 area
BEST
PI
TI
MDI (20 replicated runs)
SFH
BB
Method
Mean
duration
(min)
Mean
Ks
(mm h-1)
CV
(%)
TI 25 284.3 95.3
MDI 6 236.9 36.1
SFH 4 170.9 122.1
BB 51 131.6 98.7
BEST 25 111.5 114.3
PI 112 97.6 113.4
Soil disturbance during the
infiltration run
Duration of the run
Variability of Ks
Results
1.20

Part B: Effect of sealing process and surface crust on water infiltration
B. 1 Background
Vandervaere et al. (1997)
Insertion of minitensiometer may be difficult
due to the fragility of the crust
Hillel and Gardner (1969)
cK
cL
cR
Touma et al. (2011)
The two experiments do not
sample the same area
Souza et al. (2014)

Part B: Effect of sealing process and surface crust on water infiltration
B. 2 A simple field method to measure the hydrodynamic properties of soil surface crust
Alagna, V., Bagarello, V., Di Prima, S., Giordano, G., Iovino, M. (2013). A simple field method to measure the hydrodynamic properties of soil surface crust. Journal of Agricultural Engineering 2013; XLIV(s2):e14. doi:10.4081/jae.2013.(s1):e14
Objective
To develop and test a simplified method to determine the hydrodynamic properties of the surface crust
c
s
c
scc
R
h
L
hKq
s
sc
hK
hR
)( ss hKq
s
csc
hK
LhR
Procedure
• Knowledge of subsoil hydraulic properties
θ(h), K(h)
• MDI experiment on crust at h0=0
• K(hs) of subsoil
• hs of crust-subsoil interface inverting K(h)
relationship

Part B: Effect of sealing process and surface crust on water infiltration
B. 2 A simple field method to measure the hydrodynamic properties of soil surface crust
Results
n
m
fs
(m3m
-3)
hg
(mm)
Kfs
(mm h-1
)
qc
(mm h-1
)
site 1 sandy loam N = 11 min 2.149 0.069 15.6 0.576 -180 193 390
max 2.159 0.074 16.4 0.649 -26 623 755
mean 2.154 0.071 16.0 0.615 -87 346 561
CV (%) 0.2 2.5 2.2 5.0 61.0 43.5 23.2
site 2 clay N = 15
min 2.067 0.032 30.5 0.514 -886 14 117
max 2.073 0.035 33.0 0.622 -51 1777 200
mean 2.070 0.034 31.4 0.557 -241 731 147
CV (%) 0.1 2.4 2.3 5.8 118.0 86.6 18.7
site 2 clay
qc/Kfs <1
qc/Kfs hs
(mm)
Lc
(mm)
Rc
(h)
Kc
(mm h-1
)
Rc
(h)
Kc
(mm h-1
)
Lc negligible Lc not negligible
N = 10
min 0.09 -263 5 0.385 2.68 0.41 2.62
max 0.84 -77 7 2.241 12.97 2.29 12.18
mean 0.24 -180 6 1.312 5.77 1.35 5.53
CV (%) 97.6 35.5 11.1 47.8 53.5 47.0 51.9
. .
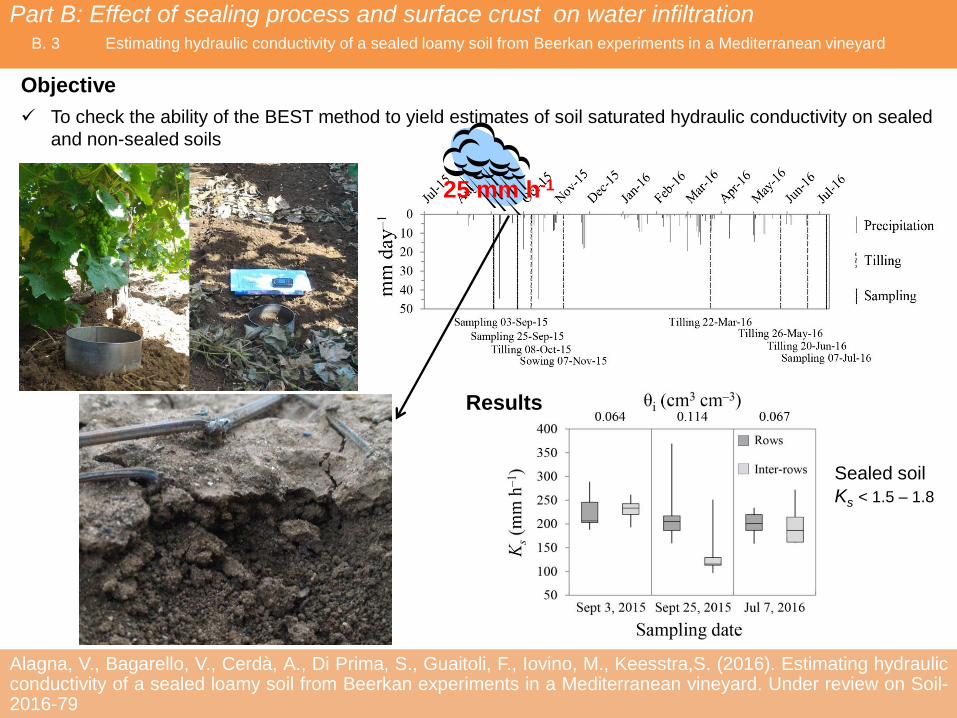
Part B: Effect of sealing process and surface crust on water infiltration B. 3 Estimating hydraulic conductivity of a sealed loamy soil from Beerkan experiments in a Mediterranean vineyard
Alagna, V., Bagarello, V., Cerdà, A., Di Prima, S., Guaitoli, F., Iovino, M., Keesstra,S. (2016). Estimating hydraulic conductivity of a sealed loamy soil from Beerkan experiments in a Mediterranean vineyard. Under review on Soil-2016-79
Objective
To check the ability of the BEST method to yield estimates of soil saturated hydraulic conductivity on sealed
and non-sealed soils
25 mm h-1
Results
Sealed soil Ks < 1.5 – 1.8
Part B: Effect of sealing process and surface crust on water infiltration
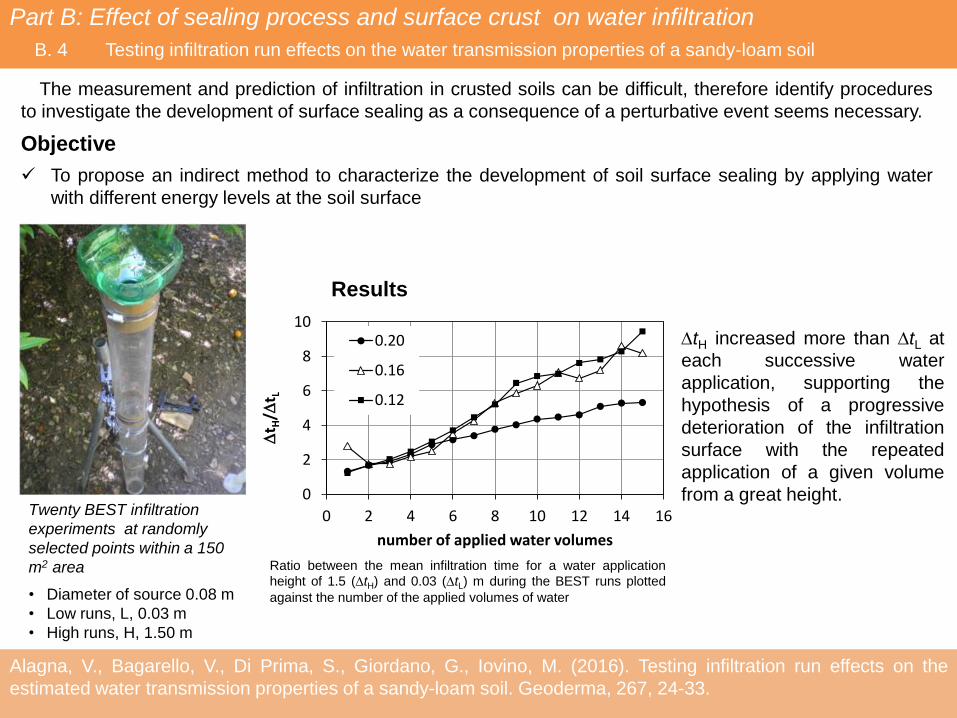
B. 4 Testing infiltration run effects on the water transmission properties of a sandy-loam soil
Alagna, V., Bagarello, V., Di Prima, S., Giordano, G., Iovino, M. (2016). Testing infiltration run effects on the
estimated water transmission properties of a sandy-loam soil. Geoderma, 267, 24-33.
The measurement and prediction of infiltration in crusted soils can be difficult, therefore identify procedures
to investigate the development of surface sealing as a consequence of a perturbative event seems necessary.
Objective
To propose an indirect method to characterize the development of soil surface sealing by applying water
with different energy levels at the soil surface
Twenty BEST infiltration
experiments at randomly
selected points within a 150
m2 area
• Diameter of source 0.08 m
• Low runs, L, 0.03 m
• High runs, H, 1.50 m
0
2
4
6
8
10
0 2 4 6 8 10 12 14 16
Dt H
/Dt L
number of applied water volumes
0.20
0.16
0.12
Ratio between the mean infiltration time for a water application
height of 1.5 (DtH) and 0.03 (DtL) m during the BEST runs plotted
against the number of the applied volumes of water
DtH increased more than DtL at
each successive water
application, supporting the
hypothesis of a progressive
deterioration of the infiltration
surface with the repeated
application of a given volume
from a great height.
Results

Results
y = -3869.1x + 937.29R² = 0.9785
y = -63.936x + 26.773R² = 0.6559
0
100
200
300
400
500
600
0.1 0.15 0.2 0.25
Ks
(mm
/h)
initial volumetric soil water content (m3m-3)
L run
H run
a)
y = 21.973x-0.793
R² = 0.8235
y = 15.031x-0.512
R² = 0.94660
20
40
60
80
100
120
140
0.1 0.15 0.2 0.25
S (m
m/h
0.5
)
initial volumetric soil water content (m3m-3)
L run
H run
b)
Effect of the initial volumetric soil water content on the mean values of a)
the saturated soil hydraulic conductivity, Ks, and b) the soil sorptivity, S,
for both the low (L) and high (H) infiltration runs
Saturated soil hydraulic conductivity
• Height of water pouring had more appreciable
effects on Ks in the initially drier soil conditions
• The perturbing experiment (high infiltration runs)
reduced the dependence of Ks on the initial soil
water content as compared with the low and less
perturbing runs.
Part B: Effect of sealing process and surface crust on water infiltration
B. 4 Testing infiltration run effects on the water transmission properties of a sandy-loam soil
Soil sorptivity
• In general, the variability for S was smaller than
for Ks
• Low runs yielding higher values than the high
ones and the differences were dependent on i
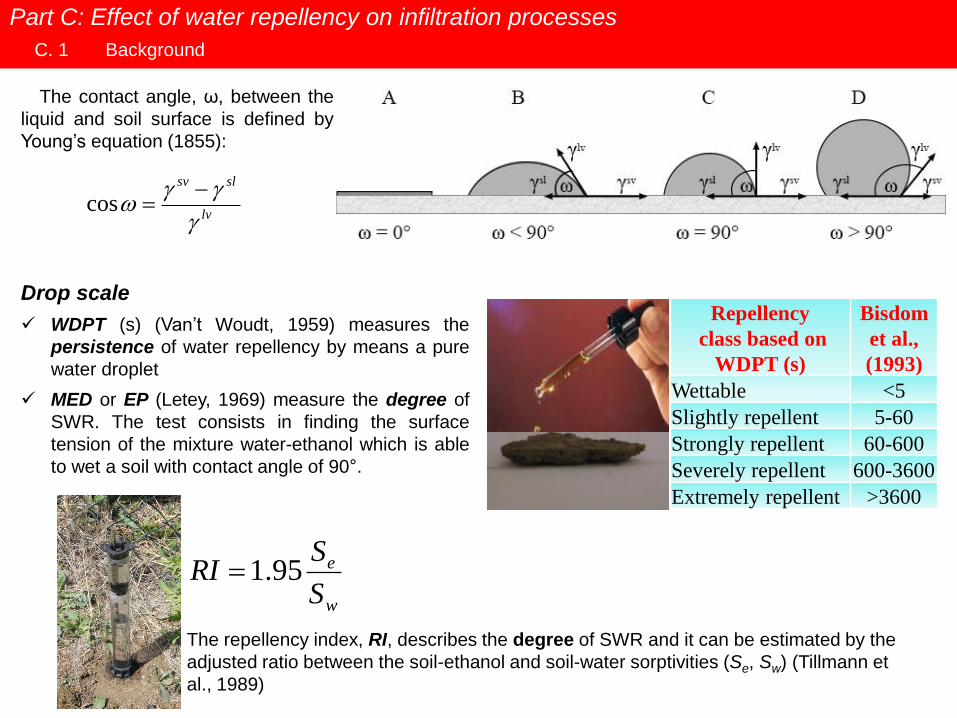
The contact angle, ω, between the
liquid and soil surface is defined by
Young’s equation (1855):
Part C: Effect of water repellency on infiltration processes
C. 1 Background
lv
slsv
cos
Drop scale
WDPT (s) (Van’t Woudt, 1959) measures the
persistence of water repellency by means a pure
water droplet
MED or EP (Letey, 1969) measure the degree of
SWR. The test consists in finding the surface
tension of the mixture water-ethanol which is able
to wet a soil with contact angle of 90°.
Repellency
class based on
WDPT (s)
Bisdom
et al.,
(1993)
Wettable <5
Slightly repellent 5-60
Strongly repellent 60-600
Severely repellent 600-3600
Extremely repellent >3600
The repellency index, RI, describes the degree of SWR and it can be estimated by the
adjusted ratio between the soil-ethanol and soil-water sorptivities (Se, Sw) (Tillmann et
al., 1989)
w
e
S
SRI 95.1
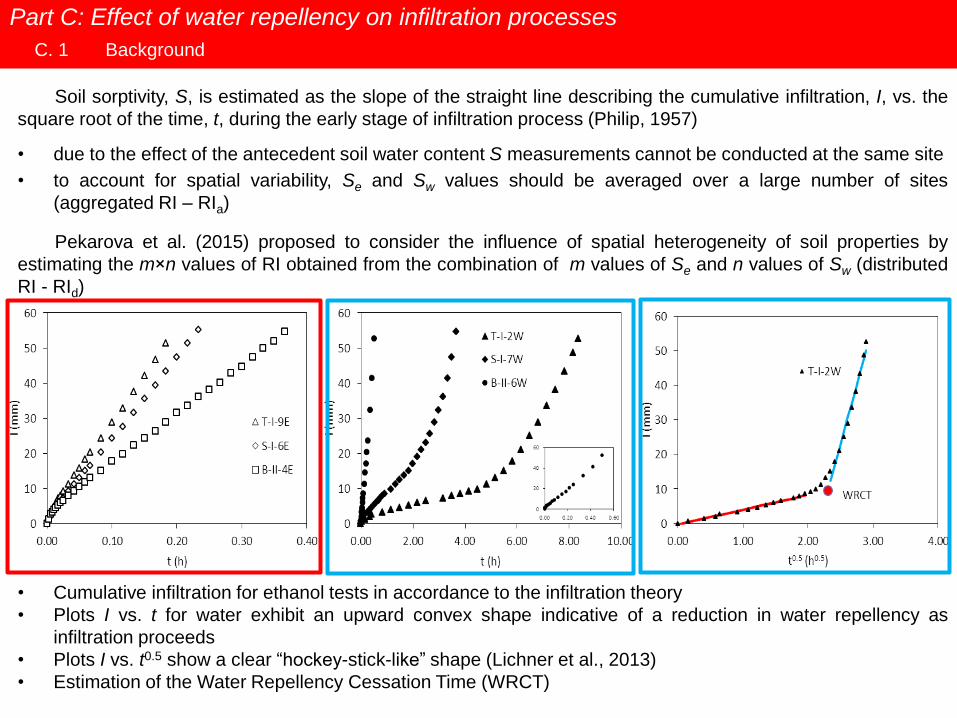
Part C: Effect of water repellency on infiltration processes
C. 1 Background
• Cumulative infiltration for ethanol tests in accordance to the infiltration theory
• Plots I vs. t for water exhibit an upward convex shape indicative of a reduction in water repellency as
infiltration proceeds
• Plots I vs. t0.5 show a clear “hockey-stick-like” shape (Lichner et al., 2013)
• Estimation of the Water Repellency Cessation Time (WRCT)
Soil sorptivity, S, is estimated as the slope of the straight line describing the cumulative infiltration, I, vs. the
square root of the time, t, during the early stage of infiltration process (Philip, 1957)
• due to the effect of the antecedent soil water content S measurements cannot be conducted at the same site
• to account for spatial variability, Se and Sw values should be averaged over a large number of sites
(aggregated RI – RIa)
Pekarova et al. (2015) proposed to consider the influence of spatial heterogeneity of soil properties by
estimating the m×n values of RI obtained from the combination of m values of Se and n values of Sw (distributed
RI - RId)

Part C: Effect of water repellency on infiltration processes
C. 2 Investigation on soil water repellency in a Mediterranean managed pine woodland
Alagna, V., Bagarello, V., Giordano, G., Iovino, M. (2016). Investigation on soil water repellency in a
Mediterranean managed pine woodland. Quaderni di idronomia Montana, EdiBios, 34, 379-391
Objective
To investigate the soil water repellency in a Mediterranean managed pine woodland at two sampling depths
in the soil profile (thatch and mineral soil) and different water contents
Typic Rhodoxeralf
Two sampling dates (I - II)
Two sampling sites (P - B)
Two sampling depths for P site (T - S)
Thatch T-I T-II
Mineral soil S-I S-II Site B-II
Site P
• 20 replicated MDI runs (10 ethanol 95% V/V and 10 distilled water)
• 30 replicated WDPT (s)
• 10 undisturbed soil cores
• Scrubbed soil samples for OM determination
Clay loam (USDA classification)
30 years old Pinus pinaster
Part C: Effect of water repellency on infiltration processes
C. 2 Investigation on soil water repellency in a Mediterranean managed pine woodland
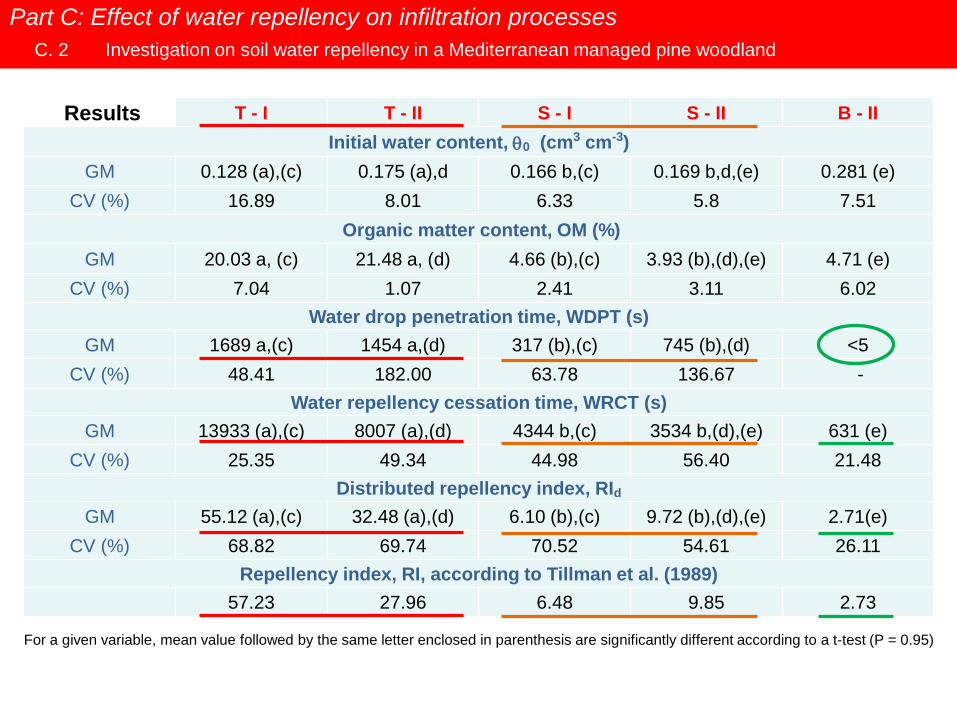
Results T - I T - II S - I S - II B - II
Initial water content, 0 (cm3 cm-3)
GM 0.128 (a),(c) 0.175 (a),d 0.166 b,(c) 0.169 b,d,(e) 0.281 (e)
CV (%) 16.89 8.01 6.33 5.8 7.51
Organic matter content, OM (%)
GM 20.03 a, (c) 21.48 a, (d) 4.66 (b),(c) 3.93 (b),(d),(e) 4.71 (e)
CV (%) 7.04 1.07 2.41 3.11 6.02
Water drop penetration time, WDPT (s)
GM 1689 a,(c) 1454 a,(d) 317 (b),(c) 745 (b),(d) <5
CV (%) 48.41 182.00 63.78 136.67 -
Water repellency cessation time, WRCT (s)
GM 13933 (a),(c) 8007 (a),(d) 4344 b,(c) 3534 b,(d),(e) 631 (e)
CV (%) 25.35 49.34 44.98 56.40 21.48
Distributed repellency index, RId
GM 55.12 (a),(c) 32.48 (a),(d) 6.10 (b),(c) 9.72 (b),(d),(e) 2.71(e)
CV (%) 68.82 69.74 70.52 54.61 26.11
Repellency index, RI, according to Tillman et al. (1989)
57.23 27.96 6.48 9.85 2.73
For a given variable, mean value followed by the same letter enclosed in parenthesis are significantly different according to a t-test (P = 0.95)
Part C: Effect of water repellency on infiltration processes
C. 2 Investigation on soil water repellency in a Mediterranean managed pine woodland
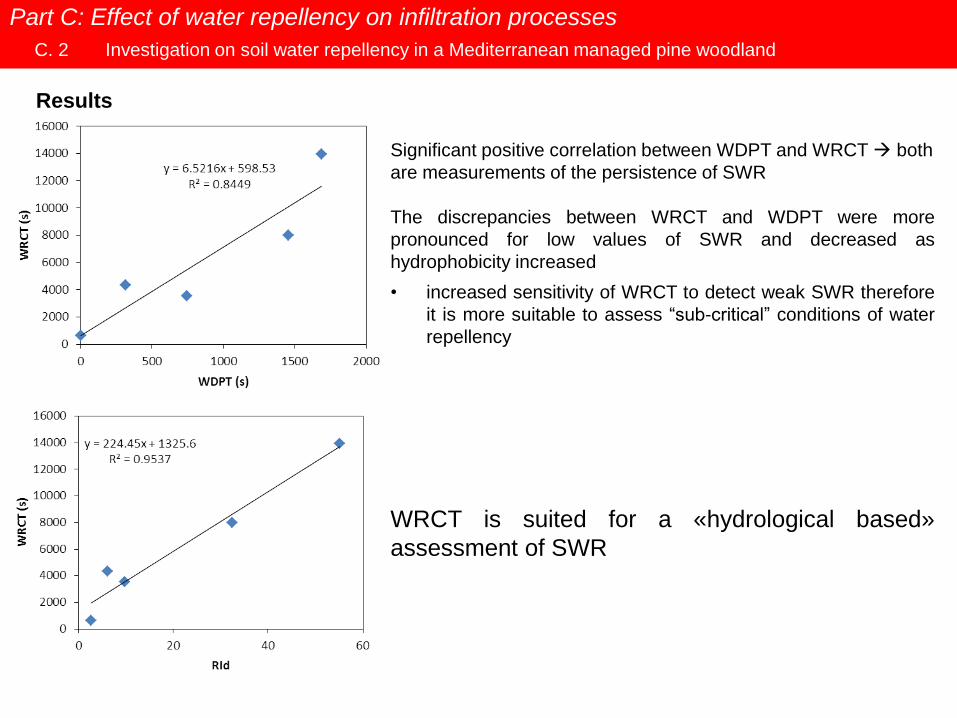
Significant positive correlation between WDPT and WRCT both
are measurements of the persistence of SWR
The discrepancies between WRCT and WDPT were more
pronounced for low values of SWR and decreased as
hydrophobicity increased
• increased sensitivity of WRCT to detect weak SWR therefore
it is more suitable to assess “sub-critical” conditions of water
repellency
WRCT is suited for a «hydrological based»
assessment of SWR
Results

Part C: Effect of water repellency on infiltration processes
C. 3 Application of minidisk infiltrometer to estimate water repellency in Mediterranean pine forest soils
Alagna, V., Iovino, M., Bagarello V., Mataix-Solera, J., Lichner, Ľ. (2016). Application of minidisk infiltrometer to estimate water repellency in Mediterranean pine forest soils. Accepted by Journal of Hydrology and Hydromechanics, published online, DOI: 10.1515/johh-2017-0009
Objective
To test alternative indices for assessing SWR from infiltration experiments conducted with the MDI using
either ethanol and water or water alone
hw
ww
mS
SRI
,
,
Lithic Rhodoxeralf
One sampling campaign at Javea
• Silty clay (USDA classification)
• 40 years old Pinus halepensis
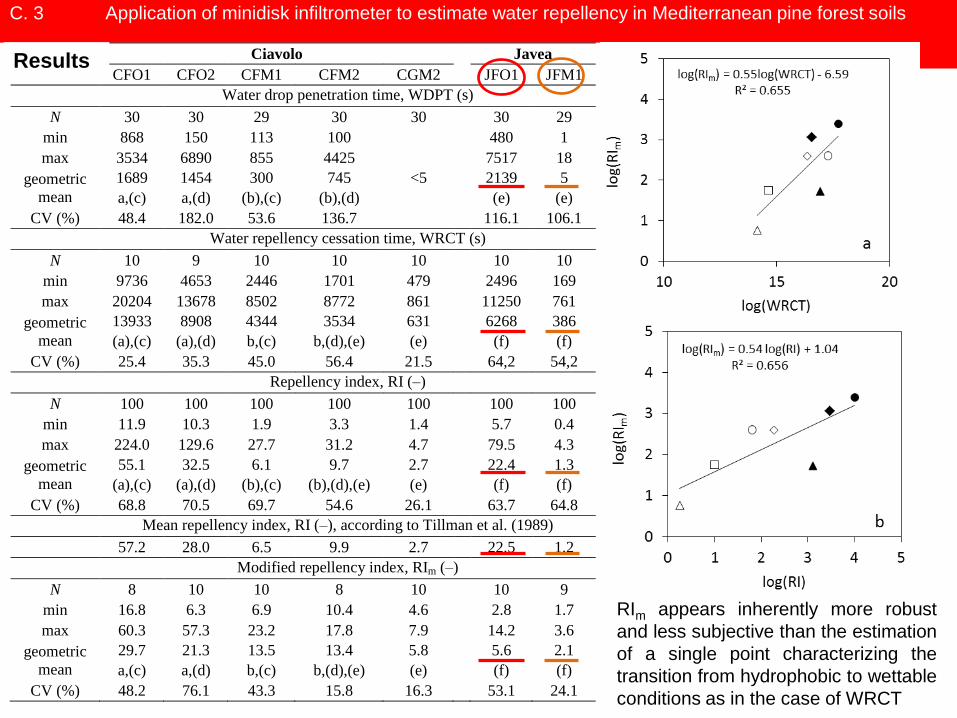
C. 3 Application of minidisk infiltrometer to estimate water repellency in Mediterranean pine forest soils
Ciavolo Javea
CFO1 CFO2 CFM1 CFM2 CGM2 JFO1 JFM1
Water drop penetration time, WDPT (s)
N 30 30 29 30 30 30 29
min 868 150 113 100
480 1
max 3534 6890 855 4425
7517 18
geometric
mean
1689 1454 300 745 <5 2139 5
a,(c) a,(d) (b),(c) (b),(d)
(e) (e)
CV (%) 48.4 182.0 53.6 136.7
116.1 106.1
Water repellency cessation time, WRCT (s)
N 10 9 10 10 10 10 10
min 9736 4653 2446 1701 479 2496 169
max 20204 13678 8502 8772 861 11250 761
geometric
mean
13933 8908 4344 3534 631 6268 386
(a),(c) (a),(d) b,(c) b,(d),(e) (e) (f) (f)
CV (%) 25.4 35.3 45.0 56.4 21.5 64,2 54,2
Repellency index, RI (–)
N 100 100 100 100 100 100 100
min 11.9 10.3 1.9 3.3 1.4 5.7 0.4
max 224.0 129.6 27.7 31.2 4.7 79.5 4.3
geometric
mean
55.1 32.5 6.1 9.7 2.7 22.4 1.3
(a),(c) (a),(d) (b),(c) (b),(d),(e) (e) (f) (f)
CV (%) 68.8 70.5 69.7 54.6 26.1 63.7 64.8
Mean repellency index, RI (–), according to Tillman et al. (1989)
57.2 28.0 6.5 9.9 2.7 22.5 1.2
Modified repellency index, RIm (–)
N 8 10 10 8 10 10 9
min 16.8 6.3 6.9 10.4 4.6 2.8 1.7
max 60.3 57.3 23.2 17.8 7.9 14.2 3.6
geometric
mean
29.7 21.3 13.5 13.4 5.8 5.6 2.1
a,(c) a,(d) b,(c) b,(d),(e) (e) (f) (f)
CV (%) 48.2 76.1 43.3 15.8 16.3 53.1 24.1
Results
RIm appears inherently more robust
and less subjective than the estimation
of a single point characterizing the
transition from hydrophobic to wettable
conditions as in the case of WRCT
Part C: Effect of water repellency on infiltration processes
C. 4 Alternative analysis of transient infiltration experiment to estimate soil water repellency
Alagna, V., Iovino, M., Bagarello V., Mataix-Solera, J., Lichner, Ľ. (2016). Alternative analysis of transient
infiltration experiment to estimate soil water repellency. Submitted to Hydrological Processes in 2016.
Soil sorptivity, S, estimated from the Philip (1957) horizontal
equation by the early-time linear regression of the I vs. 𝑡 data
neglects the effects of gravity and lateral capillary flux at the edge of
the infiltration source.
An unbiased estimation of soil sorptivity is possible by fitting the two-
term cumulative infiltration equation proposed by Haverkamp et al.
(1994)
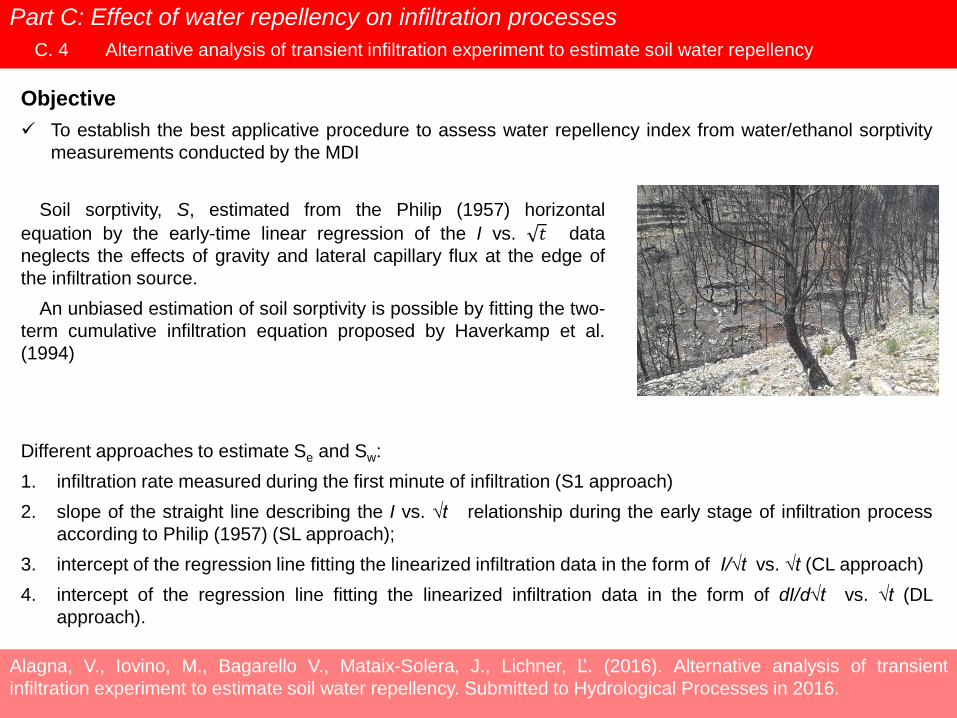
Objective
To establish the best applicative procedure to assess water repellency index from water/ethanol sorptivity
measurements conducted by the MDI
Different approaches to estimate Se and Sw:
1. infiltration rate measured during the first minute of infiltration (S1 approach)
2. slope of the straight line describing the I vs. √t relationship during the early stage of infiltration process
according to Philip (1957) (SL approach);
3. intercept of the regression line fitting the linearized infiltration data in the form of I/√t vs. √t (CL approach)
4. intercept of the regression line fitting the linearized infiltration data in the form of dI/d√t vs. √t (DL
approach).
Part C: Effect of water repellency on infiltration processes
C. 4 Alternative analysis of transient infiltration experiment to estimate soil water repellency
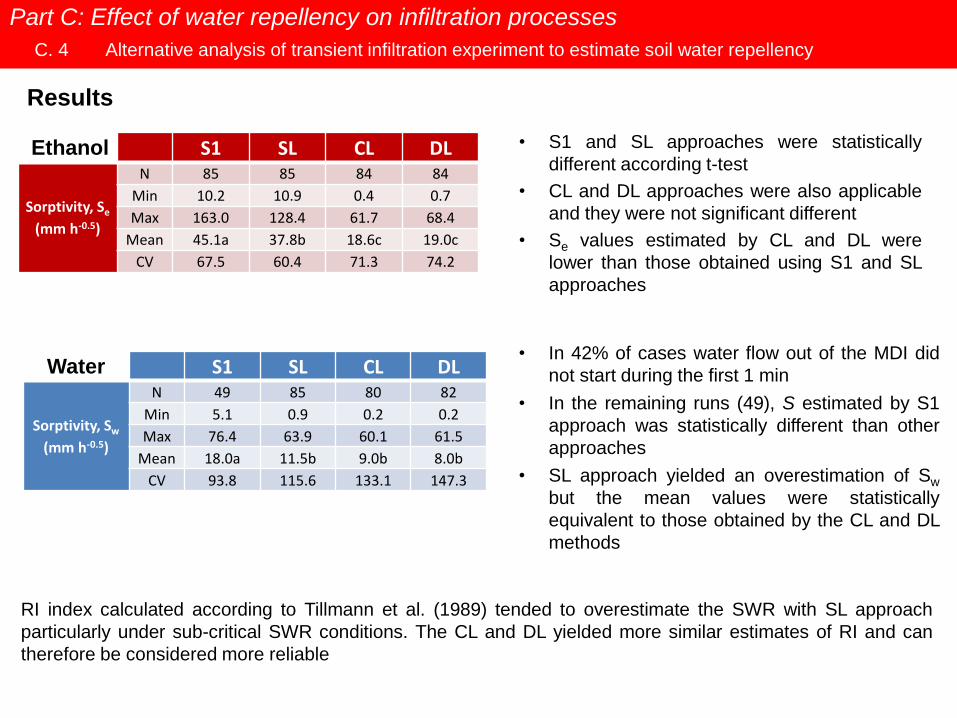
Ethanol S1 SL CL DL
Sorptivity, Se
(mm h-0.5)
N 85 85 84 84
Min 10.2 10.9 0.4 0.7
Max 163.0 128.4 61.7 68.4
Mean 45.1a 37.8b 18.6c 19.0c
CV 67.5 60.4 71.3 74.2
• S1 and SL approaches were statistically
different according t-test
• CL and DL approaches were also applicable
and they were not significant different
• Se values estimated by CL and DL were
lower than those obtained using S1 and SL
approaches
Water S1 SL CL DL
Sorptivity, Sw
(mm h-0.5)
N 49 85 80 82
Min 5.1 0.9 0.2 0.2
Max 76.4 63.9 60.1 61.5
Mean 18.0a 11.5b 9.0b 8.0b
CV 93.8 115.6 133.1 147.3
• In 42% of cases water flow out of the MDI did
not start during the first 1 min
• In the remaining runs (49), S estimated by S1
approach was statistically different than other
approaches
• SL approach yielded an overestimation of Sw
but the mean values were statistically
equivalent to those obtained by the CL and DL
methods
Results
RI index calculated according to Tillmann et al. (1989) tended to overestimate the SWR with SL approach
particularly under sub-critical SWR conditions. The CL and DL yielded more similar estimates of RI and can
therefore be considered more reliable
Part C: Effect of water repellency on infiltration processes
C. 4 Alternative analysis of transient infiltration experiment to estimate soil water repellency
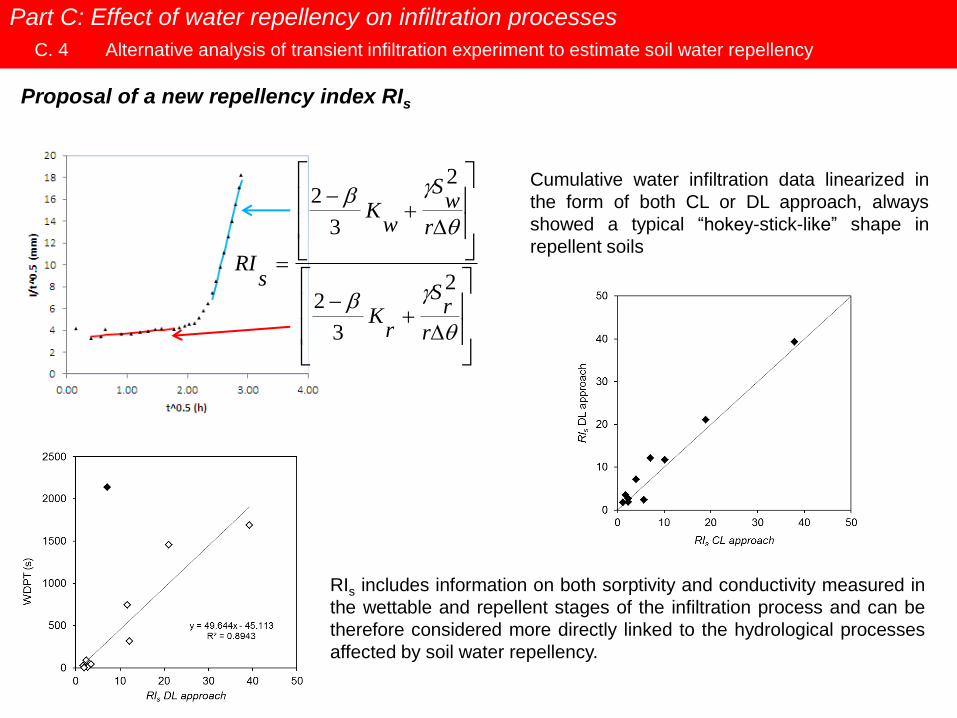
Proposal of a new repellency index RIs
RIs includes information on both sorptivity and conductivity measured in
the wettable and repellent stages of the infiltration process and can be
therefore considered more directly linked to the hydrological processes
affected by soil water repellency.
D
D
r
rS
rK
r
wS
wK
sRI
2
3
2
2
3
2Cumulative water infiltration data linearized in
the form of both CL or DL approach, always
showed a typical “hokey-stick-like” shape in
repellent soils
Part C: Effect of water repellency on infiltration processes
C. 5 Impact of reforestations with exotic and native species on water repellency of forest soils
Alagna, V., Iovino, M., Bagarello V. (2016). Impact of reforestations with exotic and native species on water
repellency of forest soils.
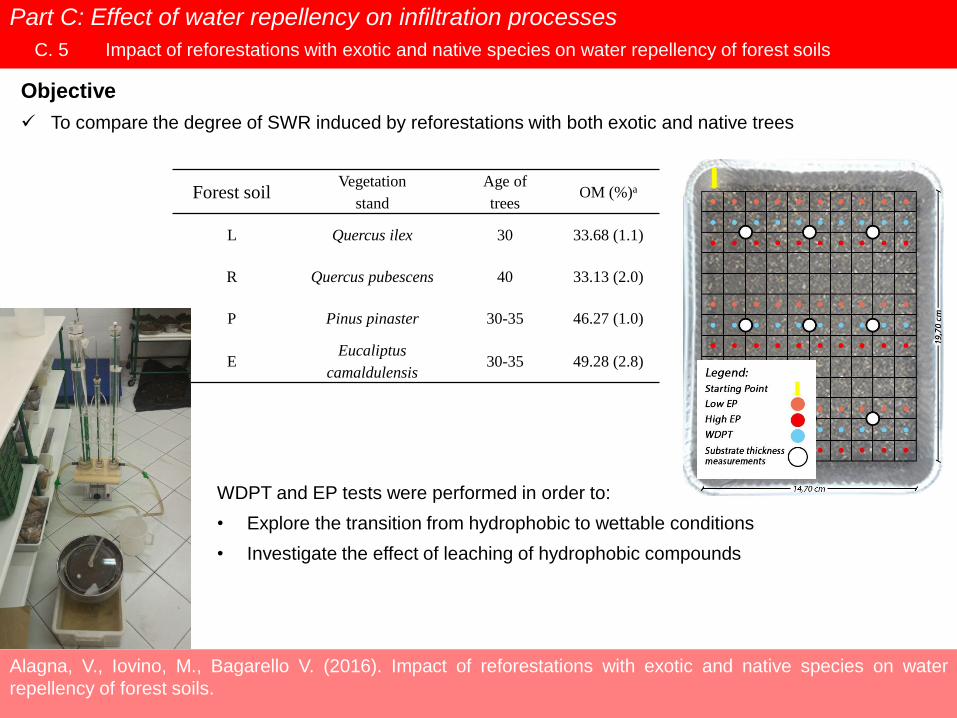
Objective
To compare the degree of SWR induced by reforestations with both exotic and native trees
Forest soil Vegetation
stand
Age of
trees OM (%)a
L Quercus ilex 30 33.68 (1.1)
R Quercus pubescens 40 33.13 (2.0)
P Pinus pinaster 30-35 46.27 (1.0)
E Eucaliptus
camaldulensis 30-35 49.28 (2.8)
WDPT and EP tests were performed in order to:
• Explore the transition from hydrophobic to wettable conditions
• Investigate the effect of leaching of hydrophobic compounds
Part C: Effect of water repellency on infiltration processes
C. 5 Impact of reforestations with exotic and native species on water repellency of forest soils
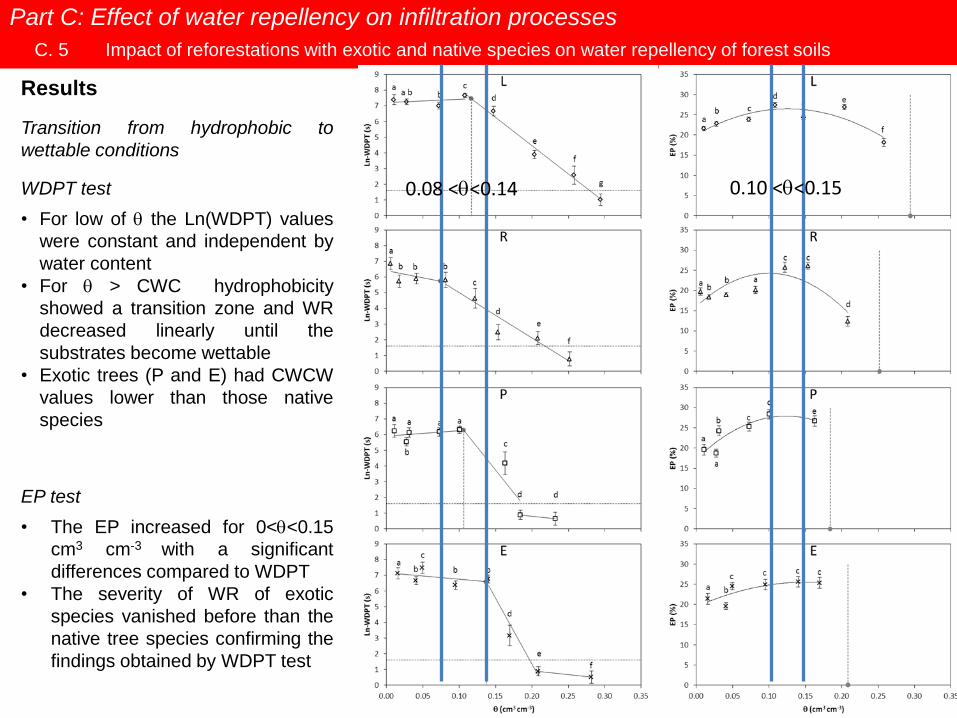
Results
Transition from hydrophobic to
wettable conditions
WDPT test
• For low of the Ln(WDPT) values
were constant and independent by
water content
• For > CWC hydrophobicity
showed a transition zone and WR
decreased linearly until the
substrates become wettable
• Exotic trees (P and E) had CWCW
values lower than those native
species
EP test
• The EP increased for 0<<0.15
cm3 cm-3 with a significant
differences compared to WDPT
• The severity of WR of exotic
species vanished before than the
native tree species confirming the
findings obtained by WDPT test
0.08 <<0.14 0.10 <<0.15
Part C: Effect of water repellency on infiltration processes
C. 5 Impact of reforestations with exotic and native species on water repellency of forest soils
Results
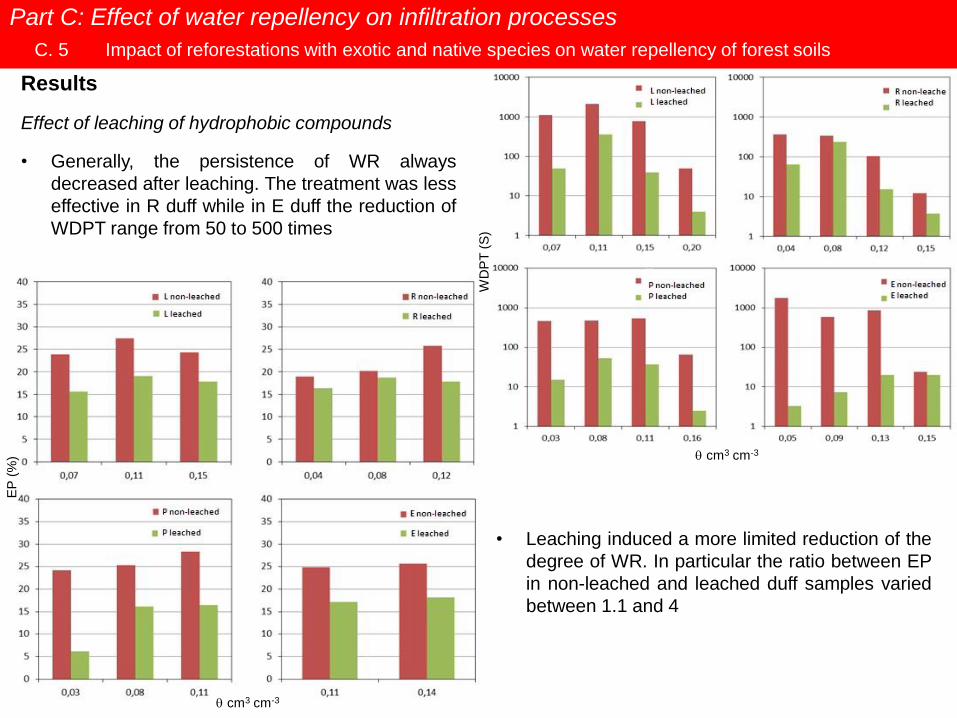
Effect of leaching of hydrophobic compounds
• Generally, the persistence of WR always
decreased after leaching. The treatment was less
effective in R duff while in E duff the reduction of
WDPT range from 50 to 500 times
WD
PT
(S
)
cm3 cm-3
cm3 cm-3
EP
(%
)
• Leaching induced a more limited reduction of the
degree of WR. In particular the ratio between EP
in non-leached and leached duff samples varied
between 1.1 and 4

Conclusions
• BEST method yields estimates of Ks statistically similar to those obtained by
pressure infiltrometer, tension infiltrometer, minidisk infiltrometer, simplified falling
head technique, and bottomless bucket method.
• The simplified method which uses a combination of two infiltrometer techniques (MDI
and BEST) to determine the hydraulic resistance of the soil surface crust was able to
discriminate between different levels of crust hydraulic resistance.
• The use of extemporaneous measurements carried out by a simple infiltrometer
technique under ponded condition and application of the BEST procedure were
capable to evaluate the influence of sealing on infiltration process.
• The perturbation determined by the high height of water pouring can be considered a
viable approach to characterize the effect of water application on the development of
sealing process which can affect the estimation of soil hydraulic properties.
• The hypothesis that the application of minidisk infiltrometer is a valid tool to estimate
water repellency indices was demonstrated.
• The new index, RIs obtained by a single MDI experiment carried out with water allow
to identify sub-critical water repellency and to overcome the drawbacks of the RI
index, therefore can be proposed as an alternative procedures for SWR assessment.

In conclusion, the field infiltration experiments
applied in this thesis and the new procedures and
indices proposed were able to evaluate the effects of
sealing and hydrophobicity on infiltration process and,
consequently, they are potentially suitable to assess
their impact on hydrological behavior of the ecosystems
affected by these phenomena.
However, new procedures and indices need to be
further tested on other soil types and in different areas
to confirm their reliability before they can be considered
as a generally applicable techniques.


