
Industrial Ecology,
Resource Decoupling, and
the “Master Equation”Thomas E. Graedel
Yale University
Center for Industrial EcologyYale School of Forestry & Environmental Studies
0
1
2
3
4
5
6
7
8
9
1650 1700 1750 1800 1850 1900 1950 2000
Year
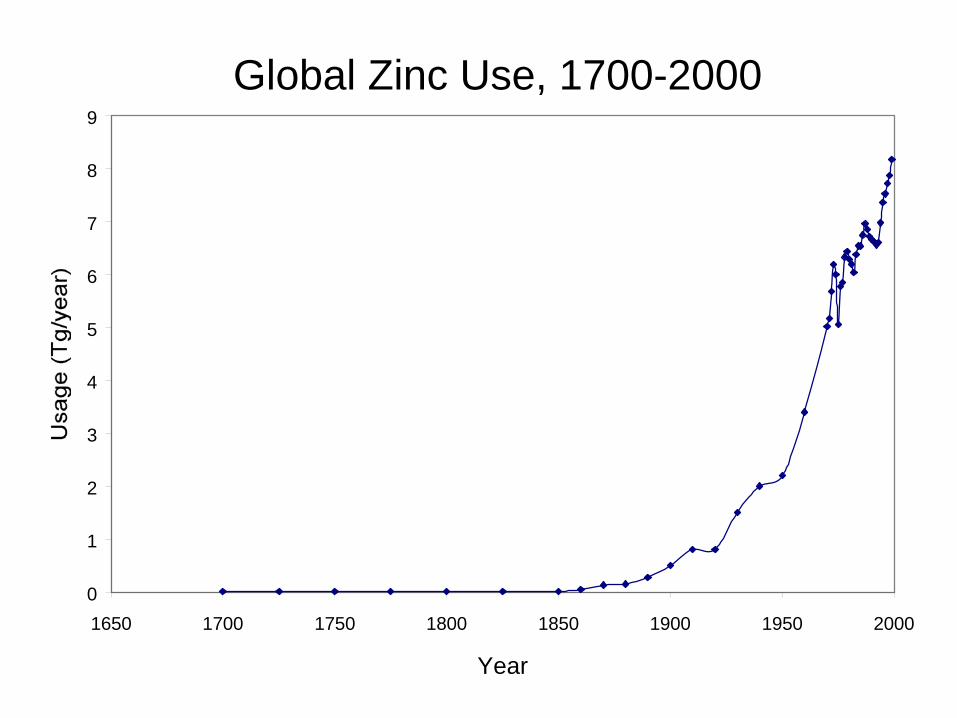
Global Zinc Use, 1700-2000
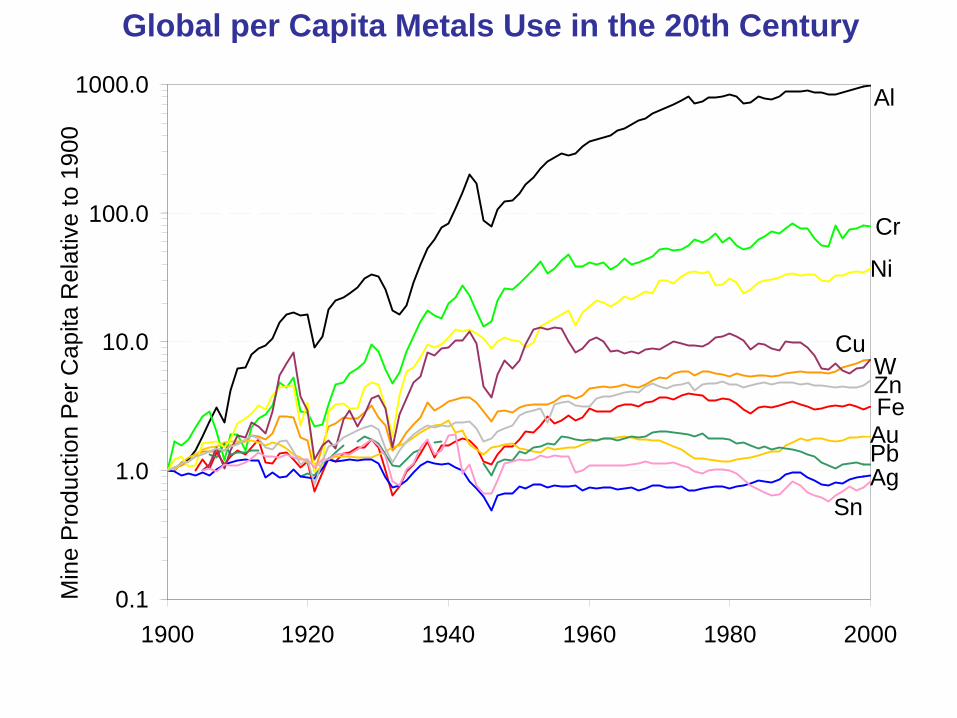
Global per Capita Metals Use in the 20th Century
0.1
1.0
10.0
100.0
1000.0
1900 1920 1940 1960 1980 2000
Min
e Pr
oduc
tion
Per C
apita
Rel
ativ
e to
190
0Al
Cr
Ni
CuWZnFe
AuPbAg
Sn

Histories of Australian Ore Grades, 1845-2007 Source: G.M. Mudd, Sustainability of Mining in Australia, Research Report No. RR5, Monash Univ.,
2007.

Is this a recipe for trouble?

Defining Decoupling
economic activity (GDP)
resource use
resource use
TIME
relative decoupling
absolute decoupling

050
100150200250300350
1981
1984
1987
1990
1993
1996
1999
2002
thou
sand
yen
/met
ric to
nJapanese Resource Decoupling

Overall Environmental/Sustainability Impact =
Pop. x GDP x resource use x envt./sust. impactperson GDP unit of resource use
The “Master Equation”

Source: www.faculty.fairfield.edu/.../Oct16/Part4.html

Copper Stock per capita
137 kg Cu 35 kg Cu
New Haven Beijing

Copper Stock and Copper Need
137 kg Cu 137 kg Cu
New Haven Beijing
Global need in 2040
1.3 Pg Cu

Limits to Materials: Copper Stock and Copper Supply
137 kg Cu 137 kg Cu
New Haven Beijing
Global need in 2040 Global resource
1.3 Pg Cu 1.6 Pg Cu


http://www.allaboardwashington.org/cms/images/uploads/Trains_Crop2.jpg

A Typical Water Treatment System
http://images.google.com/imgres?imgurl=http://civil.engr.siu.edu/Ray_H2ODsn/images/WTPAerial1.jpg&imgrefurl=http://civil.engr.siu.edu/Ray_H2ODsn/Default.asp&usg=__WrYw0oEkKBTB3yzEETk4P87ga3w=&h=438&w=500&sz=97&hl=en&start=5&tbnid=fsIDd54infh_bM:&tbnh=114&tbnw=130&prev=/images%3Fq%3Dwater%2Btreatment%2Bplant%26hl%3Den%26sa%3DX

Copper Use as a Function of Wealth
0 5 0 0 0 1 0 0 0 0 1 5 0 0 0 2 0 0 0 0 2 5 0 0 0 3 0 0 0 0G D P p e r c a p ita , P P P (c u rre n t in te rn a t io n a l $ )
0
4
8
1 2
Cop
per
per
Cap
ita E
nter
ing
Use
(kg
/yr)
S o u th K o re aM a l a y si a
N o rw a y
U S AIsra e l
J a p a n
G e rm a n y
K a z a kh sta n
U z b e ki st a n
S a u d i A ra b i a
d a ta se t w i t h o u t H o n g K o n g & S i n g a p o re
F ra n c e
A rg e n t i n a
b (1 )
N e w Z e a l a n d
U A E
In d i a
A u st ri a

The Master Equation
2050/2010 1.5 3 2 ??
Overall Environmental Impact =
Population x GDP x resource use x environmental impactperson GDP unit of resource use

Environmental Improvement in The Netherlands
100
GDP
CO2 emissions
Wastegeneration
Time1980 2010
20 24 29
68 7095
130 142160 164
225263
0
100
200
300
Lea
d
Col
d ro
lled
stee
l
Gal
vani
zed
stee
l
HD
-PE PP
AB
S
Nyl
on 6
Chr
ome
stee
l
Mag
nesi
um
Nyl
on 6
.6
Alu
min
um sh
eet
Tita
nium
20 24 29
68 7095
130 142160 164
225263
0
100
200
300
Lea
d
Col
d ro
lled
stee
l
Gal
vani
zed
stee
l
HD
-PE PP
AB
S
Nyl
on 6
Chr
ome
stee
l
Mag
nesi
um
Nyl
on 6
.6
Alu
min
um sh
eet
Tita
niumPr
imar
yEn
ergy
Con
sum
ptio
n (M
J/kg
)
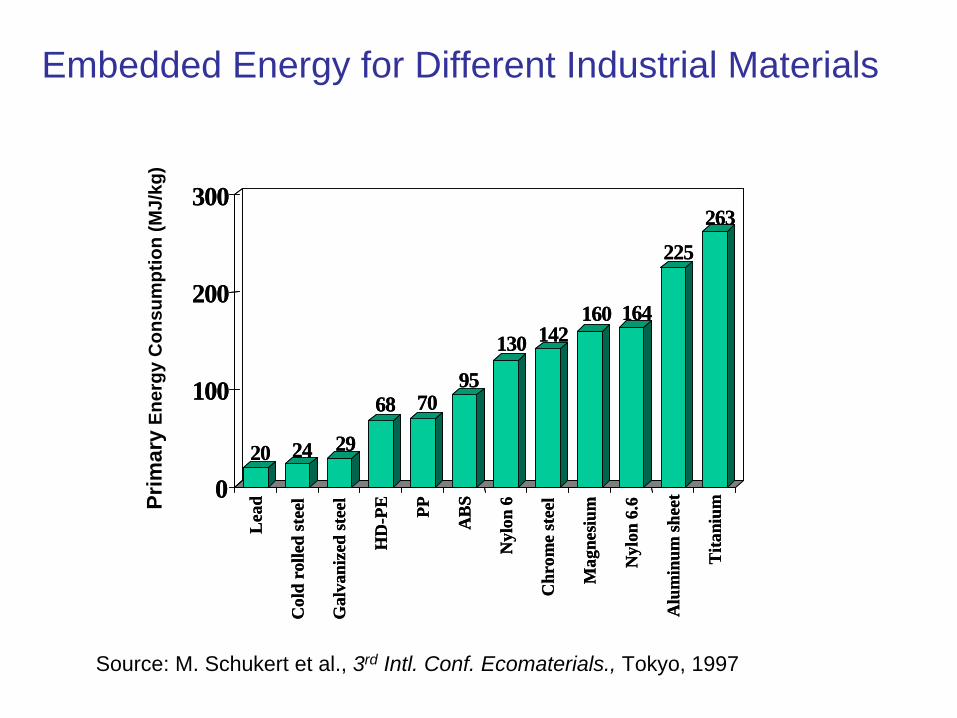
Embedded Energy for Different Industrial Materials
Source: M. Schukert et al., 3rd Intl. Conf. Ecomaterials., Tokyo, 1997

Highland Valley Canada Copper Mine Empoundment
Source: swittersb.wordpress.com/2008/08/
Implications for Policy of Resource Supply and Use
• Virgin resources are being used at increasing rates• We demand resources without a good idea of the
ultimate quantities available for extraction• The master equation demonstrates that absolute
decoupling will be a product of addressing the technical and societal relationships that link personal wealth, development, and consumption
• New recycling technology and design for recycling will help, but major cultural changes to “dematerialize” wants and needs are probably the most effective way to insure long term sustainability

The Challenge of Decoupling Needs and Wants from Their Realization


