THIS REPORT CONTAINS ASSESSMENTS OF COMMODITY AND TRADE ISSUES MADE BY
USDA STAFF AND NOT NECESSARILY STATEMENTS OF OFFICIAL U.S. GOVERNMENT
POLICY
Date:
GAIN Report Number:
Approved By:
Prepared By:
Report Highlights:
Palm oil production estimates for 2015/16 remain unchanged at 33 million metric tons. Assuming the
return of normal weather conditions, Post expects 2016/17 palm oil production to recover to 33.5
million metric tons. Post’s estimate for 2015/16 consumption remains at 9.42 million metric tons.
2016/17 industrial consumption is expected to grow to 3.5 million metric tons, (led by biodiesel). Total
consumption is thus expected to reach 9.62 million metric tons. 2015/16 soybean production is expected
to decline back to 600,000 metric tons, as Indonesian weather conditions return to normal and farmers
plant corn and rice in place of soybean. 2016/17 soybean production is expected to remain stable at
600,000 metric tons, with Post noting no significant policy changes that would significantly change
soybean production. Indonesia’s National Statistical Agency (BPS) continues to report declining area
planted to coconut. Post therefore expects copra production to fall to 1.59 million metric tons in MY
2015/16 and 1.58 million metric tons in MY 2016/17
Thom Wright, Arif Rahmanulloh
Thom Wright
Oilseeds and Products Annual Report 2016
Oilseeds and Products Annual
Indonesia
ID1606
3/15/2016
Required Report - public distribution
Commodities:
Production
Indonesian palm oil plantings are slowing, with Post estimating a one percent expansion in 2016/17.
Several factors have slowed planting. These include land ownership conflicts, with industry contacts
reporting that the lack of an effective system to resolve land title disputes prevents new land from
coming into production. Likewise, industry contacts also report that declining palm oil prices may have
some short term effect on new plantings and plantation replacement.
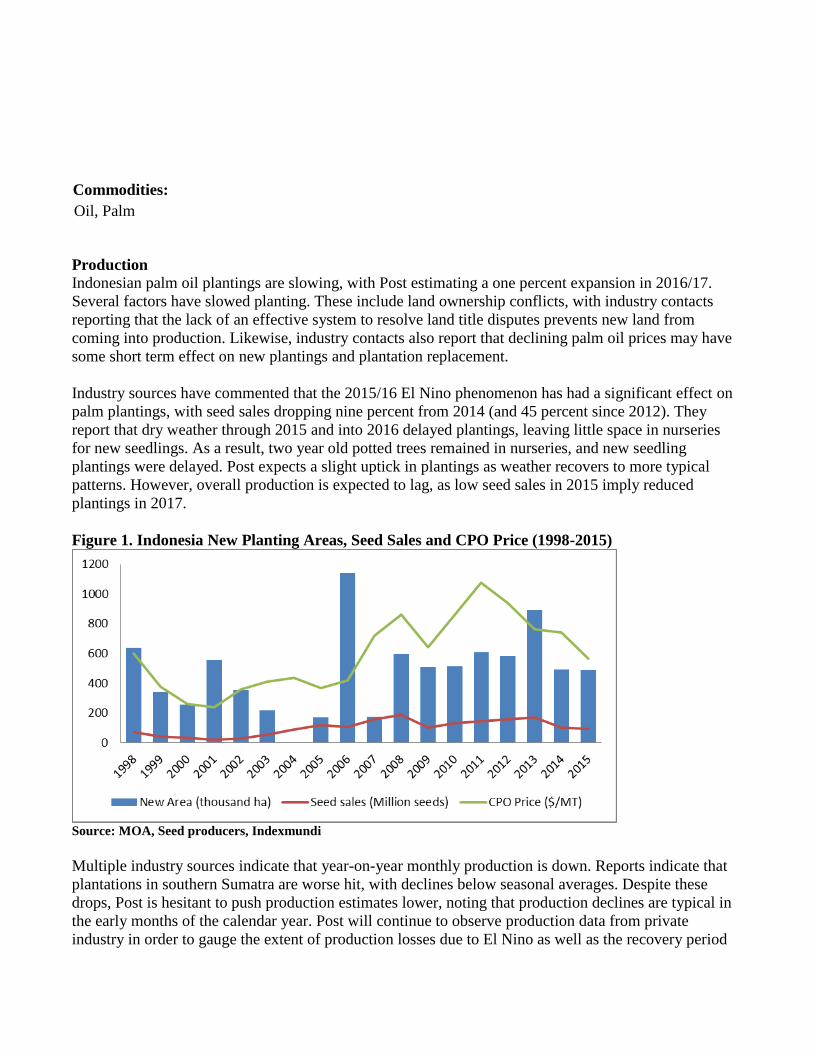
Industry sources have commented that the 2015/16 El Nino phenomenon has had a significant effect on
palm plantings, with seed sales dropping nine percent from 2014 (and 45 percent since 2012). They
report that dry weather through 2015 and into 2016 delayed plantings, leaving little space in nurseries
for new seedlings. As a result, two year old potted trees remained in nurseries, and new seedling
plantings were delayed. Post expects a slight uptick in plantings as weather recovers to more typical
patterns. However, overall production is expected to lag, as low seed sales in 2015 imply reduced
plantings in 2017.
Figure 1. Indonesia New Planting Areas, Seed Sales and CPO Price (1998-2015)
Source: MOA, Seed producers, Indexmundi
Multiple industry sources indicate that year-on-year monthly production is down. Reports indicate that
plantations in southern Sumatra are worse hit, with declines below seasonal averages. Despite these
drops, Post is hesitant to push production estimates lower, noting that production declines are typical in
the early months of the calendar year. Post will continue to observe production data from private
industry in order to gauge the extent of production losses due to El Nino as well as the recovery period
Oil, Palm
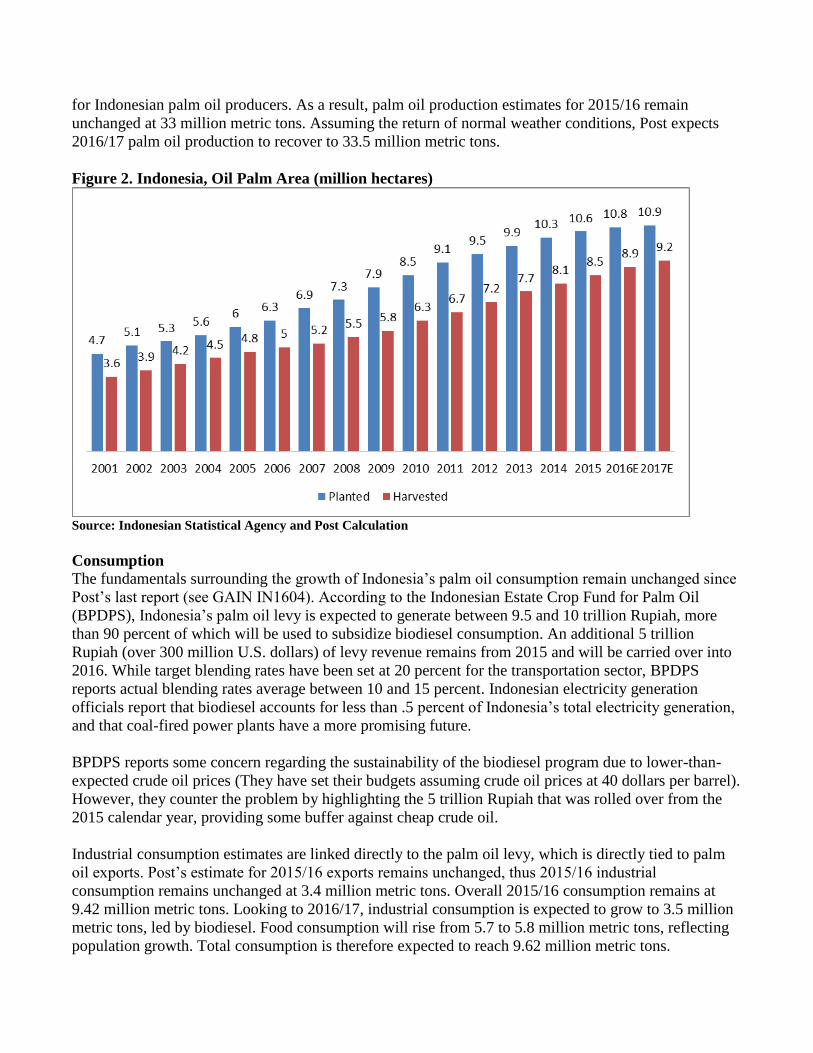
for Indonesian palm oil producers. As a result, palm oil production estimates for 2015/16 remain
unchanged at 33 million metric tons. Assuming the return of normal weather conditions, Post expects
2016/17 palm oil production to recover to 33.5 million metric tons.
Figure 2. Indonesia, Oil Palm Area (million hectares)
Source: Indonesian Statistical Agency and Post Calculation
Consumption
The fundamentals surrounding the growth of Indonesia’s palm oil consumption remain unchanged since
Post’s last report (see GAIN IN1604). According to the Indonesian Estate Crop Fund for Palm Oil
(BPDPS), Indonesia’s palm oil levy is expected to generate between 9.5 and 10 trillion Rupiah, more
than 90 percent of which will be used to subsidize biodiesel consumption. An additional 5 trillion
Rupiah (over 300 million U.S. dollars) of levy revenue remains from 2015 and will be carried over into
2016. While target blending rates have been set at 20 percent for the transportation sector, BPDPS
reports actual blending rates average between 10 and 15 percent. Indonesian electricity generation
officials report that biodiesel accounts for less than .5 percent of Indonesia’s total electricity generation,
and that coal-fired power plants have a more promising future.
BPDPS reports some concern regarding the sustainability of the biodiesel program due to lower-than-
expected crude oil prices (They have set their budgets assuming crude oil prices at 40 dollars per barrel).
However, they counter the problem by highlighting the 5 trillion Rupiah that was rolled over from the
2015 calendar year, providing some buffer against cheap crude oil.
Industrial consumption estimates are linked directly to the palm oil levy, which is directly tied to palm
oil exports. Post’s estimate for 2015/16 exports remains unchanged, thus 2015/16 industrial
consumption remains unchanged at 3.4 million metric tons. Overall 2015/16 consumption remains at
9.42 million metric tons. Looking to 2016/17, industrial consumption is expected to grow to 3.5 million
metric tons, led by biodiesel. Food consumption will rise from 5.7 to 5.8 million metric tons, reflecting
population growth. Total consumption is therefore expected to reach 9.62 million metric tons.
Trade
Export estimates for 2015/16 remain unchanged at 24 million metric tons. Advance trade data shows a
16 percent month-on-month decline from December to January, but 20 percent higher than shipments
from January 2015. Likewise, first quarter shipments are on pace to reach 24 million metric tons.
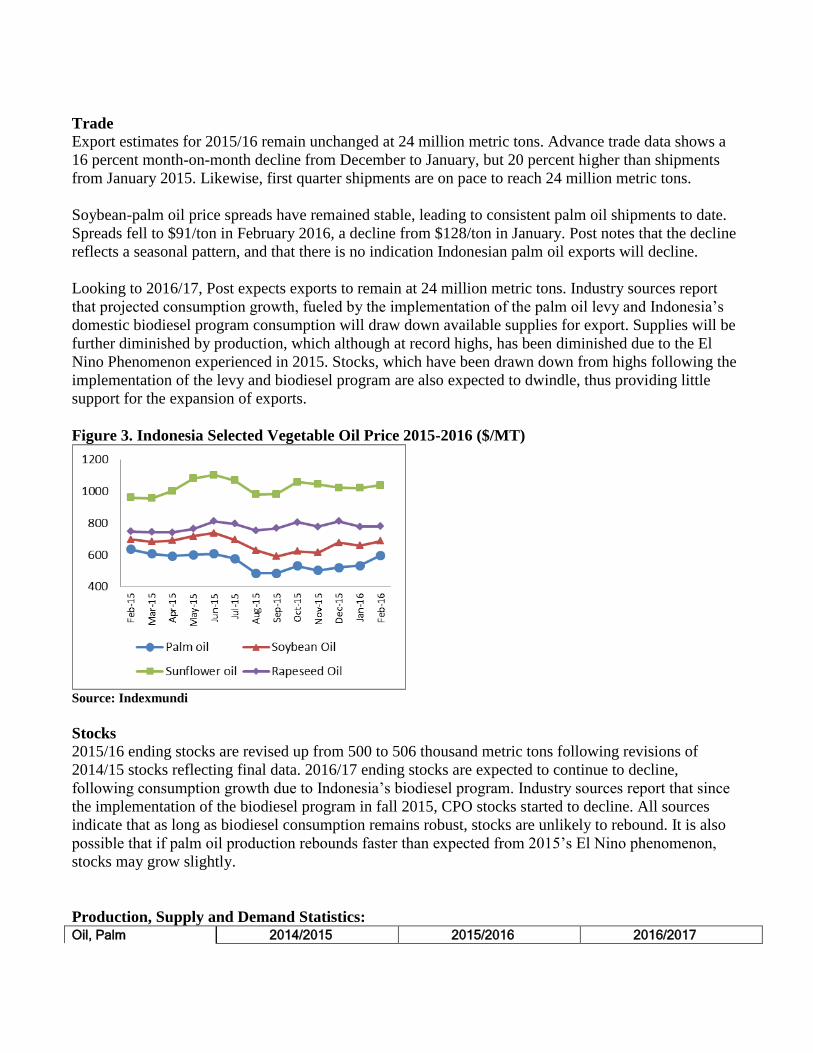
Soybean-palm oil price spreads have remained stable, leading to consistent palm oil shipments to date.
Spreads fell to $91/ton in February 2016, a decline from $128/ton in January. Post notes that the decline
reflects a seasonal pattern, and that there is no indication Indonesian palm oil exports will decline.
Looking to 2016/17, Post expects exports to remain at 24 million metric tons. Industry sources report
that projected consumption growth, fueled by the implementation of the palm oil levy and Indonesia’s
domestic biodiesel program consumption will draw down available supplies for export. Supplies will be
further diminished by production, which although at record highs, has been diminished due to the El
Nino Phenomenon experienced in 2015. Stocks, which have been drawn down from highs following the
implementation of the levy and biodiesel program are also expected to dwindle, thus providing little
support for the expansion of exports.
Figure 3. Indonesia Selected Vegetable Oil Price 2015-2016 ($/MT)
Source: Indexmundi
Stocks
2015/16 ending stocks are revised up from 500 to 506 thousand metric tons following revisions of
2014/15 stocks reflecting final data. 2016/17 ending stocks are expected to continue to decline,
following consumption growth due to Indonesia’s biodiesel program. Industry sources report that since
the implementation of the biodiesel program in fall 2015, CPO stocks started to decline. All sources
indicate that as long as biodiesel consumption remains robust, stocks are unlikely to rebound. It is also
possible that if palm oil production rebounds faster than expected from 2015’s El Nino phenomenon,
stocks may grow slightly.
Production, Supply and Demand Statistics: Oil, Palm 2014/2015 2015/2016 2016/2017
Market Begin Year Oct-14 Oct-15 Oct-16
Indonesia USDA Official
New Post
USDA Official
New Post
USDA Official
New Post
Area Planted 0 0 0 0 0 0
Area Harvested 8540 8540 8965 8965 0 9200
Trees 0 0 0 0 0 0
Beginning Stocks 1546 1546 1626 926 0 506
Production 33000 33000 33000 33000 0 33500
MY Imports 0 0 0 0 0 0
MY Imp. from U.S. 0 0 0 0 0 0
MY Imp. from EU 0 0 0 0 0 0
Total Supply 34546 34546 34626 33926 0 34006
MY Exports 25300 25800 24500 24000 0 24000
MY Exp. to EU 3800 3800 3500 3500 0 3500
Industrial Dom.
Cons. 2000 2000 2900 3400 0 3500
Food Use Dom. Cons. 5300 5500 5400 5700 0 5800
Feed Waste Dom.
Cons. 320 320 320 320 0 320
Total Dom. Cons. 7620 7820 8620 9420 0 9620
Ending Stocks 1626 926 1506 506 0 386
Total Distribution 34546 34546 34626 33926 0 34006
(1000 HA) ,(1000 TREES) ,(1000 MT)
Commodities:
Oilseed, Palm Kernel
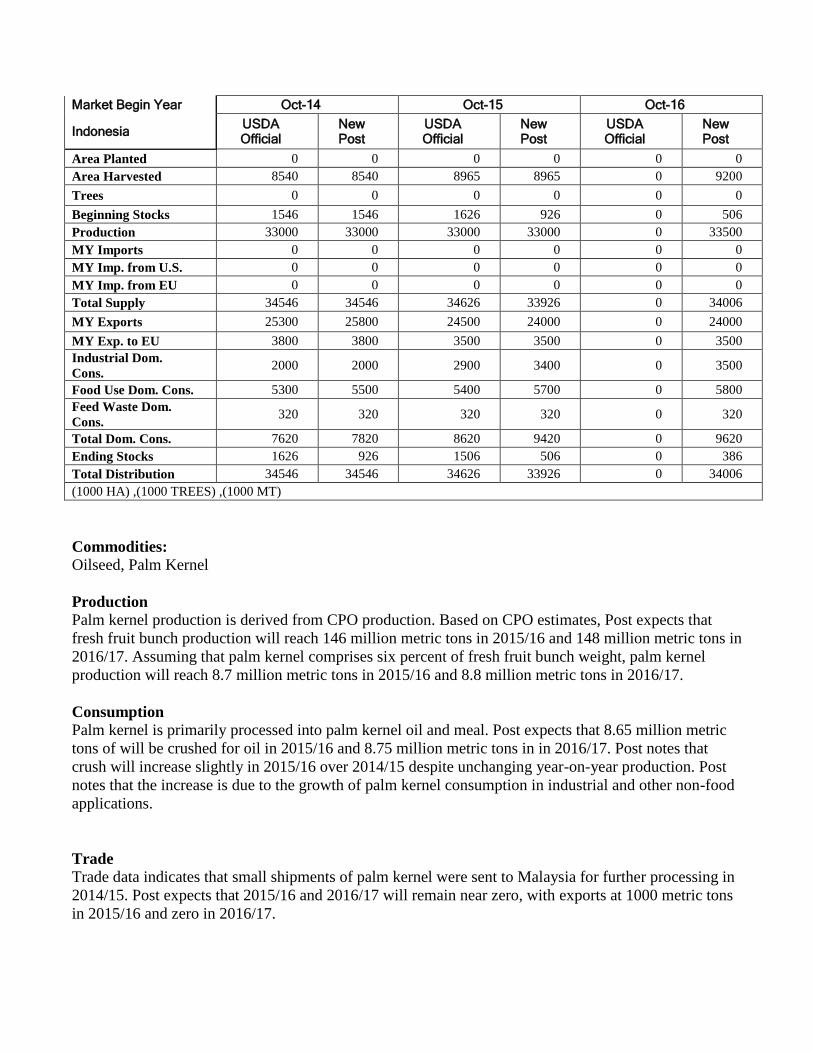
Production
Palm kernel production is derived from CPO production. Based on CPO estimates, Post expects that
fresh fruit bunch production will reach 146 million metric tons in 2015/16 and 148 million metric tons in
2016/17. Assuming that palm kernel comprises six percent of fresh fruit bunch weight, palm kernel
production will reach 8.7 million metric tons in 2015/16 and 8.8 million metric tons in 2016/17.
Consumption
Palm kernel is primarily processed into palm kernel oil and meal. Post expects that 8.65 million metric
tons of will be crushed for oil in 2015/16 and 8.75 million metric tons in in 2016/17. Post notes that
crush will increase slightly in 2015/16 over 2014/15 despite unchanging year-on-year production. Post
notes that the increase is due to the growth of palm kernel consumption in industrial and other non-food
applications.
Trade
Trade data indicates that small shipments of palm kernel were sent to Malaysia for further processing in
2014/15. Post expects that 2015/16 and 2016/17 will remain near zero, with exports at 1000 metric tons
in 2015/16 and zero in 2016/17.
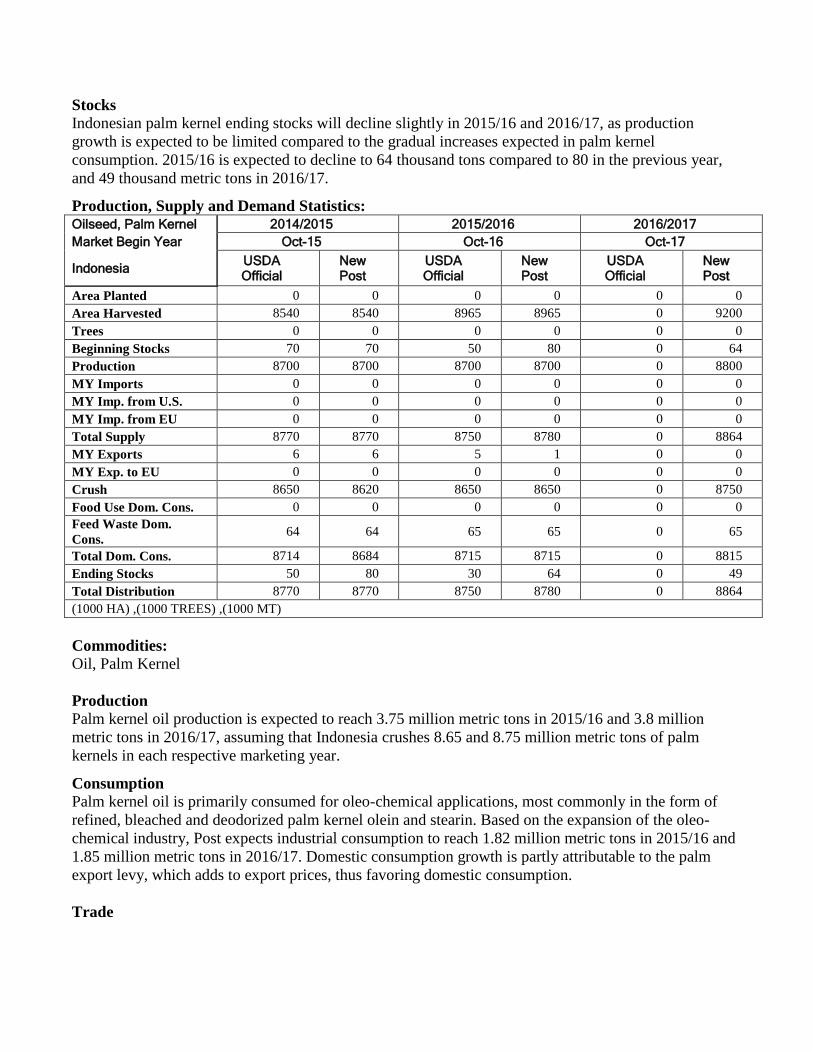
Stocks
Indonesian palm kernel ending stocks will decline slightly in 2015/16 and 2016/17, as production
growth is expected to be limited compared to the gradual increases expected in palm kernel
consumption. 2015/16 is expected to decline to 64 thousand tons compared to 80 in the previous year,
and 49 thousand metric tons in 2016/17. Production, Supply and Demand Statistics: Oilseed, Palm Kernel 2014/2015 2015/2016 2016/2017
Market Begin Year Oct-15 Oct-16 Oct-17
Indonesia USDA Official
New Post
USDA Official
New Post
USDA Official
New Post
Area Planted 0 0 0 0 0 0
Area Harvested 8540 8540 8965 8965 0 9200
Trees 0 0 0 0 0 0
Beginning Stocks 70 70 50 80 0 64
Production 8700 8700 8700 8700 0 8800
MY Imports 0 0 0 0 0 0
MY Imp. from U.S. 0 0 0 0 0 0
MY Imp. from EU 0 0 0 0 0 0
Total Supply 8770 8770 8750 8780 0 8864
MY Exports 6 6 5 1 0 0
MY Exp. to EU 0 0 0 0 0 0
Crush 8650 8620 8650 8650 0 8750
Food Use Dom. Cons. 0 0 0 0 0 0
Feed Waste Dom.
Cons. 64 64 65 65 0 65
Total Dom. Cons. 8714 8684 8715 8715 0 8815
Ending Stocks 50 80 30 64 0 49
Total Distribution 8770 8770 8750 8780 0 8864
(1000 HA) ,(1000 TREES) ,(1000 MT)
Commodities:
Oil, Palm Kernel
Production
Palm kernel oil production is expected to reach 3.75 million metric tons in 2015/16 and 3.8 million
metric tons in 2016/17, assuming that Indonesia crushes 8.65 and 8.75 million metric tons of palm
kernels in each respective marketing year. Consumption
Palm kernel oil is primarily consumed for oleo-chemical applications, most commonly in the form of
refined, bleached and deodorized palm kernel olein and stearin. Based on the expansion of the oleo-
chemical industry, Post expects industrial consumption to reach 1.82 million metric tons in 2015/16 and
1.85 million metric tons in 2016/17. Domestic consumption growth is partly attributable to the palm
export levy, which adds to export prices, thus favoring domestic consumption.
Trade
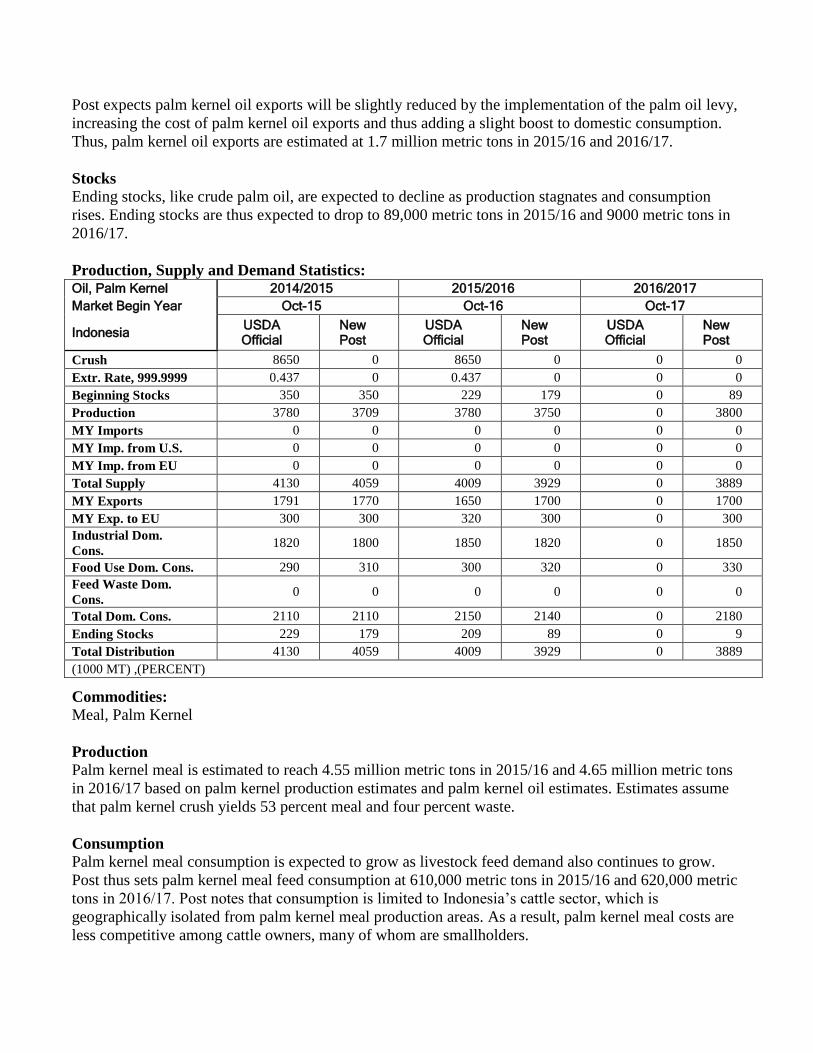
Post expects palm kernel oil exports will be slightly reduced by the implementation of the palm oil levy,
increasing the cost of palm kernel oil exports and thus adding a slight boost to domestic consumption.
Thus, palm kernel oil exports are estimated at 1.7 million metric tons in 2015/16 and 2016/17.
Stocks
Ending stocks, like crude palm oil, are expected to decline as production stagnates and consumption
rises. Ending stocks are thus expected to drop to 89,000 metric tons in 2015/16 and 9000 metric tons in
2016/17.
Production, Supply and Demand Statistics: Oil, Palm Kernel 2014/2015 2015/2016 2016/2017
Market Begin Year Oct-15 Oct-16 Oct-17
Indonesia USDA Official
New Post
USDA Official
New Post
USDA Official
New Post
Crush 8650 0 8650 0 0 0
Extr. Rate, 999.9999 0.437 0 0.437 0 0 0
Beginning Stocks 350 350 229 179 0 89
Production 3780 3709 3780 3750 0 3800
MY Imports 0 0 0 0 0 0
MY Imp. from U.S. 0 0 0 0 0 0
MY Imp. from EU 0 0 0 0 0 0
Total Supply 4130 4059 4009 3929 0 3889
MY Exports 1791 1770 1650 1700 0 1700
MY Exp. to EU 300 300 320 300 0 300
Industrial Dom.
Cons. 1820 1800 1850 1820 0 1850
Food Use Dom. Cons. 290 310 300 320 0 330
Feed Waste Dom.
Cons. 0 0 0 0 0 0
Total Dom. Cons. 2110 2110 2150 2140 0 2180
Ending Stocks 229 179 209 89 0 9
Total Distribution 4130 4059 4009 3929 0 3889
(1000 MT) ,(PERCENT) Commodities:
Meal, Palm Kernel
Production
Palm kernel meal is estimated to reach 4.55 million metric tons in 2015/16 and 4.65 million metric tons
in 2016/17 based on palm kernel production estimates and palm kernel oil estimates. Estimates assume
that palm kernel crush yields 53 percent meal and four percent waste.
Consumption
Palm kernel meal consumption is expected to grow as livestock feed demand also continues to grow.
Post thus sets palm kernel meal feed consumption at 610,000 metric tons in 2015/16 and 620,000 metric
tons in 2016/17. Post notes that consumption is limited to Indonesia’s cattle sector, which is
geographically isolated from palm kernel meal production areas. As a result, palm kernel meal costs are
less competitive among cattle owners, many of whom are smallholders.
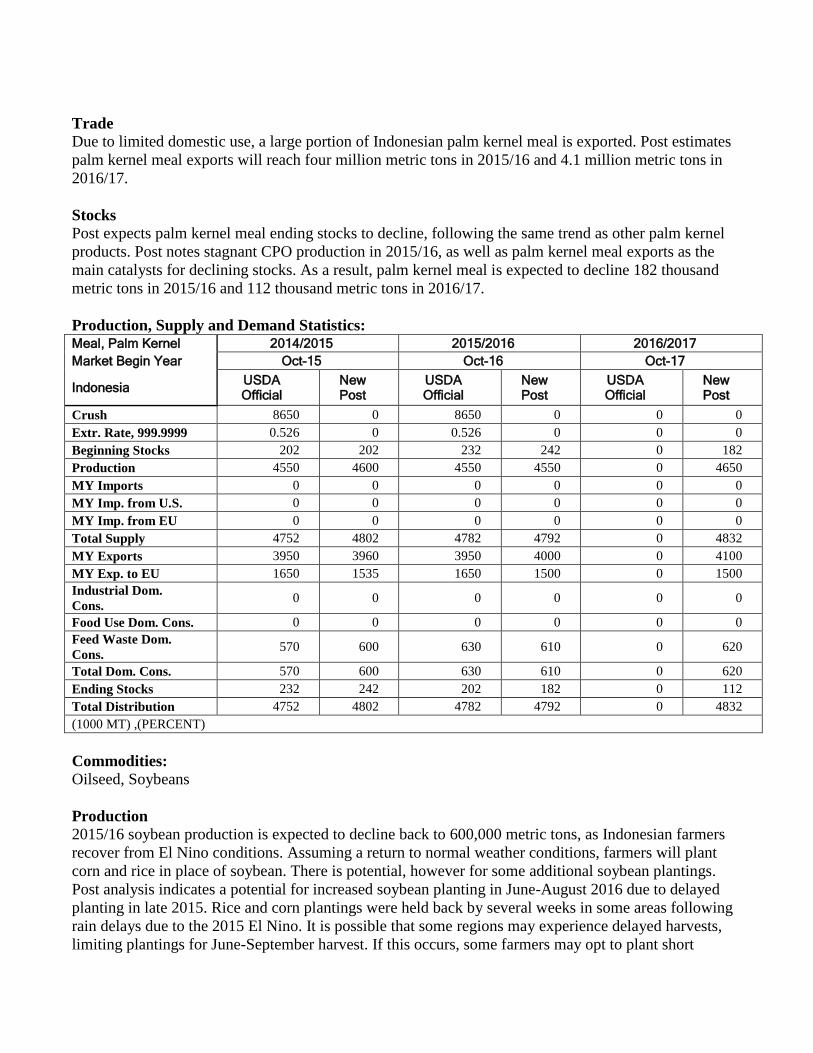
Trade
Due to limited domestic use, a large portion of Indonesian palm kernel meal is exported. Post estimates
palm kernel meal exports will reach four million metric tons in 2015/16 and 4.1 million metric tons in
2016/17.
Stocks
Post expects palm kernel meal ending stocks to decline, following the same trend as other palm kernel
products. Post notes stagnant CPO production in 2015/16, as well as palm kernel meal exports as the
main catalysts for declining stocks. As a result, palm kernel meal is expected to decline 182 thousand
metric tons in 2015/16 and 112 thousand metric tons in 2016/17.
Production, Supply and Demand Statistics: Meal, Palm Kernel 2014/2015 2015/2016 2016/2017
Market Begin Year Oct-15 Oct-16 Oct-17
Indonesia USDA Official
New Post
USDA Official
New Post
USDA Official
New Post
Crush 8650 0 8650 0 0 0
Extr. Rate, 999.9999 0.526 0 0.526 0 0 0
Beginning Stocks 202 202 232 242 0 182
Production 4550 4600 4550 4550 0 4650
MY Imports 0 0 0 0 0 0
MY Imp. from U.S. 0 0 0 0 0 0
MY Imp. from EU 0 0 0 0 0 0
Total Supply 4752 4802 4782 4792 0 4832
MY Exports 3950 3960 3950 4000 0 4100
MY Exp. to EU 1650 1535 1650 1500 0 1500
Industrial Dom.
Cons. 0 0 0 0 0 0
Food Use Dom. Cons. 0 0 0 0 0 0
Feed Waste Dom.
Cons. 570 600 630 610 0 620
Total Dom. Cons. 570 600 630 610 0 620
Ending Stocks 232 242 202 182 0 112
Total Distribution 4752 4802 4782 4792 0 4832
(1000 MT) ,(PERCENT)
Commodities:
Oilseed, Soybeans
Production
2015/16 soybean production is expected to decline back to 600,000 metric tons, as Indonesian farmers
recover from El Nino conditions. Assuming a return to normal weather conditions, farmers will plant
corn and rice in place of soybean. There is potential, however for some additional soybean plantings.
Post analysis indicates a potential for increased soybean planting in June-August 2016 due to delayed
planting in late 2015. Rice and corn plantings were held back by several weeks in some areas following
rain delays due to the 2015 El Nino. It is possible that some regions may experience delayed harvests,
limiting plantings for June-September harvest. If this occurs, some farmers may opt to plant short
duration soy. Potential soy increases are expected to be nominal, however, unlikely to exceed the
magnitude of increases seen in 2014/15.
Post forecasts 2016/17 soybean production to remain stable at 600,000 metric tons. Despite Indonesia’s
emphasis on soybean self-sufficiency and efforts to grow production, Post has yet to observe any
changes that would indicate production growth. Low yields and limited profitability from soybeans
imply that Indonesian farmers will continue to plant rice or corn.
Consumption
Indonesian soybean consumption is dominated by human use. U.S. soybeans are preferred in Indonesia
due to their uniform size, color and suitability for tempeh and tofu manufacturing. Post expects that
tempeh and tofu will remain a preferred protein source in Indonesia, especially when considering the
rising costs of substitute animal proteins. Post’s total soybean consumption estimate therefore remains
unchained at 2.87 million metric tons 2015/16.
Looking to 2016/17, consumption patterns are not expected to change. Considering population growth,
Post estimates that consumption will grow to 2.9 million metric tons. Despite rising incomes and a
growing middle class, tempeh remains very cost competitive and maintains a popular place in
Indonesian diets across social classes.
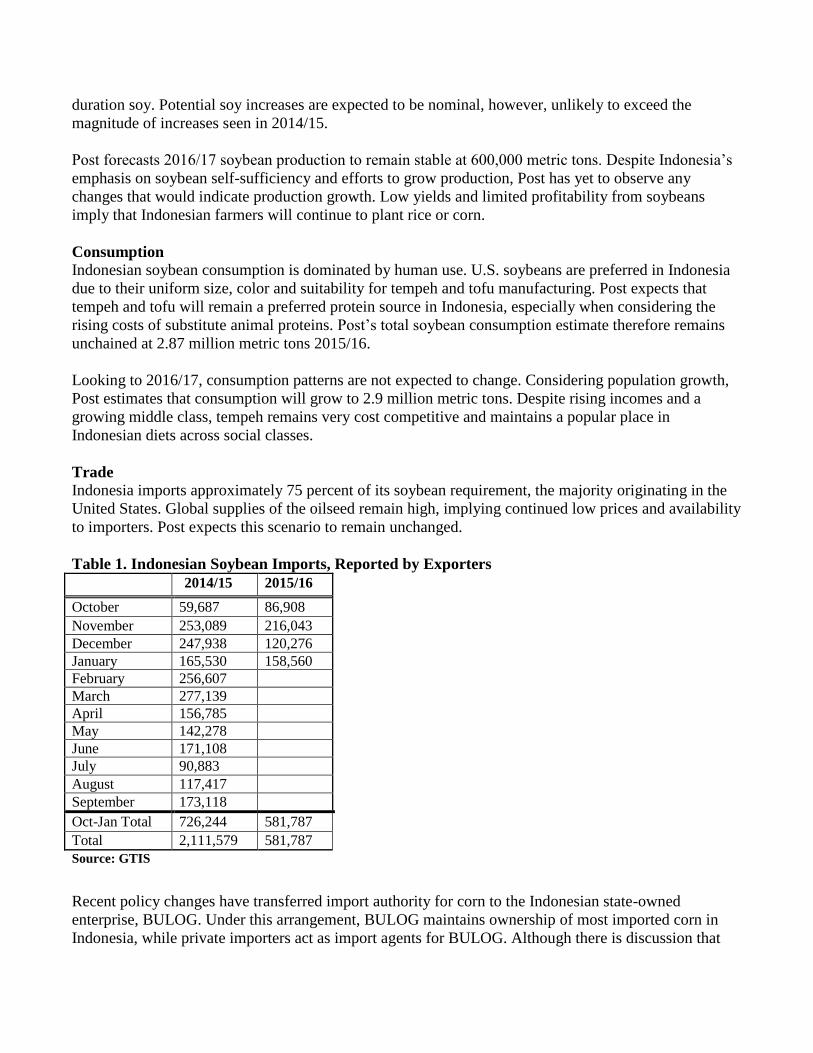
Trade
Indonesia imports approximately 75 percent of its soybean requirement, the majority originating in the
United States. Global supplies of the oilseed remain high, implying continued low prices and availability
to importers. Post expects this scenario to remain unchanged.
Table 1. Indonesian Soybean Imports, Reported by Exporters
2014/15 2015/16
October 59,687 86,908
November 253,089 216,043
December 247,938 120,276
January 165,530 158,560
February 256,607
March 277,139
April 156,785
May 142,278
June 171,108
July 90,883
August 117,417
September 173,118
Oct-Jan Total 726,244 581,787
Total 2,111,579 581,787
Source: GTIS
Recent policy changes have transferred import authority for corn to the Indonesian state-owned
enterprise, BULOG. Under this arrangement, BULOG maintains ownership of most imported corn in
Indonesia, while private importers act as import agents for BULOG. Although there is discussion that
BULOG may apply a similar policy to soybeans, Post believes that such a policy, if implemented, would
have little influence on the overall quantity of imported soybean. Post notes that previous efforts to
curtail soybean imports have been relatively ineffective, as demand far outweighs local production
capacity. As a result, post maintains its import estimate at 2.2 million metric tons for 2015/16, noting
that first quarter imports are on pace to achieve this level. 2016/17 imports are set at 2.35 million metric
tons, reflecting the consistent demand of a growing population.
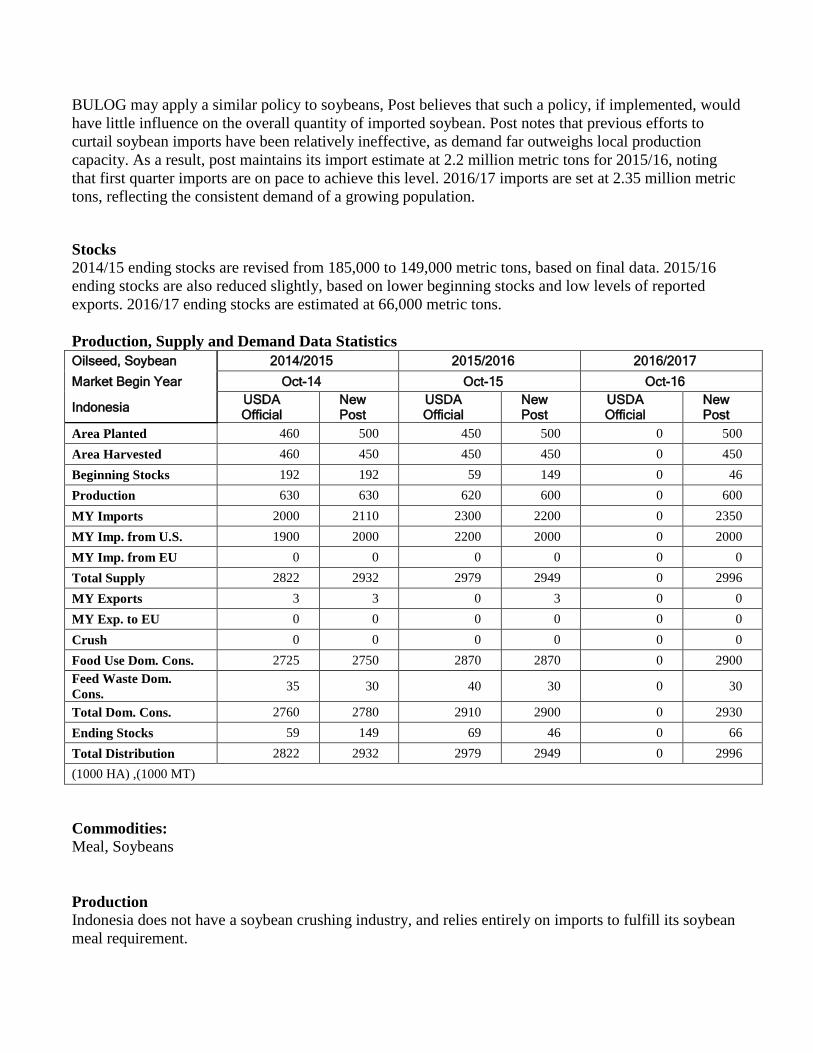
Stocks 2014/15 ending stocks are revised from 185,000 to 149,000 metric tons, based on final data. 2015/16
ending stocks are also reduced slightly, based on lower beginning stocks and low levels of reported
exports. 2016/17 ending stocks are estimated at 66,000 metric tons.
Production, Supply and Demand Data Statistics
Oilseed, Soybean 2014/2015 2015/2016 2016/2017
Market Begin Year Oct-14 Oct-15 Oct-16
Indonesia USDA Official
New Post
USDA Official
New Post
USDA Official
New Post
Area Planted 460 500 450 500 0 500
Area Harvested 460 450 450 450 0 450
Beginning Stocks 192 192 59 149 0 46
Production 630 630 620 600 0 600
MY Imports 2000 2110 2300 2200 0 2350
MY Imp. from U.S. 1900 2000 2200 2000 0 2000
MY Imp. from EU 0 0 0 0 0 0
Total Supply 2822 2932 2979 2949 0 2996
MY Exports 3 3 0 3 0 0
MY Exp. to EU 0 0 0 0 0 0
Crush 0 0 0 0 0 0
Food Use Dom. Cons. 2725 2750 2870 2870 0 2900
Feed Waste Dom.
Cons. 35 30 40 30 0 30
Total Dom. Cons. 2760 2780 2910 2900 0 2930
Ending Stocks 59 149 69 46 0 66
Total Distribution 2822 2932 2979 2949 0 2996
(1000 HA) ,(1000 MT)
Commodities:
Meal, Soybeans
Production
Indonesia does not have a soybean crushing industry, and relies entirely on imports to fulfill its soybean
meal requirement.
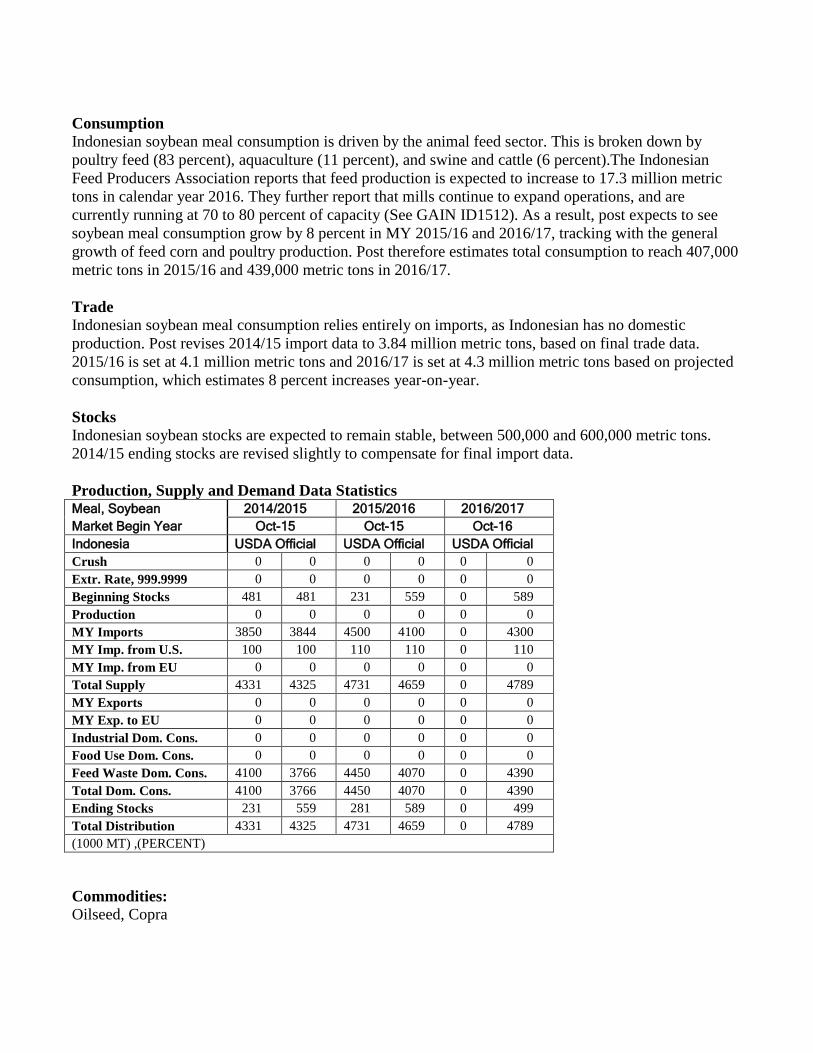
Consumption
Indonesian soybean meal consumption is driven by the animal feed sector. This is broken down by
poultry feed (83 percent), aquaculture (11 percent), and swine and cattle (6 percent).The Indonesian
Feed Producers Association reports that feed production is expected to increase to 17.3 million metric
tons in calendar year 2016. They further report that mills continue to expand operations, and are
currently running at 70 to 80 percent of capacity (See GAIN ID1512). As a result, post expects to see
soybean meal consumption grow by 8 percent in MY 2015/16 and 2016/17, tracking with the general
growth of feed corn and poultry production. Post therefore estimates total consumption to reach 407,000
metric tons in 2015/16 and 439,000 metric tons in 2016/17.
Trade
Indonesian soybean meal consumption relies entirely on imports, as Indonesian has no domestic
production. Post revises 2014/15 import data to 3.84 million metric tons, based on final trade data.
2015/16 is set at 4.1 million metric tons and 2016/17 is set at 4.3 million metric tons based on projected
consumption, which estimates 8 percent increases year-on-year.
Stocks
Indonesian soybean stocks are expected to remain stable, between 500,000 and 600,000 metric tons.
2014/15 ending stocks are revised slightly to compensate for final import data.
Production, Supply and Demand Data Statistics Meal, Soybean 2014/2015 2015/2016 2016/2017
Market Begin Year Oct-15 Oct-15 Oct-16
Indonesia USDA Official USDA Official USDA Official
Crush 0 0 0 0 0 0
Extr. Rate, 999.9999 0 0 0 0 0 0
Beginning Stocks 481 481 231 559 0 589
Production 0 0 0 0 0 0
MY Imports 3850 3844 4500 4100 0 4300
MY Imp. from U.S. 100 100 110 110 0 110
MY Imp. from EU 0 0 0 0 0 0
Total Supply 4331 4325 4731 4659 0 4789
MY Exports 0 0 0 0 0 0
MY Exp. to EU 0 0 0 0 0 0
Industrial Dom. Cons. 0 0 0 0 0 0
Food Use Dom. Cons. 0 0 0 0 0 0
Feed Waste Dom. Cons. 4100 3766 4450 4070 0 4390
Total Dom. Cons. 4100 3766 4450 4070 0 4390
Ending Stocks 231 559 281 589 0 499
Total Distribution 4331 4325 4731 4659 0 4789
(1000 MT) ,(PERCENT)
Commodities:
Oilseed, Copra
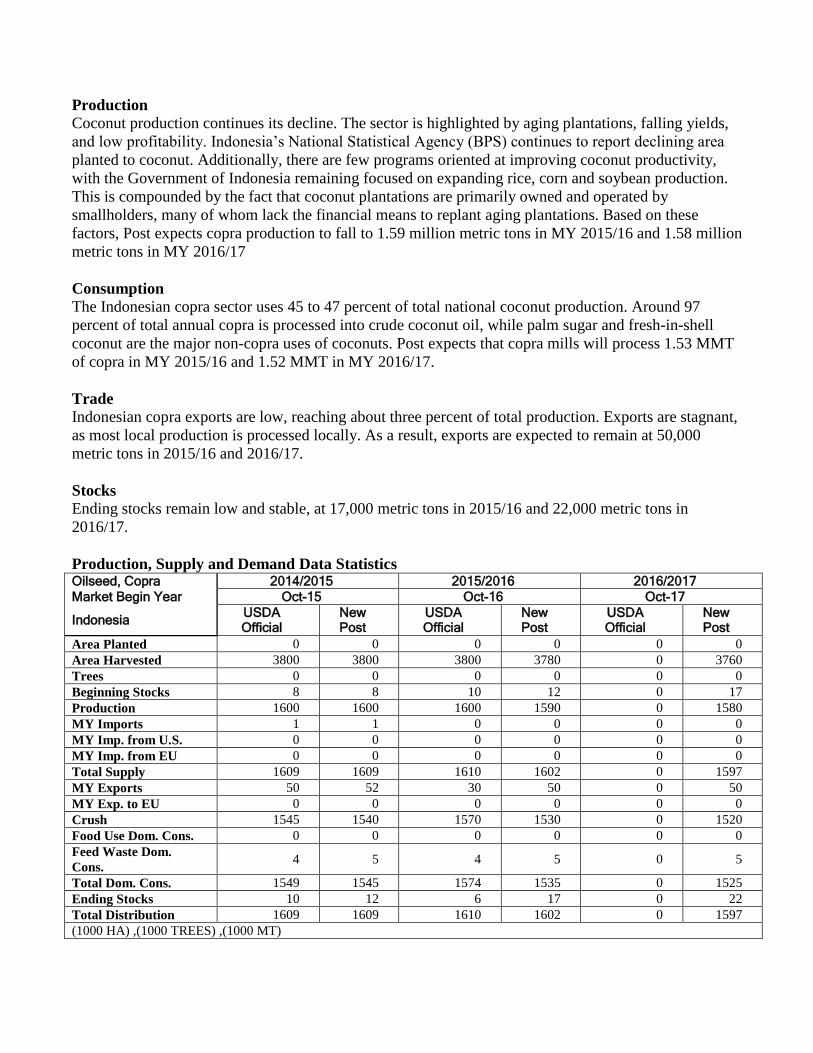
Production
Coconut production continues its decline. The sector is highlighted by aging plantations, falling yields,
and low profitability. Indonesia’s National Statistical Agency (BPS) continues to report declining area
planted to coconut. Additionally, there are few programs oriented at improving coconut productivity,
with the Government of Indonesia remaining focused on expanding rice, corn and soybean production.
This is compounded by the fact that coconut plantations are primarily owned and operated by
smallholders, many of whom lack the financial means to replant aging plantations. Based on these
factors, Post expects copra production to fall to 1.59 million metric tons in MY 2015/16 and 1.58 million
metric tons in MY 2016/17
Consumption
The Indonesian copra sector uses 45 to 47 percent of total national coconut production. Around 97
percent of total annual copra is processed into crude coconut oil, while palm sugar and fresh-in-shell
coconut are the major non-copra uses of coconuts. Post expects that copra mills will process 1.53 MMT
of copra in MY 2015/16 and 1.52 MMT in MY 2016/17.
Trade
Indonesian copra exports are low, reaching about three percent of total production. Exports are stagnant,
as most local production is processed locally. As a result, exports are expected to remain at 50,000
metric tons in 2015/16 and 2016/17.
Stocks
Ending stocks remain low and stable, at 17,000 metric tons in 2015/16 and 22,000 metric tons in
2016/17.
Production, Supply and Demand Data Statistics Oilseed, Copra 2014/2015 2015/2016 2016/2017
Market Begin Year Oct-15 Oct-16 Oct-17
Indonesia USDA Official
New Post
USDA Official
New Post
USDA Official
New Post
Area Planted 0 0 0 0 0 0
Area Harvested 3800 3800 3800 3780 0 3760
Trees 0 0 0 0 0 0
Beginning Stocks 8 8 10 12 0 17
Production 1600 1600 1600 1590 0 1580
MY Imports 1 1 0 0 0 0
MY Imp. from U.S. 0 0 0 0 0 0
MY Imp. from EU 0 0 0 0 0 0
Total Supply 1609 1609 1610 1602 0 1597
MY Exports 50 52 30 50 0 50
MY Exp. to EU 0 0 0 0 0 0
Crush 1545 1540 1570 1530 0 1520
Food Use Dom. Cons. 0 0 0 0 0 0
Feed Waste Dom.
Cons. 4 5 4 5 0 5
Total Dom. Cons. 1549 1545 1574 1535 0 1525
Ending Stocks 10 12 6 17 0 22
Total Distribution 1609 1609 1610 1602 0 1597
(1000 HA) ,(1000 TREES) ,(1000 MT)
Commodities:
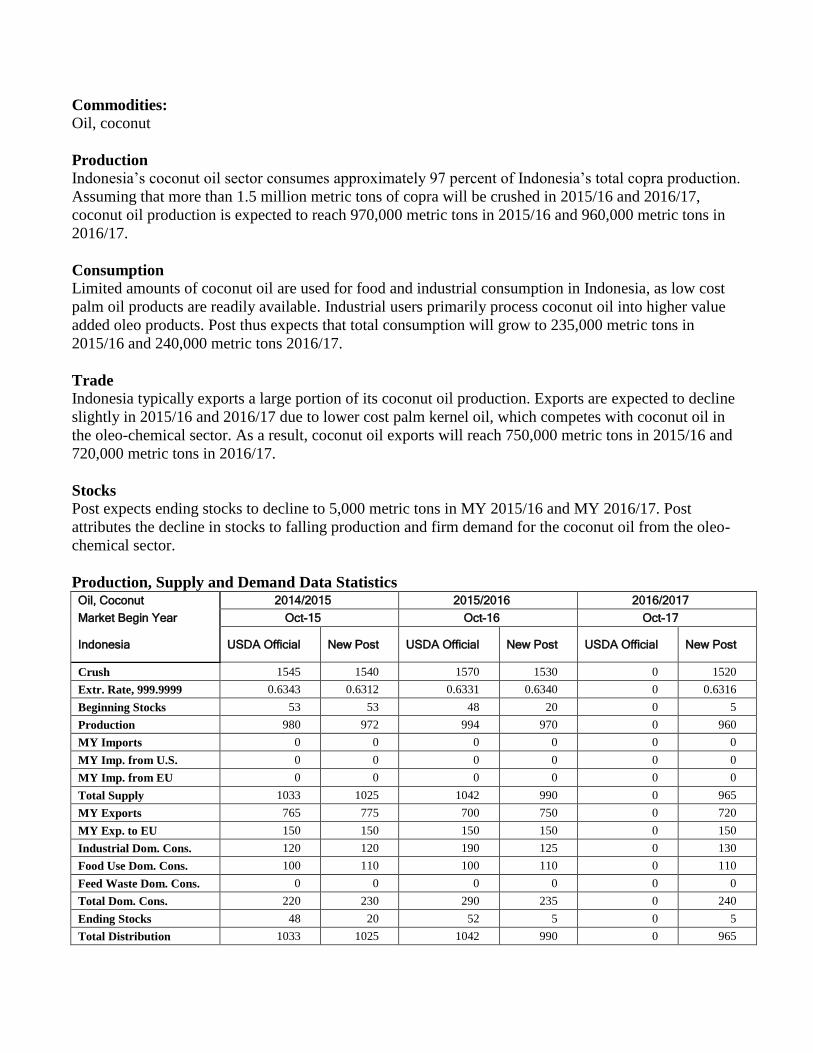
Oil, coconut
Production
Indonesia’s coconut oil sector consumes approximately 97 percent of Indonesia’s total copra production.
Assuming that more than 1.5 million metric tons of copra will be crushed in 2015/16 and 2016/17,
coconut oil production is expected to reach 970,000 metric tons in 2015/16 and 960,000 metric tons in
2016/17.
Consumption
Limited amounts of coconut oil are used for food and industrial consumption in Indonesia, as low cost
palm oil products are readily available. Industrial users primarily process coconut oil into higher value
added oleo products. Post thus expects that total consumption will grow to 235,000 metric tons in
2015/16 and 240,000 metric tons 2016/17.
Trade
Indonesia typically exports a large portion of its coconut oil production. Exports are expected to decline
slightly in 2015/16 and 2016/17 due to lower cost palm kernel oil, which competes with coconut oil in
the oleo-chemical sector. As a result, coconut oil exports will reach 750,000 metric tons in 2015/16 and
720,000 metric tons in 2016/17.
Stocks Post expects ending stocks to decline to 5,000 metric tons in MY 2015/16 and MY 2016/17. Post
attributes the decline in stocks to falling production and firm demand for the coconut oil from the oleo-
chemical sector.
Production, Supply and Demand Data Statistics Oil, Coconut 2014/2015 2015/2016 2016/2017
Market Begin Year Oct-15 Oct-16 Oct-17
Indonesia USDA Official New Post USDA Official New Post USDA Official New Post
Crush 1545 1540 1570 1530 0 1520
Extr. Rate, 999.9999 0.6343 0.6312 0.6331 0.6340 0 0.6316
Beginning Stocks 53 53 48 20 0 5
Production 980 972 994 970 0 960
MY Imports 0 0 0 0 0 0
MY Imp. from U.S. 0 0 0 0 0 0
MY Imp. from EU 0 0 0 0 0 0
Total Supply 1033 1025 1042 990 0 965
MY Exports 765 775 700 750 0 720
MY Exp. to EU 150 150 150 150 0 150
Industrial Dom. Cons. 120 120 190 125 0 130
Food Use Dom. Cons. 100 110 100 110 0 110
Feed Waste Dom. Cons. 0 0 0 0 0 0
Total Dom. Cons. 220 230 290 235 0 240
Ending Stocks 48 20 52 5 0 5
Total Distribution 1033 1025 1042 990 0 965
(1000 MT) ,(PERCENT)
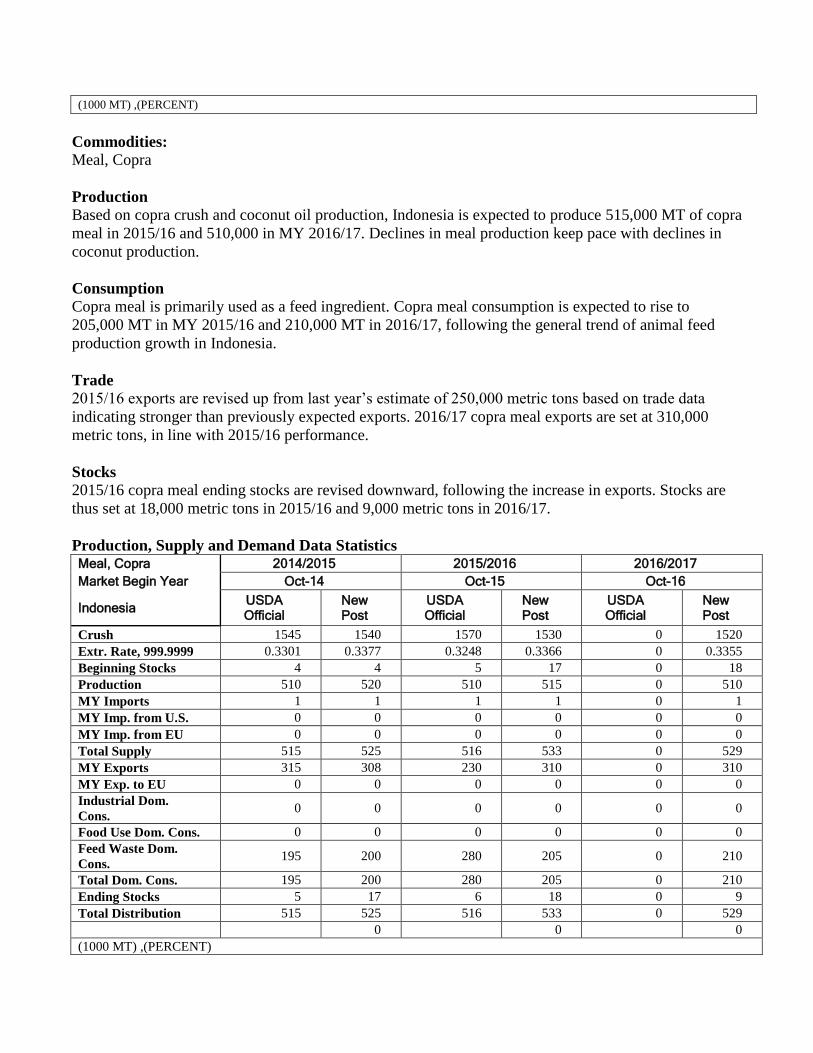
Commodities:
Meal, Copra
Production
Based on copra crush and coconut oil production, Indonesia is expected to produce 515,000 MT of copra
meal in 2015/16 and 510,000 in MY 2016/17. Declines in meal production keep pace with declines in
coconut production.
Consumption
Copra meal is primarily used as a feed ingredient. Copra meal consumption is expected to rise to
205,000 MT in MY 2015/16 and 210,000 MT in 2016/17, following the general trend of animal feed
production growth in Indonesia.
Trade
2015/16 exports are revised up from last year’s estimate of 250,000 metric tons based on trade data
indicating stronger than previously expected exports. 2016/17 copra meal exports are set at 310,000
metric tons, in line with 2015/16 performance.
Stocks
2015/16 copra meal ending stocks are revised downward, following the increase in exports. Stocks are
thus set at 18,000 metric tons in 2015/16 and 9,000 metric tons in 2016/17.
Production, Supply and Demand Data Statistics Meal, Copra 2014/2015 2015/2016 2016/2017
Market Begin Year Oct-14 Oct-15 Oct-16
Indonesia USDA Official
New Post
USDA Official
New Post
USDA Official
New Post
Crush 1545 1540 1570 1530 0 1520
Extr. Rate, 999.9999 0.3301 0.3377 0.3248 0.3366 0 0.3355
Beginning Stocks 4 4 5 17 0 18
Production 510 520 510 515 0 510
MY Imports 1 1 1 1 0 1
MY Imp. from U.S. 0 0 0 0 0 0
MY Imp. from EU 0 0 0 0 0 0
Total Supply 515 525 516 533 0 529
MY Exports 315 308 230 310 0 310
MY Exp. to EU 0 0 0 0 0 0
Industrial Dom.
Cons. 0 0 0 0 0 0
Food Use Dom. Cons. 0 0 0 0 0 0
Feed Waste Dom.
Cons. 195 200 280 205 0 210
Total Dom. Cons. 195 200 280 205 0 210
Ending Stocks 5 17 6 18 0 9
Total Distribution 515 525 516 533 0 529
0 0 0
(1000 MT) ,(PERCENT)
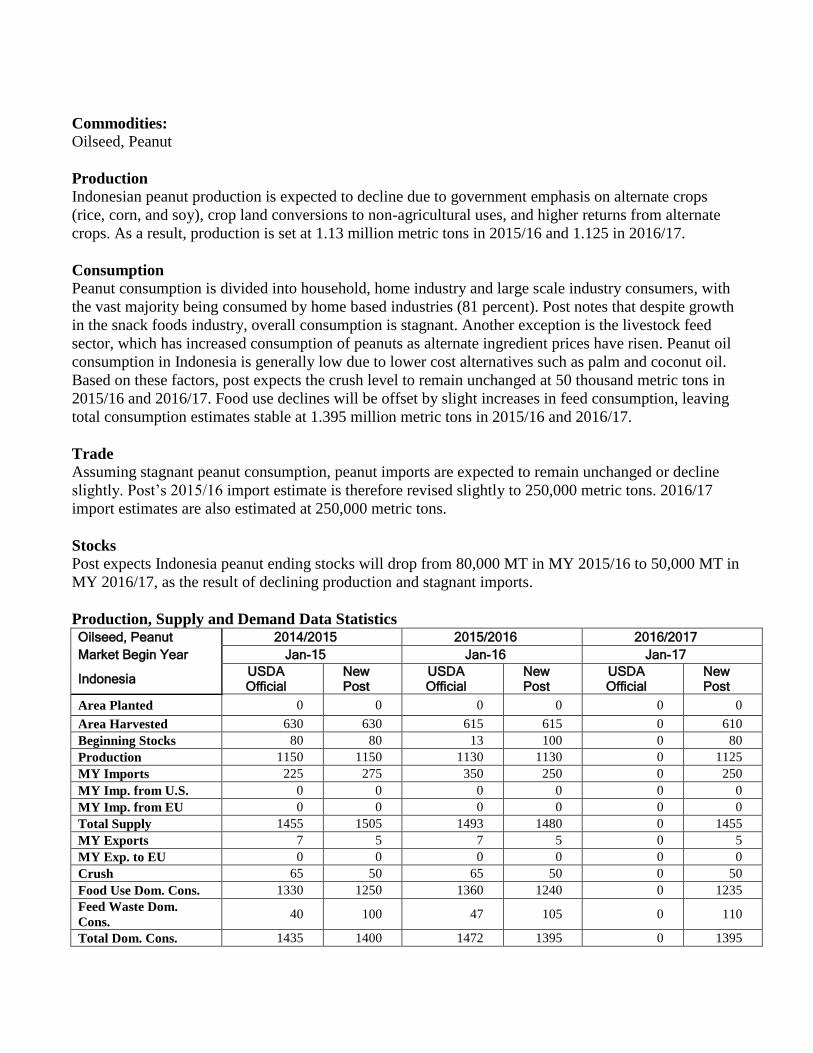
Commodities:
Oilseed, Peanut
Production
Indonesian peanut production is expected to decline due to government emphasis on alternate crops
(rice, corn, and soy), crop land conversions to non-agricultural uses, and higher returns from alternate
crops. As a result, production is set at 1.13 million metric tons in 2015/16 and 1.125 in 2016/17.
Consumption
Peanut consumption is divided into household, home industry and large scale industry consumers, with
the vast majority being consumed by home based industries (81 percent). Post notes that despite growth
in the snack foods industry, overall consumption is stagnant. Another exception is the livestock feed
sector, which has increased consumption of peanuts as alternate ingredient prices have risen. Peanut oil
consumption in Indonesia is generally low due to lower cost alternatives such as palm and coconut oil.
Based on these factors, post expects the crush level to remain unchanged at 50 thousand metric tons in
2015/16 and 2016/17. Food use declines will be offset by slight increases in feed consumption, leaving
total consumption estimates stable at 1.395 million metric tons in 2015/16 and 2016/17.
Trade
Assuming stagnant peanut consumption, peanut imports are expected to remain unchanged or decline
slightly. Post’s 2015/16 import estimate is therefore revised slightly to 250,000 metric tons. 2016/17
import estimates are also estimated at 250,000 metric tons.
Stocks
Post expects Indonesia peanut ending stocks will drop from 80,000 MT in MY 2015/16 to 50,000 MT in
MY 2016/17, as the result of declining production and stagnant imports.
Production, Supply and Demand Data Statistics Oilseed, Peanut 2014/2015 2015/2016 2016/2017
Market Begin Year Jan-15 Jan-16 Jan-17
Indonesia USDA Official
New Post
USDA Official
New Post
USDA Official
New Post
Area Planted 0 0 0 0 0 0
Area Harvested 630 630 615 615 0 610
Beginning Stocks 80 80 13 100 0 80
Production 1150 1150 1130 1130 0 1125
MY Imports 225 275 350 250 0 250
MY Imp. from U.S. 0 0 0 0 0 0
MY Imp. from EU 0 0 0 0 0 0
Total Supply 1455 1505 1493 1480 0 1455
MY Exports 7 5 7 5 0 5
MY Exp. to EU 0 0 0 0 0 0
Crush 65 50 65 50 0 50
Food Use Dom. Cons. 1330 1250 1360 1240 0 1235
Feed Waste Dom.
Cons. 40 100 47 105 0 110
Total Dom. Cons. 1435 1400 1472 1395 0 1395

Ending Stocks 13 100 14 80 0 55
Total Distribution 1455 1505 1493 1480 0 1455
0 0 0
(1000 HA) ,(1000 MT)


