Indicators for Disaster
Risk and Risk
Management
Programme for Latin-America
and The Caribbean
Belize
Inter-American
Development Bank
Environment, Rural Development and Disaster Risk Management Division (INE/RND)
TECHNICAL NOTES
No. IDB-TN-276
August 2011
Indicators for Disaster Risk and Risk
Management
Programme for Latin-America and The Caribbean
Belize
Inter-American Development Bank
2011
http://www.iadb.org The Inter-American Development Bank Technical Notes encompass a wide range of best practices, project evaluations, lessons learned, case studies, methodological notes, and other documents of a technical nature. The information and opinions presented in these publications are entirely those of the author(s), and no endorsement by the Inter-American Development Bank, its Board of Executive Directors, or the countries they represent is expressed or implied. This paper may be freely reproduced.
OPTIONAL: Type address for correspondence
OPTIONAL: Type Authors name and eMail
TABLE OF CONTENTS
1 NATIONAL CONTEXT 4
2 NATURAL HAZARDS 7
3 INDICATORS OF DISASTER RISK AND RISK MANAGEMENT 9
3.1 Disaster Deficit Index (DDI) 9 3.1.1 Reference parameters for the model 10 3.1.2 Estimation of the indicators 12
3.2 Prevalent Vulnerability Index (PVI) 16 3.2.1 Indicators of exposition and susceptibility 17 3.2.2 Indicators of socio-economic fragility 17 3.2.3 Indicators of resilience (lack of) 18 3.2.4 Estimation of indicators 19
3.3 Risk Management Index (RMI) 23 3.3.1 Institutional framework 24 3.3.2 Indicators of risk identification 25 3.3.3 Indicators of risk reduction 25 3.3.4 Indicators of disaster management 26 3.3.5 Indicators of governance and financial protection 26 3.3.6 Estimation of the indicators 27
4 CONCLUSIONS 32
5 BIBLIOGRAPHY 33
AI.1 SEISMIC HAZARD 36
AI.2 HYDROMETEOROLOGICAL HAZARDS 38
AI.3 HAZARD OF FLOODING 43
1 INTRODUCTION
Disaster risk is not only associated with the occurrence of intense physical phenomenon but
also with the vulnerability conditions that favour or facilitate disaster when such
phenomenon occur. Vulnerability is intimately related to social processes in disaster prone
areas and is usually related to the fragility, susceptibility or lack of resilience of the
population when faced with different hazards. In other words, disasters are socio-
environmental by nature and their materialization is the result of the social construction of
risk. Therefore, their reduction must be part of decision making processes. This is the case
not only with post disaster reconstruction but also with public policy formulation and
development planning. Due to this, institutional development must be strengthened and
investment stimulated in vulnerability reduction in order to contribute to the sustainable
development process in different countries.
In order to improve disaster risk understanding and disaster risk management
performance a transparent, representative and robust System of Indicators, easily
understood by public policymakers, relatively easy to update periodically and that allow
cluster and comparison between countries was developed by the Institute of Environmental
Studies (IDEA in Spanish) of the National University of Colombia, Manizales. This System
of Indicators was designed between 2003 and 2005 with the support of the Operation
ATN/JF-7906/07-RG “Information and Indicators Program for Disaster Risk Management”
of the Inter-American Development Bank (IDB).
This System of Indicators had three specific objectives: i) improvement in the use and
presentation of information on risk. This assists policymakers in identifying investment
priorities to reduce risk (such as prevention and mitigation measures), and directs the post
disaster recovery process; ii) to provide a way to measure key elements of vulnerability for
countries facing natural phenomena. It also provides a way to identify national risk
management capacities, as well as comparative data for evaluating the effects of policies
and investments on risk management; and iii) application of this methodology should
promote the exchange of technical information for public policy formulation and risk
management programs throughout the region. The System of Indicators was developed to
be useful not only for the countries but also for the Bank, facilitating the individual
monitoring of each country and the comparison between the countries of the region.
The first phase of the Program of Indicators IDB-IDEA involved the methodological
development, the formulation of the indicators and the evaluation of twelve countries from
1985 to 2000. Afterwards of two additional countries were evaluated with the support of
the Policy Regional Dialogue on Natural Disasters. In 2008 a methodological review and the
updating of the indicators for twelve countries was made in the framework of the Operation
RG-T1579/ATN/MD-11238-RG. Indicators were updating to 2005 and for the most recent
date according to information availability (2007 or 2008) for Argentina, Bolivia, Chile,
Colombia, Ecuador, Jamaica, Mexico, Peru, Dominican Republic and Trinidad and Tobago1.
In addition, Barbados, Panama and Belize were included in the program. This report has been
made using –with some adjustments that in each case are referenced– the methodologies
formulated in the first phase of the Program of Indicators IDB-IDEA2
The System of Indicators abovementioned attempts risk and vulnerability
benchmarking using relative indicators in order to facilitate access to relevant information
by national level decision makers which facilitates the identification and proposal of
effective disaster risk management policies and actions. Their underlying models search to
represent risk and risk management at a national scale, allowing the identification of its
essential economic and social characteristics and a comparison of these aspects and the risk
context in different countries.
The System of Indicators proposed permits the benchmarking of the evaluations of each
country in different periods. It assists the move toward a more analytically rigorous and
data driven approach to risk management decision-making. This measurement approach
enables:
• Representation of disaster risk at the national level, allowing the identification of
key issues relating to their characterization from an economic and social point of
view.
1 Last period, in general, is considered tentative or preliminary because usually, most recent values are not totally confirmed and it is common that some of them change, such as it has been verified in this updating with values that were used in the previous evaluation (2005). 2 More information and details of methodologies can be found in IDEA (2005). “System of Indicators of Disaster Risk and Risk Management: Main Technical Report”. Program of Indicators for Disaster Risk and Risksk Management IDB – IDEA, Universidad Nacional de Colombia, Manizales. http://idea.unalmzl.edu.co
• Risk management performance benchmarking of the different countries to determine
performance targets for improving management effectiveness.
Due to a lack of parameters, the need to suggest some qualitative indicators measured
on subjective scales is unavoidable. This is the case with risk management indicators. The
weighting or pondering of some indices has been undertaken using expert opinion and
informants at the national level. Analysis has been achieved using numerical techniques
that are consistent from the theoretical and statistical perspectives.
Four components or composite indicators reflect the principal elements that represent
vulnerability and show the advance of different countries in risk management. This is
achieved in the following way:
1. The Disaster Deficit Index, DDI, measures country risk from a macro-economic and
financial perspective when faced with possible catastrophic events. This requires an
estimation of critical impacts during a given exposure time and of the capacity of
the country to face up to this situation financially.
2. The Local Disaster Index, LDI, identify the social and environmental risk that
derives from more recurrent lower level events which are often chronic at the local
and sub national levels. These particularly affect the more socially and
economically fragile population and generate a highly damaging impact on the
countries development.
3. The Prevalent Vulnerability Index, PVI, is made up of a series of indicators that
characterize prevailing vulnerability conditions reflected in exposure in prone areas,
socioeconomic fragility and lack of resilience in general.
4. The Risk Management Index, RMI, brings together a group of indicators related to
the risk management performance of the country. These reflect the organizational,
development, capacity and institutional action taken to reduce vulnerability and
losses, to prepare for crisis and efficiently recover.
In this way, the System of Indicators covers different aspects of the risk problematic
and takes into account aspects such as: potential damage and loss due to the probability of
extreme events, recurrent disasters or losses, socio-environmental conditions that facilitate
disasters, capacity for macroeconomic recovery, behaviour of key services, institutional
capacity and the effectiveness of basic risk management instruments such as risk
identification, prevention and mitigation measures, financial mechanisms and risk transfer,
emergency response levels and preparedness and recovery capacity (Cardona 2008). Each
index has a number of variables that are associated with it and empirically measured. The
choice of variables was driven by a consideration of a number of factors including: country
coverage, the soundness of the data, direct relevance to the phenomenon that the indicators
are intended to measure, and quality. Wherever possible it is sought to use direct measures
of the phenomena is wanted to capture. But in some cases, proxies3 had to be employed. In
general it is sought variables with extensive country coverage but chose in some cases to
make use of variables with narrow coverage if they measured critical aspects of risk that
would otherwise be overlooked.
This report presents only the updated or new results for the country and there will be
not found detailed methodological explanations because they are not the scope of this
report. Information related to the methodology and the previous results of the System of
Indicators can be found at: http://idea.unalmzl.edu.co, where details on conceptual
framework, methodological support, data treatment and statistical techniques used in the
modelling are presented (Cardona et al 2003a/b; 2004 a/b).
2 NATIONAL CONTEXT
Belize (formerly British Honduras until the name of the country was changed in 1973) lies
on the eastern or Caribbean coast of Central America, bounded on the north and part of the
west by Mexico, and on the south and the remainder of the west by Guatemala. The inner
coastal waters are shallow and are sheltered by a line of coral reefs, dotted with islets called
'cayes', extending almost the entire length of the country.
There is a low coastal plain, much of it covered with mangrove swamp, but the land
rises gradually towards the interior. The Maya Mountains and the Cockscomb Range form
the backbone of the southern half of the country, the highest point being Doyle's Delight
(1124 meters above sea level) in the Cockscomb Range. The Cayo District in the west
3 Due to the lack of detailed information for coarse grain results it is possible using alternative figures of other related data that reflect indirectly the information needed.
includes the Mountain Pine Ridge, ranging from 305 to around 914 metres above sea level.
The northern districts contain considerable areas of tableland. There are many rivers, some
of them navigable for short distances by shallow-draught vessels. A large part of the
mainland is forest.
The area of the mainland and cayes is 8,867 square miles. The country's greatest length
from north to south is 174 miles and its greatest width is 68 miles. The climate is
subtropical, tempered by trade winds. Temperatures in coastal districts range from about 10
°C (50°F) to about 35.6°C (96°F); inland the range is greater. Rainfall varies from an
average of 1,295 millimetres in the north to 4,445 millimetres in the extreme south. The dry
season usually extends from February to May and there is sometimes a dry spell in August.4
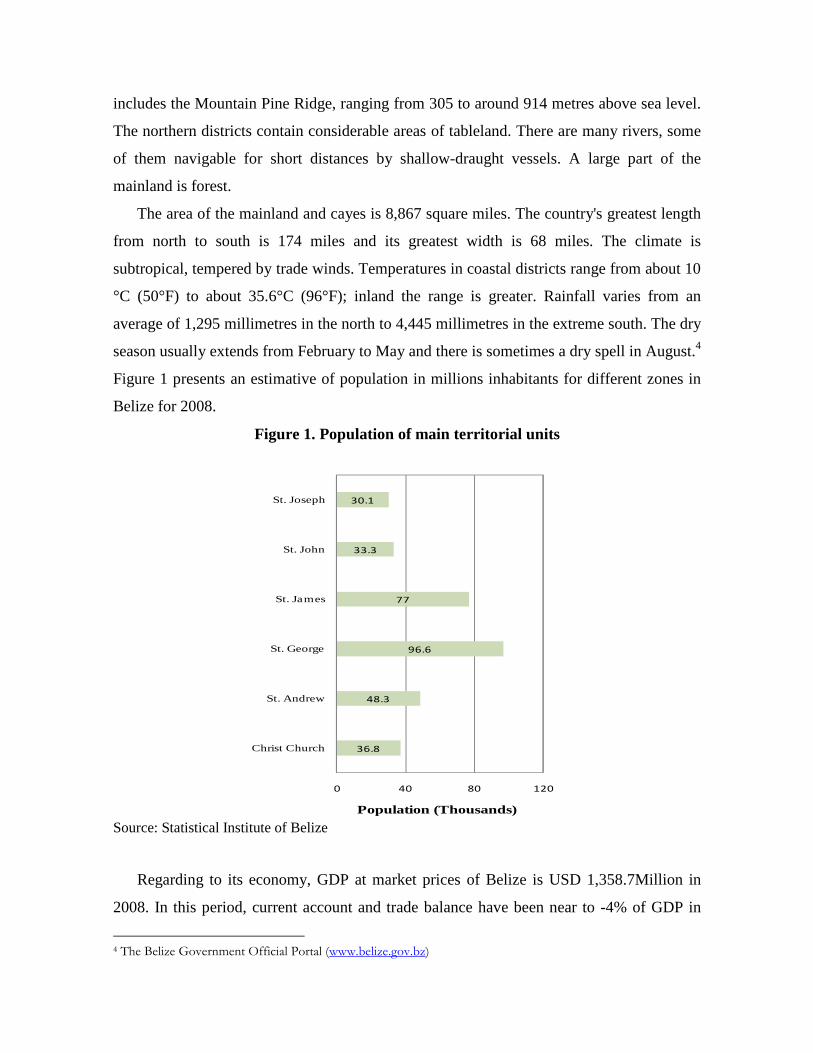
Figure 1 presents an estimative of population in millions inhabitants for different zones in
Belize for 2008.
Figure 1. Population of main territorial units
36.8
48.3
96.6
77
33.3
30.1
0 40 80 120
Christ Church
St. Andrew
St. George
St. James
St. John
St. Joseph
Population (Thousands) Source: Statistical Institute of Belize
Regarding to its economy, GDP at market prices of Belize is USD 1,358.7Million in
2008. In this period, current account and trade balance have been near to -4% of GDP in
4 The Belize Government Official Portal (www.belize.gov.bz)
2007. The rate of inflation slowed considerably from positive 6.4% in 2008 to a negative
1.1% in 2009. The unemployment rate is estimated of the order of 8.2% for 2008 according
to the Statistical Institute of Belize. The exchange rate in 2010 fluctuates around
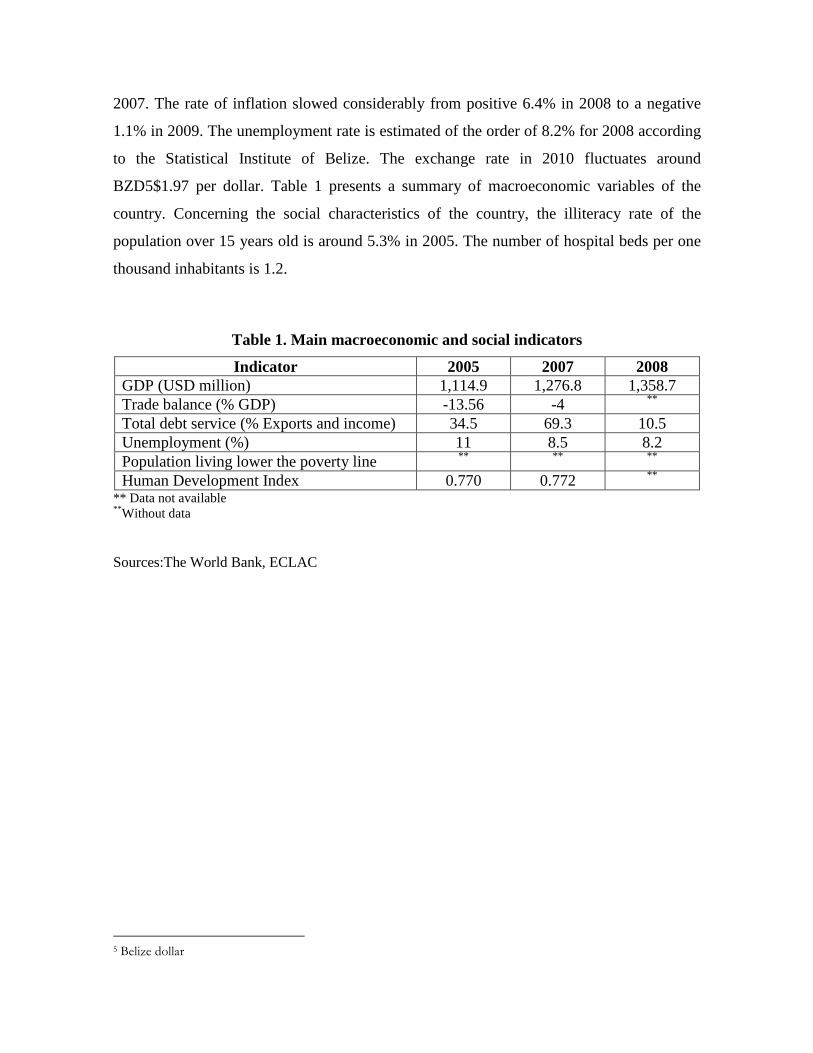
BZD5$1.97 per dollar. Table 1 presents a summary of macroeconomic variables of the
country. Concerning the social characteristics of the country, the illiteracy rate of the
population over 15 years old is around 5.3% in 2005. The number of hospital beds per one
thousand inhabitants is 1.2.
Table 1. Main macroeconomic and social indicators
Indicator 2005 2007 2008 GDP (USD million) 1,114.9 1,276.8 1,358.7 Trade balance (% GDP) -13.56 -4 **
Total debt service (% Exports and income) 34.5 69.3 10.5
Unemployment (%) 11 8.5 8.2 Population living lower the poverty line ** ** **
Human Development Index 0.770 0.772 **
** Data not available ** Without data
Sources:The World Bank, ECLAC
5 Belize dollar

3 NATURAL HAZARDS
Figure 2 are presented the percentages of the influence area and the severity level of the
different hazards in the country. Likewise, Figure 3 presents the classification by mortality
risk established by the International Strategy for Disaster Reduction, ISDR. These figures
illustrate the events that can be considered as triggers for the estimation of the Disaster
Deficit Index, IDD. Other frequent and punctual phenomena as landslides and floods, less
visible at national level are the causes of recurrent effects at local level and may have an
important accumulative impact. For this reason they are considered in the estimation of the
Local Disaster Index. Appendix I presents a general description of the country’s hazards.
Figure 2. Percentage of the influence area by hazard
0% 20% 40% 60% 80% 100%
Earthquake
Volcanic eruption
Tsunami
Tropical Storm
Extratropical Storm
Storm Surge
Tornado
Hail Storm
Lightning
Flood
Drought
Affected area of the countryNone Slight Moderate Notable High Very high
Source: Munich Re6
The most important natural hazards to the country are the earthquakes, tropical storms
and hail storms. These are the extreme events that would cause the major losses in the
future in Belize. There are other natural phenomena that have lower probability of affecting
country such as lightning, floods, tropical storms, drought, and hail storms however they
6 http://mrnathan.munichre.com/
are able to cause significant local damages. This information is especially important for the
estimation of the Disaster Deficit Index, DDI. On the other hand, most recurrent and
isolated phenomena, such as landslides and floods, cause frequent effects at the local level,
without be noticed. These events have also great impacts over population, and, if they are
accumulative, can be important too. Information about these events is especially important
for the estimation of the Local Disaster Index, LDI.
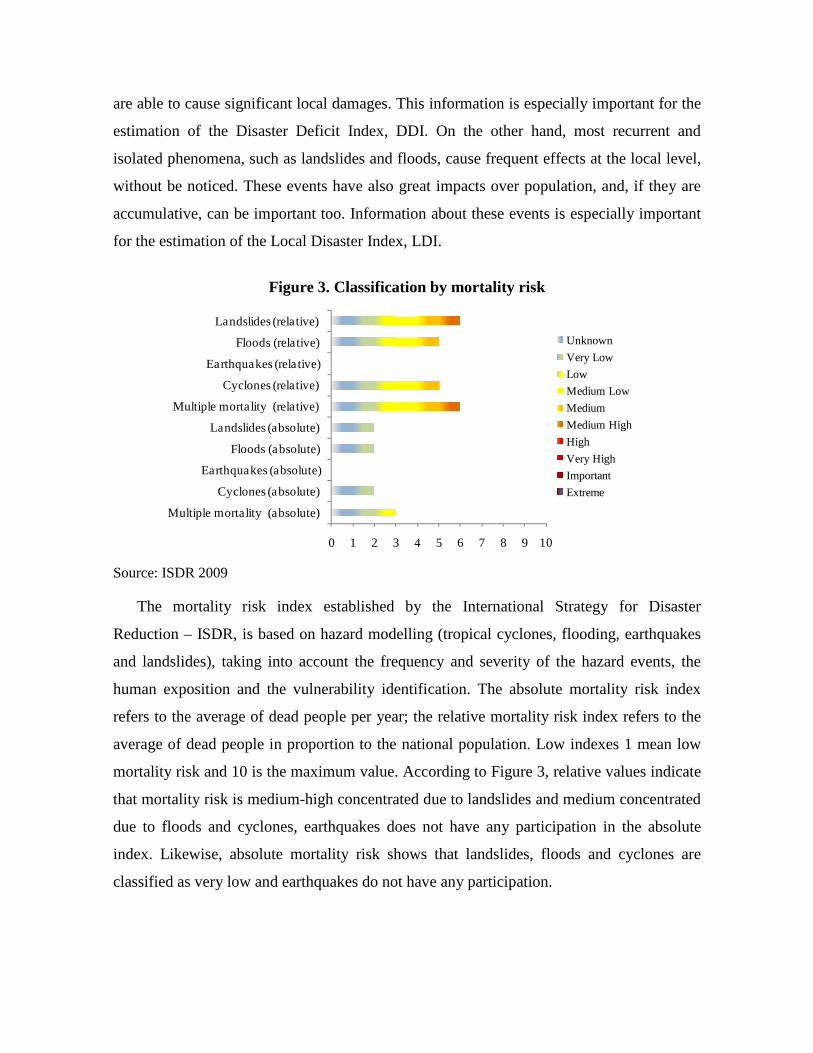
Figure 3. Classification by mortality risk
0 1 2 3 4 5 6 7 8 9 10
Multiple mortality (absolute)
Cyclones (absolute)
Earthquakes (absolute)
Floods (absolute)
Landslides (absolute)
Multiple mortality (relative)
Cyclones (relative)
Earthquakes (relative)
Floods (relative)
Landslides (relative)
Unknown
Very Low
Low
Medium Low
Medium
Medium High
High
Very High
Important
Extreme
Source: ISDR 2009
The mortality risk index established by the International Strategy for Disaster
Reduction – ISDR, is based on hazard modelling (tropical cyclones, flooding, earthquakes
and landslides), taking into account the frequency and severity of the hazard events, the
human exposition and the vulnerability identification. The absolute mortality risk index
refers to the average of dead people per year; the relative mortality risk index refers to the
average of dead people in proportion to the national population. Low indexes 1 mean low
mortality risk and 10 is the maximum value. According to Figure 3, relative values indicate
that mortality risk is medium-high concentrated due to landslides and medium concentrated
due to floods and cyclones, earthquakes does not have any participation in the absolute
index. Likewise, absolute mortality risk shows that landslides, floods and cyclones are
classified as very low and earthquakes do not have any participation.
4 INDICATORS OF DISASTER RISK AND RISK MANAGEMENT
A summary of the results obtained from the System of Indicators application for Belize
for the period 2001-2005 and later to 2005, as far as information allows, is presented in this
section. These results are useful in order to analyze risk and risk management performance
in the country, based on information supplied by different national institutions.
4.1 DISASTER DEFICIT INDEX (DDI)
The DDI measures the economic loss that a particular country could suffer when a
catastrophic event takes place, and the implications in terms of resources needed to address
the situation. This index captures the relationship between the demand for contingent
resources to cover the losses that public sector must assume as result of its fiscal
responsibility caused by the Maximum Considered Event (MCE) and the public sector’s
economic resilience (ER).
Losses caused by the MCE are calculated with a model that takes into account, on the
one hand, different natural hazards, -calculated in probabilistic terms according to historical
registers of intensities of the phenomena- and, on the other hand, the current physical
vulnerability that present the exposed elements to those phenomena. The ER is obtained
from the estimation of the possible internal or external funds that government, as
responsible of the recovering or as owner of the affected goods, may access or has available
in the moment of the evaluation. For this update, both MCE and ER were evaluated again
for all periods because some changes were detected in the previous values of the databases
from they were taken; therefore, both, the proxy of exposition as the available resources
suffered some modifications.
A DDI greater than 1.0 reflects the country’s inability to cope with extreme disasters
even by going into as much debt as possible. The greater the DDI, the greater the gap. Now
then, an estimation of a complementary indicator, DDI’CE has been made, to illustrate the
portion of a country’s annual Capital Expenditure that corresponds to the expected annual
loss or the pure risk premium. That is, what percentage of the annual investment budget
would be needed to pay for future disasters (IDEA 2005; Cardona 2005). The DDI’IS is
also estimated with respect to the amount of sustainable resources due to inter-temporal
surplus; i.e. the saving which the government can employ, calculated over a ten year period,
in order to best attend the impacts of disasters. The DDI’IS is the percentage of a country’s
potential savings at present values that corresponds to the pure risk premium.
4.1.1 Reference parameters for the model
Even though there is not detailed data useful for modelling public and private inventories, it
is possible to use general information about built areas and/or on the population to make
estimations of these inventories of exposed elements. This technique or proxy method
allows a coarse grain assessment of the volume and cost of the exposed elements required
for the analysis. The parameters for shaping a homogeneous and consistent information
structure for the project specific objectives are detailed below. They are the cost of square
meter of some construction classes, built area –in each city related to the number of
inhabitants– and distribution of built areas in basic groups for analysis –as the public and
private components–, which would be in charge or would be fiscal liabilities of the
government in case of disaster. In addition, the rest of private goods, that constitute capital
stocks, are considered as well to provide a general view of the potential impact in the
country.
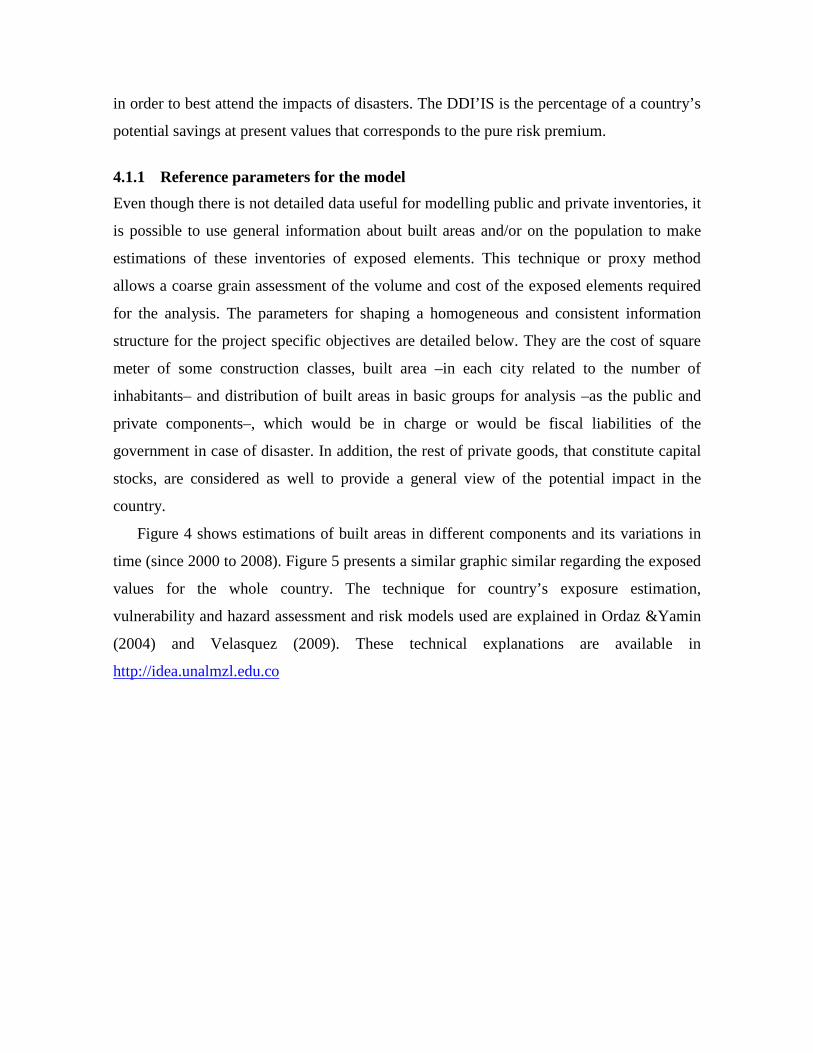
Figure 4 shows estimations of built areas in different components and its variations in
time (since 2000 to 2008). Figure 5 presents a similar graphic similar regarding the exposed
values for the whole country. The technique for country’s exposure estimation,
vulnerability and hazard assessment and risk models used are explained in Ordaz &Yamin
(2004) and Velasquez (2009). These technical explanations are available in
http://idea.unalmzl.edu.co
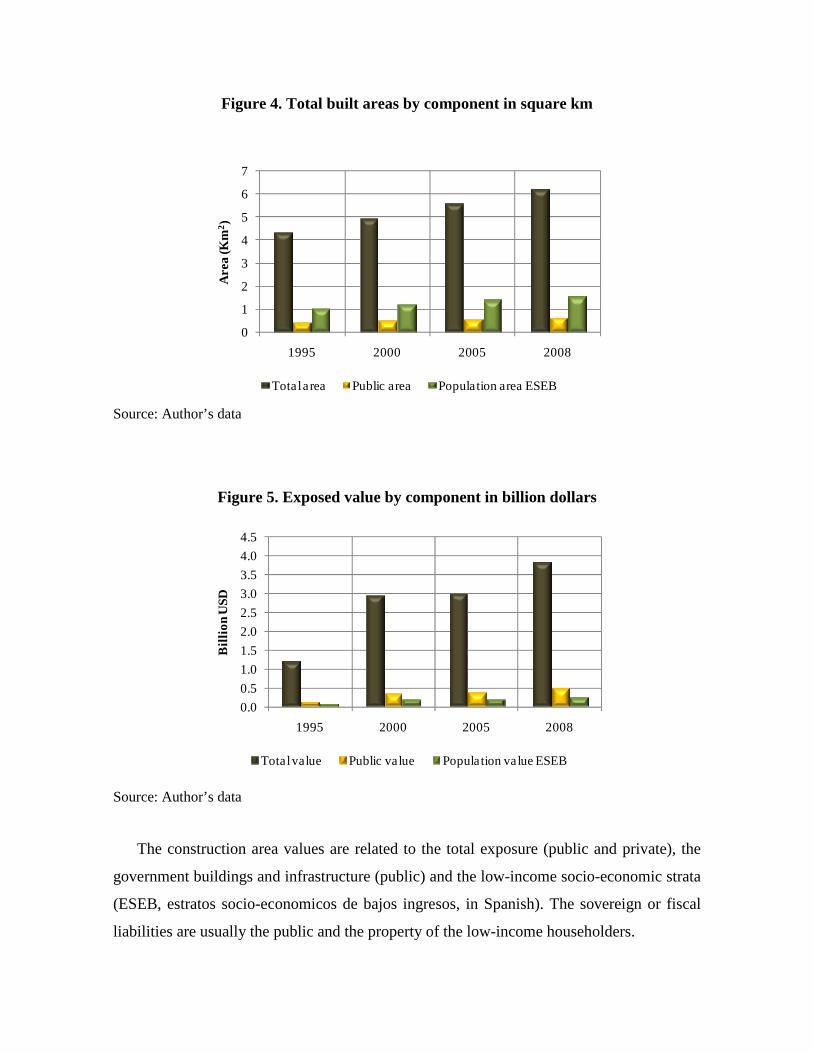
Figure 4. Total built areas by component in square km
0
1
2
3
4
5
6
7
1995 2000 2005 2008
Are
a (K
m2 )
Total area Public area Population area ESEB
Source: Author’s data
Figure 5. Exposed value by component in billion dollars
0.0
0.5
1.0
1.5
2.0
2.5
3.0
3.5
4.0
4.5
1995 2000 2005 2008
Bill
ion
US
D
Total value Public value Population value ESEB
Source: Author’s data
The construction area values are related to the total exposure (public and private), the
government buildings and infrastructure (public) and the low-income socio-economic strata
(ESEB, estratos socio-economicos de bajos ingresos, in Spanish). The sovereign or fiscal
liabilities are usually the public and the property of the low-income householders.
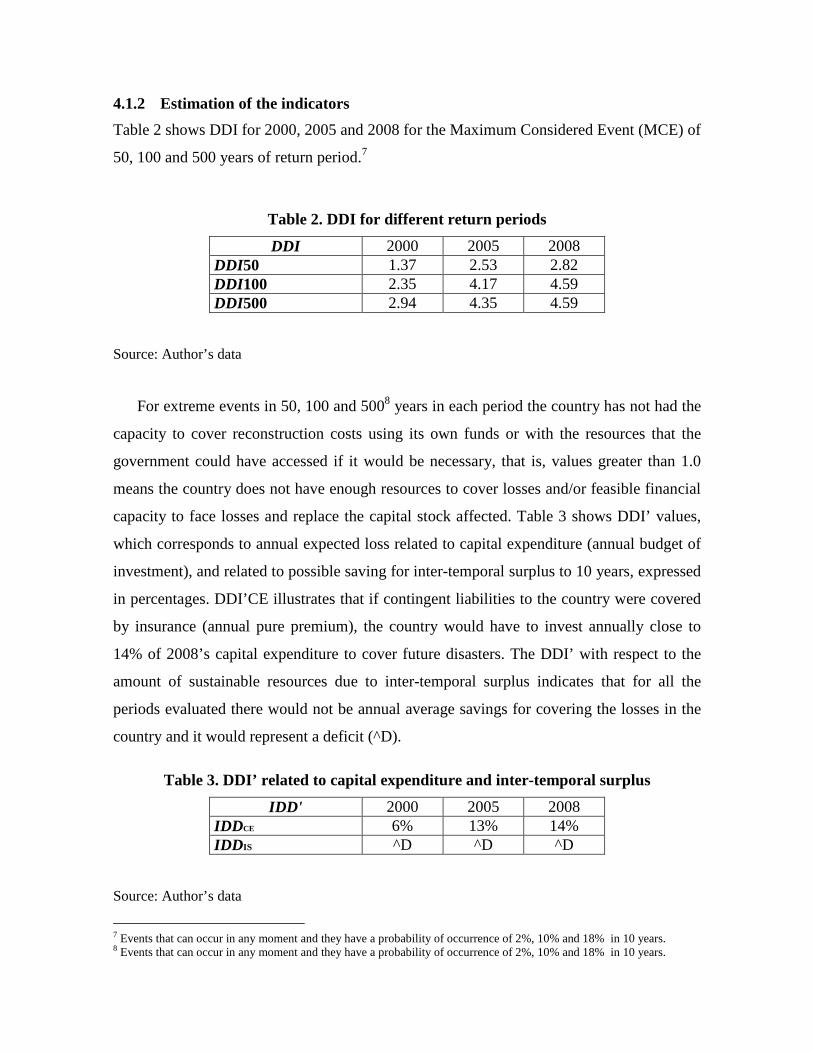
4.1.2 Estimation of the indicators
Table 2 shows DDI for 2000, 2005 and 2008 for the Maximum Considered Event (MCE) of
50, 100 and 500 years of return period.7
Table 2. DDI for different return periods
DDI 2000 2005 2008 DDI50 1.37 2.53 2.82 DDI100 2.35 4.17 4.59 DDI500 2.94 4.35 4.59
Source: Author’s data
For extreme events in 50, 100 and 5008 years in each period the country has not had the
capacity to cover reconstruction costs using its own funds or with the resources that the
government could have accessed if it would be necessary, that is, values greater than 1.0
means the country does not have enough resources to cover losses and/or feasible financial
capacity to face losses and replace the capital stock affected. Table 3 shows DDI’ values,
which corresponds to annual expected loss related to capital expenditure (annual budget of
investment), and related to possible saving for inter-temporal surplus to 10 years, expressed
in percentages. DDI’CE illustrates that if contingent liabilities to the country were covered
by insurance (annual pure premium), the country would have to invest annually close to
14% of 2008’s capital expenditure to cover future disasters. The DDI’ with respect to the
amount of sustainable resources due to inter-temporal surplus indicates that for all the
periods evaluated there would not be annual average savings for covering the losses in the
country and it would represent a deficit (^D).
Table 3. DDI’ related to capital expenditure and inter-temporal surplus
IDD' 2000 2005 2008 IDD CE 6% 13% 14% IDD IS ^D ^D ^D
Source: Author’s data
7 Events that can occur in any moment and they have a probability of occurrence of 2%, 10% and 18% in 10 years. 8 Events that can occur in any moment and they have a probability of occurrence of 2%, 10% and 18% in 10 years.
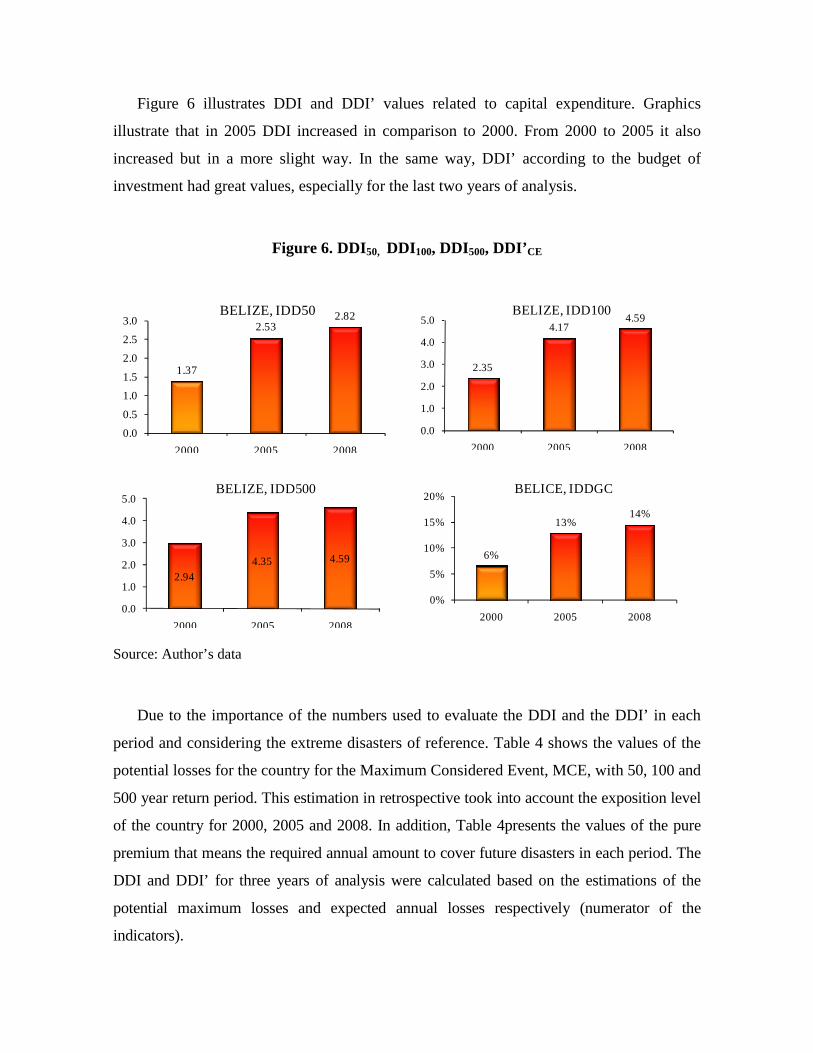
Figure 6 illustrates DDI and DDI’ values related to capital expenditure. Graphics
illustrate that in 2005 DDI increased in comparison to 2000. From 2000 to 2005 it also
increased but in a more slight way. In the same way, DDI’ according to the budget of
investment had great values, especially for the last two years of analysis.
Figure 6. DDI50, DDI100, DDI500, DDI’ CE
1.37
2.532.82
0.0
0.5
1.0
1.5
2.0
2.5
3.0
2000 2005 2008
BELIZE, IDD50
2.35
4.174.59
0.0
1.0
2.0
3.0
4.0
5.0
2000 2005 2008
BELIZE, IDD100
2.94
4.35 4.59
0.0
1.0
2.0
3.0
4.0
5.0
2000 2005 2008
BELIZE, IDD500
6%
13%14%
0%
5%
10%
15%
20%
2000 2005 2008
BELICE, IDDGC
Source: Author’s data
Due to the importance of the numbers used to evaluate the DDI and the DDI’ in each
period and considering the extreme disasters of reference. Table 4 shows the values of the
potential losses for the country for the Maximum Considered Event, MCE, with 50, 100 and
500 year return period. This estimation in retrospective took into account the exposition level
of the country for 2000, 2005 and 2008. In addition, Table 4presents the values of the pure
premium that means the required annual amount to cover future disasters in each period. The
DDI and DDI’ for three years of analysis were calculated based on the estimations of the
potential maximum losses and expected annual losses respectively (numerator of the
indicators).
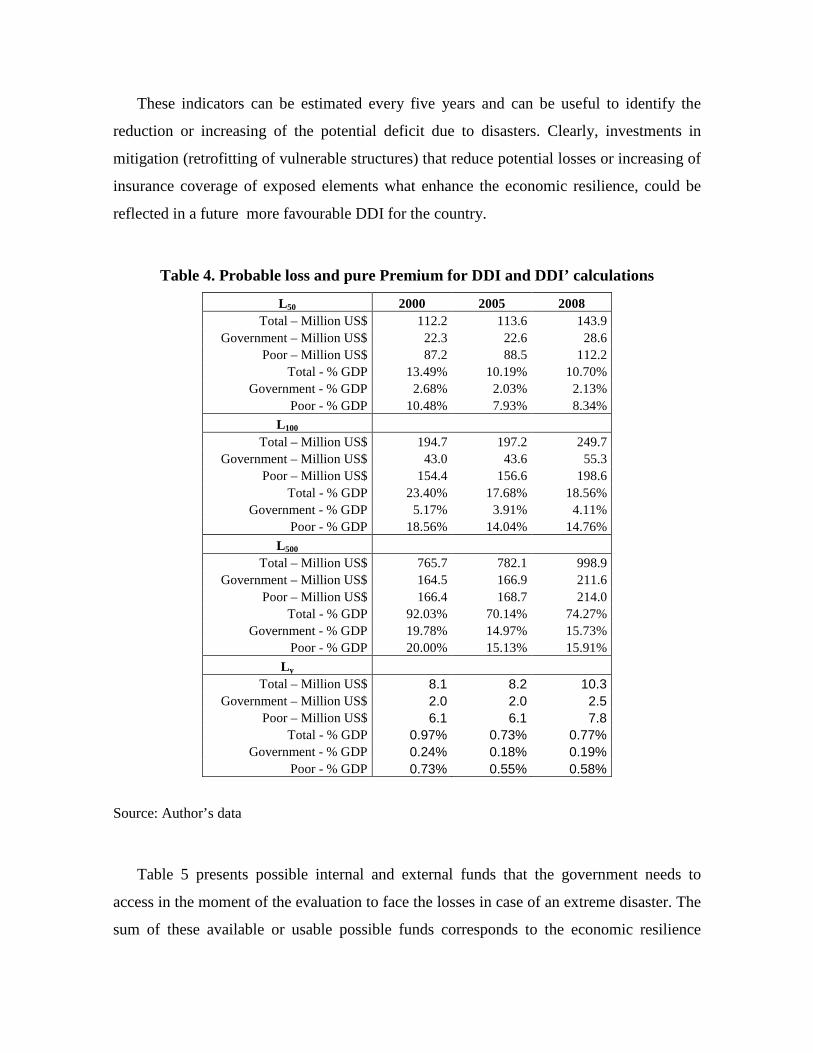
These indicators can be estimated every five years and can be useful to identify the
reduction or increasing of the potential deficit due to disasters. Clearly, investments in
mitigation (retrofitting of vulnerable structures) that reduce potential losses or increasing of
insurance coverage of exposed elements what enhance the economic resilience, could be
reflected in a future more favourable DDI for the country.
Table 4. Probable loss and pure Premium for DDI and DDI’ calculations
L50 2000 2005 2008 Total – Million US$ 112.2 113.6 143.9
Government – Million US$ 22.3 22.6 28.6 Poor – Million US$ 87.2 88.5 112.2
Total - % GDP 13.49% 10.19% 10.70% Government - % GDP 2.68% 2.03% 2.13%
Poor - % GDP 10.48% 7.93% 8.34%
L100 Total – Million US$ 194.7 197.2 249.7
Government – Million US$ 43.0 43.6 55.3 Poor – Million US$ 154.4 156.6 198.6
Total - % GDP 23.40% 17.68% 18.56% Government - % GDP 5.17% 3.91% 4.11%
Poor - % GDP 18.56% 14.04% 14.76%
L500 Total – Million US$ 765.7 782.1 998.9
Government – Million US$ 164.5 166.9 211.6 Poor – Million US$ 166.4 168.7 214.0
Total - % GDP 92.03% 70.14% 74.27% Government - % GDP 19.78% 14.97% 15.73%
Poor - % GDP 20.00% 15.13% 15.91%
L y Total – Million US$ 8.1 8.2 10.3
Government – Million US$ 2.0 2.0 2.5 Poor – Million US$ 6.1 6.1 7.8
Total - % GDP 0.97% 0.73% 0.77% Government - % GDP 0.24% 0.18% 0.19%
Poor - % GDP 0.73% 0.55% 0.58%
Source: Author’s data
Table 5 presents possible internal and external funds that the government needs to
access in the moment of the evaluation to face the losses in case of an extreme disaster. The
sum of these available or usable possible funds corresponds to the economic resilience
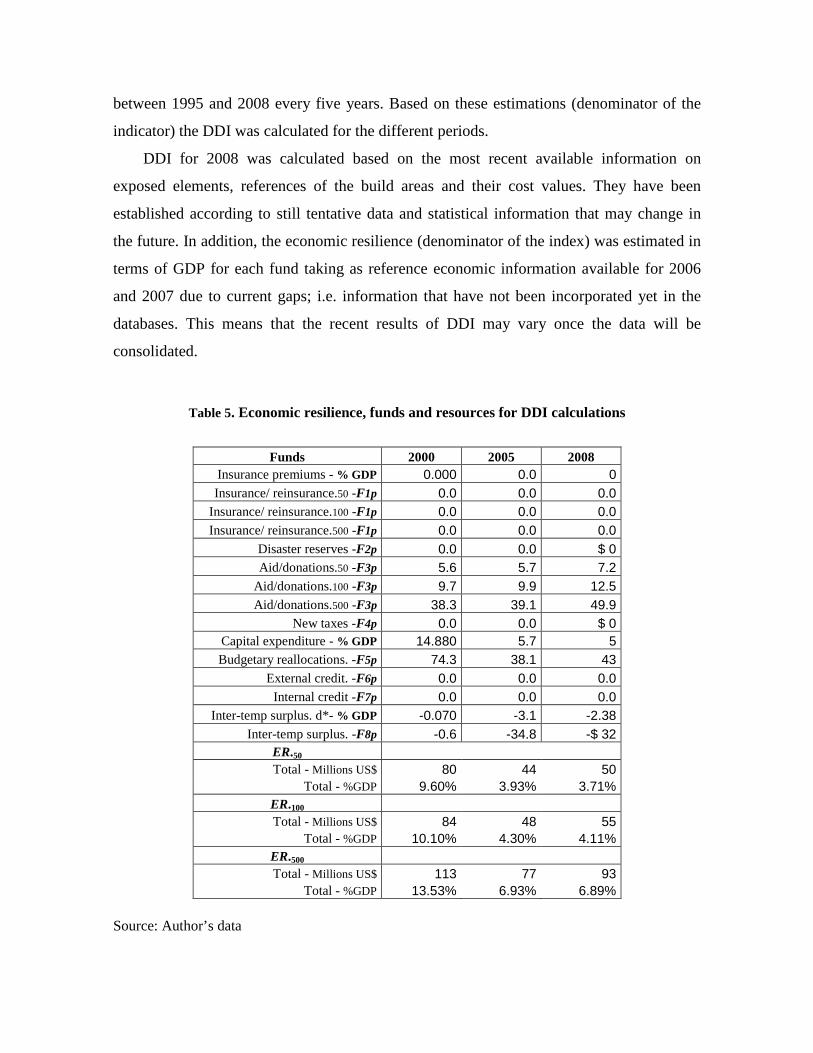
between 1995 and 2008 every five years. Based on these estimations (denominator of the
indicator) the DDI was calculated for the different periods.
DDI for 2008 was calculated based on the most recent available information on
exposed elements, references of the build areas and their cost values. They have been
established according to still tentative data and statistical information that may change in
the future. In addition, the economic resilience (denominator of the index) was estimated in
terms of GDP for each fund taking as reference economic information available for 2006
and 2007 due to current gaps; i.e. information that have not been incorporated yet in the
databases. This means that the recent results of DDI may vary once the data will be
consolidated.
Table 5. Economic resilience, funds and resources for DDI calculations
Funds 2000 2005 2008
Insurance premiums - % GDP 0.000 0.0 0 Insurance/ reinsurance.50 -F1p 0.0 0.0 0.0
Insurance/ reinsurance.100 -F1p 0.0 0.0 0.0 Insurance/ reinsurance.500 -F1p 0.0 0.0 0.0
Disaster reserves -F2p 0.0 0.0 $ 0 Aid/donations.50 -F3p 5.6 5.7 7.2
Aid/donations.100 -F3p 9.7 9.9 12.5 Aid/donations.500 -F3p 38.3 39.1 49.9
New taxes -F4p 0.0 0.0 $ 0 Capital expenditure - % GDP 14.880 5.7 5 Budgetary reallocations. -F5p 74.3 38.1 43
External credit. -F6p 0.0 0.0 0.0 Internal credit -F7p 0.0 0.0 0.0
Inter-temp surplus. d*- % GDP -0.070 -3.1 -2.38 Inter-temp surplus. -F8p -0.6 -34.8 -$ 32
ER.50 Total - Millions US$ 80 44 50
Total - %GDP 9.60% 3.93% 3.71% ER.100 Total - Millions US$ 84 48 55
Total - %GDP 10.10% 4.30% 4.11% ER.500 Total - Millions US$ 113 77 93
Total - %GDP 13.53% 6.93% 6.89% Source: Author’s data
As conclusion of the obtained results, nonetheless the country has improved its
economic resilience, as it can be seen in the reduction of DDI values in the last years,
disasters in general, imply an obligation or non explicit contingent liability that can mean
an impact to fiscal sustainability, given that the most of the resources that government
could access represent own funds and new possible debts. In other words, government
retains significant losses and its financing represent a high opportunity-cost given other
needs of investment and the existent country’s budget restrictions.
4.2 PREVALENT VULNERABILITY INDEX (PVI) PVI characterizes predominating vulnerability conditions reflected in exposure in prone
areas, socioeconomic fragility and lack of social resilience; aspects that favour the direct
impact and the indirect and intangible impact in case of the occurrence of a hazard event.
This index is a composite indicator that depicts comparatively a situation or pattern in a
country and its causes or factors. This is so to the extent that the vulnerability conditions
that underlie the notion of risk are, on the one hand, problems caused by inadequate
economic growth and, on the other hand, deficiencies that may be intervened via adequate
development processes. PVI reflects susceptibility due to the level of physical exposition of
goods and people, PVIES that favours direct impact in case of hazard events. It also reflects
social and economic conditions that favour indirect and intangible impact, PVISF. And it
reflects lack of capacity to anticipate, to absorb consequences, to efficiently respond and to
recover, PVILR (IDEA 2005; Cardona 2005).
PVI varies between 0 and 100, a value of 80 means very high vulnerability, from 40 to
80 means high, from 20 to 40 is a medium value and less than 20 means low. In the new
phase of the Program of Indicators, for the countries already evaluated, the PVI was
calculated again for all the periods due to various values of the databases that were not
known, currently are available or have been modified as result of revisions that were made
after the previous evaluation of the index. Modifications in maximum and minimum
reference values were also made for this new evaluation to standardize the values of the
subindicators in a uniform form for old and new evaluated countries.
4.2.1 Indicators of exposure and susceptibility
In the case of exposure and/or physical susceptibility, PVIES, the indicators that best
represent this function are those that represent susceptible population, assets, investment,
production, livelihoods, essential patrimony, and human activities. Other indicators of this
type may be found with population, agricultural and urban growth and densification rates.
These indicators are detailed below:
• ES1. Population growth, avg. annual rate, %
• ES2. Urban growth, avg. annual rate, %
• ES3. Population density, people (5 km2)
• ES4. Poverty-population below US$ 1 per day PPP
• ES5. Capital stock, million US$ dollar/1000 km2
• ES6. Imports and exports of goods and services, % GDP
• ES7. Gross domestic fixed investment, % of GDP
• ES8. Arable land and permanent crops, % land area.
These indicators are variables that reflect a notion of susceptibility when faced with
dangerous events, whatever the nature or severity of these. “To be exposed and susceptible
is a necessary condition for the existence of risk”. Despite the fact that in any strict sense it
would be necessary to establish if the exposure is relevant when faced with each feasible
type of event, it is possible to assert that certain variables comprise a comparatively adverse
situation where we suppose that natural hazards exist as a permanent external factor, even
without establishing precisely their characteristics.
4.2.2 Indicators of socio-economic fragility
Socio-economic fragility, PVISF, may be represented by indicators such as poverty, human
insecurity, dependency, illiteracy, social disparities, unemployment, inflation, debt and
environmental deterioration. These are indicators that reflect relative weaknesses and
conditions of deterioration that would increase the direct effects associated with dangerous
phenomenon. Even though such effects are not necessarily accumulative and in some cases
may be redundant or correlated, their influence is especially important at the social and
economic levels. Those indicators are the following:
• SF1. Human Poverty Index, HPI-1.
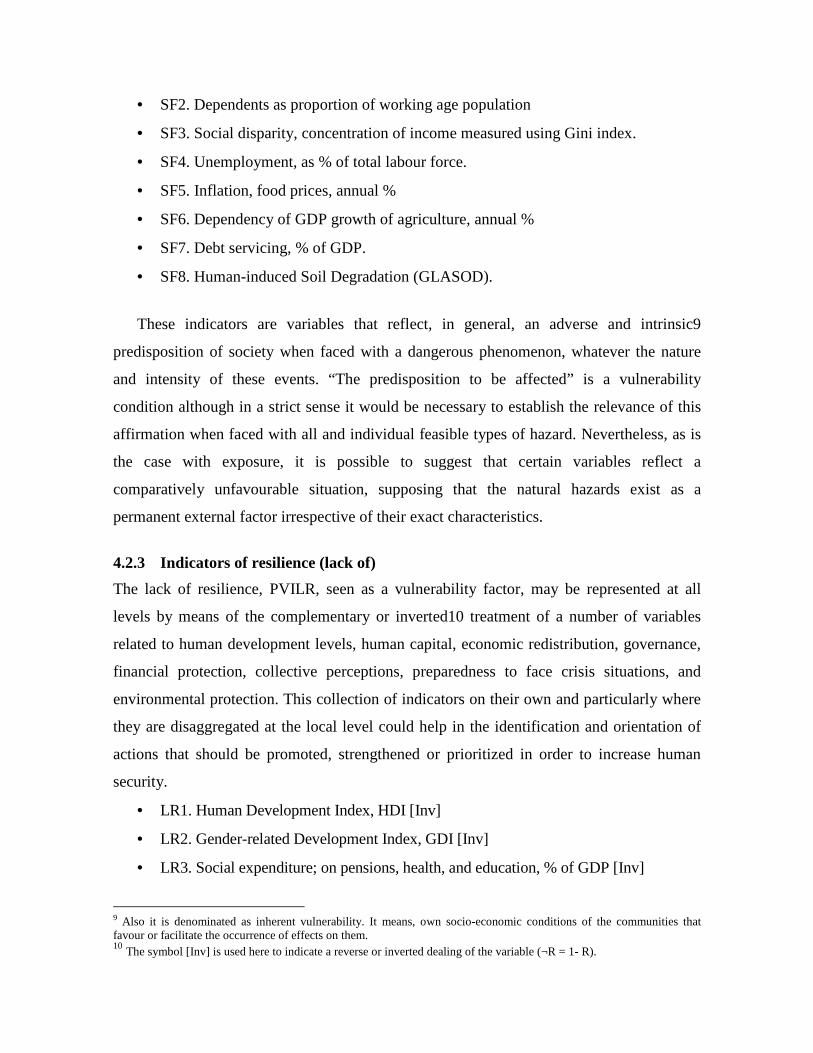
• SF2. Dependents as proportion of working age population
• SF3. Social disparity, concentration of income measured using Gini index.
• SF4. Unemployment, as % of total labour force.
• SF5. Inflation, food prices, annual %
• SF6. Dependency of GDP growth of agriculture, annual %
• SF7. Debt servicing, % of GDP.
• SF8. Human-induced Soil Degradation (GLASOD).
These indicators are variables that reflect, in general, an adverse and intrinsic9
predisposition of society when faced with a dangerous phenomenon, whatever the nature
and intensity of these events. “The predisposition to be affected” is a vulnerability
condition although in a strict sense it would be necessary to establish the relevance of this
affirmation when faced with all and individual feasible types of hazard. Nevertheless, as is
the case with exposure, it is possible to suggest that certain variables reflect a
comparatively unfavourable situation, supposing that the natural hazards exist as a
permanent external factor irrespective of their exact characteristics.
4.2.3 Indicators of resilience (lack of)
The lack of resilience, PVILR, seen as a vulnerability factor, may be represented at all
levels by means of the complementary or inverted10 treatment of a number of variables
related to human development levels, human capital, economic redistribution, governance,
financial protection, collective perceptions, preparedness to face crisis situations, and
environmental protection. This collection of indicators on their own and particularly where
they are disaggregated at the local level could help in the identification and orientation of
actions that should be promoted, strengthened or prioritized in order to increase human
security.
• LR1. Human Development Index, HDI [Inv]
• LR2. Gender-related Development Index, GDI [Inv]
• LR3. Social expenditure; on pensions, health, and education, % of GDP [Inv]
9 Also it is denominated as inherent vulnerability. It means, own socio-economic conditions of the communities that favour or facilitate the occurrence of effects on them. 10 The symbol [Inv] is used here to indicate a reverse or inverted dealing of the variable (¬R = 1- R).
• LR4. Governance Index (Kaufmann) [Inv]
• LR5. Insurance of infrastructure and housing, % of GD [Inv]
• LR6. Television sets per 1000 people [Inv]
• LR7. Hospital beds per 1000 people [Inv]
• LR8. Environmental Sustainability Index, ESI [Inv]
These indicators are variables that capture in a macro fashion the capacity to recover
from or absorb the impact of dangerous phenomena, whatever their nature and severity.
“To not be in the capacity to” adequately face disasters is a vulnerability condition,
although in a strict sense it is necessary to establish this with reference to all feasible types
of hazard. Nevertheless, as with exposure and fragility it is possible to admit that certain
economic and social variables reflect a comparatively unfavourable situation supposing that
natural hazards exist as permanent external factors without establishing their precise
characteristics.
4.2.4 Estimation of indicators In general, PVI reflects susceptibility due to the degree of physical exposure of goods and
people, PVIES, that favour the direct impact in case of hazard events. In the same way, it
reflects conditions of socioeconomic fragility that favour the indirect and intangible impact,
PVISF. Also, it reflects lack of capacity to absorb consequences, for efficient response and
recovering, PVILR. Reduction of these kinds of factors, as the purpose of the human
sustainable development process and explicit policies for risk reduction, is one of the
aspects that should be emphasized. Table 6shows the total PVI and its components related
to exposure and susceptibility, socio-economic fragility and lack of resilience. It is
important to point out that, for participation of subindicators which do not have a recent
value, we opted using the same value in all periods, in order to avoid affecting relative
value of indices and hopping in future the value of these subindicators will be published.
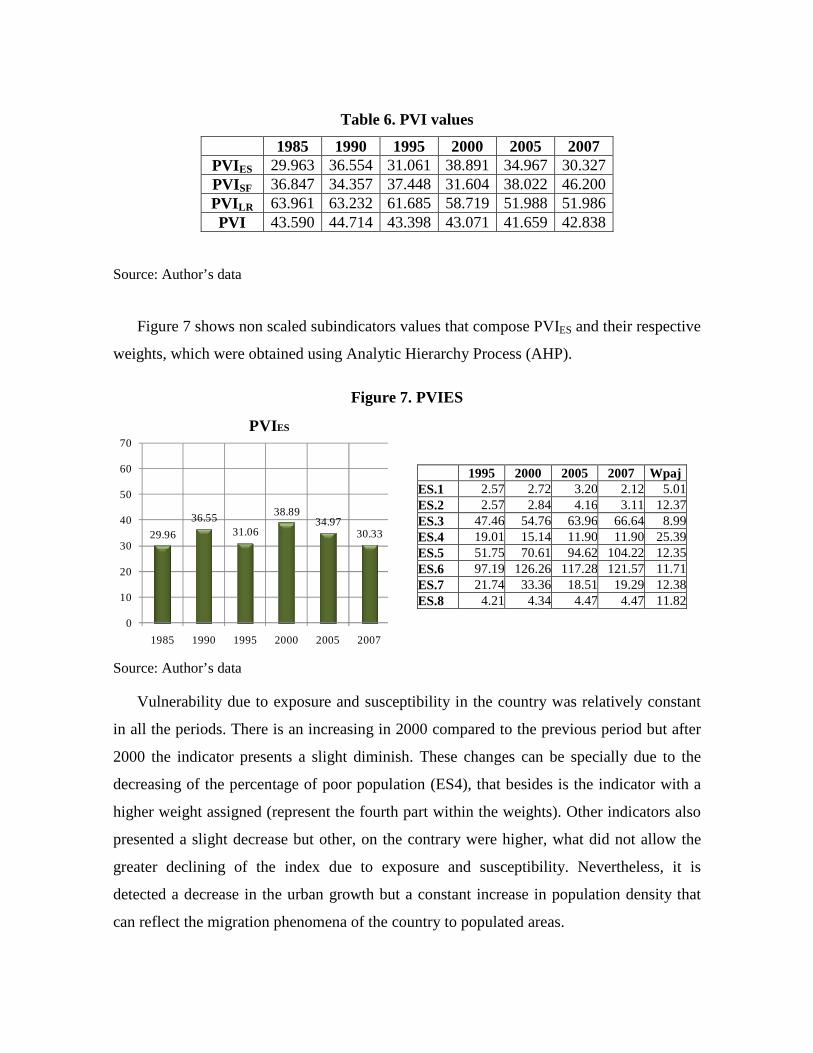
Table 6. PVI values
1985 1990 1995 2000 2005 2007 PVIES 29.963 36.554 31.061 38.891 34.967 30.327 PVISF 36.847 34.357 37.448 31.604 38.022 46.200 PVI LR 63.961 63.232 61.685 58.719 51.988 51.986 PVI 43.590 44.714 43.398 43.071 41.659 42.838
Source: Author’s data
Figure 7 shows non scaled subindicators values that compose PVIES and their respective
weights, which were obtained using Analytic Hierarchy Process (AHP).
Figure 7. PVIES
29.96
36.5531.06
38.8934.97
30.33
0
10
20
30
40
50
60
70
1985 1990 1995 2000 2005 2007
PVIES
1995 2000 2005 2007 Wpaj ES.1 2.57 2.72 3.20 2.12 5.01ES.2 2.57 2.84 4.16 3.11 12.37ES.3 47.46 54.76 63.96 66.64 8.99ES.4 19.01 15.14 11.90 11.90 25.39ES.5 51.75 70.61 94.62 104.22 12.35ES.6 97.19 126.26 117.28 121.57 11.71ES.7 21.74 33.36 18.51 19.29 12.38ES.8 4.21 4.34 4.47 4.47 11.82
Source: Author’s data
Vulnerability due to exposure and susceptibility in the country was relatively constant
in all the periods. There is an increasing in 2000 compared to the previous period but after
2000 the indicator presents a slight diminish. These changes can be specially due to the
decreasing of the percentage of poor population (ES4), that besides is the indicator with a
higher weight assigned (represent the fourth part within the weights). Other indicators also
presented a slight decrease but other, on the contrary were higher, what did not allow the
greater declining of the index due to exposure and susceptibility. Nevertheless, it is
detected a decrease in the urban growth but a constant increase in population density that
can reflect the migration phenomena of the country to populated areas.
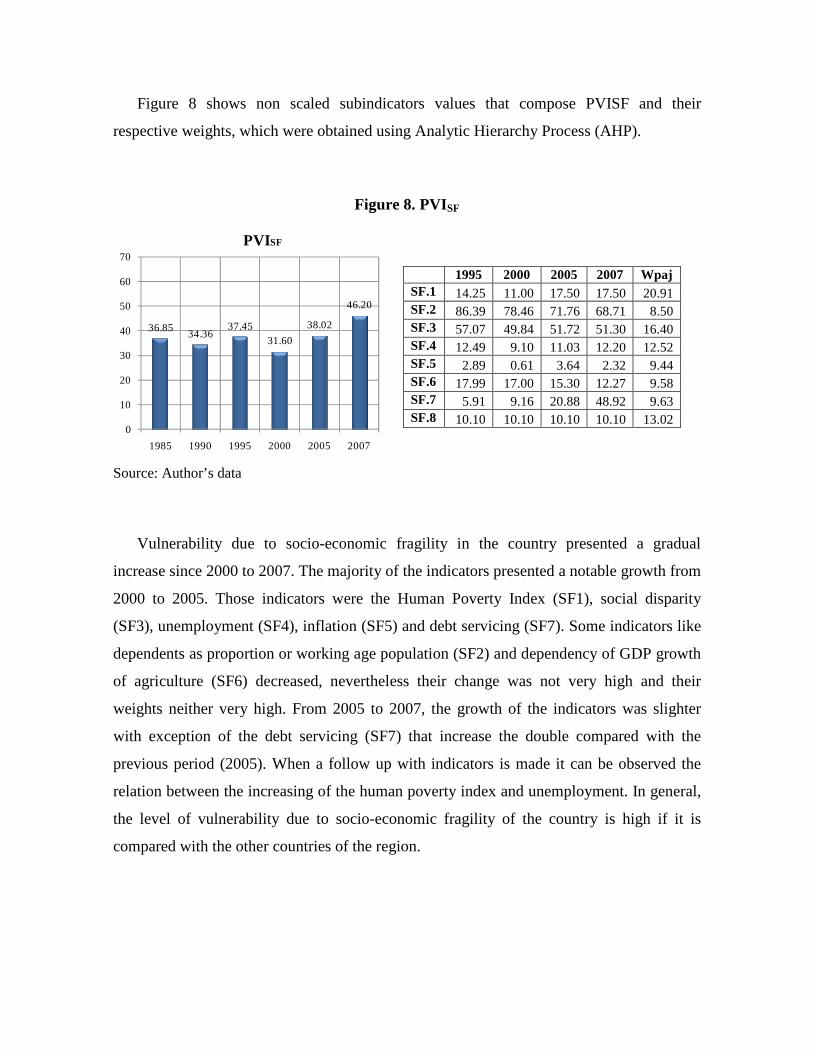
Figure 8 shows non scaled subindicators values that compose PVISF and their
respective weights, which were obtained using Analytic Hierarchy Process (AHP).
Figure 8. PVISF
36.8534.36
37.4531.60
38.02
46.20
0
10
20
30
40
50
60
70
1985 1990 1995 2000 2005 2007
PVISF
1995 2000 2005 2007 Wpaj SF.1 14.25 11.00 17.50 17.50 20.91 SF.2 86.39 78.46 71.76 68.71 8.50 SF.3 57.07 49.84 51.72 51.30 16.40 SF.4 12.49 9.10 11.03 12.20 12.52 SF.5 2.89 0.61 3.64 2.32 9.44 SF.6 17.99 17.00 15.30 12.27 9.58 SF.7 5.91 9.16 20.88 48.92 9.63 SF.8 10.10 10.10 10.10 10.10 13.02
Source: Author’s data
Vulnerability due to socio-economic fragility in the country presented a gradual
increase since 2000 to 2007. The majority of the indicators presented a notable growth from
2000 to 2005. Those indicators were the Human Poverty Index (SF1), social disparity
(SF3), unemployment (SF4), inflation (SF5) and debt servicing (SF7). Some indicators like
dependents as proportion or working age population (SF2) and dependency of GDP growth
of agriculture (SF6) decreased, nevertheless their change was not very high and their
weights neither very high. From 2005 to 2007, the growth of the indicators was slighter
with exception of the debt servicing (SF7) that increase the double compared with the
previous period (2005). When a follow up with indicators is made it can be observed the
relation between the increasing of the human poverty index and unemployment. In general,
the level of vulnerability due to socio-economic fragility of the country is high if it is
compared with the other countries of the region.
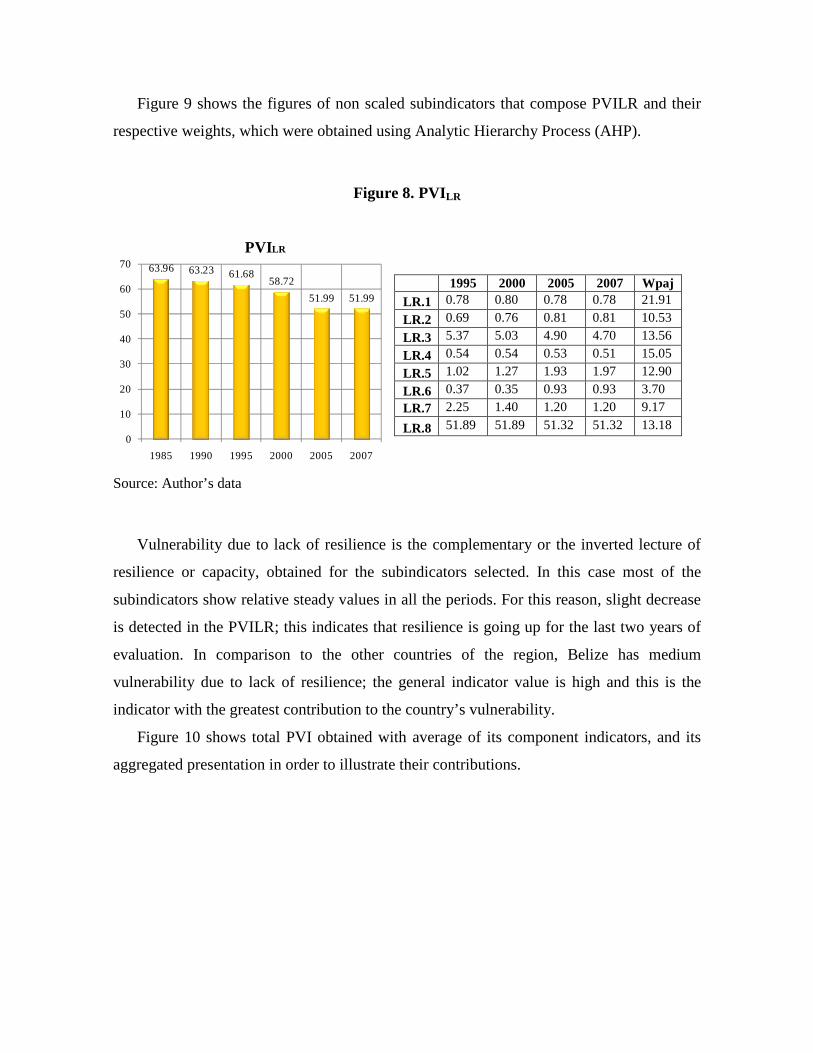
Figure 9 shows the figures of non scaled subindicators that compose PVILR and their
respective weights, which were obtained using Analytic Hierarchy Process (AHP).
Figure 8. PVILR
63.96 63.23 61.6858.72
51.99 51.99
0
10
20
30
40
50
60
70
1985 1990 1995 2000 2005 2007
PVILR
1995 2000 2005 2007 Wpaj LR.1 0.78 0.80 0.78 0.78 21.91
LR.2 0.69 0.76 0.81 0.81 10.53
LR.3 5.37 5.03 4.90 4.70 13.56
LR.4 0.54 0.54 0.53 0.51 15.05
LR.5 1.02 1.27 1.93 1.97 12.90
LR.6 0.37 0.35 0.93 0.93 3.70
LR.7 2.25 1.40 1.20 1.20 9.17
LR.8 51.89 51.89 51.32 51.32 13.18
Source: Author’s data
Vulnerability due to lack of resilience is the complementary or the inverted lecture of
resilience or capacity, obtained for the subindicators selected. In this case most of the
subindicators show relative steady values in all the periods. For this reason, slight decrease
is detected in the PVILR; this indicates that resilience is going up for the last two years of
evaluation. In comparison to the other countries of the region, Belize has medium
vulnerability due to lack of resilience; the general indicator value is high and this is the
indicator with the greatest contribution to the country’s vulnerability.
Figure 10 shows total PVI obtained with average of its component indicators, and its
aggregated presentation in order to illustrate their contributions.
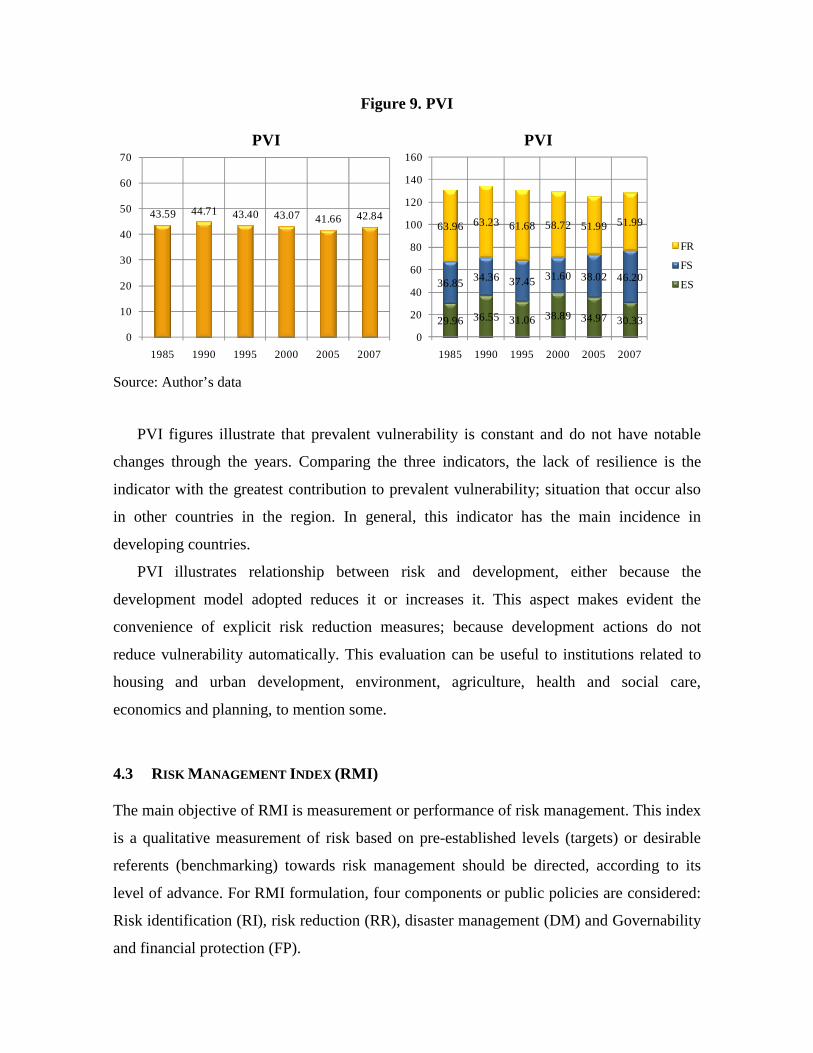
Figure 9. PVI
43.59 44.71 43.40 43.07 41.66 42.84
0
10
20
30
40
50
60
70
1985 1990 1995 2000 2005 2007
PVI
29.96 36.55 31.06 38.89 34.97 30.33
36.85 34.36 37.45 31.60 38.02 46.20
63.96 63.23 61.68 58.72 51.99 51.99
0
20
40
60
80
100
120
140
160
1985 1990 1995 2000 2005 2007
PVI
FR
FS
ES
Source: Author’s data
PVI figures illustrate that prevalent vulnerability is constant and do not have notable
changes through the years. Comparing the three indicators, the lack of resilience is the
indicator with the greatest contribution to prevalent vulnerability; situation that occur also
in other countries in the region. In general, this indicator has the main incidence in
developing countries.
PVI illustrates relationship between risk and development, either because the
development model adopted reduces it or increases it. This aspect makes evident the
convenience of explicit risk reduction measures; because development actions do not
reduce vulnerability automatically. This evaluation can be useful to institutions related to
housing and urban development, environment, agriculture, health and social care,
economics and planning, to mention some.
4.3 RISK MANAGEMENT INDEX (RMI) The main objective of RMI is measurement or performance of risk management. This index
is a qualitative measurement of risk based on pre-established levels (targets) or desirable
referents (benchmarking) towards risk management should be directed, according to its
level of advance. For RMI formulation, four components or public policies are considered:
Risk identification (RI), risk reduction (RR), disaster management (DM) and Governability
and financial protection (FP).
Estimation of each public policy takes into account 6 subindicators that characterize the
performance of management in the country. Assessment of each subindicator is made using
five performance levels: low, incipient, significant, outstanding and optimal, that
corresponds to a range from 1 to 5, where 1 is the lowest level and 5 the highest. This
methodological focus allows using each reference level simultaneously with the
“performance objective” and, thus, lets the comparison and identification of results or
achievements towards governments should direct their efforts of formulation,
implementation and evaluation of policies in each case.
Once performance levels of each subindicator have been evaluated, through a non-lineal
aggregation model, the value of each component of RMI is determined (IDEA 2005;
Cardona 2005). The value of each composed element is between 0 and 100, where 0 is the
minimum performance level and 100 is the maximum level. Total RMI is the average of the
four composed indicators that admit each public policy. When value of RMI is high,
performance of risk management in the country is better.
4.3.1 Institutional framework 11
Belize is involved in several regional disaster mitigation initiatives. The country makes part
of the Caribbean Disaster Emergency Response Agency (CDERA) that was established in
1991. Besides, the country has been financed since 1994 by the European Community
Humanitarian Office (ECHO) to invest in prevention, mitigation and preparedness
operations. In 2002, the Caribbean Community Climate Change Centre (CCCCC) was
established and its goal is to coordinate regional responses to manage climate change.
On the other hand, additional to the regional programmes and approaches, the
Government of Belize has established organizations and initiatives. In 1999 the National
Emergency Management Organization (NEMO) was established in response to the
devastation left by Hurricane Mitch in 1998. Its charge is to preserve life and property and
to mitigate the negative impacts of an event. The Belize Red Cross Society that focuses in
promoting humanitarian values, disaster response, disaster preparedness and health and
community care.
11 www.etudescaribeennes.revues.org
Likewise, the country passed the Disaster Preparedness and Response Act of 2000, the
drafting of the National Hazard Mitigation Policy in 2003, the establishment of National
Building Standards, the Hurricane Rehabilitation and Disaster Preparedness Project, and the
Hurricane Preparedness Project by the Belize City Drainage Works.
4.3.2 Indicators of risk identification
The identification of risk generally includes the need to understand individual perceptions
and social representations and provide objective estimates. In order to intervene in risk it is
necessary to recognize its existence12, dimension it (measurement) and represent it by means
of models, maps, indexes etc. that are significant for society and decision makers.
Methodologically, it includes the evaluation of hazards, the different aspects of
vulnerability when faced with these hazards and estimations as regards the occurrence of
possible consequences during a particular exposure time. The measurement of risk seen as a
basis for intervention is relevant when the population recognizes and understands that risk.
The indicators that represent risk identification, RI, are the following:
• RI1. Systematic disaster and loss inventory
• RI2. Hazard monitoring and forecasting
• RI3. Hazard evaluation and mapping
• RI4. Vulnerability and risk assessment
• RI5. Public information and community participation
• RI6. Training and education on risk management
4.3.3 Indicators of risk reduction
Risk management aims particularly to reduce risk. In general, this requires the execution of
structural and non structural prevention-mitigation measures. It is the act of anticipating
with the aim of avoiding or diminishing the economic, social and environmental impact of
potentially dangerous physical phenomena. It implies planning processes but,
fundamentally, the execution of measures that modify existing risk conditions through
12 That is to say, it has to be a problem for someone. Risk may exist but not perceived in its real dimensions by individuals, decision makers and society in general. To measure or dimension risk in an appropriate manner is to make it apparent and recognized, which in itself means that something has to be done about it. Without adequate identification of risk it is impossible to carry out anticipatory preventive actions.
corrective and prospective interventions of existing and potential future vulnerability, and
hazard control when feasible. The indicators that represent risk reduction, RR, are the
following:
• RR1. Risk consideration in land use and urban planning
• RR2. Hydrological basin intervention and environmental protection
• RR3. Implementation of hazard-event control and protection techniques
• RR4. Housing improvement and human settlement relocation from prone-areas
• RR5. Updating and enforcement of safety standards and construction codes
• RR6. Reinforcement and retrofitting of public and private assets
4.3.4 Indicators of disaster management
Disaster management should provide appropriate response and recovery post disaster and
depends on the level of preparation of operational institutions and the community. This
public policy searches to respond efficiently and appropriately when risk has been
materialized and it has not been possible to impede the impact of dangerous phenomena.
Effectiveness implies organization, capacity and operative planning of institutions and
other diverse actors involved in disasters. The indicators that represent the capacity for
disaster management, DM, are the following:
• DM1. Organization and coordination of emergency operations
• DM2. Emergency response planning and implementation of warning systems
• DM3. Endowment of equipments, tools and infrastructure
• DM4. Simulation, updating and test of inter institutional response
• DM5. Community preparedness and training
• DM6. Rehabilitation and reconstruction planning
4.3.5 Indicators of governance and financial protection
Governance and financial protection is fundamental for the sustainability of development
and economic growth in a country. This implies, on the one hand, coordination between
different social actors that necessarily are guided by different disciplinary approaches,
values, interests and strategies. Effectiveness is related to the level of interdisciplinarity and
integration of institutional actions and social participation. On the other hand, governance

depends on an adequate allocation and use of financial resources for the management and
implementation of appropriate strategies for the retention and transference of disaster
losses. The indicators that represent governance and financial protection, FP, are the
following:
• FP1. Interinstitutional, multisectoral and decentralizing organization
• FP2. Reserve funds for institutional strengthening
• FP3. Budget allocation and mobilization
• FP4. Implementation of social safety nets and funds response
• FP5. Insurance coverage and loss transfer strategies of public assets.
• FP6. Housing and private sector insurance and reinsurance coverage
4.3.6 Estimation of the indicators
RMI results have been obtained from detailed surveys made to experts and representatives
of different institutions related to risk management. Thus, this index reflects performance of
risk management based on evaluations of academic, professional and officials of the
country. Results for 1995, 2000, 2005 and 2010 are following presented below.
Table 7 shows total RMI and its components, for each period. These are risk
identification, RMIIR, risk reduction, RMIRR, disaster management, RMIDM, and
governance and financial protection, RMIFP.
Table 7. RMI values
1990 1995 2000 2005 2010 RMI 31.08 31.08 36.40 36.40 36.40 RMI RI 12.93 12.93 28.89 28.89 28.89 RMI RR 30.22 30.22 30.22 30.22 30.22 RMI DM 50.08 50.08 50.08 50.08 50.08 RMI FP - - - - -
Source: Author’s data
Figure 11 shows the qualification of subindicators13 that composed RMIRI and its respective
weights, obtained using Analytic Hierarchy Process (AHP).
13 Qualification is linguistic and it does not use defined numbers. In meanings in the tables are: 1: low, 2: incipient, 3: significant, 4: outstanding and 5: optimal

Management related to risk identification has a notable progress from 1995 to 2000 and it
is due to the improvement of level from incipient to significant of the indicator of systematic
disaster and loss inventory. The other indicators remain the same performance level. Risk
management related to risk identification does not present any change during the last three
periods due to there is not any improvement since 2000 of any of the indicators.
Figure 10. RMIRI
12.93 12.93
28.90 28.90 28.90
0
5
10
15
20
25
30
35
1990 1995 2000 2005 2010
RMI RI
NIVEL 1990 1995 2000 2005 2010 Wpaj
RI.1 2 2 3 3 3 13.56 RI.2 2 2 2 2 2 18.14 RI.3 2 2 2 2 2 15.06 RI.4 2 2 2 2 2 20.95 RI.5 2 2 2 2 2 15.13 RI.6 1 1 1 1 1 17.16
Source: Author’s data
Figure 12 shows the qualification of subindicators that composed RMIRR and its
respective weights, obtained using Analytic Hierarchy Process (AHP).
Figure 11. RMIRR
30.22 30.22 30.22 30.22 30.22
0
10
20
30
40
50
60
70
1990 1995 2000 2005 2010
RMI RR
NIVEL 1990 1995 2000 2005 2010 Wpaj RR.1 1 1 1 1 1 27.19 RR.2 1 1 1 1 1 16.44 RR.3 1 1 1 1 1 10.13 RR.4 1 1 1 1 1 13.65 RR.5 3 3 3 3 3 18.58 RR.6 2 2 2 2 2 14.01
Source: Author’s data
Management related to risk reduction indicates that the country has not had progress
during the years of evaluation. The level of the total index is low and it is necessary to have
efficient actions to improve the performance of the risk management in relation with the
risk reduction.
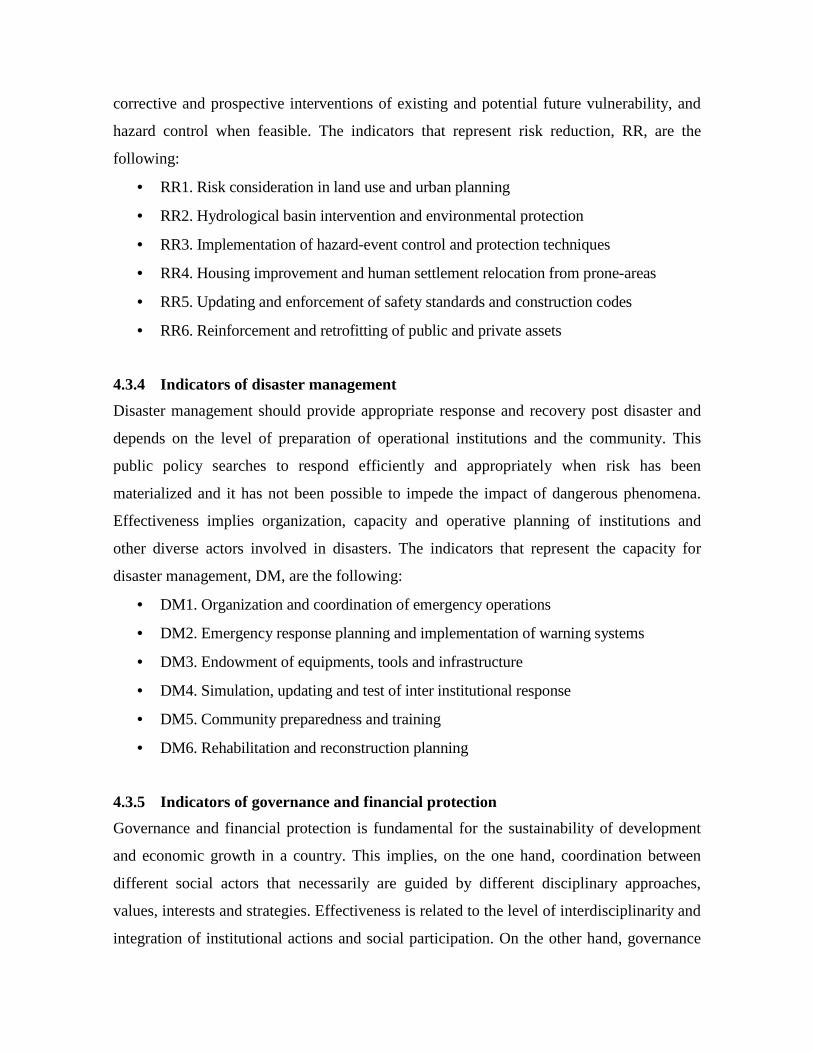
Figure 13 shows subindicators qualifications which composed RMIDM and its
respective weights, obtained using Analytic Hierarchy Process (AHP).
Figure 12. RMIDM
50.08 50.08 50.08 50.08 50.08
0
10
20
30
40
50
60
70
1990 1995 2000 2005 2010
RMI DM
NIVEL 1990 1995 2000 2005 2010 Wpaj DM.1 3 3 3 3 3 20.93 DM.2 3 3 3 3 3 25.30 DM.3 3 3 3 3 3 11.57 DM.4 5 5 5 5 5 15.52 DM.5 3 3 3 3 3 16.44 DM.6 2 2 2 2 2 10.24
Source: Author’s data
Management related to disaster management indicates that the country has not had
progress during the years of evaluation. The level of the total index is medium and it is
necessary to have efficient actions to improve the performance of the risk management in
relation with the disaster management. Nevertheless, it is important to point out that the
indicator of simulation, updating and test of inter institutional response (DM4) presents the
higher level of performance since 1990.
Management related to financial protection and governance did not have any
qualification for Belize. Reason why the evaluation of the total RMI was made based only
in the indicators of risk identification, risk reduction and disaster management.
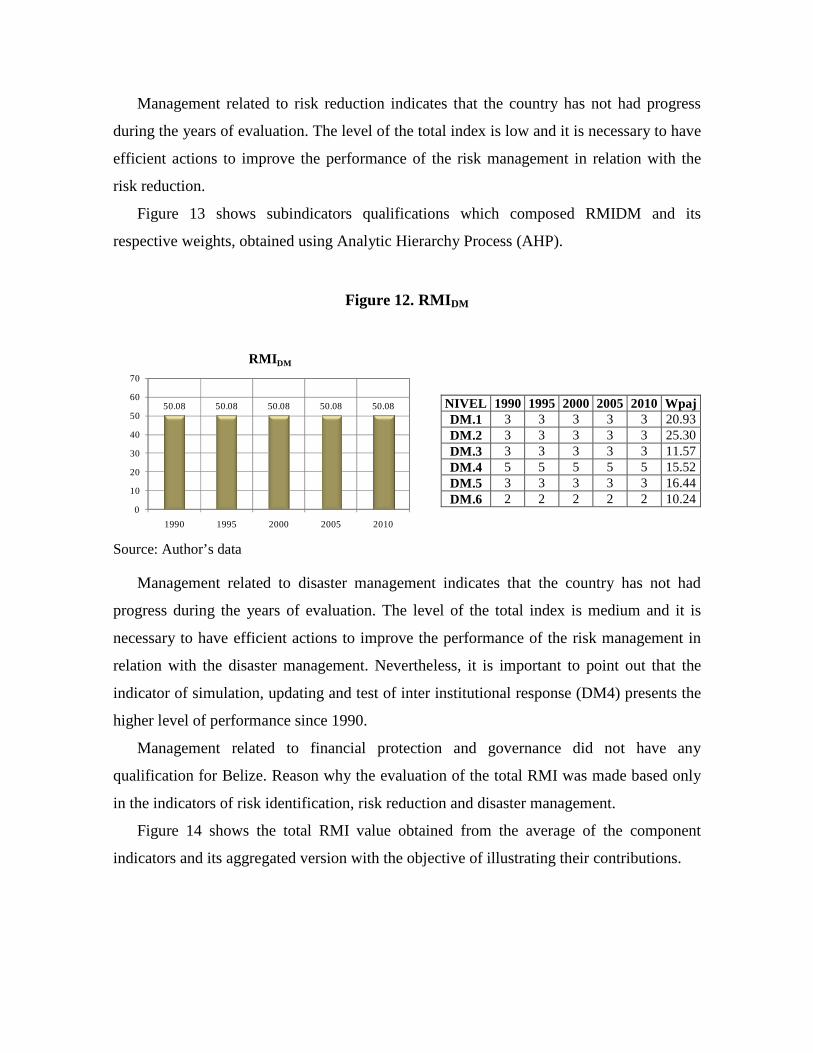
Figure 14 shows the total RMI value obtained from the average of the component
indicators and its aggregated version with the objective of illustrating their contributions.
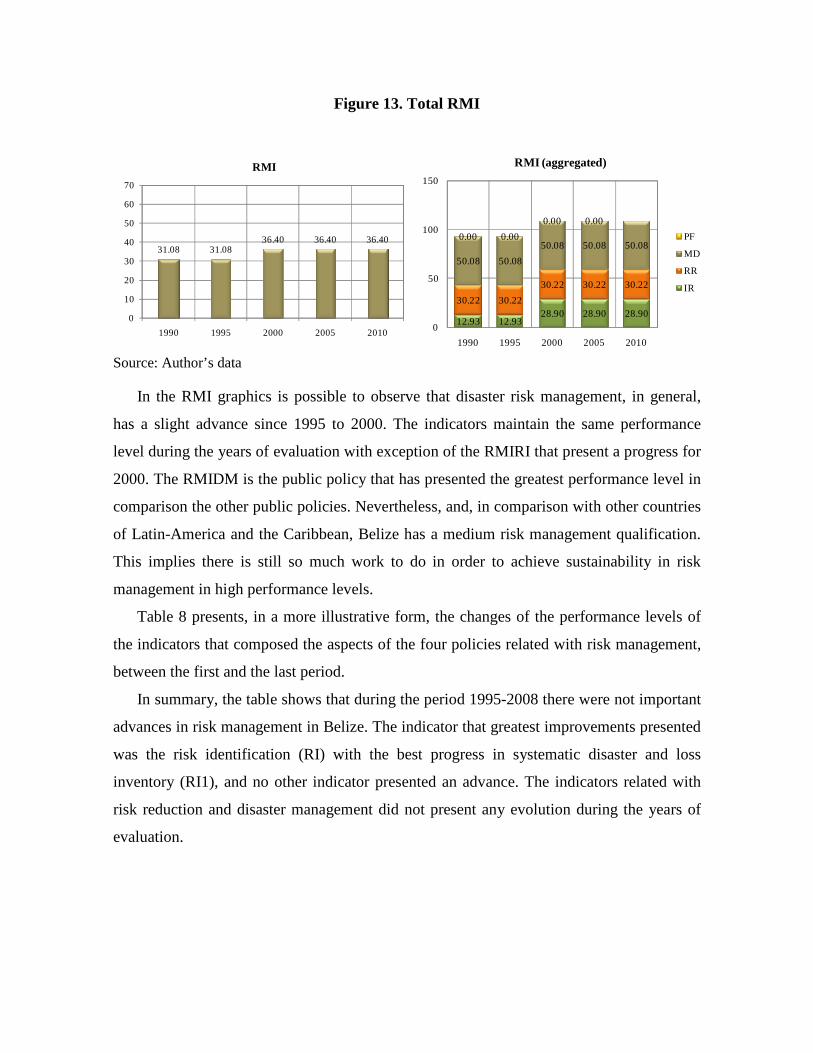
Figure 13. Total RMI
31.08 31.0836.40 36.40 36.40
0
10
20
30
40
50
60
70
1990 1995 2000 2005 2010
RMI
12.93 12.9328.90 28.90 28.90
30.22 30.22
30.22 30.22 30.22
50.08 50.08
50.08 50.08 50.080.00 0.00
0.00 0.00
0
50
100
150
1990 1995 2000 2005 2010
RMI (aggregated)
PF
MD
RR
IR
Source: Author’s data
In the RMI graphics is possible to observe that disaster risk management, in general,
has a slight advance since 1995 to 2000. The indicators maintain the same performance
level during the years of evaluation with exception of the RMIRI that present a progress for
2000. The RMIDM is the public policy that has presented the greatest performance level in
comparison the other public policies. Nevertheless, and, in comparison with other countries
of Latin-America and the Caribbean, Belize has a medium risk management qualification.
This implies there is still so much work to do in order to achieve sustainability in risk
management in high performance levels.
Table 8 presents, in a more illustrative form, the changes of the performance levels of
the indicators that composed the aspects of the four policies related with risk management,
between the first and the last period.
In summary, the table shows that during the period 1995-2008 there were not important
advances in risk management in Belize. The indicator that greatest improvements presented
was the risk identification (RI) with the best progress in systematic disaster and loss
inventory (RI1), and no other indicator presented an advance. The indicators related with
risk reduction and disaster management did not present any evolution during the years of
evaluation.
Table 8. Differences between first and last period for RMI subindicators functions performance
Values of performance functions of the subindicators
1990
RI.1 17 RR.1 5 DM.1 45 FP.1 -
RI.2 17 RR.2 5 DM.2 45 FP.2 -
RI.3 17 RR.3 5 DM.3 45 FP.3 -
RI.4 17 RR.4 5 DM.4 93 FP.4 -
RI.5 17 RR.5 45 DM.5 45 FP.5 -
RI.6 5 RR.6 17 DM.6 17 FP.6 -
RMI RI 12.93 RMI RR 30.22 RMI DM 50.08 RMI FP -
RMI 31.08
2010
RI.1 45 RR.1 5 DM.1 45 FP.1 -
RI.2 17 RR.2 5 DM.2 45 FP.2 -
RI.3 17 RR.3 5 DM.3 45 FP.3 -
RI.4 17 RR.4 5 DM.4 93 FP.4 -
RI.5 17 RR.5 45 DM.5 45 FP.5 -
RI.6 5 RR.6 17 DM.6 17 FP.6 -
RMI RI 28.89 IGRRR 30.22 RMI DM 50.08 RMI FP -
RMI 36.40
Change
RI.1 28 RR.1 0 DM.1 0 FP.1 - RI.2 0 RR.2 0 DM.2 0 FP.2 - RI.3 0 RR.3 0 DM.3 0 FP.3 - RI.4 0 RR.4 0 DM.4 0 FP.4 - RI.5 0 RR.5 0 DM.5 0 FP.5 - RI.6 0 RR.6 0 DM.6 0 FP.6 -
RMI RI 15.96 IGRRR 0 RMI DM 0 RMI FP -
RMI 5.32
Source: Author’s data

5 CONCLUSIONS
DDI illustrates economic implications of a great disaster, estimated with base in the
potential of feasible extreme events; PVI accounts for susceptibility and aggravation factors
of the direct effects of the disasters due to deficiencies in development; and RMI points out
what has been achieved and what is intended to do for improving risk management. And in
the case of RMI the country has not presented notable advances during the periods of
evaluation.
In the case of Belize, the Local Disaster Index, LDI, that captures the relevance of small
and moderate local disasters, was not calculated due to the lack of availability of the
DesInventar database at the time of the indicators assessment and the development of this
project report. This indicator should be evaluated in the next future due to its relevance and
in order to have a complete picture of the country’s risk conditions using the complete set
of indicators.
From these results it is possible to have as conclusions that in Belize there was an
increase of DDI from 2000 to 2008. The PVI is from 1985 basically the same but with a
slight reduction.
Making the comparison of trends in indicators is it possible to conclude that the system
of indicators presents results generally consistent or appropriate to the reality of the
country. In any case, it is important to disaggregate these indicators and identify areas
where improvements can be made through actions, projects and specific activities that can
make the central government with the participation of different sectoral agencies,
municipalities and communities, and, thus, achieve a further progress and greater
sustainability. Decision makers and stakeholders, besides identifying weaknesses indicators
must take into account other characteristics that are not revealed or expressed with the
evaluation obtained. Indicators provide a situational analysis from which it is possible to
extract a set of actions that must be done without details for a strategic plan, which should
be the next step. The aim of the indicator system is helping to formulate general
recommendations for planning.
6 BIBLIOGRAPHY Birkmann, J. (ed.) (2006) Measuring vulnerability to hazards of natural origin. Towards
disaster resilient societies. United Nations University Press, Tokyo, New York (480 p.) Cardona, O.D. (2006). “A System of Indicators for Disaster Risk Management in the
Americas” in Measuring Vulnerability to Hazards of Natural Origin: Towards Disaster Resilient Societies, Editor J. Birkmann, United Nations University Press, Tokyo.
Cardona, O.D. (2009). “Disaster Risk and Vulnerability: Notions and Measurement of
Human and Environmental Insecurity” in Coping with Global Environmental Change, Disasters and Security - Threats, Challenges, Vulnerabilities and Risks, Editors: H.G. Brauch, U. Oswald Spring, C. Mesjasz, J. Grin, P. Kameri-Mbote, B. Chourou, P. Dunay, J. Birkmann: Hexagon Series on Human and Environmental Security and Peace, vol. 5 (Berlin – Heidelberg – New York: Springer-Verlag).
Cardona, O.D., J.E. Hurtado, G. Duque, A. Moreno, A.C. Chardon, L.S. Velásquez and S.D.
Prieto. 2003a. La Noción de Riesgo desde la Perspectiva de los Desastres: Marco Conceptual para su Gestión Integral. IDB/IDEA Program of Indicators for Disaster Risk Management, National University of Colombia, Manizales. Available at http://idea.unalmzl.edu.co
____________. 2003b. Indicadores para la Medición del Riesgo: Fundamentos para un
Enfoque Metodológico. IDB/IDEA Program of Indicators for Disaster Risk Management, National University of Colombia, Manizales. Available at http://idea.unalmzl.edu.co
____________. 2004a. Dimensionamiento Relativo del Riesgo y de la Gestión: Metodología
Utilizando Indicadores a Nivel Nacional. IDB/IDEA Program of Indicators for Disaster Risk Management, National University of Colombia, Manizales. Available at http://idea.unalmzl.edu.co
____________. 2004b. Resultados de la Aplicación del Sistema de Indicadores en Doce
Países de las Américas. IDB/IDEA Program of Indicators for Disaster Risk Management, National University of Colombia, Manizales. Available at http://idea.unalmzl.edu.co
____________. 2005. Sistema de indicadores para la gestión del riesgo de desastre: Informe
técnico principal. IDB/IDEA Program of Indicators for Disaster Risk Management, National University of Colombia, Manizales. Available at http://idea.unalmzl.edu.co
Cardona, O.D., Ordaz, M.G., Marulanda, M.C., & Barbat, A.H. (2008). Estimation of
Probabilistic Seismic Losses and the Public Economic Resilience—An Approach for a Macroeconomic Impact Evaluation, Journal of Earthquake Engineering, 12 (S2) 60-70, ISSN: 1363-2469 print / 1559-808X online, DOI: 10.1080/13632460802013511, Taylor & Francis, Philadelphia, PA.

Carreño, M.L, Cardona, O.D., Barbat, A.H. (2004). Metodología para la evaluación del desempeño de la gestión del riesgo, Monografía CIMNE IS-51, Universidad Politécnica de Cataluña, Barcelona.
____________. (2005). Sistema de indicadores para la evaluación de riesgos, Monografía
CIMNE IS-52, Universidad Politécnica de Cataluña, Barcelona. ____________. (2007). A disaster risk management performance index, Journal of Natural
Hazards, February 2007, DOI 10.1007/s11069-006-9008-y, 0921-030X (Print) 1573-0840 (Online), Vol. 41 N. 1, April, 1-20, Springer Netherlands.
____________. (2007). Urban seismic risk evaluation: A holistic approach, Journal of
Natural Hazards, 40, 2007, 137-172. DOI 10.1007/s11069-006-0008-8. ISSN 0921-030X (Print) 1573-0840 (Online)
____________. (2007). Urban seismic risk evaluation: A holistic approach, Journal of
Natural Hazards, 40, 137-172. DOI 10.1007/s11069-006-0008-8. ISSN 0921-030X (Print) 1573-0840 (Online), Springer Netherlands
____________. (2008). Application and robustness of the holistic approach for the seismic
risk evaluation of megacities, Innovation Practice Safety: Proceedings 14th World Conference on Earthquake Engineering, Beijing, China.
Carreño, M.L., Cardona, O.D., Marulanda M.C., & Barbat, A.H. (2009). “Holistic urban
seismic risk evaluation of megacities: Application and robustness” en The 1755 Lisbon Earthquake: Revisited. Series: Geotechnical, geological and Earthquake Engineering, Vol 7, Mendes-Victor, L.A.; Sousa Oliveira, C.S.; Azevedo, J.; Ribeiro, A. (Eds.), Springer.
IDEA – Instituto de Estudios Ambientales (2005). Indicadores de Riesgo de Desastre y de
Gestión de Riesgos: Informe Técnico Principal, edición en español e inglés, ISBN: 978-958-44-0220-2, Universidad Nacional de Colombia, Manizales. Available at: http://idea.unalmzl.edu.co
ISDR. 2009. Global Assessment Report on Disaster Risk Reduction (GAR). International
Strategy fro Disaster Reduction, Geneva. Marulanda, M.C. and O.D. Cardona 2006. Análisis del impacto de desastres menores y
moderados a nivel local en Colombia. ProVention Consortium, La RED. Available at: http://www.desinventar.org/sp/proyectos/articulos/ Marulanda, M.C., Cardona, O.D. & A. H. Barbat, (2008). “The Economic and Social Effects
of Small Disasters: Revision of the Local Disaster Index and the Case Study of Colombia”, in Megacities: Resilience and Social Vulnerability, Bohle, H.G., Warner, K. (Eds.) , SOURCE No. 10, United Nations University (EHS), Munich Re Foundation, Bonn.
____________. (2009). “Revealing the Impact of Small Disasters to the Economic and Social
Development”, in Coping with Global Environmental Change, Disasters and Security - Threats, Challenges, Vulnerabilities and Risks, Editors: H.G. Brauch, U. Oswald Spring, C. Mesjasz, J. Grin, P. Kameri-Mbote, B. Chourou, P. Dunay, J. Birkmann: Springer-Verlag (in press), Berlin - New York.
____________. (2009). Robustness of the holistic seismic risk evaluation in urban centers
using the USRi, Journal of Natural Hazards, DOI 10.1007/s 11069-008-9301-z, Vol 49 (3) (Junio):501-516, Springer Science+ Business.
Ordaz, M.G., and L.E. Yamín. 2004. Eventos máximos considerados (EMC) y estimación
de pérdidas probables para el cálculo del índice de déficit por desastre (IDD) en doce países de las Américas. IDB/IDEA Program of Indicators for Disaster Risk Management, National University of Colombia, Manizales. Available at http://idea.unalmzl.edu.co
Velásquez, C.A. 2009. Reformulación del modelo del Índice de Déficit por Desastre.
Programa de Indicadores de Riesgo de Desastre y Gestión de Riesgos BID-IDEA-ERN. Universidad Nacional de Colombia, sede Manizales. Disponible en: http://idea.unalmzl.edu.co
APPENDIX I
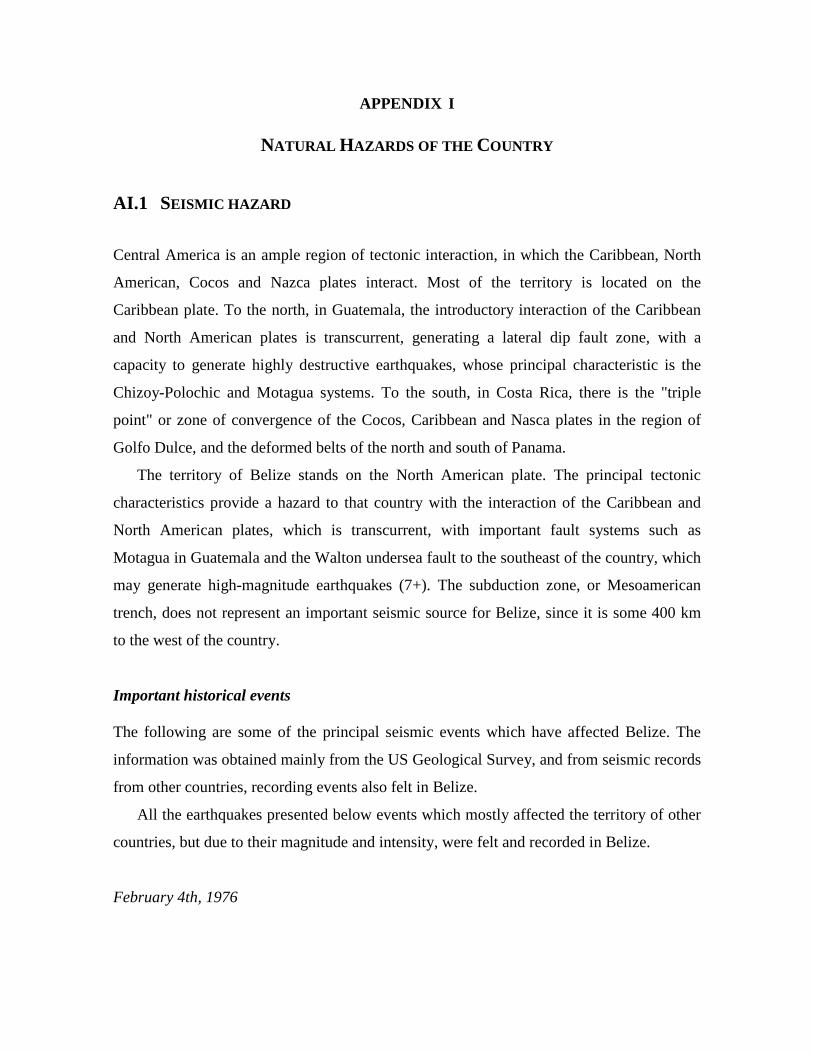
NATURAL HAZARDS OF THE COUNTRY AI.1 SEISMIC HAZARD
Central America is an ample region of tectonic interaction, in which the Caribbean, North
American, Cocos and Nazca plates interact. Most of the territory is located on the
Caribbean plate. To the north, in Guatemala, the introductory interaction of the Caribbean
and North American plates is transcurrent, generating a lateral dip fault zone, with a
capacity to generate highly destructive earthquakes, whose principal characteristic is the
Chizoy-Polochic and Motagua systems. To the south, in Costa Rica, there is the "triple
point" or zone of convergence of the Cocos, Caribbean and Nasca plates in the region of
Golfo Dulce, and the deformed belts of the north and south of Panama.
The territory of Belize stands on the North American plate. The principal tectonic
characteristics provide a hazard to that country with the interaction of the Caribbean and
North American plates, which is transcurrent, with important fault systems such as
Motagua in Guatemala and the Walton undersea fault to the southeast of the country, which
may generate high-magnitude earthquakes (7+). The subduction zone, or Mesoamerican
trench, does not represent an important seismic source for Belize, since it is some 400 km
to the west of the country.
Important historical events The following are some of the principal seismic events which have affected Belize. The
information was obtained mainly from the US Geological Survey, and from seismic records
from other countries, recording events also felt in Belize.
All the earthquakes presented below events which mostly affected the territory of other
countries, but due to their magnitude and intensity, were felt and recorded in Belize.
February 4th, 1976
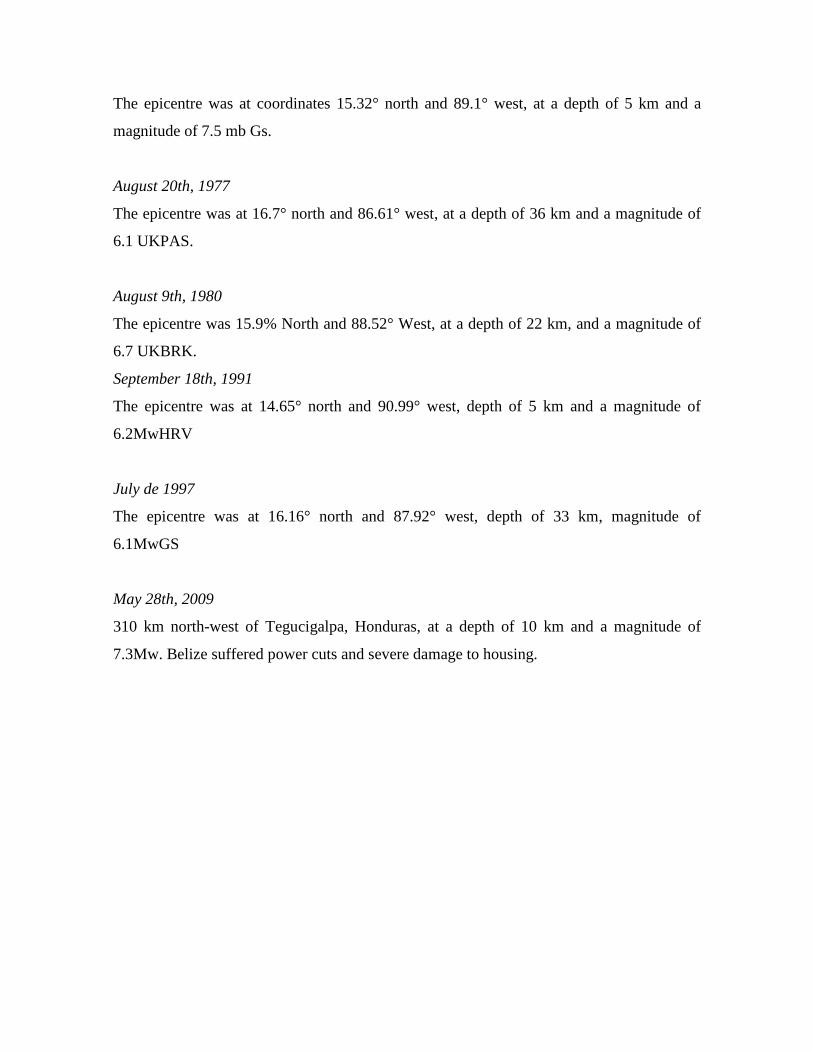
The epicentre was at coordinates 15.32° north and 89.1° west, at a depth of 5 km and a
magnitude of 7.5 mb Gs.
August 20th, 1977
The epicentre was at 16.7° north and 86.61° west, at a depth of 36 km and a magnitude of
6.1 UKPAS.
August 9th, 1980
The epicentre was 15.9% North and 88.52° West, at a depth of 22 km, and a magnitude of
6.7 UKBRK.
September 18th, 1991
The epicentre was at 14.65° north and 90.99° west, depth of 5 km and a magnitude of
6.2MwHRV
July de 1997
The epicentre was at 16.16° north and 87.92° west, depth of 33 km, magnitude of
6.1MwGS
May 28th, 2009
310 km north-west of Tegucigalpa, Honduras, at a depth of 10 km and a magnitude of
7.3Mw. Belize suffered power cuts and severe damage to housing.
AI.1 HYDROMETEOROLOGICAL HAZARDS
Belize’s Caribbean coast is a temp is a territory which has been much affected by
hurricane.In 1961 a hurricane completely destroyed the then-capital, Belize City, obliging
survivors to move to the centre of the country, to what is now the capital of Belize,
Belmopan.
Below we present the information on hurricanes which have had the most impact on
Belize territory since 1960, in the Atlantic hurricane seasons.
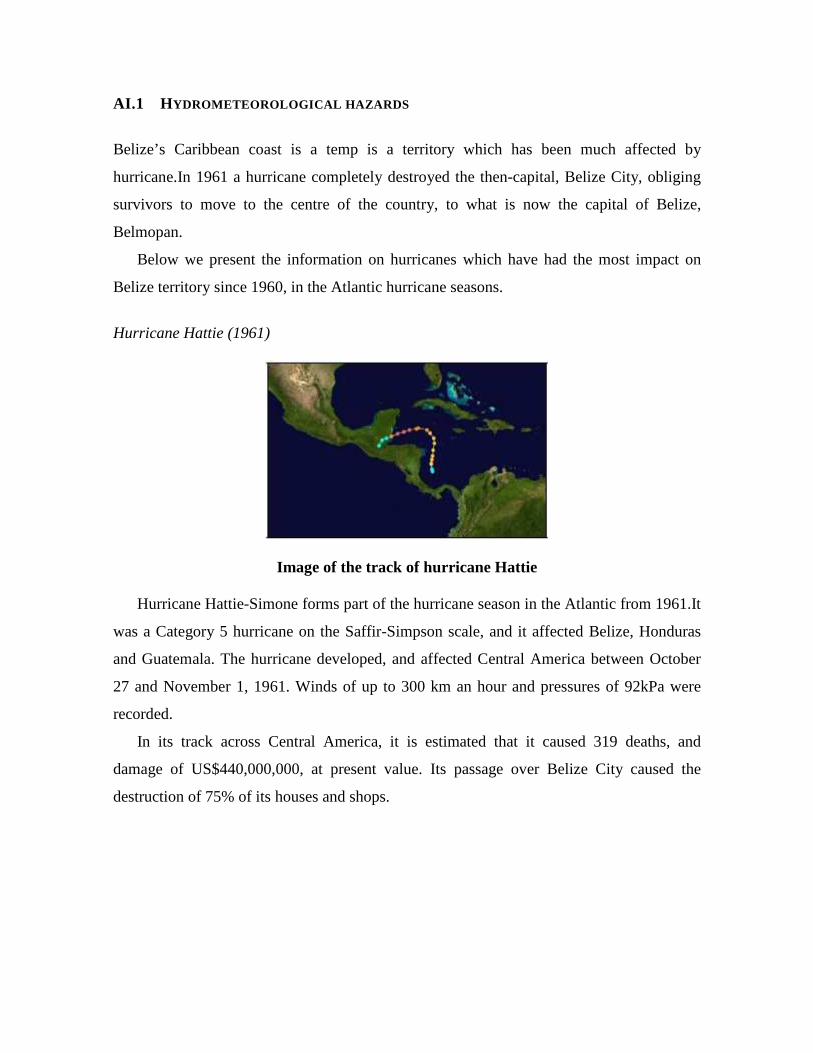
Hurricane Hattie (1961)
Image of the track of hurricane Hattie
Hurricane Hattie-Simone forms part of the hurricane season in the Atlantic from 1961.It
was a Category 5 hurricane on the Saffir-Simpson scale, and it affected Belize, Honduras
and Guatemala. The hurricane developed, and affected Central America between October
27 and November 1, 1961. Winds of up to 300 km an hour and pressures of 92kPa were
recorded.
In its track across Central America, it is estimated that it caused 319 deaths, and
damage of US$440,000,000, at present value. Its passage over Belize City caused the
destruction of 75% of its houses and shops.

Hurricane Fifi (1974)
Satellite image of hurricane Fifi
Image of the track of hurricane Fifi
Hurricane Fifi belongs to the 1974 Atlantic Ocean hurricane season. It crossed the
Atlantic as hurricane Fifi, and reached the Pacific, where it was renamed hurricane Orlene.
Hurricane Fifi-Orlene developed between September 14 and 22, 1974, from a tropical wave
in the Caribbean. It struck Belize territory on September 19 as a Category 2 hurricane, on
the Saffir-Simpson scale, with sustained winds of 175 kph, and pressures of 970 mb.
Hurricane Fifi cause damage totalling US$900,000,000 (USD-1974), in Central
America, that is, US$4,000 million in present value.The event was catalogued as the 4th
most deadly in history, with 8,000-10,000 fatalities.
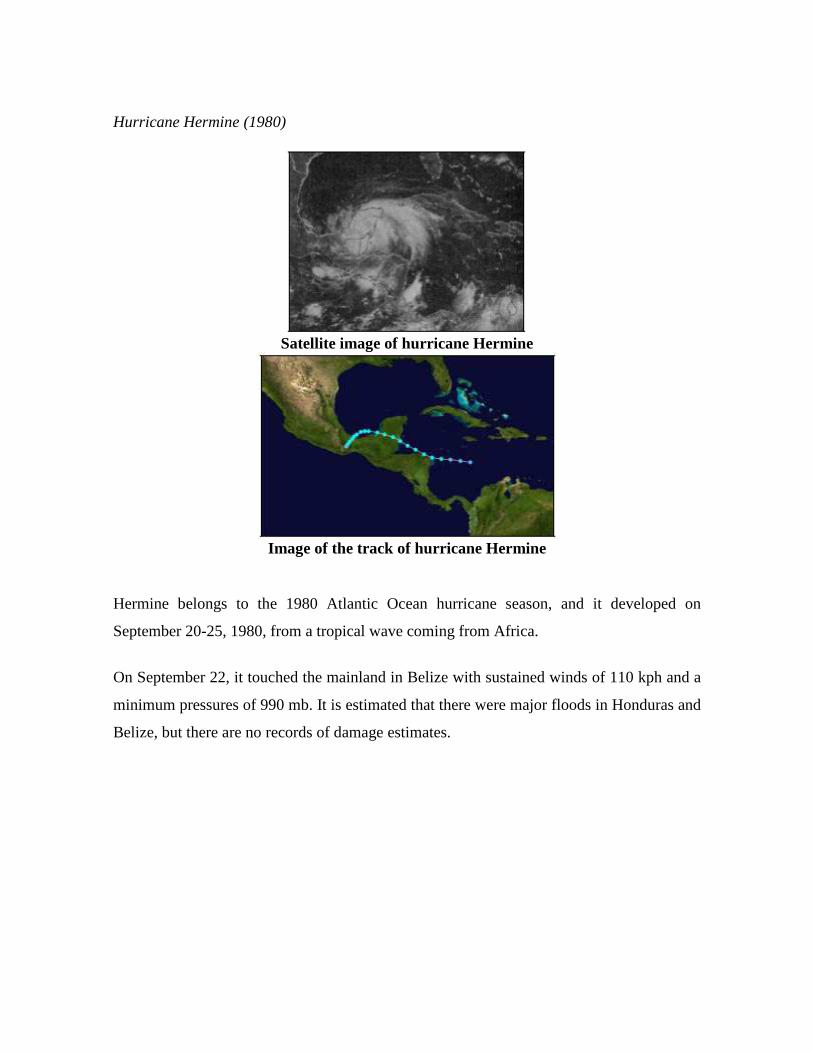
Hurricane Hermine (1980)
Satellite image of hurricane Hermine
Image of the track of hurricane Hermine
Hermine belongs to the 1980 Atlantic Ocean hurricane season, and it developed on
September 20-25, 1980, from a tropical wave coming from Africa.
On September 22, it touched the mainland in Belize with sustained winds of 110 kph and a
minimum pressures of 990 mb. It is estimated that there were major floods in Honduras and
Belize, but there are no records of damage estimates.
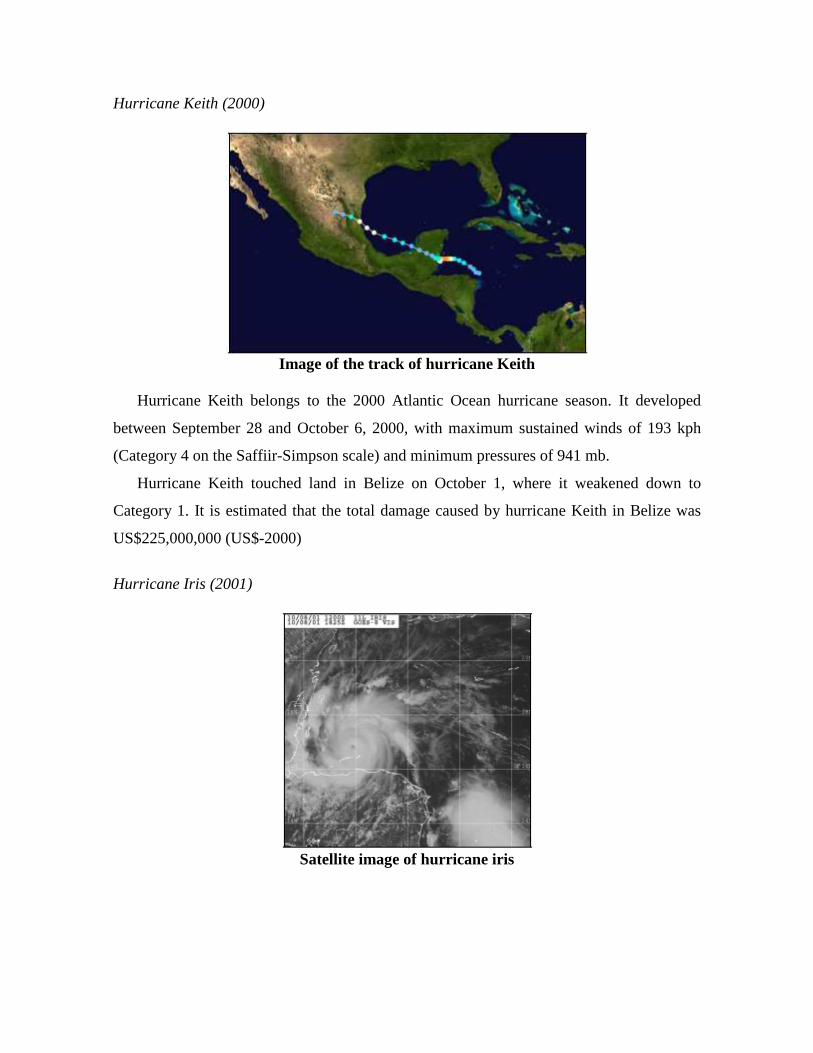
Hurricane Keith (2000)
Image of the track of hurricane Keith
Hurricane Keith belongs to the 2000 Atlantic Ocean hurricane season. It developed
between September 28 and October 6, 2000, with maximum sustained winds of 193 kph
(Category 4 on the Saffiir-Simpson scale) and minimum pressures of 941 mb.
Hurricane Keith touched land in Belize on October 1, where it weakened down to
Category 1. It is estimated that the total damage caused by hurricane Keith in Belize was
US$225,000,000 (US$-2000)
Hurricane Iris (2001)
Satellite image of hurricane iris
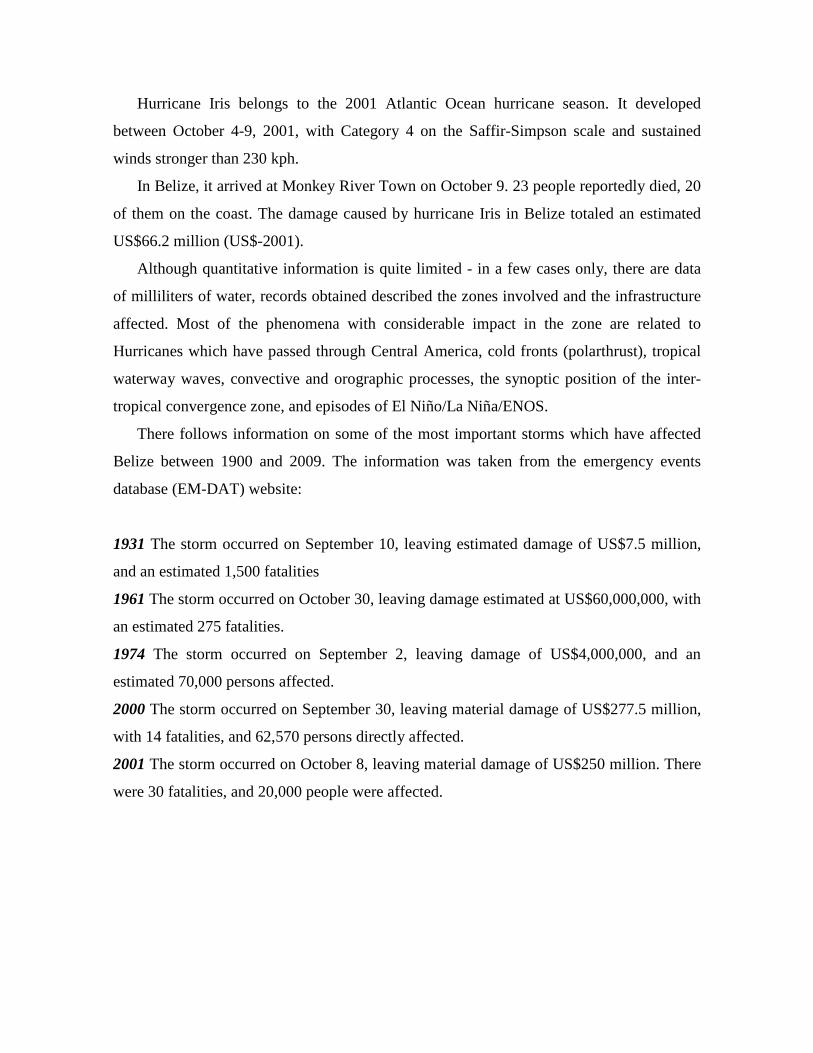
Hurricane Iris belongs to the 2001 Atlantic Ocean hurricane season. It developed
between October 4-9, 2001, with Category 4 on the Saffir-Simpson scale and sustained
winds stronger than 230 kph.
In Belize, it arrived at Monkey River Town on October 9. 23 people reportedly died, 20
of them on the coast. The damage caused by hurricane Iris in Belize totaled an estimated
US$66.2 million (US$-2001).
Although quantitative information is quite limited - in a few cases only, there are data
of milliliters of water, records obtained described the zones involved and the infrastructure
affected. Most of the phenomena with considerable impact in the zone are related to
Hurricanes which have passed through Central America, cold fronts (polarthrust), tropical
waterway waves, convective and orographic processes, the synoptic position of the inter-
tropical convergence zone, and episodes of El Niño/La Niña/ENOS.
There follows information on some of the most important storms which have affected
Belize between 1900 and 2009. The information was taken from the emergency events
database (EM-DAT) website:
1931 The storm occurred on September 10, leaving estimated damage of US$7.5 million,
and an estimated 1,500 fatalities
1961 The storm occurred on October 30, leaving damage estimated at US$60,000,000, with
an estimated 275 fatalities.
1974 The storm occurred on September 2, leaving damage of US$4,000,000, and an
estimated 70,000 persons affected.
2000 The storm occurred on September 30, leaving material damage of US$277.5 million,
with 14 fatalities, and 62,570 persons directly affected.
2001 The storm occurred on October 8, leaving material damage of US$250 million. There
were 30 fatalities, and 20,000 people were affected.
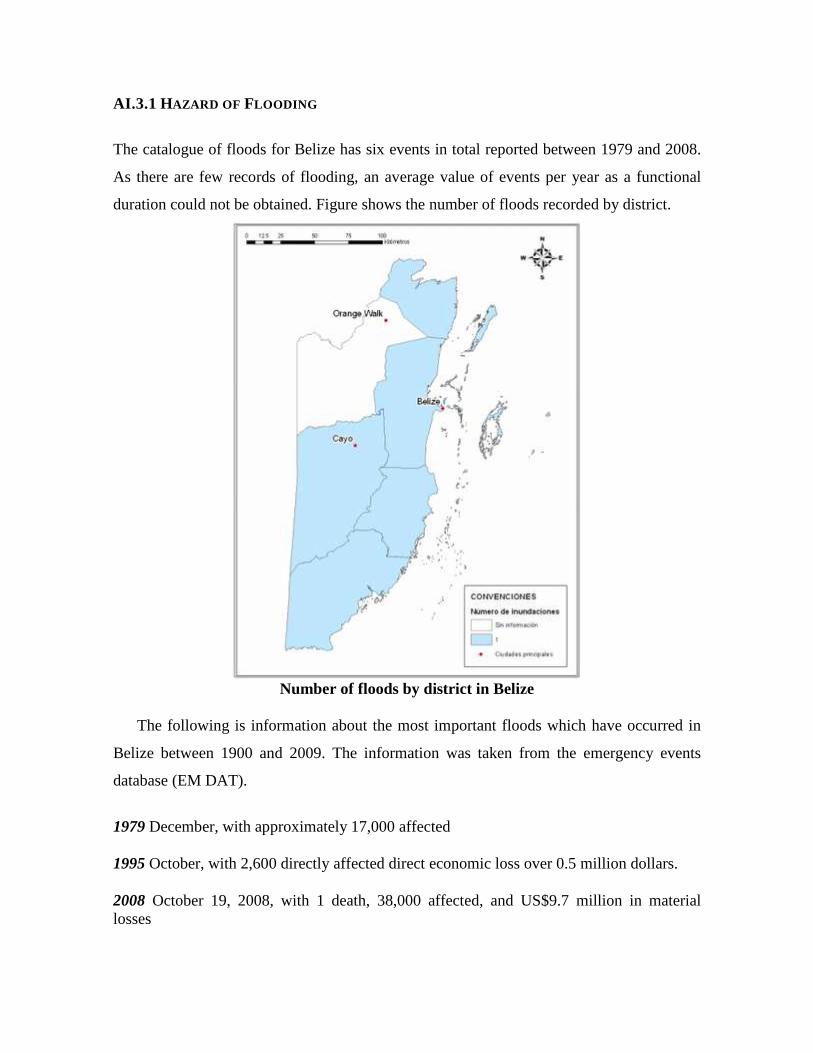
AI.3.1 HAZARD OF FLOODING
The catalogue of floods for Belize has six events in total reported between 1979 and 2008.
As there are few records of flooding, an average value of events per year as a functional
duration could not be obtained. Figure shows the number of floods recorded by district.
Number of floods by district in Belize
The following is information about the most important floods which have occurred in
Belize between 1900 and 2009. The information was taken from the emergency events
database (EM DAT).
1979 December, with approximately 17,000 affected
1995 October, with 2,600 directly affected direct economic loss over 0.5 million dollars.
2008 October 19, 2008, with 1 death, 38,000 affected, and US$9.7 million in material losses


