
Increasing the Diversity of the STEM Workforce
Mimi Lufkin, CEONational Alliance for Partnerships in EquitySREB Conference, Atlanta, GAJuly 9, 2009
Strategies for Administrators
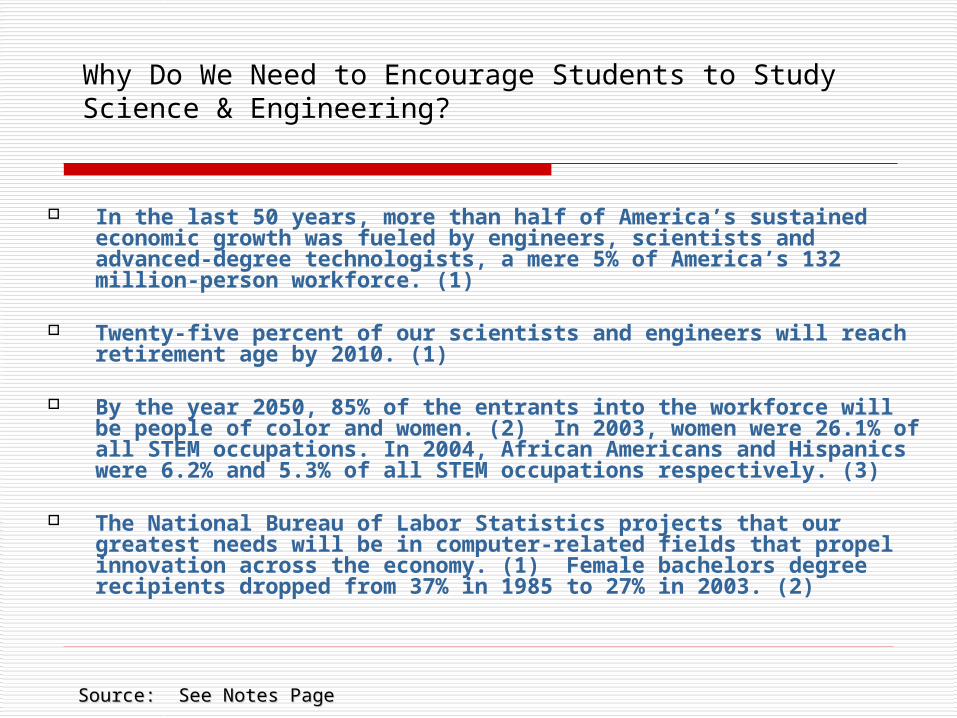
Why Do We Need to Encourage Students to Study Science & Engineering?
In the last 50 years, more than half of America’s sustained economic growth was fueled by engineers, scientists and advanced-degree technologists, a mere 5% of America’s 132 million-person workforce. (1)
Twenty-five percent of our scientists and engineers will reach retirement age by 2010. (1)
By the year 2050, 85% of the entrants into the workforce will be people of color and women. (2) In 2003, women were 26.1% of all STEM occupations. In 2004, African Americans and Hispanics were 6.2% and 5.3% of all STEM occupations respectively. (3)
The National Bureau of Labor Statistics projects that our greatest needs will be in computer-related fields that propel innovation across the economy. (1) Female bachelors degree recipients dropped from 37% in 1985 to 27% in 2003. (2)
Source: See Notes PageSource: See Notes Page

Why Do We Care if Women and Minorities Become Engineers and Scientists?
As a consequence of a lack of diversity we pay an opportunity cost, a cost in designs not thought of, in solutions not produced.Source: Dr. Bill Wulf, Past President, National Academy of Engineering
If we do not engage women and minorities in the engineering enterprise, we are ignoring more than 50% of America’s intellectual talent.
Source: Bostonworks.comSource: Bostonworks.com

What Science Courses Are U.S. High School
Students Taking? 2004
0.0 20.0 40.0 60.0 80.0 100.0
Male
Female
White, non-Hispanic
Black, non-Hispanic
Hispanic
Asian/Pacific Islander
Native American
Biology Chemistry Physics
Source: CPST, data derived from National Center for Education Statistics

What Mathematics Courses Are U.S. High School Students Taking? 2004
0.0 20.0 40.0 60.0 80.0 100.0
Male
Female
White, non-Hispanic
Black, non-Hispanic
Hispanic
Asian/Pacific Islander
Native American
Algebra II Analysis/pre-calculus Calculus
Source: CPST, data derived from National Center for Education Statistics

Trends in NAEP Math Scores by Sex and Race/Ethnicity, Age 17, 1973-2004
240
250
260
270
280
290
300
310
320
1973 1978 1982 1986 1990 1992 1994 1996 1999 2004
White
All Boys
Total
All Girls
Hispanic
African American
Source: CPST, data derived from National Center for Education Statistics

Males Far More Likely to Plan to Major in Technical Fields Than Are Females
0.0
5.0
10.0
15.0
20.0
25.0
30.0
1990 1992 1994 1996 1998 2000 2002 2004
0.0
5.0
10.0
15.0
20.0
25.0
30.0
1990 1992 1994 1996 1998 2000 2002 2004
Computer Science
Physical Sciences
Engineering
Males Females
Source: CPST, data derived from Higher Education Research Institute
© 2006 WEPAN, www.wepan.org, prepared by CPST, www.cpst.orgDeveloped by WEPAN for member use only.

Women in Engineering at the 2-Year Level: Degrees Granted
© 2006 WEPAN, www.wepan.orgPrepared by CPST, www.cpst.org
0
500
1,000
1,500
2,000
2,500
3,000
1990 1991 1992 1993 1994 1995 1996 1997 1998 2000 2001 2002 2003
Total Male
Total Female
Source: CPST, data derived from National Center for Education Statistics

Minorities in Engineering at the 2-Year Level: Degrees Granted
© 2006 WEPAN, www.wepan.orgPrepared by CPST, www.cpst.org
0
500
1,000
1,500
2,000
2,500
3,000
1990 1991 1992 1993 1994 1995 1996 1997 1998 2000 2001 2002 2003
Other
White
Hispanic
Black
Asian
American Indian
Source: CPST, data derived from National Center for Education Statistics
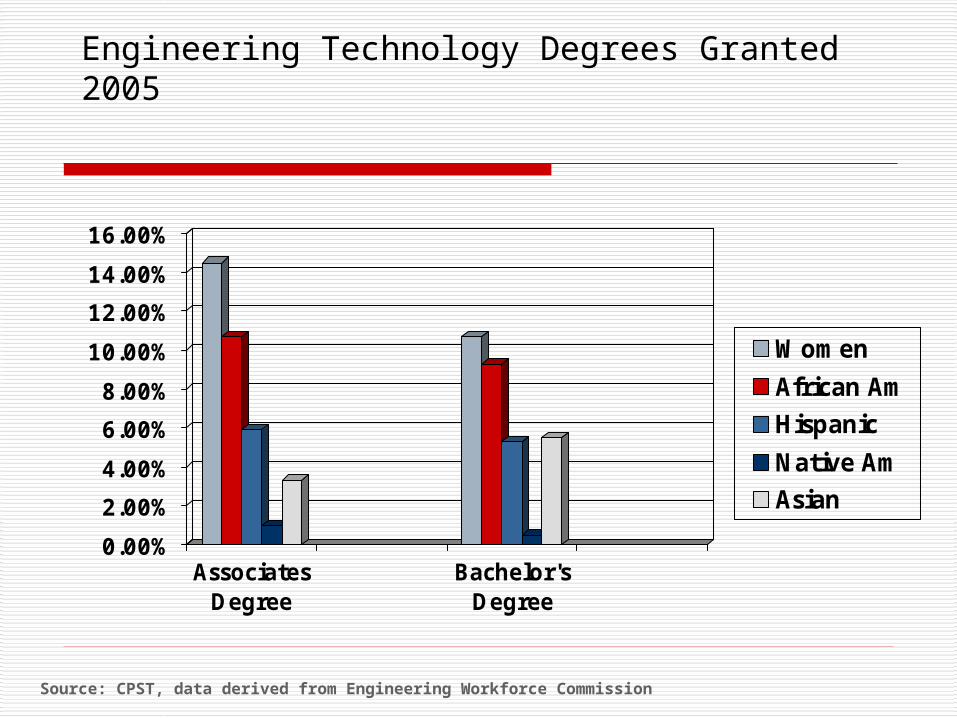
Engineering Technology Degrees Granted 2005
0.00%
2.00%
4.00%
6.00%
8.00%
10.00%
12.00%
14.00%
16.00%
AssociatesDegree
Bachelor'sDegree
Women
African Am
Hispanic
Native Am
Asian
Source: CPST, data derived from Engineering Workforce Commission

Bachelor’s Degrees Granted by Engineering Discipline 2005
0
5
1015
20
25
3035
40
45
Female
Source: CPST, data derived from Engineering Workforce Commission.
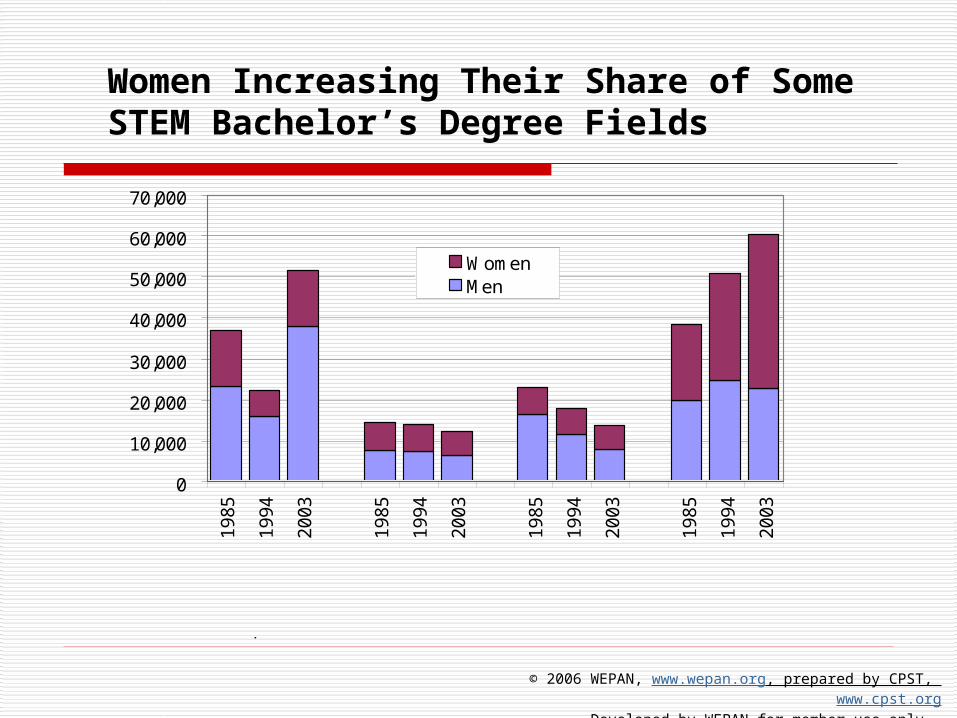
Women Increasing Their Share of Some STEM Bachelor’s Degree Fields
0
10,000
20,000
30,000
40,000
50,000
60,000
70,000
19
85
19
94
20
03
19
85
19
94
20
03
19
85
19
94
20
03
19
85
19
94
20
03
WomenMen
Computer Science
Mathematics Physical Sciences
Biological Sciences
Source: CPST, data derived from NSF and NCES
© 2006 WEPAN, www.wepan.org, prepared by CPST, www.cpst.orgDeveloped by WEPAN for member use only.

Women as a Percentage of Selected Occupations in 2005
30.2%
5.8%
7.1%
13.2%
14.3%
22.5%
23.8%
32.3%35.3%
41.0%
44.4%
48.7%
61.9%
67.3%
0% 10% 20% 30% 40% 50% 60% 70% 80%
Psychologists
Accountants/Auditors
Biological Scientists
Postsecondary Teachers
Marketing & Sales Mgrs.
Chemists
Physicians/Surgeons
Lawyers
Chief Executives
Dentists
Chemical Engineers
Civil Engineers
Electrical Engineers
Mechanical Engineers
Source: CPST, data derived from Bureau of Labor Statistics
© 2006 WEPAN, www.wepan.orgPrepared by CPST, www.cpst.org
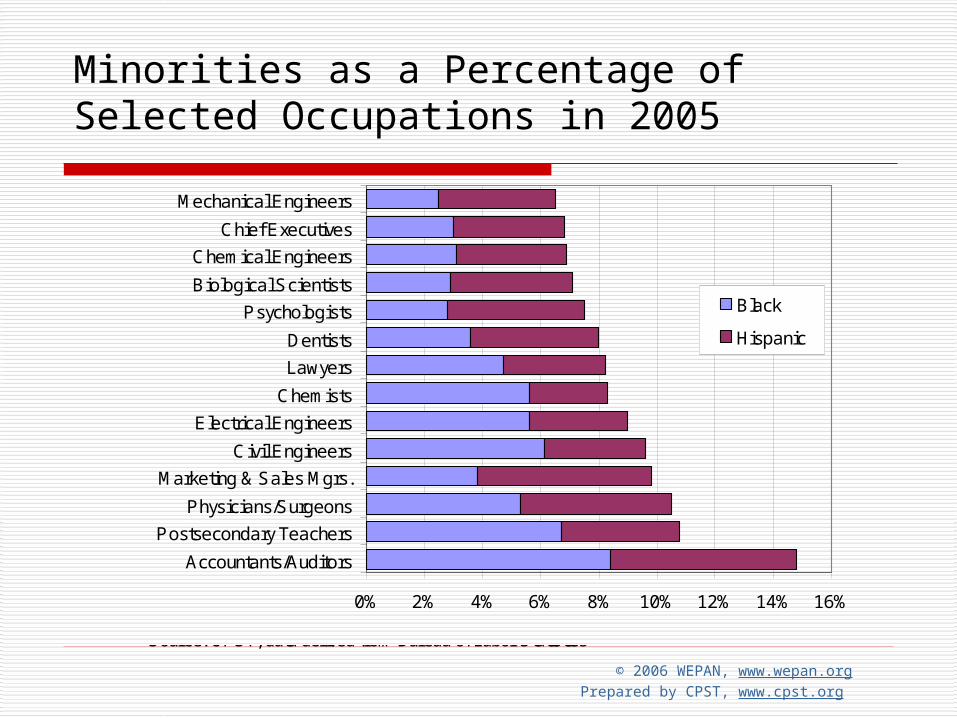
Minorities as a Percentage of Selected Occupations in 2005
© 2006 WEPAN, www.wepan.orgPrepared by CPST, www.cpst.org
0% 2% 4% 6% 8% 10% 12% 14% 16%
Accountants/Auditors
Postsecondary Teachers
Physicians/Surgeons
Marketing & Sales Mgrs.
Civil Engineers
Electrical Engineers
Chemists
Lawyers
Dentists
Psychologists
Biological Scientists
Chemical Engineers
Chief Executives
Mechanical Engineers
Black
Hispanic
Source: CPST, data derived from Bureau of Labor Statistics

Median Annual Salaries of Full-TimeEngineers and Scientists 2005
Engineers: $63,500 (Range: $60,500 – $73,000)
Engineering Technicians: $41,000 Mathematical & Computer Scientists:
$59,000 Medical Scientists: $48,500 Biological & Life Sciences: $46,500 Science (Chemical) Technicians: $36,500
Source: CPST

Why Nontraditional?
Societal Issues that Led to the Implementation of Public Policy

Nontraditional Fields
Occupations or fields of work, including careers in computer science, technology, and other current and emerging high skill occupations, for which individuals from one gender comprise less than 25 percent of the individuals employed in each such occupation or field of work.
National Alliance for
Partnerships in Equity

Societal Issues Children’s Defense Fund report on children
in poverty in early 1970 Increasing single parent households headed
by women on public assistance Women entering the workforce at a faster
rate than any other population Women hold majority of low paying jobs Pay gap and pay equity

Solution
Access for women in poverty to education and job training for
occupations providing wages leading to economic self-sufficiency
=Nontraditional occupations

Why Continue the Policy? Children in poverty continue to be living in
single parent households headed by women Workforce competitiveness, especially in
STEM fields, does not allow us to ignore more than 50% of the potential workforce pool
Making slow progress on increasing the participation and completion of women in nontraditional fields, particularly STEM careers.

Why Continue the Policy?
Pay gap and pay discrimination continues to be an issue
Women still clustered in the lowest paying occupations
Nontraditional careers a path to economic self-sufficiency for women
Career satisfaction more important to today’s workforce participants
Perkins Accountability Measures
Core indicator Participation in CTE programs
preparing students for nontraditional fields
Completion of CTE programs preparing students for nontraditional fields
National Alliance for
Partnerships in Equity

Startling Statements
Conduct your own poll Survey three other people in the room Average their answers Be prepared to report out your polling
results
National Alliance for
Partnerships in Equity

Barrier Busters
What can administrators do?
Understand the Problem Before You Seek the Solution
Conduct gap analysis – disaggregated by student group Course participation Course completion Graduation Achievement
Grades/GPA Standardized Test Scores
More?
Understand the Problem Before Seeking the Solution
Conduct a root cause analysis Conduct regular climate assessments Interview students
Who drop out of nontraditional programs who stay in nontraditional programs Who never choose
Conduct focus groups with Teachers of nontraditional programs Parents Business/Industry/Advisory committee
members

School Climate
Nontraditional faculty and staff Acceptable behavior in hallways,
cafeteria, school events, busses, etc. Administration and staff support and
encouragement Extracurricular activities
Clubs, After School Program Competitions Summer Camp
School Climate
Integrate equity into staff supervision process
Support comprehensive professional development for all staff on gender and race equity
Develop professional learning communities
Include equity goals and objectives in school improvement plans

Increase Girl’s Participation in STEM Career Exploration
Shrinking gender gap in performance on national assessments in math and science between boys and girls
Still significant gaps when looking at gender AND race/ethnicity or socio-economic status
Girls not translating their academic success in STEM to careers in STEM
Student Isolation
Cohort of underrepresented students in a program are more likely to complete than a single individual
Individuals more likely to Have trouble integrating effectively in
to social structure Suffer decreased performance Drop out

Student Isolation
Schedule students in cohorts when possible
Create peer support groups Recognize student success Offer a personal invitation Provide personal positive
reinforcement

Curriculum Materials
Invisibility Stereotyping Imbalance/Selectivity Unreality Fragmentation/Isolation Linguistic Bias Cosmetic Bias Relevance

Instructional Strategies
Questioning level and wait time Student/teacher interaction and
feedback Classroom management Cooperative learning
design Expectations and
assessment

Classroom Climate
Fair treatment Sexual harassment not tolerated or
ignored Supportive learning environment Subtle messages Classroom location on campus Physical environment

Support Services
Tutoring Child care Transportation Financial Aid Books, Equipment, Tools, Clothing Tuition Modification of Curriculum, Equipment Student/Teacher Aides More

Career Guidance Materials and Practices
Create opportunities to spark student interest Pre-enrollment exploration programs Tours that include hands-on activities Nontraditional program exploration
days (ex. Diva Tech Day) Targeted recruitment activities Send a personal invitation (ex. Focus
on Your Future event)

Early Exposure
Most students pursuing a nontraditional career have had a friend or family member influence them
Spark an interest that would otherwise not be evident
Informal experiences supported by formal experiences
The earlier the better

Parental Support
Parents are the #1 influence of student college major and career choice
Negative messages from people with emotional influence difficult to overcome
Educate parents Newsletter articles Website information Parent night program Open House demonstrations Student award programs

Self-efficacy Attribution Theory
Girls more likely to attribute success to external factors and failure to internal factors
Stereotype Threat Stereotype that girls are not as capable as
boys in math affects their performance Locus of Control
When students feel they are in control of their lives and their futures they are more likely to select nontraditional options

Nontraditional Role Models
Strongest evidence in the research Need to see someone that looks
like them in the career Family members are significant Teachers Mentors

Nontraditional Role Models
Career speakers Job shadowing Field trips Mentoring Online career exploration Print images Video selection

Resources
www.napequity.org
www.stemequitypipeline.org

Questions?


