
IN THE UNITED STATES DISTRICT COURT FOR THE SOUTHERN DISTRICT OF TEXAS
CORPUS CHRISTI DIVISION MARC VEASEY, et al., Plaintiffs, v. RICK PERRY, et al., Defendants.
Civil Action No. 2:13-cv-193 (NGR)
DECLARATION OF STEPHEN D. ANSOLABEHERE
Pursuant to 28 U.S.C. § 1746, I, Stephen D. Ansolabehere, make the following
declaration:
Case 2:13-cv-00193 Document 600-1 Filed in TXSD on 09/16/14 Page 1 of 122

Corrected Supplemental Report
Stephen Ansolabehere
September 16, 2014
I. Statement of Inquiry ............................................................................................................................ 1
II. Background and Qualifications ...................................................................................................... 4
III. Summary of Analysis and Findings ........................................................................................... 7
IV. Data and Sources ............................................................................................................................. 13
A. Terminology ................................................................................................................................... 13
B. Data Used in the Matching Process ...................................................................................... 15
C. Databases Used in Data Analyses ........................................................................................... 17
V. Matching Process ............................................................................................................................. 22
A. Description of the Matching Process ................................................................................... 22
B. Features of the Matching Algorithm .................................................................................... 23
C. MATCH , NO MATCH and NO MATCH/NOT EXEMPTION ELIGIBLE Lists ........... 32
VI. Results: Analysis of Racial Disparities ................................................................................. 35
A. Census Racial Data and Possession of ID ........................................................................... 36
B. Catalist Racial Data and Possession of ID .......................................................................... 38
C. Eligibility for Exemption and Vote‐by‐Mail ...................................................................... 39
D. Voting Rate among Registrations with No Match to an ID ........................................ 42
VII. Validation .......................................................................................................................................... 43
A. Variations in Universe of Registered Voters ..................................................................... 43
B. Racial Classification ...................................................................................................................... 50
VIII. Historical Voting and Registration Patterns .................................................................... 53
A. Catalist and TEAM ........................................................................................................................ 54
B. Ecological Regression Estimates ........................................................................................... 54
C. Current Population Survey...................................................................................................... 56
IX. Reply to Reports of Professors Hood and Milyo ................................................................ 59
A. Response to the Report by Professor Hood ...................................................................... 63
B. Response to the Report by Professor Milyo ..................................................................... 81
X. Conclusion ............................................................................................................................................ 87
Case 2:13-cv-00193 Document 600-1 Filed in TXSD on 09/16/14 Page 2 of 122

1
I. Statement of Inquiry
1. I have been asked to identify which registered voters in the State of Texas have an
acceptable photographic identification required by Texas Senate Bill 14 (2011) (SB 14)
and which do not.
2. I was also asked to determine whether there is a disparity between the percent of
Anglo registered voters and Black or Hispanic registered voters who possess acceptable
SB 14 photo ID.
3. In order to determine the number of Texas registered voters without acceptable SB 14
photo ID, and to determine any racial disparities in rates of acceptable SB 14 ID between
Blacks, Hispanics, and Anglos, I was retained to match records in the Texas Election
Administration Management system (TEAM) voter registration database to relevant State
of Texas and Federal identification databases.
4. I was provided with data from the TEAM and Texas Department of Public Safety
(DPS) databases in February 2014. The extraction date of these data is January 15,
2014. In July, the State of Texas determined that its prior production of DPS records
was incomplete, and Texas provided information regarding the treatment of certain fields
on the DPS database. Specifically, Texas did not produce more than 3.1 million DPS
records for driver licenses and personal identification cards that should have been
included in the original data production. Upon receiving these additional 3.1 million
Case 2:13-cv-00193 Document 600-1 Filed in TXSD on 09/16/14 Page 3 of 122

2
records, I conducted the analyses in my original report with these additional 3.1 million
records. The results of that process are set out in my August 15, 2014 Supplemental and
Reply Report. The figures contained in my August 15, 2014 report are the ones as to
which I testified at trial in this case on September 2, 2014. On September 9, 2014,
Defendant Texas Department of Public Safety served amended answers to written
deposition questions regarding the meaning of certain fields in the DPS database. The
amended answers affected the way that I had treated one field from the driver license
database.1 As a result, I conducted the matching process again taking account of the
correction that DPS had made in its written deposition answers. The result of this process
is that 608,470 records in the TEAM voter registration database do not match to a State
of Texas or federal identification database.2 This Corrected Supplemental Report
incorporates the results of the revised matching process. While the revisions made here
1 My Supplemental and Reply Report dated August 15, 2014, had treated Texas driver license and identification card records with numerical values in the “license_surrendered” field as not valid for matching, based on the understanding that those cards were no longer in the physical possession of the person to whom they were originally issued. The amended deposition answers indicated that the “license_surrendered” field does not relate to whether or not a Texas driver license or identification card had been surrendered to DPS, as had been previously communicated to me based on DPS’s original written deposition answers, but instead relates to out-of-state licenses. As a result, when I conducted the matching process again for purposes of this Corrected Supplemental and Reply Report, I did not exclude any DPS records from being matched based on the content of the “license_surrendered” field. 2 There are 622,527 TEAM records (see Table V.3) that do not match to any valid record in any applicable identification database. While none of these 622,527 TEAM records matched to any valid ID record on any applicable database, a relatively small number matched to DPS records that are both invalid for SB 14 purposes (because they are expired for more than 60 days or marked in the “card status” field as surrendered, and as such, not in the person’s possession) and marked as deceased. Subtracting such records as deceased reduces the number to 608,470.
Case 2:13-cv-00193 Document 600-1 Filed in TXSD on 09/16/14 Page 4 of 122

3
change the total number of voters who did not match to any form of SB 14 identification,
none of my conclusions are changed from what I testified to at trial.
5. I analyzed rates of ID possession for registered voters by race in two different ways.
This is necessary because the TEAM voter registration database does not contain self-
reported information on the race of each registered voter. First, I conducted an ecological
regression analysis that relates rates of possession of acceptable SB 14 ID among
registered voters to the racial composition of Census areas. Second, I matched individual
voter records to data from a firm, Catalist, LLC, that uses a statistical model to predict the
race of individual registered voters.
6. Separate from the determination of who has acceptable SB 14 photo ID, I have also
been asked to examine historical rates of registration and voting among racial groups. I
did so in three ways: (i) using data from the Bureau of Census’s Current Population
Survey (CPS); (ii) by ecological regression analysis relating registration and voting rates
to the racial composition of Census areas; and (iii) by analysis of TEAM voter history
data combined with the Catalist classification of the race of voters.
7. In brief, I conclude that:
(a) There are 608,470 voters in Texas who do not possess acceptable SB 14 photo
identification, representing 4.5 percent of registered voters. That is, these are records on
TEAM that do not match to an identification database and for which there is no
indication in the DPS data that the individual is deceased. Moreover, approximately
Case 2:13-cv-00193 Document 600-1 Filed in TXSD on 09/16/14 Page 5 of 122
4
534,512 voters in Texas neither possess acceptable SB 14 photo ID nor qualify under SB
14 to apply for a disability-based exemption from showing ID at the polls.
(b) There is a racial disparity in the rates of possession of acceptable SB 14 photo ID
such that Black3 registered voters are approximately two to three times as likely as Anglo
registered voters to lack acceptable photo ID and that Hispanic registered voters are
approximately fifty percent to 100 percent more likely than Anglo registered voters to
lack acceptable SB 14 photo ID. (See, especially, Tables VI.1 and VI.2.)
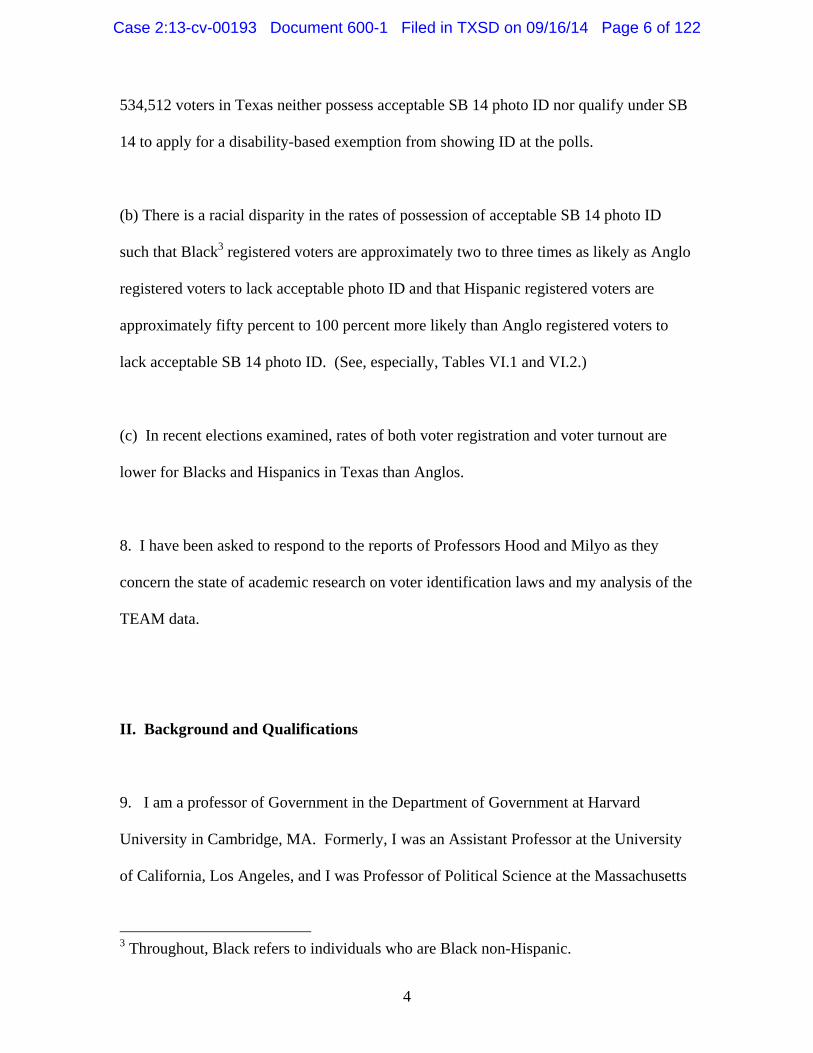
(c) In recent elections examined, rates of both voter registration and voter turnout are
lower for Blacks and Hispanics in Texas than Anglos.
8. I have been asked to respond to the reports of Professors Hood and Milyo as they
concern the state of academic research on voter identification laws and my analysis of the
TEAM data.
II. Background and Qualifications
9. I am a professor of Government in the Department of Government at Harvard
University in Cambridge, MA. Formerly, I was an Assistant Professor at the University
of California, Los Angeles, and I was Professor of Political Science at the Massachusetts
3 Throughout, Black refers to individuals who are Black non-Hispanic.
Case 2:13-cv-00193 Document 600-1 Filed in TXSD on 09/16/14 Page 6 of 122

5
Institute of Technology, where I held the Elting R. Morison Chair and served as
Associate Head of the Department of Political Science. I directed the Caltech/MIT
Voting Technology Project from its inception in 2000 through 2004, am the Principal
Investigator of the Cooperative Congressional Election Study, a survey research
consortium of over 250 faculty and student researchers at more than 50 universities, and
serve on the Board of Overseers of the American National Election Study. I am a
consultant to CBS News’ Election Night Decision Desk. I am a member of the American
Academy of Arts and Sciences (inducted in 2007).
10. I have worked as a consultant to the Brennan Center in the case of McConnell v.
FEC, 540 U.S. 93 (2003). I have testified before the U.S. Senate Committee on Rules,
the U.S. Senate Committee on Commerce, the U.S. House Committee on Science, Space,
and Technology, the U.S. House Committee on House Administration, and the
Congressional Black Caucus on matters of election administration in the United States.
I filed an amicus brief with Professors Nathaniel Persily and Charles Stewart on behalf of
neither party to the U.S. Supreme Court in the case of Northwest Austin Municipal Utility
District Number One v. Holder, 557 U.S. 193 (2009). I am consultant for the Rodriguez
plaintiffs in Perez v. Perry, currently before the U. S. District Court in the Western
District of Texas (No. 5:11-cv-00360), and the Gonzales intervenors in State of Texas v.
United States before the U.S. District Court in the District of Columbia (No. 1:11-cv-
01303); I consulted for the Department of Justice in State of Texas v. Holder, before the
U.S. District Court in the District of Columbia (No. 1:12-cv-00128); I consulted for the
Guy plaintiffs in Guy v. Miller in U.S. District Court for Nevada (No. 11-OC-00042-1B);
Case 2:13-cv-00193 Document 600-1 Filed in TXSD on 09/16/14 Page 7 of 122

6
I consulted for the Florida Democratic Party in In re Senate Joint Resolution of
Legislative Apportionment in the Florida Supreme Court (Nos. 2012-CA-412, 2012-CA-
490); I am consultant for the Romo plaintiffs in Romo v. Detzner in the Circuit Court of
the Second Judicial Circuit in Florida (No. 2012 CA 412); I am consultant for the San
Antonio Water District intervenor in LULAC v. Edwards Aquifer Authority in the U.S.
District Court for the Western District of Texas, San Antonio Division (No. 5:12cv620-
OLG,); I am consultant for the Harris plaintiffs in Harris v. McCrory in the U. S. District
Court for the Middle District of North Carolina (No. 1:2013cv00949).
11. My areas of expertise include American government, with particular expertise in
electoral politics, representation, and public opinion, as well as statistical methods in
social sciences. I have authored numerous scholarly works on voting behavior and
elections, the application of statistical methods in social sciences, legislative politics and
representation, and distributive politics. This scholarship includes articles in such
academic journals as the Journal of the Royal Statistical Society, the American Political
Science Review, the American Economic Review, the American Journal of Political
Science, Legislative Studies Quarterly, the Quarterly Journal of Political Science,
Electoral Studies, and Political Analysis. I have published articles on issues of election
law in the Harvard Law Review, Texas Law Review, Columbia Law Review, New York
University Annual Survey of Law, and the Election Law Journal, for which I am a
member of the editorial board. I have coauthored three scholarly books on electoral
politics in the United States, The End of Inequality: Baker v. Carr and the
Transformation of American Politics, Going Negative: How Political Advertising
Case 2:13-cv-00193 Document 600-1 Filed in TXSD on 09/16/14 Page 8 of 122

7
Shrinks and Polarizes the Electorate, and The Media Game: American Politics in the
Media Age. I am coauthor with Ted Lowi, Ben Ginsberg, and Ken Shepsle of American
Government: Power and Purpose. My curriculum vita with publications list is attached to
this report.
12. As the Principal Investigator of the Cooperative Congressional Election Study and
the Harvard Election Data Archive, I have extensive experience with database
management, record linkage and database matching, data validation, and integration of
Census and electoral data. I have published articles in refereed journals on matching
survey data to voter files, on validation of voting records, and on statistical techniques for
analyzing aggregate election and population data.
13. I have been hired by the Department of Justice in this case. I am retained for a rate
of $400 per hour, which is my standard consulting rate.
III. Summary of Analysis and Findings
14. I have been asked to determine the number of Texas registered voters who lack
acceptable SB 14 photo ID and to determine whether there are disparities between the
percentages of Anglo registered voters and of Black or Hispanic registered voters who
possess such identification and those who neither possess such identification nor qualify
for SB 14’s disability exemption from providing identification at the polls.
Case 2:13-cv-00193 Document 600-1 Filed in TXSD on 09/16/14 Page 9 of 122

8
15. In order to do this, I conducted database matching and record linkage of the Texas
Election Administration Management system (TEAM) database to relevant State of
Texas and Federal databases. SB 14 specifies 7 categories of state and Federal
identification that may be used when voting.4 In addition, SB 14 allows persons with
certain Federally-documented disabilities to apply for an exemption from showing
identification at the polls.5 The TEAM database records which voters have applied for
and received this disability exemption. Using standard methods for linking databases, I
matched records in the TEAM voter registration database to records of holders of Texas-
issued forms of SB 14 ID contained in the Texas Department of Public Safety (DPS)
databases. Also, I developed protocols for matching the TEAM voter registration
database to databases of the Federal agencies that issue allowable forms of SB 14
identification, as well as the databases of the Federal agencies that make relevant
disability determinations.6
4 Specifically, SB 14 requires that all in-person voters present one of the following in order to cast a regular ballot: (1) a Texas Driver License (DL); (2) a Texas Personal Identification Card (PID); (3) a Texas concealed handgun license (CHL); (4) a Texas Election Identification Certificate (EIC); (5) a U.S. military identification card with photo; (6) a U.S. citizenship certification (defined to include certificates of naturalization) with photo; or (7) a U.S. passport. SB 14 requires that IDs with an expiration date be current or expired for less than 60 days. 5 To apply for the disability exemption, voters must submit written documentation stating that they do not have an acceptable SB 14 photo ID and showing either that they have been determined to be disabled by the Social Security Administration, or that they have a disability rating from the U.S. Department of Veteran Affairs of at least 50%. As of January 15, 2014, only 18 Texas voters had been approved for a disability exemption from showing acceptable SB 14 ID. 6 The Federal agencies that issue allowable SB 14 photo ID and which matched their databases to TEAM are: the Department of Defense (DOD), Department of State (DOS), Department of Veterans Affairs (VA), and the United States Citizenship and Immigration Services (USCIS). The Federal agencies that make the relevant disability determinations are the Social Security Administration (SSA) and the VA.
Case 2:13-cv-00193 Document 600-1 Filed in TXSD on 09/16/14 Page 10 of 122

9
16. The matching algorithm produces a NO MATCH list, which consists of all records
on TEAM: a) for which no valid matching record could be found in any identification
database; b) which are not reported as deceased on any matching record in a DPS
database (including invalid for SB 14-purposes expired DPS records); and c) which are
not recorded in TEAM as having received a disability exemption.7 Each record on this
list is treated as an individual registered voter who lacks acceptable SB 14 photo ID.
The algorithm also produces a MATCH list, which consists of all records on TEAM for
which a valid matching record could be found on an identification database
17. The matching algorithm also produces a NO MATCH/NOT EXEMPTION
ELIGIBLE list, which consists of all records in TEAM: a) for which no valid matching
record could be found in any state or Federal identification database; b) which are not
reported as deceased on any matching record in a DPS database (including invalid for
SB 14-purposes expired DPS records); c) which are not recorded in TEAM as having
received a disability exemption; and d) for which no matching record in the relevant
Federal disability databases could be found. Each record on this list is treated as an
individual registered voter who lacks acceptable SB 14 photo ID and does not qualify for
SB 14’s disability exemption.
18. Both the NO MATCH and NO MATCH/NOT EXEMPTION ELIGIBLE lists are
highly relevant to the question of the burden imposed by SB 14 on some Texas voters.
7 Only 18 registered voters in TEAM were marked as having already received the disability exemption.
Case 2:13-cv-00193 Document 600-1 Filed in TXSD on 09/16/14 Page 11 of 122

10
Voters who qualified to apply for the disability exemption will not be able to avail
themselves of that exemption on Election Day, unless they have taken steps to apply for
and prove they qualify for the exemption.
19. The TEAM data extracted on January 15, 2014, contains 13,564,416 records. Of the
13,564,416 records, 622,527 were not matched to any record in a State of Texas or
Federal identification database or had not already received the disability exemption.
Accounting for deceased individuals as indicated by DPS, the total number of records on
TEAM is 13,487,594, and the NO MATCH list contains 608,470 voter records. (See
Tables V.3.A and V.3.B)
20. Of the 13,564,416 TEAM records extracted on January 15, 2014, 548,387 were not
matched to any record in a State of Texas or Federal identification or disability database
or had not already received the disability exemption.8 Accounting for deceased
individuals as indicated by DPS, the NO MATCH/DISABILITY EXEMPTION
ELIGIBLE list contains 534,512 voter records. (See Tables V.4.A and V.4.B)
21. I performed two analyses of racial disparities in the incidence of inclusion on the NO
MATCH and NO MATCH/NOT EXEMPTION ELIGIBLE lists. First, the likelihood
that a registered voter is on the NO MATCH list or the NO MATCH/NOT EXEMPTION
ELIGIBLE is correlated with racial data from the Census Bureau, using ecological
regression. Ecological regression is widely used to measure the voting patterns of racial
Case 2:13-cv-00193 Document 600-1 Filed in TXSD on 09/16/14 Page 12 of 122

11
groups in Voting Rights Act cases. (Thornburg v. Gingles, 478 US 30 (1986).) Second,
the likelihood that an individual record in TEAM is on either the NO MATCH list or the
NO MATCH/NOT EXEMPTION ELIGIBLE list is related to the individual’s race, using
the classification of race of registered voters provided by Catalist, LLC, a data utility
company that provides election data.
22. These two forms of analysis for the NO MATCH list yield very similar results and
show that there are statistically significant9 disparities between the rate at which Anglos
in TEAM are matched to identification databases and disability data records and the rates
at which Blacks and Hispanics are matched. Analysis of the NO MATCH/NOT
EXEMPTION ELIGIBLE list shows that the racial disparities found as to the NO
MATCH list are not alleviated upon considering eligibility to apply for the disability
exemption.
23. Ecological regression based on the NO MATCH list estimates that 2.0 percent of
registered Anglos do not match to a corresponding record in a state or federal
identification database. By comparison, an estimated 8.1 percent of registered Blacks
and 5.9 percent of registered Hispanics do not match. Stated differently, the rate of NO
MATCH for black voters when measured through ecological regression is 305% higher
9 Throughout I report as “statistically significant differences” results for which a statistical test yields a probability of less than 1 percent that the observed difference arose by chance (i.e., that the true difference is 0). This corresponds to the observation that the hypothesized value of 0 is outside of the 99 percent confidence interval for the observed difference. In other words, the probability of observing a difference this large by chance is less than 1 percent.
Case 2:13-cv-00193 Document 600-1 Filed in TXSD on 09/16/14 Page 13 of 122

12
than the rate of NO MATCH for Anglo voters. The rate of NO MATCH for Hispanic
voters is 195% higher than for Anglo voters. (See Table VI.1.)
24. Analysis of the NO MATCH list using the Catalist racial classification estimates
shows that 3.6 percent of registered Anglos do not match to a corresponding record in a
state or federal identification database. By comparison, an estimated 7.5 percent of
registered Blacks and 5.7 percent of registered Hispanics do not match. Using the
Catalist estimates, the rate of NO MATCH for black voters is 108% higher than the rate
of NO MATCH for Anglo voters. The rate of NO MATCH for Hispanic voters is 58%
higher than for Anglo voters. (See Table VI.2.)
25. Analysis of the NO MATCH/NOT EXEMPTION ELIGIBLE list using ecological
regression and Census racial data shows that 1.8 percent of registered Anglos do not
match to a corresponding record in a state or federal identification database, nor in a
Federal disability database. By comparison, an estimated 6.4 percent of registered Blacks
and 5.3 percent of registered Hispanics do not match in the relevant databases. (See Table
VI.3.A, first column.) Analysis of the NO MATCH/NOT EXEMPTION ELIGIBLE list
using the Catalist racial classification estimates indicates that 3.2 percent of registered
Anglos do not match to a corresponding record in a state or federal identification
database, nor in a Federal disability database. By comparison, an estimated 6.3 percent
of registered Blacks and 5.2 percent of registered Hispanics do not match in the relevant
databases. (See Table VI.3.B.)
Case 2:13-cv-00193 Document 600-1 Filed in TXSD on 09/16/14 Page 14 of 122

13
26. Further analyses validate these findings and test the robustness of the results to
alternative specifications of the pool of registered voters and the classification of
individuals’ races. The pattern of results remains consistent across these alternate
analyses, with each analysis showing statistically significant racial disparities in rates of
matching of records in TEAM to records in acceptable SB 14 photo ID databases
between Anglo registered voters and Black and Hispanic registered voters. (See Section
VII.)
27. I also examine voting and registration patterns of racial groups in the State of Texas
from 2006 to 2012 to determine whether racial differences in participation exist currently
or historically. I examine three data sets: TEAM data merged with Catalist racial
classifications, the Current Population Survey (CPS) reports on voting and registration
rates, and aggregate data on registration and voting and racial composition of
populations. All three data sets show that Anglos in the State of Texas register and vote
at higher rates than minorities. (See Section VIII.)
IV. Data and Sources
A. Terminology
28. TEAM Database. The official list of registered voters in the State of Texas,
maintained by the Texas Secretary of State. The Texas Election Administration
Case 2:13-cv-00193 Document 600-1 Filed in TXSD on 09/16/14 Page 15 of 122

14
Management (TEAM) System includes registered voter information such as name,
address, date of birth, gender, and past elections in which the person voted.
Identification Database. A state or Federal list of individuals with a given form of
identification, such as a Driver License or Passport, which includes names, addresses, and
other information about the individuals.
Disability Database. A Federal list of individuals with a given disability status, which
includes names, addresses, and other information about the individuals.
Record. A row in a database containing the information in that database for a specific
person. Also called a case.
Field. A column in a database corresponding to information about each of the records in
the database, such as first names or dates of birth.
Identifier. A field or constructed combination of fields for a particular record in a
database that can be used to identify another record likely to be the same person in a
different database.
Unique Identifier. An identifier that is unique to a given individual.
Record linkage. A process whereby a given record in one database is matched to one or
more records in other databases using identifiers for individual records. Also called
matching.
Match. A record in a database found to have at least one matching identifier in a
separate database.
No Match. A record for which no match is found in other databases.
Sweep. A search conducted of all records in one database using a specified identifier for
matching records in another database.
Case 2:13-cv-00193 Document 600-1 Filed in TXSD on 09/16/14 Page 16 of 122

15
MATCH List. Records for all currently registered voters in TEAM for which at least one
valid matching record is found in an identification database on at least one sweep, and
which are not matched to any deceased DPS record.
NO MATCH List. Records for all currently registered voters in TEAM which do not list
the voter as having already applied for and received the disability exemption and for
which no valid matching record is found in any identification database on any sweep, and
which are not matched to any deceased DPS record.
NO MATCH/NOT EXEMPTION ELIGIBLE List. Records for all currently registered
voters in TEAM which do not list the voter as having already applied for and received the
disability exemption and for which no valid matching record is found in any
identification or disability database on any sweep, and which are not matched to any
deceased DPS record.
NO MATCH/NOT EXEMPTION ELIGIBLE/NOT AGE VOTE-BY-MAIL ELIGIBLE
List. Records for all currently registered voters in TEAM which do not list the voter as
having already applied for and received the disability exemption, for which no valid
matching record is found in any identification or disability database on any sweep, and
which do not establish that the voter is qualified to vote by mail on account of age, and
which are not matched to any deceased DPS record.
B. Data Used in the Matching Process
State of Texas Databases
Case 2:13-cv-00193 Document 600-1 Filed in TXSD on 09/16/14 Page 17 of 122

16
29. Counsel for the Department of Justice provided me with voter registration and
identification databases from the State of Texas.
30. Texas Voter Registration Data: Texas voter registration records were extracted from
the TEAM system on January 15, 2014. That date serves as the date of the election for
purposes of this analysis. Any form of acceptable SB 14 photo ID that is unexpired on
that date or expired no earlier than sixty days prior to that date is deemed valid under SB
14 for purposes of this analysis.
31. State of Texas Photo ID Data: Records were extracted from the Texas Department
of Public Safety (DPS) databases for Driver Licenses (DL), Personal State Identification
Cards (PID), Licenses to Carry Concealed Handguns (CHL), and Election Identification
Certificates (EIC). The DPS DL, PID, CHL, and EIC databases also include a field that
indicates whether an individual may be deceased. The algorithm matches TEAM records
to identification records for each specific form of ID separately. The DPS data
addressed in this report includes records that were provided in February 2014, as well as
records which I received in late July, 2014, but which I should have been provided in
February. It is my understanding that these records were not initially extracted because
of a coding error.
Federal Databases
Case 2:13-cv-00193 Document 600-1 Filed in TXSD on 09/16/14 Page 18 of 122

17
32. I created a version of the TEAM database with identifiers used in matching already
formatted to facilitate matching to Federal databases. I developed a step-by-step
explanation of the algorithm, including data preparation steps, and developed model
computer code in STATA and SQL to guide the matches of the Federal databases.
Counsel for the United States conveyed these files to staff at the United States
Citizenship and Immigration Service, the United States Department of Defense, the
United States Department of State, the United States Department of Veterans Affairs, and
the Social Security Administration. I had no direct access to Federal databases.10
C. Databases Used in Data Analyses
33. I analyze individual and aggregate-level data to estimate the relationship between
race and probability of possession of ID accepted under SB 14. Individual-level
analyses rely on TEAM data matched to identification and disability databases and
Catalist racial classifications.
34. Aggregate-level analyses in Section VI use the sum of the number of Matched and
Not Matched voters in each Census Block Group (BG). I calculate the percent of
registered voters in each BG that are on the NO MATCH list. Block Group is the lowest
level of aggregation for which Citizen Voting Age Population (CVAP) is released by the
Census. I correlated the percent NO MATCH with the percent of each racial group that
10 Staff at each agency involved in the matching process completed a declaration documenting the steps that they took in completing the matches. Those declarations are provided as exhibits in the Appendix.
Case 2:13-cv-00193 Document 600-1 Filed in TXSD on 09/16/14 Page 19 of 122

18
are adult citizens (CVAP) or are adults (VAP) at the BG level. The correlation allows me
to estimate the share of the CVAP or VAP for each racial group that lacks acceptable SB
14 photo ID. The correlations and ecological regressions reported in Section VI are of
the NO MATCH and MATCH data aggregated to the BG level for the CVAP.11 (See
Tables VI.1, VI.3.A, VI.4.A.) Similar results hold for VAP, but CVAP is a closer
approximation to the eligible electorate. I also tested the robustness of the analysis at the
Census Tract level (a higher level of aggregation than BG), and found no substantive or
statistical difference in the results. I report results at the BG level.
35. Aggregate analyses in Section VII on rates of turnout and registration are at the
Voting Tabulation District (VTD) level as that is the level at which registration and
voting statistics are reported. These analyses use Voting Age Population (VAP) from
the Census Enumeration and Citizen Voting Age Population (CVAP) from ACS.12
Voting and Registration Data
36. Analyses of historical voting and registration patterns use aggregate data from the
Texas Legislative Council, a nonpartisan State legislative agency. Voting and
registration data at the VTD level come from the website of the Texas Legislative
11 In the case of VAP, I used the Census figures for the VAP for each group at the BG level. In the case of CVAP, I use ACS data aggregated to the BG. 12 For Block Groups that contain multiple VTDs, I apportion the CVAP of a racial group in a Block Group based on the percent of the VAP of that group in a Block Group that resides in each VTD.
Case 2:13-cv-00193 Document 600-1 Filed in TXSD on 09/16/14 Page 20 of 122

19
Council.13 Individual data on voter participation history in particular elections is also
used from the TEAM database.
Census Data
37. The Population and Voting Age Population in Voting Tabulation Districts (VTDs)
are collected by the 2010 Census Enumeration and come from the website of the Texas
Legislative Council.14
38. Aggregate data on the Citizen Voting Age Population (CVAP), at the Census Block
Group and VTD level, come from the five-year average of the American Community
Survey (ACS), 2008-2012.15
39. I analyze Census data on the racial composition of the electorate and the rate with
which registered voters are deemed to possess acceptable SB 14 identification. I perform
Ecological Regression at the Block Group (BG) level to measure the rate of NO MATCH
of each racial group.
40. The Census Bureau conducts the Voting and Registration supplemental to the CPS
each November following federal elections. I examine the 2006, 2008, 2010, and 2012
CPS.16
13 ftp://ftpgis1.tlc.state.tx.us/elections/ 14 ftp://ftpgis1.tlc.state.tx.us/2011_Redistricting_Data/VTDs/ 15 See http://www.census.gov/acs/www/data documentation/2012 release/
Case 2:13-cv-00193 Document 600-1 Filed in TXSD on 09/16/14 Page 21 of 122

20
Catalist Database
41. The United States contracted with Catalist, LLC, to obtain additional data on voter
registration records in the State of Texas. I use Catalist data (i) to test the robustness and
validity of findings, (ii) to obtain estimated classifications of the race of individuals
(estimates that are based in part on local area Census demographics and frequencies of
names), (iii) to examine voting history of individuals, and (iv) to obtain geocoding of
each registration record and Catalist deadwood, deceased, and NCOA information.
42. Catalist maintains data on voter registrations and vote history. Catalist retains the
TEAM VUID, which permits linkage between the Catalist data and the TEAM data.
43. Catalist augments official voter registration data with indicators regarding whether a
voter has moved as reported through the National Change of Address (NCOA) data from
the United States Postal Service, information on whether a voter is deceased using data
from the Social Security Administration and private vendors, and information identifying
potentially obsolete records (or deadwood) based on factors including participation in
past elections. To analyze the validity and robustness of findings, I use the Catalist flags
for NCOA, deceased, and deadwood records to construct subsets of the pool of
registration records.
16 http://www.census.gov/hhes/www/socdemo/voting/publications/p20/index.html
Case 2:13-cv-00193 Document 600-1 Filed in TXSD on 09/16/14 Page 22 of 122

21
44. Catalist provides a classification of the race of each individual in the TEAM
database and a score for the confidence in that classification. Catalist’s race
classification is based on the frequency of specific last names in the population and the
frequency of racial groups in local areas (Census block groups), and is a refinement on
the area-based estimates underpinning the ecological regression analysis frequently used
in Voting Rights Act cases.
45. Catalist data are widely used in academic research on registration and voting and
have been vetted for publication in peer-reviewed journals. Catalist data on
demographic characteristics of the electorate, including age, gender, and race, have been
vetted and published in peer-reviewed journals.17 Academic researchers use the Catalist
database to identify the population of registered voters in the US and to conduct random
sample surveys of the population of registered voters and experimental research on voter
participation.18
17 See for example, Ansolabehere, Stephen, and Eitan Hersh. "Validation: What big data reveal about survey misreporting and the real electorate." Political Analysis (2012): mps023. Ansolabehere, Stephen, Eitan Hersh, Kenneth Shepsle. "Movers, Stayers, and Registration: Why Age is Correlated with Registration in the US." Quarterly Journal of Political Science 7, no. 4 (2012): 333-363.Ansolabehere, Stephen, and Eitan Hersh. "Gender, Race, Age and Voting: A Research Note." Politics and Governance 1, no. 2 (2013): 132-137. Garcia-Castañon, Marcela, Alison D. Rank, and Matt A. Barreto. "Plugged in or tuned out? Youth, race, and Internet usage in the 2008 election." Journal of Political Marketing 10, no. 1-2 (2011): 115-138. 18 See, for example, Nickerson, David W., and Todd Rogers. "Political Campaigns and Big Data." The Journal of Economic Perspectives 28, no. 2 (2014): 51-73. Dale, Allison, and Aaron Strauss. "Don't forget to vote: Text message reminders as a mobilization tool." American Journal of Political Science 53, no. 4 (2009): 787-804. Bennion, Elizabeth A., and David W. Nickerson. "The Cost of Convenience An Experiment Showing E-Mail Outreach Decreases Voter Registration." Political Research Quarterly 64, no. 4 (2011): 858-869. Ansolabehere, Stephen, and Eitan Hersh. "Validation: What big data reveal about survey misreporting and the real electorate." Political Analysis (2012).
Case 2:13-cv-00193 Document 600-1 Filed in TXSD on 09/16/14 Page 23 of 122

22
46. I verify the validity of the inferences for the full Catalist analysis by examining the
subset of records in Catalist with very high confidence in the racial classification.
Catalist has very high confidence in areas where there is a fairly homogeneous population
and for individuals with sufficiently distinctive names.
V. Matching Process
A. Description of the Matching Process
47. The matching process conducts record linkage for individual records in TEAM to
any record in each database corresponding to a form of identification accepted under SB
14 or in a database reflecting those eligible to apply for the disability exemption. The
matching algorithm proceeds in four parts.
Database Preparation. Databases are prepared and standardized.
Creation of Identifiers. Identifier values used to link records in one database to
records in another database are constructed by combining multiple individual
fields.
Record Linkage and Matching. One-to-many matches are conducted between the
databases. That is, the algorithm matches each unique identifier on the TEAM
database to all records on the identification database that have the corresponding
value of the identifier.
Case 2:13-cv-00193 Document 600-1 Filed in TXSD on 09/16/14 Page 24 of 122

23
Data Gathering. Appended to the TEAM data are fields indicating every match
found of a record on the TEAM database to a record on a state or Federal
identification database or Federal disability databases.
48. Each of the four parts is divided into multiple stages, which are in turn divided into
concrete steps. Detailed procedures for the implementation of the algorithm were
prepared and presented to all parties in the litigation and to the Federal agencies. These
memorandums provide detailed, step-by-step documentation of the matching process.
Rather than reproduce the detailed steps here, the memorandums presented to all parties
and the Federal agencies are appended to this report in the appendix. This section
describes the stages of the Matching Process at a general level.
49. The result of this methodology is to produce a MATCH list, a NO MATCH list, and
a NO MATCH/NOT EXEMPTION ELIGIBLE list, as described above.
B. Features of the Matching Algorithm
50. The first phase of the matching algorithm, Database Preparation, standardizes the
coding of database fields to facilitate matching. Different databases store the fields in
different ways. For example, Gender is coded 1 or 0 in some databases and M or F in
others. The database preparation in the algorithm standardizes the coding of names by
removing spaces, hyphens, and other characters; standardizes dates of birth and gender
codes, and identifies invalid or missing values (such as 111111111 for Social Security
Case 2:13-cv-00193 Document 600-1 Filed in TXSD on 09/16/14 Page 25 of 122

24
Numbers). Prior research has shown that standardization of fields, removal of duplicate
cases, and definition of missing or invalid values in each field greatly improves the
quality of matching.19
51. The second part of the algorithm develops multiple identifiers for purposes of record
linkage. This general approach is widely used in the field of record linkage and database
matching, especially in health research and marketing, and has been determined by past
studies to yield a very high rate of correct matches.20 The algorithm builds identifiers by
combining fields related to Address, Date of Birth, Gender, Name, Social Security
Number, and Texas Driver License Number.
52. In total 13 different identifiers were constructed in the TEAM database and in the
corresponding State and Federal databases.21 Each identifier corresponds to a particular
combination of fields. For example, Combination A consists of First Name, Last Name,
19 William E. Winkler, “Methods for Evaluating and Creating Data Quality,” Information Systems 29 (October, 2004), 531-550. http://www.sciencedirect.com/science/article/pii/S030643790400002X Max G. Arellano and Gerald I. Weber, “Issues in Identification and Linkage of Patient Records Across an Integrated Delivery System,” Journal of Health Care Information 12, no. 3 (1998): 43-52 http://sce.umkc.edu/~leeyu/Mahi/medical-data5.pdf 20 See Simon, Michael S., Beth A. Mueller, Dennis Deapen, and Glenn Copeland. "A comparison of record linkage yield for health research using different variable sets." Breast cancer research and treatment 89, no. 2 (2005): 107-110. Sweeney, Latanya, “Computational Disclosure Control for Medical Microdata: The Datafly System, Record Linkage Techniques 1997, Chaper 11. Pp. 442-453. Sweeney, Latanya, Matching Known Patients to Health Records in Washington State Data. Harvard University. Data Privacy Lab. 1089-1. June 2013. 21 For the Department of State matches of passport holders, additional identifiers were developed to address specific features of the way that the Passport database stores name information. Those additional identifiers are discussed in a declaration from DOS, which is attached in the appendix.
Case 2:13-cv-00193 Document 600-1 Filed in TXSD on 09/16/14 Page 26 of 122

25
Date of Birth, Gender, Street Number, and 5-digit ZIP Code. A sample version of
Combination A for a man named John Smith, born on January 1, 1960, and living at 100
Main Street in the ZIP Code 78610 would be JOHNSMITH01011960110078600. A
chart of the identifiers created for matching is provided below in Table V.1. Appendix
Tables A.V.1-A.V.2 provide statistics on the completeness and uniqueness of
combinations of fields.22
22These tables were not revised after receiving the 3.1 million supplemental DPS records. They correspond to the data extracted on January 15, 2014.
Case 2:13-cv-00193 Document 600-1 Filed in TXSD on 09/16/14 Page 27 of 122

26
Table V.1. Combinations of Fields Used as Matching Identifiers
Combination
Code PRIMARY MATCHES
A First Name + Last Name + Gender + DOB +
Residential ZIP + Residential Street Number
B Last Name + Gender + DOB + Residential ZIP + Residential Street
Number
C Gender + DOB + Residential ZIP + Residential Street Number
D First Name + Last Name + Date of Birth +
Residential ZIP + Residential Street Number
E First Name + Last Name + Gender +
Residential ZIP + Residential Street Number
F First Name + Last Name + Gender + DOB
M Texas Driver License Number (where available)
SECONDARY MATCHES
G First Name + Middle Initial + Last Name + DOB
H Last 4-Digit SSN + DOB + Residential ZIP
I Last 4-Digit SSN + First Name + Last Name + DOB
K First Name + Last Name 1 + Middle Initial + DOB
L First Name + Last Name 2 + Middle Initial + DOB
SSN 9-Digit Social Security Number
Case 2:13-cv-00193 Document 600-1 Filed in TXSD on 09/16/14 Page 28 of 122

27
53. The third stage of the process, the Record Linkage and Matching phase, conducts
one-to-many matches23 and performs multiple sweeps to guard against false negatives
(non-matches that should be matched). An example of false negatives that this approach
guards against is a typographical error in the spelling of a person’s name as recorded on
TEAM but not in the DPS driver license database. Such a typo would create an
inconsistency between TEAM and DPS if matches were conducted only on identifiers
that included name. In addition to searching on identifiers that contain name fields the
algorithm searches on identifiers constructed from combinations that do not include name
elements, such as Date of Birth, Gender, Address, and Social Security Number. The
algorithm will match the record on the identifiers that do not contain each of these
categories of fields, thus avoiding non-matches due to typographical errors, nicknames,
missing fields, and other inconsistencies between databases. A record is determined to
have found a match if a given identifier in TEAM is identical to at least one
corresponding identifier in an identification database. The frequencies of matches of
individual records in TEAM to specific identifiers in each of the state and federal
23 As used here, a “one-to-many” match means that for each TEAM record, a match will only be attempted for a particular identifier when that identifier is unique to a single TEAM record. However, that unique identifier will be deemed to have matched to any identical identifier in an identification or disability database, even if the identifier is not unique on the identification or disability database. As an example, consider a simplified identifier not used here: First Name + Last Name + Date of Birth. If there are two people named JOHN SMITH with a birth date of January 1, 1960 in TEAM, no match is attempted on First Name + Last Name + Date of Birth because the TEAM identifier is not unique. This guards against false positives. On the other hand, if there is only one JOHN SMITH in TEAM born on January 1, 1960, and there are two JOHN SMITHs born on January 1, 1960 in the DPS driver license database, the match will be attempted, and the TEAM record is considered to have matched. All that matters is that the registered voter John Smith is deemed to hold a driver license—there is no need to distinguish between the two DPS records.
Case 2:13-cv-00193 Document 600-1 Filed in TXSD on 09/16/14 Page 29 of 122

28
identification and disability databases are presented in the appendix. See Appendix
Tables A.V.3 to A.V.5.
54. As shown in the chart below, the algorithm conducts two sorts of sweeps through the
data to find matching records. The Primary Sweeps match on Combinations A-F and M,
and are run on all TEAM records. The Secondary Sweeps are conducted on
Combinations G – L for the TEAM records not matched in the Primary Sweeps. For
Federal databases, the Primary Sweeps are run against all qualifying Federal records with
Texas addresses, while the Secondary Sweeps are run both against Texas-only records, as
well as against the nationwide universe of the relevant Federal dataset.
Case 2:13-cv-00193 Document 600-1 Filed in TXSD on 09/16/14 Page 30 of 122

29
Matching Combinations Texas DPS Databases
Primary Sweeps (All TEAM records)
Combination A: First name + Last name + Gender + DOB + Street number + ZIP Combination B: Last name + Gender + DOB + Street number + ZIP Combination C: Gender + DOB+ Street number + ZIP Combination D: First name + Last name + Street number + ZIP Combination E: First name + Last name + Gender + Street number + ZIP Combination F: First name + Last name + DOB + Gender Combination M: Texas Driver License Number
Secondary Sweeps (TEAM records with no primary match)
Combination G: First name + Last name + Middle Initial + DOB Combination H: DOB + ZIP + SSN4 Combination I: First name + Last name + DOB + SSN4 Combination K: First name + Last name 1 + Middle Initial + DOB Combination L: First name + Last name 2 + Middle Initial + DOB24 SSN: 9-digit Social Security Number
Federal Identification and Disability Databases
Primary Sweeps (All TEAM records against Federal records with a Texas address)
Same as primary sweeps for DPS databases, except for Texas Driver License Number (Combinations A-F)
Secondary Sweeps (TEAM records with no primary match against Federal records with a Texas address)
Same as secondary sweeps for DPS databases (Combinations G-L and SSN)
Nationwide Sweeps (TEAM records with no primary or secondary match against nationwide Federal records)
All sweeps without address criteria (Combinations F, G, I, K, L, and SSN)
24 “Last name 1” is the first half of a hyphenated last name, and “Last name 2” is the second half of a hyphenated last name. Combinations K and L in TEAM are each matched against Combination G, Combination K, and Combination L in the identification and disability databases for a total of six matching sweeps.
Case 2:13-cv-00193 Document 600-1 Filed in TXSD on 09/16/14 Page 31 of 122

30
55. In the last phase of the matching process, the Data Gathering phase, the results of all
matching sweeps are recorded for each individual TEAM record. This stage also appends
indicators of deceased records from the Texas DPS data to TEAM. In the analysis
performed after receiving the supplemental 3.1 million records, I proceeded as follows.
For the complete DPS list of drivers license holders and state ID holders (including those
both from the initial production and the supplemental production), I subset the complete
list to anyone with a deceased flag in the database. This subset consists of all records
with deceased flags, including records that are expired or that have card statuses
indicating that the license has been surrendered and, thus, cannot be used for voting. I
then performed the same matching algorithm between this list and TEAM as I did for IDs
in DPS. Similarly I used the same process to match deceased records from the CHL list
to TEAM. Any TEAM record that matched on any indicator to a deceased flag in DPS or
CHL was treated as deceased. These records are not treated as registered voters in
subsequent analysis. In my initial report, I only treated as deceased TEAM records that
matched to a valid DPS record that was marked as deceased. This methodology could
only remove deceased voters from the MATCH List. The additional step undertaken
here—examining the entire universe of DPS records (both valid and invalid for SB 14
purposes) to locate deceased records—uses all possible available information from DPS
to identify likely deceased records on TEAM so that they can be removed from either the
MATCH List or the NO MATCH List.
Case 2:13-cv-00193 Document 600-1 Filed in TXSD on 09/16/14 Page 32 of 122

31
56. The algorithm developed for DOJ in the present case goes beyond the matching
algorithm developed for the expedited Section 5 proceedings in State of Texas v. Holder
in which I also testified on behalf of the United States.25 First, the TEAM database is
now matched to all relevant state and federal databases. In the section 5 proceeding,
time constraints prevented an assessment of federal identification and disability data.
Second, the algorithm ensures that persons that DPS considers to be dead are not
included on the NO MATCH list. Instead, deceased voters are identified after matching
has occurred.26 Third, by using multiple identifiers, the algorithm is developed to be
sensitive to variations in names, such as nicknames and compound names, to
typographical errors, and to missing information. Fourth, by matching on identifiers
constructed from a larger number of categories of fields (three or four rather than two),
the algorithm is more precise in determining which records link and more exhaustive in
the search for linkages.
57. The data analysis presented in the Validation section of this report examines the
robustness of the results to alternative racial classifications.
25 The Court in Texas v. Holder chose not to rely on any of the expert testimony presented. 888 F. Supp. 2d 113, 134-138 (D.D.C. 2012). 26 Where a TEAM record has matched to a DPS record that the State of Texas has marked as deceased, recording this information allows matched records for dead people to be excluded from further analysis of the population of voters actually affected by SB 14’s requirements.
Case 2:13-cv-00193 Document 600-1 Filed in TXSD on 09/16/14 Page 33 of 122

32
C. MATCH , NO MATCH and NO MATCH/NOT EXEMPTION ELIGIBLE Lists
Match Rates
58. The implementation of the algorithm developed for the United States in this case
matched the entire TEAM database to 10 different state and federal databases. Table
V.2 below lists the number of records in TEAM that matched to each state or Federal
database using that algorithm, as well as the percent of TEAM records overall and in each
racial group that match to each identification or disability database. (Note: This table
corresponds to all matched TEAM records, before removal of TEAM records indicated as
deceased by DPS, and shows the total rate of matching between TEAM and each form of
identification and database.)
59. The most commonly held form of identification is a State of Texas Driver License,
followed by a United States Passport. Just over 87.5 percent of records in TEAM
matched to the DPS Driver License list, while 42.3 percent of records in TEAM matched
to the DOS passport database. The next most common form of ID is a DPS Personal (or
State) ID, held by 9.4 percent of those in TEAM.
60. Table V.2 shows that the rates with which records match to the databases varies with
race. The percentage of records on TEAM matched to Driver Licenses and Passports is
much higher for Anglos than for Blacks and Hispanics. 91.3 percent of Anglos on
TEAM match to a record on the DPS Driver License database, compared with 78.1
percent for Blacks and 82.2 percent for Hispanics. 45.5 percent Anglos on TEAM match
Case 2:13-cv-00193 Document 600-1 Filed in TXSD on 09/16/14 Page 34 of 122

33
to a record on the DOS passport database, compared with 24.7 percent for Blacks and
37.7 percent for Hispanics.
Table V.2. Number of Matches of TEAM Records to State and Federal Databases Overall and By Racial Group, using Catalist Racial Estimates (Percent of TEAM Records that Match to a Given ID or Disability Database) Database Race State of Texas ID Databases
White Black Hispanic Other All
Driver License
7,567,441 (91.3%)
1,343,250 (78.1%)
2,511,871 (82.2%)
448,042 (90.9%)
11,872,604 (87.5%)
Personal ID 425,399 (5.1%)
315,682 (18.4%)
499,103 (16.3%)
29,429 (5.1%)
1,269,613 (9.4 %)
Concealed Handgun License
588,087 (7.1%)
57,129 (3.3%)
72,953 (2.4%)
14,839 (3.0%)
733,008 (5.4%)
EIC 69 43 51 0 163 Federal ID Databases
DOS 3,776,207 (45.5%)
424,682 (24.7%)
1,151,608 (37.7%)
378,666 (76.8%)
5,731,163 (42.3%)
DOD 427,191 (5.2%)
81,688 (4.8%)
116,460 (3.8%)
13,015 (2.6%)
638,354 (4.7%)
USCIS 106,051 (1.3%)
45,005 (2.6%)
373,576 (12.2%)
210,454 (42.7%)
735,086 (5.4%)
VHA (VIC) 186,695 (2.3%)
49,179 (2.9%)
57,635 (1.9%)
2,496 (0.5%)
296,005 (2.2%)
Federal Disability Databases
SSA: Disability
419,065 (5.1%)
167,980 (9.8%)
202,368 (6.6%)
14,925 (3.0%)
804,338 (5.9%)
VBA: Disability
118,883 (1.4%)
31,952 (1.9%)
35,743 (1.2%)
1,938 (0.4%)
188,516 (1.4%)
Case 2:13-cv-00193 Document 600-1 Filed in TXSD on 09/16/14 Page 35 of 122

34
61. The rate at which records on TEAM match to DPS Personal ID or USCIS databases
is higher for minorities than for Anglos. Of Anglos on TEAM, 5.1 percent match to
records on the DPS Personal ID database and 1.3 percent match to the USCIS database of
holders of certificates of citizenship and naturalization. Of Blacks on TEAM, 18.4
percent match to the Personal ID database and 2.6 percent match to the USCIS database.
Of Hispanics on TEAM, 16.3 percent match to the Personal ID database and 12.2 percent
match to the USCIS databases. However, both the DPS Personal ID and USCIS
Certificates of Citizenship and Naturalization are much less commonly held than Driver
Licenses and Passports.
Sizes of the MATCH, NO MATCH and NO MATCH/NOT EXEMPTION ELIGIBLE
lists
62. Of the 13,564,416 records in the TEAM database, 12,653,563 matched to at least
one record corresponding to acceptable SB 14 photo ID issued by the State of Texas, and
6,326,122 records matched to at least one record corresponding to acceptable SB 14
photo ID issued by the Federal government. (See Table V.3.A) Most of the records
matched to the Federal databases also matched to a State of Texas identification database.
No valid matching record was found on any of the state or Federal identification
databases and no disability exemption was granted for 622,527 records on the TEAM
database, approximately 4.6 percent of all records in TEAM. No matching record was
found for 548,387 records in the TEAM database to a state or Federal identification
database or to a Federal disability database. (See Table V.4.A) These numbers include
Case 2:13-cv-00193 Document 600-1 Filed in TXSD on 09/16/14 Page 36 of 122

35
TEAM records that can be matched to DPS records flagged as deceased, as discussed in
paragraph 55.
63. Accounting for matched voters that DPS data indicate as deceased from the number
of records in the TEAM database reduces the universe of registered voters from
13,564,416 to 13,487,594. I define this set, which removes from further analysis voters
that the State of Texas data from DPS indicate to be deceased, as the Baseline Universe
of Registered voters. After removing TEAM records that matched to a deceased record,
and from TEAM overall, leaves 608,470 voters on the NO MATCH list, out of a the
13,487,594 records that I describe as the Baseline Universe on TEAM. Again, this
means that 4.5 of Texas registered voters for whom there is no indication in a state
database of being deceased are on the NO MATCH list. Likewise, there are 534,512
records on the NO MATCH, NOT EXEMPTION ELIGIBLE List, representing 4.0
percent of the 13,487,594 records in TEAM that were not indicated as deceased on any
DPS record.
VI. Results: Analysis of Racial Disparities
64. This section analyzes how the rate of non-matched records between TEAM and valid
SB 14 ID databases varies across racial groups.
Case 2:13-cv-00193 Document 600-1 Filed in TXSD on 09/16/14 Page 37 of 122

36
A. Census Racial Data and Possession of ID
65. The American Community Survey (ACS) conducted by the Census Bureau provides
estimates of the racial composition of the electorate. Using the 5-year average of the
survey from 2008 to 2012, the ACS provides estimates of the CVAP of various racial
groups at the block group level and tract level.
66. I aggregated the Match and No Match lists (which remove records indicated by DPS
as deceased) to the block group level, the lowest geographic level at which Census
reports ACS CVAP numbers.27 Within each block group, I computed counts of the
numbers of registered voters and the number of registered voters who did not match any
identification database and the number of registered voters who were matched to at least
one identification database. I then computed the percentage of registered voters in each
block group who were not matched to any record.
67. I used ecological regression and homogeneous block group analyses28 to estimate the
percentage of Black citizens of voting age, Hispanic citizens of voting age, and Anglo
citizens of voting age for whom a matching record to an identification database was
found. Ecological regression estimates the relationship between Percent No Match and
Percent of CVAP who are Anglo, Black, or Hispanic, enabling me to estimate the percent
of each group who match to an ID database. Homogeneous block group analysis
27 I conducted similar analyses at the Census tract level and discovered the same pattern of results. Because Block Group is a lower level of aggregation I present that here. 28 In other contexts data are at the precinct level, so homogeneous block group analysis is also called homogeneous precinct analysis.
Case 2:13-cv-00193 Document 600-1 Filed in TXSD on 09/16/14 Page 38 of 122

37
examines the subset of block-groups where all or almost all of the adult citizens are of
one race—in this analysis, at least 80 percentage of a given race. Within such racially
homogeneous areas, I then compute the percent of registered persons for whom a
matching identification record was found or not found; this enables me to estimate the
percentage of that group who has (or does not have) an SB 14 ID. Both ecological
regression analysis and homogeneous block group analysis are well-established statistical
procedures relied upon in voting rights cases, where they are often used to measure
racially polarized voting and cohesiveness of voting of racial groups.
68. Table VI.1 presents the ecological regression and homogenous block group analysis
estimates of the rate with which No Match was found among each racial group. The
ecological regression estimates indicate that no match between TEAM and a state or
Federal identification database was found for approximately 2 percent of Anglos, 8
percent of Blacks, and 6 percent of Hispanics. The gross percentage point difference
between the Black and Anglo rate of non-matching, then, is 6 percentage points, and the
difference between Hispanics and Anglos is approximately 4 percentage points. In other
words, Hispanics are three times as likely as Anglos to be on the NO MATCH list, and
Blacks are four times as likely as Anglos to be a NO MATCH. (The percent difference in
rates of non-matching is reflected in the Relative Rate of NO MATCH in Table VI.1 and
subsequent tables.)
69. The homogeneous block group analyses in Table VI.1 are similar to the ecological
regression estimates. 3.1 percent of Anglo registered voters were estimated to have no
Case 2:13-cv-00193 Document 600-1 Filed in TXSD on 09/16/14 Page 39 of 122

38
matching identification record on a state or Federal database. That figure was 11.5
percentage points among Blacks and 8.6 points among Hispanics. In other words, the
difference in the rate of NO MATCH equaled 8.4 points between Blacks and Anglos and
5.5 points between Hispanics and Anglos. Again, in the homogeneous blocks, Hispanics
are approximately two and a half times as likely as Anglos, and Blacks are almost four
times as likely as Anglos to not match to a valid record in a qualifying identification
database.
70. The results from the analysis of the homogeneous block groups and the ecological
regressions are highly unlikely to have arisen by chance. The observed differences across
the groups are statistically significant at the confidence levels generally used by social
scientists.
B. Catalist Racial Data and Possession of ID
71. Analysis of individual level data using the Catalist classification of race yields
similar results to the aggregate analyses presented in part VI.A. The Baseline Universe
of Registered Voters, which consists of all currently-registered voters in TEAM – after
removing those who matched a record marked as deceased in a DPS ID file – has
13,487,594 records. Of these, 8,246,016 are classified as Anglo according to Catalist’s
estimates; 1,707,769 are Black; 3,042,497 are Hispanic; and 491,312 are Other Races.
(See Table VI.2.)
Case 2:13-cv-00193 Document 600-1 Filed in TXSD on 09/16/14 Page 40 of 122

39
72. The rate of non-matches between TEAM and identification databases varies by race.
Of records identified as Anglo in the Baseline Universe of Registered Voters, 3.6 percent
had no matching record in state or Federal identification databases. By comparison, no
matching records were found for 7.5 percent of people identified as Black and 5.7 percent
of people identified as Hispanic. (See Table VI.2.)
73. The differences in rates of matching and non-matching across racial groups are
statistically significant at the confidence levels normally used by social scientists. The
difference between Blacks and Anglos in the rate of non-matching is 3.9 percentage
points. Such a difference is highly unlikely to have arisen by chance given the degree of
precision of the estimates.29 Likewise, the difference between Anglos and Hispanics in
the rate of non-matching is 2.1 percentage points, which is highly unlikely to have arisen
by chance.30 Using the Catalist racial classification, Blacks are 108 percent more likely
to be a NO MATCH and Hispanics are 58 percent more likely to be a NO MATCH.
C. Eligibility for Exemption and Vote-by-Mail
74. The analysis in Table VI.2 does not account for the fact that those with a Federally-
determined disability may qualify and apply for an exemption. Also, those over 65 may
vote by mail without showing ID, but must still show ID if they vote at a polling place.
29 The 99 percent confidence interval for that difference in proportions is +/- 0.1 percentage points, so the differences are statistically different from 0. 30 I use a 99 percent confidence level. That is the probability of observing a difference this large by chance is less than 1 percent.
Case 2:13-cv-00193 Document 600-1 Filed in TXSD on 09/16/14 Page 41 of 122

40
75. Table VI.3 parallels the analysis in Table VI.2, but classifies as MATCHES records
for which the voter could apply for the disability exemption or vote by mail because of
age. Version VI.3.A presents the ecological regression results for this analysis using
Census’ ACS data, and VI.3.B presents the results of the analysis using Catalist racial
data. The first column of each table shows the relationship between Race and percent on
the NO MATCH/NOT EXEMPTION ELIGIBLE. That list consists of those not
matched to a state or Federal identification database or to a Federal disability database.
The second column of each table shows the relationship between Race and percent on the
NO MATCH/NOT AGE VOTE-BY-MAIL ELIGIBLE. That list consists of those not
matched to a state or Federal identification database and under 65 years of age. The
third column of each table shows the relationship between Race and percent on the NO
MATCH/ NOT EXEMPTION ELIGIBLE/NOT AGE VOTE-BY-MAIL ELIGIBLE.
That list covers people not potentially exempt for reasons of disability, who are under 65,
and also not matched to a state or Federal ID. For this analysis the Baseline of 13,487,594
records is used as the pool of registered individuals.
76. The ecological regression analysis estimates that 1.1 percent of Anglos were NO
MATCH/NOT EXEMPTION ELIGIBLE/NOT AGE VOTE-BY-MAIL ELIGIBLE. By
comparison, 5.1 percent of Blacks and 4.3 percent of Hispanics were estimated to be NO
MATCH/NOT EXEMPTION ELIGIBLE/NOT AGE VOTE-BY-MAIL ELIGIBLE.
(See the last column of Table VI.3.A.) The differences between the rates of NO
MATCH/NOT EXEMPTION ELIGIBLE/NOT AGE VOTE-BY-MAIL ELIGIBLE are
Case 2:13-cv-00193 Document 600-1 Filed in TXSD on 09/16/14 Page 42 of 122

41
statistically significantly higher for minorities than for Anglos. And these estimates are
very similar to those in Table VI.1.
77. Among records classified as Anglo by Catalist’s estimates, 2.0 percent were not
matched to any record in any identification or exemption database and were under 65.
By comparison, a NO MATCH and no potential exemption were found for 4.8 percent of
people classified as Black and 4.0 percent of people classified as Hispanic. Similar
patterns hold separately for those people who do not qualify for the disability exemption
or for those under 65. See Table VI.3.B. These estimates are very similar to those in
Table VI.2.
78. The difference between Black and Anglo rates is 2.8 percentage points, and the
difference between Hispanic and Anglo rates is 2.0 percentage points. Both differences
are statistically significant at the confidence levels generally used by social scientists.
Blacks are 140 percent more likely than Anglos to have neither a MATCH nor qualify for
an exemption; Hispanics are 100 percent more likely to have neither a MATCH to a state
or federal identification record nor qualify for an exemption.
80. The aggregate and individual-level data are remarkably consistent. They show
statistically significant differences between the rate with which Anglos and the rates with
which Blacks and Hispanics on the TEAM database are matched to state and federal
identification databases or are eligible for an exemption. The difference between Blacks
and Anglos is in the range of 3 to 8 percentage points and the difference between
Case 2:13-cv-00193 Document 600-1 Filed in TXSD on 09/16/14 Page 43 of 122

42
Hispanics and Anglos is in the range of 2 to 6 percentage points. Hispanics are at least
50 percent more likely than Anglos to lack acceptable SB 14 ID, and Blacks are at least
100 percent more likely than Anglos to lack acceptable SB 14 ID.
D. Voting Rate among Registrations with No Match to an ID
81. The NO MATCH list contains 1.5 percent of all registered voters on TEAM who
voted in 2012 and 1.4 percent of all registered voters who voted in 2010.
82. Table VI.4.A shows that the NO MATCH rate among voters is higher among
minorities than among Anglos using Ecological Regression estimates of racial group
differences. Ecological regression estimates that the NO MATCH rate among Anglos
who voted was 0.8 percent in 2010 and 0.6 percent in 2012. The NO MATCH among
Blacks who voted was 3.3 percent in 2010 and was 4.2 percent in 2012. The NO
MATCH among Hispanics who voted was 1.9 percent in 2010 and was 2.0 percent in
2012. The rates of NO MATCH among Black and Hispanic voters are statistically
significantly higher than for Anglos.
83. Table VI.4.B shows that the NO MATCH rate among voters is higher among
minorities than among Anglos using the Catalist racial classification. Catalist’s racial
estimates indicate that the NO MATCH rate among Anglos who voted was 1.2 percent in
2010 and 1.1 percent in 2012. The NO MATCH among Blacks who voted was 2.6
percent in 2010 and was 3.1 percent in 2012. The NO MATCH among Hispanics who
Case 2:13-cv-00193 Document 600-1 Filed in TXSD on 09/16/14 Page 44 of 122

43
voted was 1.9 percent in 2010 and was 1.8 percent in 2012. The rates of NO MATCH
among Black and Hispanic voters are statistically significantly higher than for Anglos.
The rate with which Blacks on the No Match list voted in 2010 or 2012 is at least 2 times
higher than the rate with which Anglos on the No Match list voted in those elections.
The rate with which Hispanics on the No Match list voted in 2010 or 2012 is at least fifty
percent higher than the rate with which Anglos on the No Match list voted in those
elections.
VII. Validation
84. This section determines the sensitivity of results to alternative specifications of the
pool of registered voters and to alternative classifications of race.
A. Variations in Universe of Registered Voters
85. The TEAM database is the official list of registered individuals in the State of Texas.
Even so, there may be questions raised about the currency of some records in that
database. All states that have voter registration will have at least some registrations that
are out-of-date or invalid but still on the rolls, for a wide variety of reasons. I
constructed alternative formulations of the list of registered voters to examine whether
such concerns could affect the inferences drawn regarding racial disparities in rates of
acceptable SB 14 ID possession.
Case 2:13-cv-00193 Document 600-1 Filed in TXSD on 09/16/14 Page 45 of 122

44
86. This section examines variations in the pool of registered voters achieved by
omitting records from TEAM for which there is some indication that the record may no
longer be current or valid according to information from Catalist or internal to the TEAM
or DPS databases. Omitting these cases changes both the numerator and the
denominator of calculations of the percent who are matched or not.
87. Table VII.1 presents the rates with which racial groups match to the relevant state
and federal databases under different constructions of the set of registered voters. Table
VII.1.A presents ecological regression analyses using Census racial data, and Table
VII.1.B presents analyses using Catalist racial data.
Catalist Deceased, Deadwood, and NCOA flags
88. The Catalist database includes indicators of whether an individual is deceased, is
deadwood (an obsolete record), or has a National Change of Address application on file
with the U.S. Postal Service, indicating that the individual has moved.31 Each of these
categories provides evidence that a given registration record may no longer be current. I
performed two sorts of analyses using the Catalist Deadwood flags. First, I performed
ecological regression analyses. I removed the records that Catalist flagged as deadwood
from the MATCH and NO MATCH lists, aggregated the data to the Block Group level,
and then performed ecological regression on the rate of NO MATCH (without those
31 NCOA flags do not distinguish between in-county, in-state, and out-of-state moves.
Case 2:13-cv-00193 Document 600-1 Filed in TXSD on 09/16/14 Page 46 of 122

45
indicated by Catalist as deadwood) on Census racial data. Second, I analyzed rates of
NO MATCH across racial groups using the classification of racial groups provided by
Catalist. Column 1 in Table VII.1.A and VII.1.B presents the overall NO MATCH figure
and the rate of NO MATCH among racial groups excluding records flagged by Catalist as
deceased, deadwood, or NCOA are excluded from TEAM.
89. Column 1 of Table VII.1.A shows that the NO MATCH rate among voters is higher
among minorities than among Anglos after excluding records flagged by Catalist as
deceased, deadwood, or NCOA. Ecological regression estimates that the NO MATCH
rate among Anglos in this subset of the data was 1.9 percent. The NO MATCH among
Blacks in this subset of the data was 8.1 percent. The NO MATCH among Hispanics in
this subset of the data was 5.9 percent. The rates of NO MATCH among Black and
Hispanic voters are statistically significantly higher than for Anglos.
90. In Table VII.1.B there are significant racial differences in rates of NO MATCHES
after removing from TEAM records that Catalist’s data indicate as deceased, Deadwood,
or NCOA and using the racial classification provided by Catalist. Among records that
the Catalist race estimates classified as Anglo, 3.5 percent were not matched to any
record in any identification database. By comparison, no matches were found for 7.5
percent of people classified by Catalist as Black and 5.7 percent of people classified as
Hispanic.
Case 2:13-cv-00193 Document 600-1 Filed in TXSD on 09/16/14 Page 47 of 122

46
91. The difference between Black and Anglo rates of no matches is 4.0 percentage
points, and the difference between Hispanic and Anglo rates of no matches is 2.2
percentage points. Both differences are highly unlikely to arise by chance.
Suspense Voters
92. The TEAM database distinguishes Active and Suspense (or inactive) voters. A
suspense voter is still legally registered but may be dropped from the registration list for
reasons of non-voting or non-response to election office communications.32 Column 2 in
Tables VII.1.A and VII.1.B present the rates of NO MATCH among racial groups
excluding Suspense Voters from the pool of Registered Voters.
93. Column 2 of Table VII.1.A presents the ecological regression estimates of non-
matching rates for the racial groups after removing Suspense (or inactive) voters.
Ecological regression estimates that the NO MATCH rate among Anglos in this subset of
the data was 1.4 percent. The NO MATCH among Blacks in this subset of the data was
7.7 percent. The NO MATCH among Hispanics in this subset of the data was 5.9
percent. The rates of NO MATCH among Black and Hispanic voters are statistically
significantly higher than for Anglos.
32 The Suspense List, as described in Section 15.081 of the Texas Election Code, is maintained by the voter registrar in each county. It contains the names of (1) voters that failed to respond to a confirmation notice, (2) voters whose renewal certificate was returned to the registrar as undeliverable, and (3) those individuals that were excused or disqualified from jury service because they were not a resident of a given county.
Case 2:13-cv-00193 Document 600-1 Filed in TXSD on 09/16/14 Page 48 of 122

47
94. Column 2 of Table VII.1.B presents the analysis of non-matching rates for the racial
groups after removing Suspense (or inactive) voters using individual-level estimates of
race provided by Catalist. Among records that Catalist estimates classified as Anglo, 2.9
percent were not matched to any record in any identification database. By comparison,
no matches were found for 6.7 percent of people classified as Black and 5.2 percent of
people classified as Hispanic.
95. The differences between the racial groups are statistically significant. The
difference between Black and Anglo rates of no matches is 3.8 percentage points, and the
difference between Hispanic and Anglo rates of no matches is 1.3 percentage points.
Both differences are highly unlikely to arise by chance.
Expired IDs
96. The DPS database lists records with expired IDs (DL, PID, CHL, and EIC). An
expiration may simply mean that the individual allowed the driver license to expire
because that person no longer drives. However, an expired license may also signal that
the individual is no longer at a given residence.33 Column 3 in Table VII.1 presents the
overall NO MATCH figure and the rate of NO MATCH among racial groups excluding
from the pool of Registered Voters those who could be matched to DPS records with
33 Therefore, exclusion of these records removes some registered voters who no longer reside at the residence at which they are registered, and perhaps not in the State of Texas. It also removes records of some people who remain at their residence but allowed their ID to expire and will be affected by SB 14.
Case 2:13-cv-00193 Document 600-1 Filed in TXSD on 09/16/14 Page 49 of 122

48
Expired IDs. It should be noted that in order to extract the expiration information, I first
matched the records in TEAM to the DPS files and then omitted from the analysis all
records that had IDs that were expired for more than 60 days and thus not valid for use
under SB 14.
97. Column 3 of Table VII.1.A presents the ecological regression estimates of non-
matching rates for the racial groups after removing records with expired DPS IDs.
Ecological regression estimates that the NO MATCH rate among Anglos in this subset of
the data was 0.5 percent. The NO MATCH among Blacks in this subset of the data was
5.4 percent. The NO MATCH among Hispanics in this subset of the data was 4.3
percent. The rates of NO MATCH among Black and Hispanic voters are statistically
significantly higher than for Anglos.
98. Excluding those with expired IDs from the pool of Registered Voters, among
records that the Catalist estimates classified as Anglo, 1.6 percent were not matched to
any record in any identification database. By comparison, no matches were found for 4.2
percent of people identified as Black and 3.4 percent of people identified as Hispanic.
99. The differences between the racial groups are statistically significant. The
difference between Black and Anglo rates of no matches and no exemptions is 2.6
percentage points, and the difference between Hispanic and Anglo rates of no matches is
1.8 percentage points. Both differences are statistically distinguishable from 0 difference.
Case 2:13-cv-00193 Document 600-1 Filed in TXSD on 09/16/14 Page 50 of 122

49
All Filters
100. Finally, I exclude from the pool of registered voters those records with Catalist
deceased, deadwood, or NCOA flags, those with Expired IDs, and those listed as
Suspense Voters from TEAM. Column 4 in Table VII.1.A and VII.1B presents the
overall NO MATCH figure and the rate of NO MATCH among racial groups’
registrations when excluding Expired IDs, Suspense registrations, and registrations for
which there is a Catalist flag for deceased, deadwood, or NCOA.
101. Column 4 of Table VII.1.A presents the ecological regression estimates of non-
matching rates for the racial groups after removing Suspense (or inactive) voters.
Ecological regression estimates that the NO MATCH rate among Anglos in this subset of
the data was 0.5 percent. The NO MATCH among Blacks in this subset of the data was
5.3 percent. The NO MATCH among Hispanics in this subset of the data was 4.3
percent. The rates of NO MATCH among Black and Hispanic voters are statistically
significantly higher than for Anglos.
102. Excluding all three categories of possible obsolete records, among those that
Catalist estimates classified as Anglo, 1.3 percent were not matched to any record in any
identification database. By comparison, no matches were found for 3.7 percent of people
classified as Black and 3.0 percent of people classified as Hispanic. Even after
excluding these categories to test for the sensitivity of results to potential deadwood, I
Case 2:13-cv-00193 Document 600-1 Filed in TXSD on 09/16/14 Page 51 of 122

50
find that Blacks were almost three times as likely to be a NO MATCH as Anglos, and
Hispanics are more than two times as likely to be a NO MATCH as Anglos.
103. The differences between the racial groups are statistically significant. The
difference between Black and Anglo rates of no matches is 2.4 percentage points, and the
difference between Hispanic and Anglo rates of no matches is 1.7 percentage points.
Both are highly unlikely to have arisen by chance.
104. These analyses suggest that the general pattern of racial differences holds even
under varying constructions of the pool of registered voters. It is possible to perform
further analyses using combinations of different filters and screens examined here.
Appendix Tables A.VI.1 and A.VI.2 present results for the disparities on the incidence of
NO MATCH for the subset of TEAM records for which Catalist shows that a record may
be questionable as deceased, deadwood, or NCOA.
B. Racial Classification
105. The racial classification provided by Catalist is an estimated value for each
individual based on local area demographics, frequencies of names, and other
characteristics of the individuals. Errors in classification can occur. Statistical theory
predicts that such errors will tend to reduce observed differences across the groups.34
Hence, the true differences may be larger than the estimates above. It is possible to check
34 William G. Cochran, “Errors of Measurement in Statistics,” Technometrics 10 (Nov. 1968): 637-666.
Case 2:13-cv-00193 Document 600-1 Filed in TXSD on 09/16/14 Page 52 of 122

51
the robustness and validity of the racial differences observed using a subset of records for
which Catalist estimates of race are of the highest confidence and by using data on
Spanish Surnames on the Voter files.
106. First, the pool of registered voters can be restricted to the subset of records for
which Catalist has high confidence in the racial classification. Catalist provides
information on the level of confidence in that predicted value. There are 6,772,927 such
records in TEAM.
107. Table VII.2 presents the numbers and percentages of each racial group in the NO
MATCH and MATCH list starting with the Baseline Universe but retaining from TEAM
only those records for which Catalist reports high confidence of the individual’s race.
Overall, 4.0 percent of records in this subset of the TEAM baseline universe did not
match to a corresponding record on a state or federal identification database.
108. Racial differences in rates of NO MATCH are as more pronounced in the subset of
registered voters for which Catalist reported that the racial classification estimate was
“highly likely” correct. Of people that Catalist’s estimates classified as Anglo, 3.1
percent had NO MATCH. By comparison, 9.3 percent of people classified as Black and
5.7 percent of people classified as Hispanic on TEAM could not be matched to a
corresponding record on any identification database. The percent NO MATCH is 2.6
percentage points higher for Hispanics than for Anglos, and the percent NO MATCH is
6.2 percentage points higher for Blacks than for Anglos. These differences are highly
Case 2:13-cv-00193 Document 600-1 Filed in TXSD on 09/16/14 Page 53 of 122

52
unlikely to have arisen by chance and are somewhat larger than those exhibited in Tables
VI.1.
109. Second, the TEAM database includes an indicator of Spanish Surname Voter
Registration (SSVR). I examine differences in NO MATCH rates for those with SSVR
and those without to gain further evidence of a racial difference. Comparison of SSVR
with non-SSVRs will understate the differences between Hispanics and Anglos, because
the pool of non-SSVRs consists of both Anglos and Blacks.
110. Table VII.3 presents the incidence of SSVR and non-SSVR in the NO MATCH and
MATCH list for the Baseline. Of Spanish Surname Voter Registrations in TEAM, 5.8
percent had NO MATCH. This estimate is nearly identical to the ecological regression
estimate for Hispanics in Table VI.1, and slightly higher than the Catalist estimate in
Table VI.2. Of those people classified as Non-SSVR, 4.1 percent failed to match to an
identification database. The non-SSVR pool combines Anglos, Blacks, and other races,
so it does not provide a pure comparison of Hispanics and Anglos. Even still, I observe a
difference in the rate of NO MATCH of 1.7 percentage points between SSVR and Non-
SSVR that is highly unlikely to have arisen by chance.
Case 2:13-cv-00193 Document 600-1 Filed in TXSD on 09/16/14 Page 54 of 122

53
VIII. Historical Voting and Registration Patterns
111. Registration and voting patterns in prior elections can be informative about
historical patterns of behavior and election administration. To assess such historical
conditions I examined three sorts of data.
112. First, I examine data from TEAM on vote history and data from Catalist on race of
individuals. These data measure whether Anglo registrants voted at higher rates than
Black and Hispanic registrants in 2010 and 2012.
113. Second, I examined the CPS Registration and Voting Supplement and Census
reports based on the CPS of the numbers and percentages of persons and citizens of
voting age who are registered and who voted in the State of Texas and in each racial or
ethnic category. I studied the reports for 2006, 2008, 2010, and 2012.
114. Third, I conducted ecological regression analyses to estimate the percentage of
persons in each racial or ethnic group who are registered in the State of Texas and the
percentage of registered persons in each racial or ethnic group who voted. This
methodology is an established methodology for studying voting patterns in voting rights
cases; see Thornburg v. Gingles, 478 US 30, 52-54 (1986).
Case 2:13-cv-00193 Document 600-1 Filed in TXSD on 09/16/14 Page 55 of 122

54
A. Catalist and TEAM
115. Tables VIII.1a and VIII.1b present the percentages of Registered Anglos, Blacks,
and Hispanics who voted in the State of Texas in 2010 and 2012, according to the
Catalist estimates of individual voter’s race and TEAM data on vote history. The table
presents all voters (active and suspense) in the top panel and only active voters in the
bottom panel. These data show that registered Anglos voted at significantly higher rates
than registered Hispanics and Blacks in the two elections immediately prior to the
implementation of SB 14.
B. Ecological Regression Estimates
116. I performed ecological regressions across VTDs to estimate the registration and
voting rates of various groups. For these estimates I used Census Enumeration counts of
VAP, ACS estimates of CVAP, and Registration and Vote data reported by the Texas
Legislative Council.
117. I performed two sets of ecological regressions for each of elections considered, the
2006, 2008, 2010, and 2012 elections. The first set estimates the rate of Registration as a
percent of the VAP and of the CVAP for each of the groups. I regress the percent of the
VAP or CVAP that is registered on the percentages of each of the groups in the VAP or
CVAP. The second set of analyses estimates the voting rate of registered persons for
each of the groups. This is done by regressing the percent of registered persons who
voted on the percentages of each of the groups in the VAP or CVAP.
Case 2:13-cv-00193 Document 600-1 Filed in TXSD on 09/16/14 Page 56 of 122

55
118. Tables VIII.2a and VIII.2b present the Ecological Regression estimates of the
percentages of adult citizen Anglos, Hispanics, and Blacks in the State of Texas who
were registered in the 2006, 2008, 2010, and 2012 elections. The 95 percent confidence
interval for these estimates is reported in parentheses beneath each estimated percentage.
119. According to the ecological regression estimates in Tables VIII.2a andVIII.2b, 83 to
87 percent of Anglos of Voting Age and 84 to 88 percent of Anglo Citizens of Voting
Age in Texas are registered to vote. 65 to 77 percent of Blacks of Voting Age and 75 to
80 percent of the Black CVAP are registered to vote. And, 50 to 55 percent of Hispanics
of Voting Age and 75 to 80 percent of Hispanic CVAP are registered to vote. The
differences between Anglo and Hispanic registration rates and between Anglo and Black
registration rates are highly unlikely to have arisen by chance (i.e., are statistically
significantly different from 0).
120. Tables VIII.3a and VIII.3b present Ecological Regression estimates of the percent
of registered persons who voted among specific racial or ethnic groups in Texas.
According to the Ecological Regression estimates, the voting rates among registered
voters of Anglo populations ranges from 10 to 20 points higher than the voting rates of
Blacks, and the voting rate among registered voters of Anglo populations ranges from 15
to 30 points higher than the voting rates of Hispanic populations.
Case 2:13-cv-00193 Document 600-1 Filed in TXSD on 09/16/14 Page 57 of 122

56
C. Current Population Survey
121. Table VIII.4 presents the CPS estimates of the percentages of adult citizen Anglos,
Hispanics, and Blacks in the State of Texas who reported being registered to vote in the
top panel and the percentages of each group who reported voting in the bottom panel.
The margin of error of these estimates (a 95 percent confidence interval) is reported in
parentheses beneath each estimated percentage.
122. The CPS estimates indicate that there existed no statistically significant difference
between the percentages of Black and Anglo voter registration and turnout among adult
citizens in the State of Texas from 2006 to 2012. The largest observed difference in the
CPS estimates of registration rates of Blacks and Anglos arose in 2010 and was not
statistically different from 0. However, the margin of error of these estimates is very
wide, 7 to 9 percentage points for Blacks, so these data do not have much statistical
power.
123. The CPS estimates indicate that Hispanic adult citizens in the State of Texas are
significantly less likely to be registered to vote than Anglo adult citizens in the State of
Texas. In 2012, for example, the difference in these groups’ registration rates is 18.5
percentage points, with a standard error of 3.7 points. The 95 percent confidence interval
for this estimated difference is 7.4 points. Hence, the difference is significantly greater
than 0, even though the margin of error is quite wide.
Case 2:13-cv-00193 Document 600-1 Filed in TXSD on 09/16/14 Page 58 of 122

57
124. The CPS estimates also indicate that Hispanic adult citizens in the State of Texas
are significantly less likely to vote than Anglo adult citizens in the State of Texas. In
2012, for example, the difference in Anglo and Hispanic voting rates is 22.1 percentage
points, with a standard error of 7.3 points. The 95 percent confidence interval for this
estimated difference is 14.6 points. Hence, the difference is significantly greater than 0.
125. Table VIII.5 presents estimates of the percent of the Registered Persons in a given
group that voted. These percentages are quite similar for Blacks and Anglos, according to
the CPS figures, but the rate at which Hispanic registrants vote is estimated to be 10 to 20
points lower than for Anglos.
126. The margin of error on the CPS estimates, however, is sufficiently wide that these
data support a fairly wide range of possible outcomes. Specifically, one cannot reject the
hypothesis that the estimates based on the CPS in Table VIII.5 are inconsistent with the
results from the Catalist data in Table VIII.1. Hence, CPS does not have the statistical
power to detect differences at the level found using the NO MATCH list and Catalist
racial classifications. Even so, CPS shows significant differences in registration and
voting between Anglos and Hispanics.
127. Overall, the Catalist figures, CPS survey estimates, and the Ecological Regression
estimates show that there are statistically significant differences across racial and ethnic
groups in the rate at which individuals register to vote and the rate at which they vote,
given that they were already registered. The observed differences in possession of SB 14
Case 2:13-cv-00193 Document 600-1 Filed in TXSD on 09/16/14 Page 59 of 122

58
ID, then, only add a further potential barrier to participation for groups that already have
lower participation rates than Anglos in the State of Texas.
Case 2:13-cv-00193 Document 600-1 Filed in TXSD on 09/16/14 Page 60 of 122

59
IX. Reply to Reports of Professors Hood and Milyo
Overview
128. Neither report discusses the substance of my two key findings. (1) There are racial
differences in rates of NO MATCH according to Ecological Regression. (2) There are
racial differences in rate of NO MATCH according to individual-level Catalist race
estiamtes. These results confirm and validate each other.
129. Neither report offers any specific commentary on the ecological regressions
performed using Census racial data or the individual level analyses using Catalist data.
130. My findings are consistent with evidence produced in other states, using both
database matching and survey methodologies, most notably in 2012 in South Carolina,
which has the advantage of a voter registration database containing both full Social
Security numbers and the race of the registrant. In that case, database matching produced
estimates that 3.9% of whites lacked required state or federal ID, compared to 8.3% of
African-Americans and 6.7% of Hispanics.35 My findings as to Texas here are also
consistent with findings from Georgia produced by the State of Texas’s own expert in the
present litigation, and presented in his report.
35 Charles Stewart III, “Voter ID: Who Has Them? Who Shows Them?” 66 Okla. L. Rev. 21.
Case 2:13-cv-00193 Document 600-1 Filed in TXSD on 09/16/14 Page 61 of 122

60
131. Neither report shows that any of the objections the authors raise affect the findings
of racial disparities identified in my report. Specifically, neither report documents that
any of the criticisms offered of the matching process or of the quality of State of Texas
data alter any conclusions drawn about disparities in the rates with which Blacks and
Hispanics possess ID acceptable under SB 14 relative the rate with which Anglos possess
those IDs.
132. These reports make three broad claims regarding the conclusions in my report.
133. First, they are critical of the matching process insofar as some records on the State
of Texas official record of registered voters (TEAM database) may be obsolete
(deadwood), say because an individual is deceased or moved. Milyo offers an estimate
that between 0 and 24 percent of records on the State of Texas voter registration list are
deadwood. He provides no assessment as to whether his estimated deadwood records
are matched or not matched to State of Texas or federal identification databases. Nor
does he establish that any deadwood on Texas’s voter registration list creates matching
problems that are correlated with race. My original report examined exactly this
question and concluded that the racial disparities in match rates do not change with
alternative methods of identifying deadwood or deceased records through use of both
state and non-official sources.
134. Specifically, additional analyses are performed to test the sensitivity to possible
objections concerning possible deadwood on the registration rolls. Milyo calls the
Case 2:13-cv-00193 Document 600-1 Filed in TXSD on 09/16/14 Page 62 of 122

61
“hidden results,” but the results are fully reported and their relationship to the overall
analysis is clearly stated in my initial report. Those analyses test the sensitivity of results
excluding Suspense voters, excluding potentially exempt voters, excluding cases flagged
by Catalist as deceased, deadwood, or having an NCOA flag. The disparity in the rates
of NO MATCH across racial groups remain quite stable across various analyses to
examine sensitivity of results to other (non-official) indicators of deadwood records and
deceased voters. Taken together, those results reveal that the racial gap shown in the
data is real and durable.
135. Second, both reports are critical of the matching process. While Professor Hood
lists specific problems of concern that would create a NO MATCH in the merge process,
Professor Milyo argues that deadwood generally creates a problem for matching.
Professor Milyo does not offer specific concerns about the matching algorithm that I
used. While Professor Hood lists specific problems of concern that could create a NO
MATCH in any merging process, his specific criticisms have already been anticipated
and accounted for in the thorough matching algorithm that I implemented.
136. Neither report offers an alternative implementation of the matching process, even
though one of the state’s experts (Professor Hood) has conducted record linkage and
matching for purposes of evaluating ID laws. Neither report establishes that their
criticisms affect conclusions about racial differences.
Case 2:13-cv-00193 Document 600-1 Filed in TXSD on 09/16/14 Page 63 of 122

62
137. Both Professor Hood and Professor Milyo raise concerns about the quality of the
TEAM and DPS databases maintained by the State of Texas. I take the State of Texas
TEAM database for what it is—the official record of registered voters in the State of
Texas. Likewise, I take the DPS data as the official record of photo IDs issued by the
State of Texas. The contents of these databases will be used to verify whether a voter
can cast an in-person ballot.
138. The purpose of the algorithm that I developed and implemented is to find all
individuals in TEAM who likely have a matching record in at least one identification
database, and, thus, likely have a form of ID required under SB 14.
139. My objective is not to measure the problems with the lists maintained by the State
of Texas, and the potential barriers to voting that might arise from problems in those lists,
but to ascertain whether minority voters are going to be disparately burdened by the law
because of lower rates of SB 14 ID possession. I perform multiple sweeps through the
relevant databases in order to guard against errors in a specific field producing a non-
match.
140. Third, the reports characterize academic literature incorrectly in three respects.
Most of literature reviewed concerns ID laws with requirements that are not comparable
to those imposed by Texas’s SB 14. Neither report explains how to extrapolate the
analyses of those laws to analysis of the effects of SB 14’s requirements.
Case 2:13-cv-00193 Document 600-1 Filed in TXSD on 09/16/14 Page 64 of 122

63
A. Response to the Report by Professor Hood
1. Academic Research on Voter ID
141. On pages 10 and 11, Professor Hood describes studies of Voter ID laws covering
elections from 2000 to 2008, including my own 2009 paper.36 Most of these studies,
including my own, compare the typical ID law at the time with states that did not require
ID. Before 2008, laws requiring photo ID were atypical of ID laws. Hence, these
studies, and the conclusions in them, do not directly apply to the present law. No
analysis is conducted by Professor Hood to state how these studies apply to the current
law. My conclusions in my 2009 paper were based on the data presented in that paper,
and on the range of ID laws across many states with varying degrees of strictness.37 My
conclusions in this report are based on the data described above. My conclusions
presented here and in my 2009 paper are in no way contradictory.
142. Subsequent research has found that states that recently adopted photo ID laws have
experienced drops in turnout connected with the adoption of those laws. An article in a
peer reviewed journal by Professors Alvarez, Bailey, and Katz in 2011 shows that the
36 Stephen Ansolabehere, “Effects of Identification Requirements on Voting: Evidence from the Experiences of Voters on Election Day,” PS: Political Science, January, 2009, pages 127-130, doi:10.1017/S1049096509090313. 37 The National Conference of State Legislatures provides a summary of sates’ voter authentication rules. Wendy Underhill, “Voter Identification Requirements” National Conference of State Legislatures, June 25, 2014, http://www.ncsl.org/research/elections-and-campaigns/voter-id.aspx
Case 2:13-cv-00193 Document 600-1 Filed in TXSD on 09/16/14 Page 65 of 122

64
states that introduced photo ID had a significant drop in turnout, and that the photo ID
requirements had qualitatively different effects on turnout than other laws.38 Other, less
restrictive ID laws had minimal effects on turnout in their analysis, but requiring photo
ID corresponded with a significant decline in turnout.39
143. Professors Hood and Bullock in their 2008 study of the Georgia photo ID law
establish the link between lack of ID and decreased turnout. That study uses record
linkage and database matching between the voter registration list in Georgia and the
driver license list in Georgia. The authors found that “[r]egistrants who lack drivers
licenses are generally less engaged politically and maybe even less apt to participate if
more ID restrictions are put in place. (Page 573).” See also their 2012 article.40
144. Professors Hood and Bullock further established the link between race and lack of
ID in Georgia. They concluded that “[r]egistered voters are significantly less likely to
possess a drivers license if they are from minority groups, especially if they are Black and
Hispanic, and if they are older.” (Page 572) According to Hood and Bullock, then,
Blacks and Hispanics are significantly less likely than Whites to possess drivers licenses,
and those without drivers licenses are significantly less likely to vote following the
implementation of the Georgia photo ID law.
38 R. Michael Alvarez, Delia Bailey, and Jonathan Katz, “An Empirical Bayes Approach to Estimating Ordinal Treatment Effects, Political Analysis 19: 20-31. 39 Mycoff, Wagner, and Wilson, “The Empirical Effects of Voter-ID Laws: Present or Absent?” PS: Political Science January, 2009, pages 121-126, examine CCES survey data and find a negative effect of photo ID requirements, but the statistical precision is insufficient to determine whether the true effect is statistically distinguishable from 0. 40 M. V. Hood and Charles S. Bullock III, “Much Ado About Nothing? An Empirical Assessment of the Georgia Voter Identification Statute”
Case 2:13-cv-00193 Document 600-1 Filed in TXSD on 09/16/14 Page 66 of 122

65
145. In his report, Professor Hood characterizes his study as showing no racial
difference in turnout with the introduction of the photo ID law in Georgia. This
conclusion arises from the analyses in Tables 2 and 3 in his report. Those analyses
estimate the differential drop in turnout between those who had ID and those who did not
have ID from 2004 to 2008 in Georgia across racial groups. He concludes that there is
no difference across racial groups in the change in differential turnout. Professor Hood’s
interpretation and methodology in reaching that conclusion are flawed.
146. The interpretation ignores the fact that there are racial disparities in possession of
ID. The analysis in Tables 2 and 3 addresses the decline in turnout within groups for
those who possessed and did not possess IDs in Georgia. It does not address the question
of the total effect of the ID law given differential rates with which groups possess ID. A
hypothetical example demonstrates the point. Suppose there are two groups. In one
group 98 people have ID and 2 do not. And in a second group, 2 have ID and 98 do not.
Before the ID law is implemented all people with ID vote and half of those without ID do
not. Once the law is implemented all people with ID vote and none of those without ID
vote. The decline in turnout is the same within both groups. That is, 100 percent of
those with ID voted before the law and 50 percent of those without ID voted before the
law within both groups, and the decline in voting from before to after is the same.
However, the effect of the law falls almost entirely on the second group because of the
lower rate of possession of ID. Specifically, the turnout rate of the first group would be
99 percent before the law and 98 percent after the law, but the turnout rate of the second
Case 2:13-cv-00193 Document 600-1 Filed in TXSD on 09/16/14 Page 67 of 122

66
group would be 51 percent before the law and 2 percent after the law.41 This
hypothetical assumes that the differential decline in turnout is the same in both groups,
and it demonstrates that that is not the measure of the total effect of the law on turnout of
groups.
147. Other scholars have issued methodological criticisms of the study of the Georgia
photo ID law by Professors Hood and Bullock. Professor Stewart provides a thorough
assessment of some of the weaknesses of the research design, with which I agree. (See
attached report of Professor Charles Stewart in South Carolina v. United States.) Two
critiques are especially important in ascertaining whether there is an effect of photo ID
laws.
148. First, differences in income and other demographics across groups will translate
into differential effects of photo ID laws on minorities. Drawing on the results reported
in his research, Professor Hood reports results of multivariate logit analyses, which hold
constant income, gender, age, and area of residency. He concludes that there is no racial
effect of photo ID laws on turnout. However, the coefficient on race in the logistic
regression is not the average effect of the law on a typical Black person, a typical
Hispanic person, or a typical White person. It is the difference across racial groups,
assuming all racial groups are the same in all other demographics, including income.
41 Before the law 1 of the 2 people in group 1 without ID would vote and all 98 of those with ID would vote, for a turnout rate of 99 percent. After the law, all 98 with ID would vote and neither of those with ID would vote. For the second group, before the law, 49 of the 98 people (half) without ID would vote and both of those with ID would vote, for a turnout rate of 51 percent. After the law, all 98 without ID would not vote and both of those with ID would vote.
Case 2:13-cv-00193 Document 600-1 Filed in TXSD on 09/16/14 Page 68 of 122

67
That is, there is no significant difference in expected turnout between a white and a black
individual who have the same income, gender, age and area of residency.
149. All things, of course, are not equal. Blacks and Hispanics have lower income and
are younger than Whites in Georgia42 and in Texas.43 The introduction of statistical
controls makes it appear in the multivariate logit analysis that there are no racial
differences when in fact there may be one because minorities have lower values on
average on the relevant statistical controls.
150. Second, Professor Hood’s estimate of the decline in turnout among those without
ID is biased and biased in a way that will overstate the decline in White turnout from
2004 to 2008 relative to the decline in Black and Hispanic turnout. The comparison of
2004 and 2008 in Hood and Bullock, and reproduced in Tables 2 and 3 of Professor
Hood’s report, rests of knowing who had Driver Licenses in 2004 and in 2008. To
determine that, Professors Hood and Bullock engage in record linkage and database
matching of the Georgia voter file to the Driver License list. The databases are already
linked through a unique identifier. The list of individuals who do not have driver licenses
was produced late in 2007.
42 See Rebuttal Declaration of Professor Charles Stewart, in South Carolina versus United States, United States District Court of District of Columbia, Document 166-2, especially pages 38-53. 43 See Granted Request for Judicial Notice, in Veasey v. Perry, in the United States District Court for the Southern District of Texas, Corpus Christi Division, Document 252
Case 2:13-cv-00193 Document 600-1 Filed in TXSD on 09/16/14 Page 69 of 122

68
151. The matching procedures used by Professor Hood had dramatically different rates
of matching for 2004 and 2008. Professors Hood and Bullock relied solely on the
“unique identifier,” and they matched 98.2% of 2008 registered voters to the 2007 list of
those without driver license, but only 78.5% of 2004 registered voters to the 2007 list of
those without drivers licenses. It is improbable that there was a 20-percentage point
increase in the number of registered voters who actually had drivers licenses between
2004 and 2008. More likely the matching algorithm did substantially worse in that year,
making the estimates for 2004 much worse than for 2008 and introducing a roughly 20-
point bias in any direct comparison of ID possession between the two years.
152. The 98.2 percent matching rate that Professors Hood and Bullock found through
use of a unique identifier in record linkage is approximately the same level of reliability
that the algorithm I implemented attains using multiple identifiers that combine Address,
Name, Gender, and Data of Birth. (See the comparison with SSN9 matches below.) The
reliability of the match rates of the algorithm implemented for the United States in the
present case far exceeds the 78.5% rate that Hood and Bullock found as to the 2004
registered voters.
153. The large difference between the 2004 and 2008 match rates in the analysis
performed by Professors Hood and Bullock will bias the estimates of the drop in turnout
and, if there are racial differences in possession of ID, will bias the estimated effect of the
law on those who do no possess ID across racial groups. The bias in the drop in turnout
arises because many people who actually have ID are classified as not having ID in 2004,
Case 2:13-cv-00193 Document 600-1 Filed in TXSD on 09/16/14 Page 70 of 122

69
but not in 2008. Since those with ID vote at a much higher rate than those without ID
(even before the new photo ID law went into effect), those classified as not having ID in
2004 are a mix of those without ID, who vote at a low rate, and some people with ID,
who vote at a higher rate. That will inflate the estimated voting rate of those who do not
in fact have ID.
154. If possession of ID is correlated with race, the misclassification will inflate the
estimated turnout rate of Whites without ID more than it will inflate the estimated turnout
rate of Blacks and Hispanics without ID.
155. In sum, the methodological problems with the Hood and Bullock estimates (and
with Tables 2 and 3 in Professor Hood’s report) caution against drawing reliable
conclusions about the racial disparities in the effects of the introduction of photo ID rules
in Georgia on turnout. Methodological problems aside, the results in Tables 2 and 3 do
not address the fact of racial disparities in rates of possession of IDs; hence, the results
cannot be interpreted as the total effect of the introduction of the photo ID laws on voter
participation by race.
2. Matching Algorithm
156. Professor Hood offers six specific criticisms of my matching algorithm. I respond
to each in kind.
Case 2:13-cv-00193 Document 600-1 Filed in TXSD on 09/16/14 Page 71 of 122

70
a. There is no universal identifier in these databases.
157. The State of Texas does not record a unique identifier, such as SSN9, for every
record on that corresponds to an individual on DPS and other state databases. Not every
TEAM record has an SSN9 or DPS ID number.
158. As Hood and Bullock’s work shows even with such a “universal identifier”
subsequent matching procedures are required. The universal identifier in their study of
Georgia matched 98.2 percent of records in 2008 and 78.5 percent for 2004.
159. The state of science is to use multiple identifiers, either using exact matches or
probabilistic matches, even when there is a universal identifier because of problems of
missing data and typographical errors. That is what I have done. The reliability of this
method is further shown through the analysis of possible false positive and false negative
matches below.
b. Missing data in fields
160. As I discussed in sections IV.B and IV.C, missing data in fields is one reason for
using multiple identifiers for record linkage. Even the universal identifiers have missing
data (and other errors) such that use of multiple identifiers is preferable.
Case 2:13-cv-00193 Document 600-1 Filed in TXSD on 09/16/14 Page 72 of 122

71
161. The use of multiple identifiers avoids non-matching arising from a field being
missing in one database. For example, one matching combination I used includes only
Address, Date of Birth, and Gender. Because there are no Name elements in this
identifier, missingness in name will not make a match impossible.
162. Using multiple indicators avoids non-matches arising from a field being missing in
one database but not in other databases. If one field is missing, no identifier is created
for purposes of matching for any indicator that relies on that field. If that occurs in
TEAM no match is attempted for that identifier. If that occurs in an identification
database, no match occurs for that record. However, we match on multiple identifiers
and there is always at least one identifier that does not rely on a given field. For
example, the combination of Address, Gender, Date of Birth that I use does not rely on
Name, so missingness in name does not mean a match is impossible.
c. Inconsistencies in Fields between Databases
163. Professor Hood states that inconsistencies in fields across databases can lead to
incorrect NO MATCH. On page 20 of his report, Professor Hood provides the example
of a person who is recorded with the name JIM SMITH in one file and JAMES SMITH
and the same DATE OF BIRTH, ADDRESS, and GENDER on both files.
164. The algorithm used was developed to avoid this and similar problems. The
variations built into the matching combinations avoid non-matches that would arise from
Case 2:13-cv-00193 Document 600-1 Filed in TXSD on 09/16/14 Page 73 of 122

72
a wide variety of issues, such as variations in first names and nicknames, hyphenated or
multiple last names, variations in recording of addresses.
165. In the particular example Professor Hood offers, the algorithm would have found a
match because certain matching combinations do not include first name, while others do
not include any name element at all.
166. Professor Hood offers no other examples of potential problems, nor any assessment
of the likely frequency of such problems.
d. Errors in Fields
167. Errors in fields might also create inconsistencies between analogous fields in
databases. Here again, the use of multiple indicators ensures that typographical and other
errors in fields do not prevent matches from occurring. A typographical error in, say, ZIP
code, would not prevent a match on Date of Birth, Gender, and Name.
168. Professor Hood provides the example of the high frequency of birthdates on the first
date of the month or on November 11. But identifiers that do not use Date of Birth, such
as Address, Gender, and Name will still link match these records, even when there are
errors in Dates of Birth.
e. Deceased Fields Do Not Identify All Deceased Persons
Case 2:13-cv-00193 Document 600-1 Filed in TXSD on 09/16/14 Page 74 of 122

73
169. Our approach to deceased individuals is to take the State of Texas databases at face
value, and then to conduct additional analyses using Catalist identifiers for the likely
deceased. After matching has occurred, I use all DPS indicators for deceased persons to
remove from the set of TEAM records to be analyzed all individuals matched to records
DPS has marked as deceased.
170. In additional analyses, we further remove individuals that Catalist identifies as
likely deceased. These additional analyses test the sensitivity of results to Deceased
persons and other forms of obsolete records, and they show that deceased records do not
affect inferences concerning racial differences in rates with which NO MATCH is found
between TEAM and identification databases.
171. Professor Hood offers no evidence deceased individuals remain on the rolls after
our matching process or after the incorporation of information from Catalist, nor that any
such records bias the racial disparities found.
f. No Race or Ethnicity on Database
172. The fact that race is not on the voter files does not preclude analyses of racial
disparities in election laws. I approach this matter two ways: using ecological regression
and Census data on race and using classification of race of individual records on TEAM
provided by Catalist. Ecological Regression analysis is a well established and accepted
Case 2:13-cv-00193 Document 600-1 Filed in TXSD on 09/16/14 Page 75 of 122

74
methodology for using aggregate election and racial data, say at the level of block groups
or voting tabulation districts, to estimate the behavior of various racial groups. In
Thornburg v. Gingles 478 US 30 (1986), the Supreme Court established that ecological
regression is an acceptable form of evidence in questions arising under section 2 of the
Voting Rights Act. Ecological regression using Census racial data shows statistically
significant differences in rates of NO MATCH among racial groups.
173. Race is on the voter files in only 9 states, but not Texas. In lieu of individuals’
self-reported race, I analyze data on the likely race of individuals provided by Catalist,
LLC. Analysis of that information shows significant differences in the rates of NO
MATCH among racial groups, consistent with the conclusions of Ecological Regression
analyses.
174. The State of Texas makes its own race-related variable, in Spanish Surname Voter
Registration (SSVR). That indicator is on the voter files. We analyze SSVR versus
other records and find a racial disparity between those identified as Hispanic (Spanish
Surname) are less likely to have a matching record on an identification database than are
other registered voters. Also the NO MATCH rate for SSVR is quite similar to that
found using the analysis of Census racial data and Catalist racial data.
Case 2:13-cv-00193 Document 600-1 Filed in TXSD on 09/16/14 Page 76 of 122

75
g. No Post Estimation Validation
175. Professor Hood states that I reported no analysis of potential false positives and
false negatives in the matching process. He does not specify what exact analysis ought to
be done, nor does he offer an analysis and evidence indicating why he thinks there may
be an unusual number of false positives and false negatives.
176. In developing the algorithm for the primary matches, I did perform post estimation
validation. I used matches to SSN9 as a “unique identifier” against which to test the
accuracy of the primary matches using combinations of Address, Date of Birth, Gender,
and Name. For the subset of records with SSN9 on TEAM (approximately half of the
records), I examined cases that had SSN9 and for which there was NO MATCH between
TEAM and a DPS record using combinations of Address, Date of Birth, Gender, and
Name. That is, to test the validity of the Primary Matching algorithm, I conducted those
matches for cases with SSN9. I then rematched the cases to DPS using SSN9, and
calculated the percent of cases for which no Primary Match could be found but for which
there was an SSN9 match.
177. In preliminary analyses approximately 5 percent of these NO MATCH records had
a match to DPS on SSN9. Matching on SSN9 (approximately half of cases), matching
on Texas DL (a primary match but not used for the validation), and matching on
secondary matches using combinations of Name, Address, and SSN4 would reduce that
number further.
Case 2:13-cv-00193 Document 600-1 Filed in TXSD on 09/16/14 Page 77 of 122

76
178. I conducted this analysis again with the complete TEAM and DPS data and with
clarification of the license surrendered field on September 10, 2014. Again, I restrict the
analysis to the subset of records on TEAM that have an SSN9 and for which validation of
the matching algorithm is possible. First I examined the set of records for which there
was a match using SSN9 and ascertained how many failed to match to have a primary
match using Address, Date of Birth, Gender and Name. Of the 5,384,916 records that
match on SSN9 between TEAM and DPS, 2.5 percent were not matched using Address,
Date of Birth, Gender and Name between TEAM and DPS. I further examined the set of
cases for which there was a primary match using Address, Date of Birth, Gender, and
Name. Of the 5,368,831 records on TEAM that match to one of the primary indicators
using Address, Date of Birth, Gender, and Name between TEAM and DPS, 2.2% were
matched using SSN9 to link records between TEAM and DPS. Hence, the Address, Date
of Birth, Gender, and Name combinations could accurately match 97.5 percent of records
(using SSN9 as the benchmark for validation). By comparison, SSN9, which is often
relied on as a unique identifier, could match 97.8 percent of records (using Address, Date
of Birth, Gender, and Name primary matches as a benchmark for validation. In other
words, the primary matches on combinations of Address, Date of Birth, Gender, and
Name are almost the functional equivalent to matching on SSN9. See Table X.1.
179. The rate at which the primary sweeps using Address, Date of Birth, Gender, and
Name combinations yield NO MATCH but for which a matching SSN9 exists is
extremely low. It is lower, for example, comparable to the rates reported in the article of
Case 2:13-cv-00193 Document 600-1 Filed in TXSD on 09/16/14 Page 78 of 122

77
Professors Hood and Bullock on the Georgia ID law for 2008 (98.2%), and much lower
than the figure they report for 2004 (78.5%).
180. The rate at which the primary sweeps using Address, Date of Birth, Gender, and
Name combinations yield NO MATCH but for which a matching SSN9 exists is lowered
further upon using DPS ID in the primary matches, upon conducting secondary matches,
including SSN9, and upon using the federal data. It is also worth noting that not all of
the cases in this small subset of NO MATCHES are erroneous. Some of these NO
MATCHES may reflect discrepant information on TEAM and DPS that would make it
difficult to authenticate the person at the voting place, such as a name change and missing
Date of Birth, or a change in name and address.
3. Analyses of the No Match List
NOTE: This section (paragraphs 181-92) was not revised following the correction
on September 9 2014, by the State of Texas concerning the treatment of the license
surrender field on DPS databases.
a. NO MATCH records with State IDs
181. Professor Hood presents an estimate of the number and fraction of cases on the NO
MATCH list with a DPS ID. This is meant to suggest that these are cases that should
Case 2:13-cv-00193 Document 600-1 Filed in TXSD on 09/16/14 Page 79 of 122

78
have been matched, but were not. Professor Hood does not provide evidence that any of
these records were in fact found on the DPS lists and had valid ID.
182. A breakdown of the NO MATCH list reveals that 90 percent of these cases
affirmatively do not have a valid SB 14 ID. The remaining 10 percent could not be found
on the DPS list.
183. Of the 786,727 records on the NO MATCH list, 446,180 have a DPS ID number
(e.g., a driver license or state ID) and 340,551 have no DPS ID number. That is 56.7%
have a DPS ID number.
184. Of the 446,180 with a DPS ID, 226,054 records have an expired ID and 220,126
have a non-expired ID.
185. Of the 220,126 on the NO MATCH list who have a non-expired ID, 138,081 were
originally on the MATCHED using the January 2014 list but were determined after
receiving additional information provided by the State of Texas in July to have a card
status or license surrender status indicating that the individual does not currently posses
the driver license or personal ID associated with that particular record.
186. The remaining 82,045 records had a DPS ID number on TEAM and were classified
as NO MATCH. I searched for the DPS ID number and the SSN9 (for those that had
one) in the DPS file and determined that none of these cases match to the DPS file using
Case 2:13-cv-00193 Document 600-1 Filed in TXSD on 09/16/14 Page 80 of 122

79
the DPS ID, SSN9, or on any sweep using the algorithm I developed. I performed a
visual inspection of the databases of 100 randomly selected cases from these lists for
similar names and other identifying information and did not find any similar records.
187. There are several reasons why these people would have a DPS ID and not be on the
DPS. A non-exhaustive list includes the following: (1) The underlying DPS record
may have been purged, perhaps because they were no longer valid and were removed as
deadwood from DPS. (2) The DPS records provided to me may not be complete. There
might, for example, be a programming problem in the creation of the file using DPS, as
occurred in January. (3) There might be typographical errors in the DL number (though,
if that alone were the cause, the other matching sweeps likely would have caught some of
these records).
188. Hence, of the 786,727 persons on the NO MATCH list, 340,551 (45.3%) do not
have a record of a DPS ID on TEAM. Of those that do have a DPS ID on TEAM,
220,126 have an expired DPS ID, 138,081 have a problem with the DPS ID such as a
surrendered license, and 82,045 have a DPS ID according to TEAM but are not evidently
on the DPS file.
189. These records, then, appear to be genuine records of NO MATCH because they
have no ID, have no valid ID, or are not included in the DPS dataset.
Case 2:13-cv-00193 Document 600-1 Filed in TXSD on 09/16/14 Page 81 of 122

80
b. 2013 and 2014 Turnout
NOTE: This section was not revised following the correction in September, 2014, by the
State of Texas concerning the treatment of the license surrender field on DPS databases.
190. Professor Hood analyzes turnout data for 2013 and 2014 among the records on the
NO MATCH list. Approximately 7 percent of records on the NO MATCH list using the
January 2014 data were determined to have voted in an election in 2013 or 2014.
191. I examined the number and percent of records on the NO MATCH list that voted
in the 2014 Primary and Primary-Runoff election, after re-doing the matching algorithm
with the supplemental data provided by the State of Texas. Of the 786,727 records on
the NO MATCH file (after removing deceased records) 27,769 (3.5 percent) are recorded
as having voted in the 2014 Primary and 12,994 (1.7 percent) are recorded as having
voted in the 2014 Run-off election. 22,387 (2.8 percent of the NO MATCH) voted in
person rather than absentee.
192. There are a variety of explanations that are possible for these cases. Including:
Individuals may have updated their registration records between January and the election
dates; they may have obtained a new license in that interval; they may have had
unmatchable records; poll workers may have let these individuals vote without the
required ID. 20 percent voted absentee by mail.
Case 2:13-cv-00193 Document 600-1 Filed in TXSD on 09/16/14 Page 82 of 122

81
B. Response to the Report by Professor Milyo
193. Professor Milyo begins his discussion of my analysis of record linkage and
matching of the State of Texas voter registration records with an assessment of the
existing research on the subject. In paragraph 21 he states that he is “unaware of any
scholarly studies that analyze the effects of voter ID by examining ‘non-matches’
between a state voter registration database and external databases.” (See also paragraph
22.) This statement is incorrect. The article by Professors Hood and Bullock, “Much
Ado About Nothing? An Empirical Assessment of the Georgia Voter Identification
Statute,” performs exactly such a record linkage and matching process in order to
determine the number of non-matching records between the voter registration records and
the Drivers License files in the state of Georgia.44
194. Professor Milyo’s specific critiques of the matching process are summarized in
paragraph 22 of his report:
“It is well known that state registration databases contain errors and that in general counts
from such databases exaggerate the actual number of eligible and currently registered
voters.” (Paragraph 22) He references my research on this subject, which relies on
database errors identified by Catalist. And as support for his conjecture states that “[i]t
is for this reason that much of the scholarly research on voter turnout in the United States
44 Professor Milyo’s report references this as Legislative Studies Quarterly in the citation in footnote 112 on page 33. The article appears in State Politics and Policy Quarterly 12 (2012): 394-414.
Case 2:13-cv-00193 Document 600-1 Filed in TXSD on 09/16/14 Page 83 of 122

82
eschews measures of turnout as a percent of registered voters and instead examines
turnout relative to voting age population (VAP), citizen voting age population (CVAP),
or eligible voting age population (VEP).”
195. As discussed in the Overview and below, the analyses performed examine whether
conclusions drawn using only the official State of Texas and federal databases to
determine valid registrations are altered once potentially invalid cases, as identified by
other data sources, are removed. In particular, one set of identifiers of potential
deadwood, movers, and deceased individuals comes from Catalist, and is the source of
the assessment of problematic records on registrations. My report and the analyses in the
preceding part of this supplemental report show that the conclusions about the relative
racial disparities in rates of non-matching are not sensitive to indicators of deadwood.
196. Professor Milyo states that political scientists “eschew measures of turnout as a
percent of registered voters.” This is is untrue. Registration lists are widely used in
research on turnout, and turnout as a percent of registrations is a commonly used measure
of participation rates. A sampling of applications of the use of registration lists for
participation research includes: measures of turnout rates overall and of minority groups,
in research nationwide and on the state of Texas,45 turnout rates in local areas,46 effects
45 Daron Shaw, Rudolfo O. de la Garza, and Jongho Lee, “Examining Latino Turnout in 1996: A Three-State, Validated Survey Approach,” American Journal of Political Science 44 (2000): 338-346. 46 James G. Gimpel, Joshua J. Dyck, Daron R. Shaw, “Registrants, Voters, and Turnout Variability Across Neighborhoods,” Political Behavior 26 (2004): 343. See esp. page 348.
Case 2:13-cv-00193 Document 600-1 Filed in TXSD on 09/16/14 Page 84 of 122

83
of election laws,47 effects of political campaigns on participation,48 and as the official list
of registered persons for purposes of drawing random sample surveys. On the last point,
research by Professors Donald Green and Alan Gerber finds that registration based
sampling provides more accurate forecasts of future election results than does traditional
sampling procedures.49
197. Professor Milyo’s central concern is with the amount of “deadwood” on the
registration lists. He offers no direct examination of actual voter records to determine
the number of such records. In paragraphs 23 to 25, he calculates the rate of deadwood
two ways. First, he compares the registration rate for the state of Texas based on the
number of records on the voter registration lists divided by the American Community
Survey (ACS) estimate of the Citizen Voting Age Population with the Current Population
Survey (CPS) estimate of the percent of voting age citizens who are registered as reported
in the November supplement of the CPS. Second, he assumes over reporting of
registration and deflates the CPS registration number and inflates his estimate of
deadwood.
47 Priscilla L. Southwell and Justin Burchett, “The Effect of All-mail Elections on Voter Turnout,” American Politics Research 28 (2000): 79-79 48 Alan S. Gerber, James G. Gimpel, Donald P. Green, and Daron R. Shaw, “How Large and Long-lasting Are the Persuasive Effects of Televised Campaign Ads? Results from a Randomized Field Experiment” American Political Science Review 105 (2011): 135-150. 49 Donald R. Green and Alan S. Gerber, “Can Registration-Based Sampling Improve the Accuracy of Midterm Election Forecasts?” Public Opinion Quarterly 70 (2006): 197-223.
Case 2:13-cv-00193 Document 600-1 Filed in TXSD on 09/16/14 Page 85 of 122

84
198. In paragraph 23 he calculates that there is an 8.3 percentage point difference
between the official records and the CPS reports (81.2 percent versus 72.9 percent).
199. He offers no statistical assessment, or standard error with this figure, even though
the CPS is a random sample of a few thousand people of each state’s population and,
thus, is estimated with uncertainty. The CPS figure, then, is itself an uncertain number.
No margin of error is reported with his projected number of Deadwood.
200. In making his assessment of the amount of deadwood, he makes no assessment of
which records are likely Deadwood or offers remedies for questionable records on the
registration files so that a correct assessment the matching algorithm can be conducted
201. In paragraph 25 he states that there may be reporting problems with the CPS. This
claim, of course, weakens the conjecture that the CPS should be taken as the measure of
actual registration or turnout. Further, he assumes that those reporting problems take the
form of over estimation of actual registration. No statistical evidence of the actual
amount of over reporting in CPS is presented.
202. Professor Milyo offers a range of potential deadwood from 0 to 24 percent. This is
a very wide interval for an estimate, and suggests that this methodology for measuring
the amount of deadwood is not very precise. Also, no standard errors (measures of
uncertainty of the estimate) are presented.
Case 2:13-cv-00193 Document 600-1 Filed in TXSD on 09/16/14 Page 86 of 122

85
203. Taking the interval 0 to 24 as an interval estimate of the possible true underlying
rate of deadwood, his methodology does not appear to reject the hypothesis that the true
rate of deadwood is 0. Zero is in the interval of potential values estimated using his
methodology. It may be that Professor Milyo does not intend to construct such an
interval estimate using his methodology, but, if that is the case, it is unclear what
statistical inferences can be drawn from the analyses presented.
204. Professor Milyo’s calculation is uninformative about the rates of NO MATCHES.
It is simply an estimate of deadwood. It has no information about the rate with which
records on TEAM match to records on state and federal identification databases. It is
possible that all of his potential deadwood cases in fact MATCH to an identification
database.
205. Professor Milyo claims in paragraph 15 on page 3 that the racial effects are biased
upward in my analysis resulting from database matches, but he provides no evidence to
that effect. Specifically, he provides no estimate of the amount of Deadwood or resulting
biases by racial group.
206. My analysis of the TEAM data is sensitive to the possibility that some of the
records are obsolete, individuals who have moved, or deceased. The database process,
as described, removes all individuals identified as deceased using the information on the
State of Texas DPS files. Again, as stated in my original report, I take the State of Texas
databases as the official record of registered voters and holders of identifications. To
Case 2:13-cv-00193 Document 600-1 Filed in TXSD on 09/16/14 Page 87 of 122

86
examine whether the inferences drawn are sensitive to potential deadwood, I impose
various filters for potential deadwood, using indicators from TEAM, DPS, and Catalist.
These are: Suspense Voters on TEAM; Expired IDs on DPS; Catalist indicators of
Deadwood, Deceased, and NCOA from Catalist. These indicators may be over inclusive
in classifying deadwood. For example, some registrants on the Suspense list vote in the
next election. So analyses with these indicators erred on the side of excluding too many
cases as deadwood rather than too few.
Case 2:13-cv-00193 Document 600-1 Filed in TXSD on 09/16/14 Page 88 of 122

87
X. Conclusion
207. This analysis has found statistically significant and robust racial differences in the
rate with which registered voters in the TEAM database fail to match to records in state
and Federal databases of people with photo identification required for voting under SB
14. The results in Table VI.1 show that 2 percent of Anglos DO NOT MATCH to
applicable SB 14 identification databases, compared with 8 percent of Blacks and 6
percent of Hispanics. The results are strikingly similar in analyses relating Census racial
data to the incidence of NO MATCH and in analyses relating individual level data on NO
MATCH and to Catalist estimates of individual race. Those differences persist when I
consider eligibility for exemption, alternative definitions of the pool of registered voters,
and alternative racial classifications (such as SSVR). The observed differences imply
that Black and Hispanic registered voters are significantly less likely than Anglo
registered voters to possess applicable SB 14 ID or qualify for an exemption under the
law.
Case 2:13-cv-00193 Document 600-1 Filed in TXSD on 09/16/14 Page 89 of 122

I declare under penalty of perjury that the foregoing is true andcorrect. Executed this 16th day of September, 2014.
_____________________________________Stephen D. Ansolabehere
Case 2:13-cv-00193 Document 600-1 Filed in TXSD on 09/16/14 Page 90 of 122

88
TABLES
Table V.1. Combinations of Fields Used as Matching Identifiers Combination Code
PRIMARY MATCHES
A First Name + Last Name + Gender + DOB + Residential ZIP + Residential Street Number
B Last Name + Gender + DOB + Residential ZIP + Residential Street Number
C Gender + DOB + Residential ZIP + Residential Street Number
D First Name + Last Name + Date of Birth + Residential ZIP + Residential Street Number
E First Name + Last Name + Gender + Residential ZIP + Residential Street Number
F First Name + Last Name + Gender + DOB M Texas Driver License Number (where available)
SECONDARY MATCHES
G First Name + Middle Initial + Last Name + DOB H Last 4-Digit SSN + DOB + Residential ZIP I Last 4-Digit SSN + First Name + Last Name + DOB K First Name + Last Name 1 + Middle Initial + DOB L First Name + Last Name 2 + Middle Initial + DOB SSN 9-Digit Social Security Number
Case 2:13-cv-00193 Document 600-1 Filed in TXSD on 09/16/14 Page 91 of 122

89
Matching Combinations Texas DPS Databases
Primary Sweeps (All TEAM records)
Combination A: First name + Last name + Gender + DOB + Street number + ZIP Combination B: Last name + Gender + DOB + Street number + ZIP Combination C: Gender + DOB+ Street number + ZIP
Combination D: First name + Last name + Street number + ZIP Combination E: First name + Last name + Gender + Street number + ZIP Combination F: First name + Last name + DOB + Gender Combination M: Texas Driver License Number
Secondary Sweeps (TEAM records with no primary match)
Combination G: First name + Last name + Middle Initial + DOB Combination H: DOB + ZIP + SSN4 Combination I: First name + Last name + DOB + SSN4 Combination K: First name + Last name 1 + Middle Initial + DOB Combination L: First name + Last name 2 + Middle Initial + DOB50 SSN: 9-digit Social Security Number
Federal Identification and Disability Databases
Primary Sweeps (All TEAM records against Federal records with a Texas address)
Same as primary sweeps for DPS databases, except for Texas Driver License Number (Combinations A-F)
Secondary Sweeps (TEAM records with no primary match against Federal records with a Texas address)
Same as secondary sweeps for DPS databases (Combinations G-L and SSN)
Nationwide Sweeps (TEAM records with no primary or secondary match against nationwide Federal records)
All sweeps without address criteria (Combinations F, G, I, K, L, and SSN)
50 “Last name 1” is the first half of a hyphenated last name, and “Last name 2” is the second half of a hyphenated last name. Combinations K and L in TEAM are each matched against Combination G, Combination K, and Combination L in the identification and disability databases for a total of six matching sweeps.
Case 2:13-cv-00193 Document 600-1 Filed in TXSD on 09/16/14 Page 92 of 122

90
Table V.2. Number of Matches of TEAM Records to State and Federal Databases Overall and By Racial Group, using Catalist Racial Estimates (Percent of TEAM Records that Match to a Given ID or Disability Database) Database Race State of Texas ID Databases
White Black Hispanic Other All
Driver License
7,567,441 (91.3%)
1,343,250 (78.1%)
2,511,871 (82.2%)
448,042 (90.9%)
11,872,604 (87.5%)
Personal ID 425,399 (5.1%)
315,682 (18.4%)
499,103 (16.3%)
29,429 (5.1%)
1,269,613 (9.4 %)
Concealed Handgun License
588,087 (7.1%)
57,129 (3.3%)
72,953 (2.4%)
14,839 (3.0%)
733,008 (5.4%)
EIC 69 43 51 0 163 Federal ID Databases
DOS 3,776,207 (45.5%)
424,682 (24.7%)
1,151,608 (37.7%)
378,666 (76.8%)
5,731,163 (42.3%)
DOD 427,191 (5.2%)
81,688 (4.8%)
116,460 (3.8%)
13,015 (2.6%)
638,354 (4.7%)
USCIS 106,051 (1.3%)
45,005 (2.6%)
373,576 (12.2%)
210,454 (42.7%)
735,086 (5.4%)
VHA (VIC) 186,695 (2.3%)
49,179 (2.9%)
57,635 (1.9%)
2,496 (0.5%)
296,005 (2.2%)
Federal Disability Databases
SSA: Disability
419,065 (5.1%)
167,980 (9.8%)
202,368 (6.6%)
14,925 (3.0%)
804,338 (5.9%)
VBA: Disability
118,883 (1.4%)
31,952 (1.9%)
35,743 (1.2%)
1,938 (0.4%)
188,516 (1.4%)
Case 2:13-cv-00193 Document 600-1 Filed in TXSD on 09/16/14 Page 93 of 122

91
Table V.3.A Total Records and Records for which a Match or No Match was found to Any Federal or Any State Identification Database using DOJ Algorithm* (includes cases DPS flags as deceased)
ANY FEDERAL RECORD
ANY STATE RECORD
No Match to a Federal ID
Match to a
Federal ID ALL
No Match to State ID
622,527 288,308 910,835
Match to State ID 6,615,749 6,037,814 12,653,563
ALL
7,238,276 6,326,122 13,564,398
* Individuals who have successfully applied for a disability exemption are counted as having matched. Table V.3.B Total Records and Records for which a Match or No Match was found to Any Federal or Any State Identification Database using DOJ Algorithm*, Excluding cases DPS flags as deceased
ANY FEDERAL RECORD
ANY STATE RECORD
No Match to a Federal ID
Match to a
Federal ID ALL
No Match to State ID
608,470 285,466 893,936
Match to State ID 6,573,924 6,019,716 12,593,640
ALL
7,182,394 6,305,182 13,487,576
* Individuals who have successfully applied for a disability exemption are counted as having matched.
Case 2:13-cv-00193 Document 600-1 Filed in TXSD on 09/16/14 Page 94 of 122

92
Table V.4.A Total Records and Records for which a Match or No Match was found to Any Federal or Any State Identification Database or any Federal Disability Database using DOJ Algorithm* (includes cases DPS flags as deceased)
ANY FEDERAL RECORD
ANY STATE RECORD
No Match to a Federal ID or
Disability
Match to a
Federal ID or Disability
ALL
No Match to State ID
548,387 362,448 910,835 Match to State ID 6,102,327 6,551,236 12,653,563 ALL
6,650,714
6,913,684 13,564,398
* Individuals who have successfully applied for a disability exemption are counted as having matched. Table V.4.B Total Records and Records for which a Match or No Match was found to Any Federal or Any State Identification Database or any Federal Disability Database using DOJ Algorithm* Excluding cases DPS flags as deceased
ANY FEDERAL RECORD
ANY STATE RECORD
No Match to a Federal ID or
Disability
Match to a
Federal ID or Disability
ALL
No Match to State ID
534,512 359,424 893,936 Match to State ID 6,062,306 6,531,334 12,593,640 ALL
6,596,818
6,890,758 13,487,576
* Individuals who have successfully applied for a disability exemption are counted as having matched.
Case 2:13-cv-00193 Document 600-1 Filed in TXSD on 09/16/14 Page 95 of 122

93
Table VI.1. Estimated Percent No Match By Racial Group Using Census Racial Data: Ecological Regression Analyses of ACS CVAP and No Match Percent at Block-Group Level
Ecological Regression* Homogeneous Block
Groups***
Racial Group Estimated % No Match
(Margin of Error)
Estimated % No Match
(Margin of Error)
Anglo 2.0%
(± 0.1%)
3.1%
(± 0.2%)
[N of Block Groups = 4,224]
Black 8.1%
(± .2%)
11.5%
(± 0.4%)
[N of Block Groups = 465]
Hispanic 5.9%
(± .2%)
8.6%
(± 0.4%)
[N of Block Groups = 1,554]
Gross Percentage Point Disparity
in Rate of NO MATCH Black % - Anglo %
6.1% 8.4%
Hispanic % – Anglo %
3.9% 5.5%
Percent Difference in Rate of NO MATCH
(Black %-Anglo %)/ Anglo %
305% 271%
(Hispanic %-Anglo %)/ Anglo %
195% 177%
* Number of Cases = 15,673 R-square = .354 ** Level of analysis: Block Group; Dependent variable: Number NO MATCH in Block Group divided by ACS CVAP Estimate in Block Group; Multiple Regression of Percent CVAP Registered on HCVAP Percent and BCVAP Percent; Weighted by CVAP. *** Homogeneous block groups are areas in which at least 80 percent of the CVAP is of a given population.
Case 2:13-cv-00193 Document 600-1 Filed in TXSD on 09/16/14 Page 96 of 122

94
Table VI.2. NO-MATCH and MATCH Percent By Racial Group, Using Catalist Racial Classification*
Race NO-MATCH MATCH ALL
Anglo 296,156
(3.6%)
7,949,860
(96.4%) 8,246,016
Black 127,908
(7.5%)
1,579,861
(92.5%) 1,707,769
Hispanic 174,715
(5.7%)
2,867,782
(94.2%) 3,042,497
Other 9,691
(2.0%)
481,621
(98.0%) 491,312
All 608,470
(4.5%)
12,879,124
(95.5%) 13,487,594
Gross Percentage Point Disparity
Black% – Anglo%
3.9
Hispanic% – Anglo%
2.1
Percent Difference
in Rate of NO MATCH
(Black%-Anglo%) /Anglo%
108%
(Hispanic% - Anglo %) /Anglo%
58%
* Baseline Universe: All Registration Records in TEAM less records indicated as Deceased by State of Texas Database
Case 2:13-cv-00193 Document 600-1 Filed in TXSD on 09/16/14 Page 97 of 122

95
Table VI.3.A. Rate of NO-MATCH/NOT EXEMPTION ELIGIBLE/Not Age Vote-by-Mail Eligible By Racial Group, Using Ecological Regression*
RACE NO MATCH / Not Exemption
Eligible
NO MATCH / Not Age Vote-By-Mail
Eligible
NO-MATCH/ NOT EXEMPTION
ELIGIBLE/ Not Age Vote-by-Mail
Eligible
Anglo 1.8%
(+/- 0.1) 1.2%
(+/- 0.04) 1.1%
(+/- 0.05)
Black 6.4%
(+/- 0.2) 6.4%
(+/- 0.2) 5.1%
(+/- 0.1)
Hispanic 5.3%
(+/- 0.2) 4.8%
(+/- 0.1) 4.3%
(+/- 0.1)
N
15,673 15,673
15,673 R-Squared
.416
.397
.392
Gross Percentage Point Disparity
Black% – Anglo% 4.6% 5.2% 4.0%
Hispanic% – Anglo% 3.5% 3.6% 3.2%
Percent Difference in Rate of NO MATCH
(Black%-Anglo%) /Anglo%
256% 433% 364%
(Hispanic% - Anglo %) /Anglo%
194% 300% 291%
* Baseline Universe: All Registration Records in TEAM less records indicated as Deceased by State of Texas Database
Case 2:13-cv-00193 Document 600-1 Filed in TXSD on 09/16/14 Page 98 of 122

96
Table VI.3.B. NO-MATCH/NOT EXEMPTION ELIGIBLE/Not Age Vote-by-Mail Eligible By Racial Group, Using Catalist Racial Classification*
RACE NO MATCH / Not Exemption
Eligible
NO MATCH / Not Age Vote-By-Mail
Eligible
NO-MATCH/ NOT EXEMPTION
ELIGIBLE/ Not Age Vote-by-Mail
Eligible
Anglo 260,749 (3.2%)
190,703 (2.3%)
166,220 (2.0%)
Black 107,193 (6.3%)
98,532 (5.8%)
82,525 (4.8%)
Hispanic 157,473 (5.2%)
133,195 (4.4%)
121,312 (4.0%)
Other 9,097 (1.9%)
7,339 (1.5%)
6,928 (1.4%)
All 534,512 (4.0%)
429,769 (3.2%)
376,985 (2.8%)
Gross Percentage Point Disparity
Black% – Anglo% 3.1% 3.5% 2.8%
Hispanic% – Anglo% 2.0% 2.1% 2.0 %
Percent Difference in Rate of NO MATCH
(Black%-Anglo%) /Anglo%
97% 152% 140%
(Hispanic% - Anglo %) /Anglo%
63% 91% 100%
* Baseline Universe: All Registration Records in TEAM less records indicated as Deceased by State of Texas Database
Case 2:13-cv-00193 Document 600-1 Filed in TXSD on 09/16/14 Page 99 of 122

97
Table VI.4.A. Percent NO MATCH Among Those Who Voted in 2010 or 2012*, Using Ecological Regression
RACE 2010
2012
Anglo 0.8%
(+/-0.1)
0.6%
(+/-0.04)
Black 3.3%
(+/-0.2)
4.2%
(+/-0.2)
Hispanic 1.9%
(+/- 0.1)
2.0%
(+/-0.1)
N
15,652 15,669
R-Squared
.094 .242
Gross Percentage Point Difference
Black% – Anglo% 2.5%
3.6%
Hispanic% – Anglo% 1.1%
1.4%
Relative Rate of NO MATCH
(Black %- Anglo%) /Anglo %
313%
600%
(Hispanic% - Anglo %) /Anglo%
138%
233%
* Universe: All Registration Records in TEAM less records indicated as Deceased by State of Texas Database. All estimates weight Block Groups by the number of Citizen Voting Age Persons.
Case 2:13-cv-00193 Document 600-1 Filed in TXSD on 09/16/14 Page 100 of 122

98
Table VI.4.B. Percent NO MATCH and NO MATCH/NOT EXEMPTION ELIGIBLE Among Those Who Voted in 2010 or 2012*, Using Catalist Racial Data
NO MATCH NO MATCH /
NOT EXEMPTION ELIGIBLE
RACE 2010 2012 2010 2012
Anglo 39,940
(1.2%)
58,502
(1.1%)
35,047
(1.0%)
49.428
(0.9%)
Black 13,324
(2.6%)
31,218
(3.1%)
10,733
(2.1%)
24,871
(2.5%)
Hispanic 12,381
(1.9%)
23,881 (1.8%)
10,259
(1.6%)
19,932
(1.5%)
Other 683
(0.7%)
1,164
(0.5%)
627
(0.6%)
1,031
(0.5%)
All 66,328
(1.4%)
114,765
(1.5%)
56,666
(1.2%)
95,262
(1.2%)
Gross Percentage Point Disparity
Black% – Anglo%
1.4% 2.0% 1.1% 1.6%
Hispanic% – Anglo%
0.7% 0.7% 0.6% 0.6%
Percent Difference in Rate of NO MATCH
(Black%-Anglo%) /Anglo%
117% 182% 110% 156%
(Hispanic% - Anglo %) /Anglo%
58% 64% 60% 67%
* Universe: All Registration Records in TEAM less records indicated as Deceased by State of Texas Database
Case 2:13-cv-00193 Document 600-1 Filed in TXSD on 09/16/14 Page 101 of 122

99
Table VII.1.A. Rates of NO MATCHES by Race Under Varying Definitions of the Potential Pool of Registered Voters* Ecological Regressions Using Census Racial Data
Race
Excluding Catalist
Deceased, Deadwood, or
NCOA
Excluding Suspense Voters
From Pool of Registered
Excluding Expired ID
from Pool of Registered
Excluding Catalist Flagged
Records or Suspense Voter or Expired ID
Anglo 1.9%
(+/- 0.1) 1.4%
(+/- 0.1) 0.5%
(+/- 0.05) 0.5%
(+/- 0.05)
Black 8.1%
(+/-0.2) 7.7%
(+/ 0.2) 5.4%
(+/- 0.2) 5.3%
(+/- 0.2)
Hispanic 5.9%
(+/- 0.2) 5.9%
(+/- 0.2) 4.3%
(+/- 0.1)
4.3% (+/- 0.1)
N 15,672 15,670 15,673 15,672
R-Squared .358 .371 .360 .356
Gross Percentage Point Disparity
Black% – Anglo%
6.2% 6.3% 4.9% 4.8%
Hispanic% – Anglo%
4.8% 4.4% 3.9% 3.8%
Percent Difference in Rate of NO MATCH
(Black%-Anglo%) /Anglo%
326% 450% 980% 960%
(Hispanic% - Anglo %) /Anglo%
211% 321% 760% 760%
* Universe: All Registration Records in TEAM less records indicated as Deceased by State of Texas Database. All estimates weight Block Groups by the number of Citizen Voting Age Persons.
Case 2:13-cv-00193 Document 600-1 Filed in TXSD on 09/16/14 Page 102 of 122

100
Table VII.1.B. Rates of NO MATCHES by Race Under Varying Definitions of the Potential Pool of Registered Voters* Using Catalist Racial Data
Race
Excluding Catalist
Deceased, Deadwood, or
NCOA
Excluding Suspense Voters
From Pool of Registered
Excluding Expired ID
from Pool of Registered
Excluding Catalist Flagged
Records or Suspense Voter or Expired ID
Anglo 262,937 (3.5%)
211,815 (2.9%)
125,138 (1.6%)
83,957 (1.3%)
Black 114,151 (7.5%)
99,615 (6.7%)
68,305 (4.2%)
48,533 (3.7%)
Hispanic 158,616 (5.7%)
143,220 (5.2%)
98,355 (3.4%)
74,383 (3.0%)
Others 8,923 (2.0%)
7,289 (1.6%)
5,696 (1.2%)
4,102 (1.0%)
All 544,627 (4.5%)
461,939 (3.9%)
297,494 (2.3%)
210,975 (2.0%)
Gross Percentage Point Disparity
Black% – Anglo%
4.0% 3.8% 2.6% 2.4%
Hispanic% – Anglo%
2.2% 1.3% 1.8% 1.7%
Percent Difference in Rate of NO MATCH
(Black%-Anglo%) /Anglo%
114% 131% 163% 185%
(Hispanic% - Anglo %) /Anglo%
63% 79% 113% 131%
* Universe: All Registration Records in TEAM less records indicated as Deceased by State of Texas Database
Case 2:13-cv-00193 Document 600-1 Filed in TXSD on 09/16/14 Page 103 of 122

101
Table VII.2. Validation of Results With Alternative Racial Classification: Using Records With the Highest Confidence in the Racial Classification*
Race NO MATCH MATCH
Anglo 148,070
(3.1%)
4,667,004
(96.9%)
Black 44,622
(9.3%)
435,390
(90.7%)
Hispanic 71,305
(5.7%)
1,186,034
(94.3%)
Other 3,482
(1.6%)
217,020
(98.4%)
All 267,479
(4.0%)
6,505,448
(96.9%)
Gross Percentage Point Disparity
Black% – Anglo%
6.2%
Hispanic% – Anglo%
2.6%
Percent Difference in Rate of NO MATCH
(Black%-Anglo%) /Anglo%
200%
(Hispanic% - Anglo %) /Anglo%
84%
*Universe: All Registration Records in TEAM Assign a Racial Classification with High Confidence less records indicated as Deceased by State of Texas Database
Case 2:13-cv-00193 Document 600-1 Filed in TXSD on 09/16/14 Page 104 of 122

102
Table VII.3. Validation of Results With Alternative Racial Classification Using Spanish Surname Voter Registrations: Comparison of No-Match rates of Spanish Surname Registered Voters and Others*
Race NO MATCH MATCH
SSVR 177,292
(5.8%)
2,896,334
(95.9%)
Non-SSVR 431,170
(4.1%)
9,982,789
(95.9%)
All
608,462
(4.5%)
12,879,123
(95.5%)
Gross Percentage Point Disparity
SSVR – Non-SSVR
1.7%
Percent Difference in Rate of
NO MATCH
(SSVR – Non-SSVR)/Non-SSVR
41%
* Universe: All Registration Records in TEAM less records indicated as Deceased by State of Texas Database.
Case 2:13-cv-00193 Document 600-1 Filed in TXSD on 09/16/14 Page 105 of 122

103
Table VII.4. Identification Match versus Disability Exemption Eligible* Disability Exemption Eligible
STATE OR FEDERAL ID
No Match to Disability Match to Disability
ALL
No Match
534,512 73,958 608,470
Match 12,006,771 872,353 12,879,124 ALL 12,541,283 946,311 13,487,594
* Universe: All Registration Records in TEAM less records indicated as Deceased by State of Texas Database
Case 2:13-cv-00193 Document 600-1 Filed in TXSD on 09/16/14 Page 106 of 122

104
Table VIII.1a. Percent of Registered Anglos, Hispanics, and Blacks in Catalist Database who Voted in the State of Texas in 2010 and 2012: Current Active and Suspense Voters 2010 2012
% Voted
Number
Voted
Number
Not Voting
% Voted
Number Voted
Number Not Voting
Anglo 41.8% 3,364,053 4,689,493 64.3% 5,169,740 2,874,078
Hispanic 22.0% 655,046 2,320,565 45.0% 1,340,119 1,635,492
Black 31.3% 527,216 1,156,753 59.8% 1,007,153 676,821 Gross Percentage Point Disparity Anglo% Vote- Black%Vote 10.5% 4.5% Anglo% Vote-Hisp% Vote 19.8% 20.3%
Percent Difference in Rate of Anglo Voting Relative to Minority Group Voting
(Anglo % - Black %) /Black %
34% 8%
(Hispanic % - Anglo %) / Hispanic %
90% 43%
Case 2:13-cv-00193 Document 600-1 Filed in TXSD on 09/16/14 Page 107 of 122

105
Table VIII.1b. Percent of Registered Anglos, Hispanics, and Blacks in Catalist Database who Voted in the State of Texas in 2010 and 2012: Current Active Voters Only
2010 2012
%
Voted
Number Voted
Number Not Vote
%
Voted
Number Voted
Number Not Vote
Anglo 44.0% 3,260,374 4,157,144 68.2% 5,056,818 2,360,700
Hispanic 23.1% 636,741 2,121,984 47.6% 1,312,378 1,446,347
Black 33.2% 509,403 1,024,863 63.4% 973,266 561,000
Gross Percentage Point Disparity
Anglo % -
Black % 9.8% 5.2%
Anglo % -Hispanic %
20.9% 20.6%
Percent Difference in Rate of Voting
(Black%-Anglo%) / Black %
33% 8%
(Hispanic% - Anglo %) / Hispanic %
90% 43%
Case 2:13-cv-00193 Document 600-1 Filed in TXSD on 09/16/14 Page 108 of 122

106
Table VIII.2a. Ecological Regression Estimates of Registration as a Percent of Voting Age Population for Anglos, Hispanics, and Blacks in the State of Texas* (95 Percent Confidence Interval in Parentheses)
2006 2008 2010 2012
Anglo** 82.5%
(± 1.0)
87.1%
(± 0.8)
86.0%
(± 0.8)
84.7%
(± 0.8)
Hispanic 55.0%
(± 1.8)
55.0%
(± 1.6)
53.0%
(± 1.4)
50.5%
(± 1.4)
Black 68.5%
(± 1.6)
70.5%
(± 2.8)
76.6%
(± 2.0)
64.7%
(± 2.6) Number of Cases (VTDs)
8660 8660 8660 8660
R-Square
.115 .167 .211 .221
Gross Percentage Point Disparity
Anglo%-Black% 14.0% 16.6% 9.4% 20.0%
Anglo%-Hispanic% 27.5% 32.1% 33.0% 34.2%
Percent Difference in Rate of Anglo Registration Relative to Rate of Minority Registration
(Black%-Anglo%) / Black %
20% 24% 12% 31%
(Hispanic% - Anglo %) /Hispanic %
50% 58% 62% 68%
* Level of analysis: VTD; Dependent variable: Number Registered (on TEAM) divided by CVAP; Weighted by CVAP; Multiple Regression of Percent CVAP Registered on HCVAP Percent and BCVAP Percent. ** Includes Others.
Case 2:13-cv-00193 Document 600-1 Filed in TXSD on 09/16/14 Page 109 of 122

107
Table VIII.2b. Ecological Regression Estimates of Registration as a Percent of Citizen Voting Age Population for Anglos, Hispanics, and Blacks in the State of Texas*(95 percent confidence intervals in parentheses)
2006 2008 2010 2012
Anglo** 83.6%
(± 0.9)
88.0%
(± 0.8)
86.8%
(± 0.7)
87.2%
(± 0.7)
Hispanic 80.7%
(± 2.1)
81.4%
(± 1.9)
79.0%
(± 1.4)
75.7%
(± 1.4)
Black 80.1%
(± 3.0)
81.6%
(± 2.6)
77.0%
(± 2.0)
74.7%
(± 2.5) Number of Cases (VTDs) 8655 8655 8655 8660
R-Square .001 .007 .007 .026
Gross Percentage Point Disparity
Anglo%-Black% 3.4% 6.4% 9.8% 12.6% Anglo%-Hispanic% 2.9% 6.6% 7.8% 11.6%
Percent Difference in Rate of Anglo Registration Relative to Rate of Minority Group Registration
(Black%-Anglo%) /Black %
4% 8% 12% 17%
(Hispanic% - Anglo %) /Hispanic %
4% 8% 10% 15%
* Level of analysis: VTD; Dependent variable: Number Registered (on TEAM) divided by CVAP; Weighted by CVAP; Multiple Regression of Percent CVAP Registered on HCVAP Percent and BCVAP Percent. ** Includes Others.
Case 2:13-cv-00193 Document 600-1 Filed in TXSD on 09/16/14 Page 110 of 122

108
Table VIII.3a. Ecological Regression Estimates of Voting Rates Among Groups as a Percent of Voting Age Population of Anglos, Hispanics, and Blacks in the State of Texas*
( 95 Percent Confidence Interval in Parentheses)
2006 2008 2010 2012
Anglo** 36.4%
(± 0.4)
60.8%
(± 0.6)
40.6%
(± 0.4)
61.1%
(± 0.5)
Hispanic 8.4%
(± 0.7)
19.2%
(± 0.6)
8.5%
(± 0.8)
18.1%
(± 1.0)
Black 12.8%
(± 1.2)
40.2%
(± 1.9)
19.4%
(± 1.3)
39.2%
(± 1.8) Number of Cases (VTDs) 8660 8660 8660 8660
R-Square .398 .392 .442 .431
Gross Percentage Point Disparity
Anglo%-Black% 23.6% 20.6% 21.2% 21.8% Anglo%-Hispanic% 28.0% 41.6% 32.2% 43.0%
Percent Difference in Rate of Anglo Voting Relative to Minority Group Voting
(Black%-Anglo%) /Black %
184% 51% 108% 56%
(Hispanic% - Anglo %) /Hispanic %
333% 217% 378% 238%
* Level of analysis: VTD; Dependent variable: Number Registered (on TEAM) divided by CVAP; Weighted by CVAP; Multiple Regression of Percent CVAP Registered on HCVAP Percent and BCVAP Percent. ** Includes Others.
Case 2:13-cv-00193 Document 600-1 Filed in TXSD on 09/16/14 Page 111 of 122

109
Table VIII.3b. Ecological Regression Estimates of Voting Rates Among Groups as a Percent of Citizen Voting Age Population of Anglos, Hispanics, and Blacks in the State of Texas* (95 Percent Confidence Interval in Parentheses)
2006 2008 2010 2012
Anglo** 36.8%
(± 0.4)
61.6%
(± 0.5)
41.1%
(± 0.4)
61.8%
(± 0.5)
Hispanic 13.2%
(± 0.9)
29.9%
(± 0.6)
13.6%
(± 0.9)
28.8%
(± 1.2)
Black 15.0%
(± 1.2)
44.7%
(± 1.9)
21.8%
(± 1.3)
43.3%
(± 1.8) Number of Cases (VTDs)
8655 8655 8655 8655
R-Square
.273 .212 .296 .244
Gross Percentage Point Disparity
Anglo%-Black% 21.8% 16.9% 19.3% 18.4% Anglo%-Hispanic% 23.6% 31.7% 27.4% 33.1%
Percent Difference in Rate of Anglo Voting Relative to Minority Group Voting
(Black%-Anglo%) /Black %
145% 38% 89% 43%
(Hispanic% - Anglo %) /Hispanic %
179% 106% 202% 115%
* Level of analysis: VTD; Dependent variable: Number Registered (on TEAM) divided by CVAP; Weighted by CVAP; Multiple Regression of Percent CVAP Registered on HCVAP Percent and BCVAP Percent. ** Includes Others.
Case 2:13-cv-00193 Document 600-1 Filed in TXSD on 09/16/14 Page 112 of 122
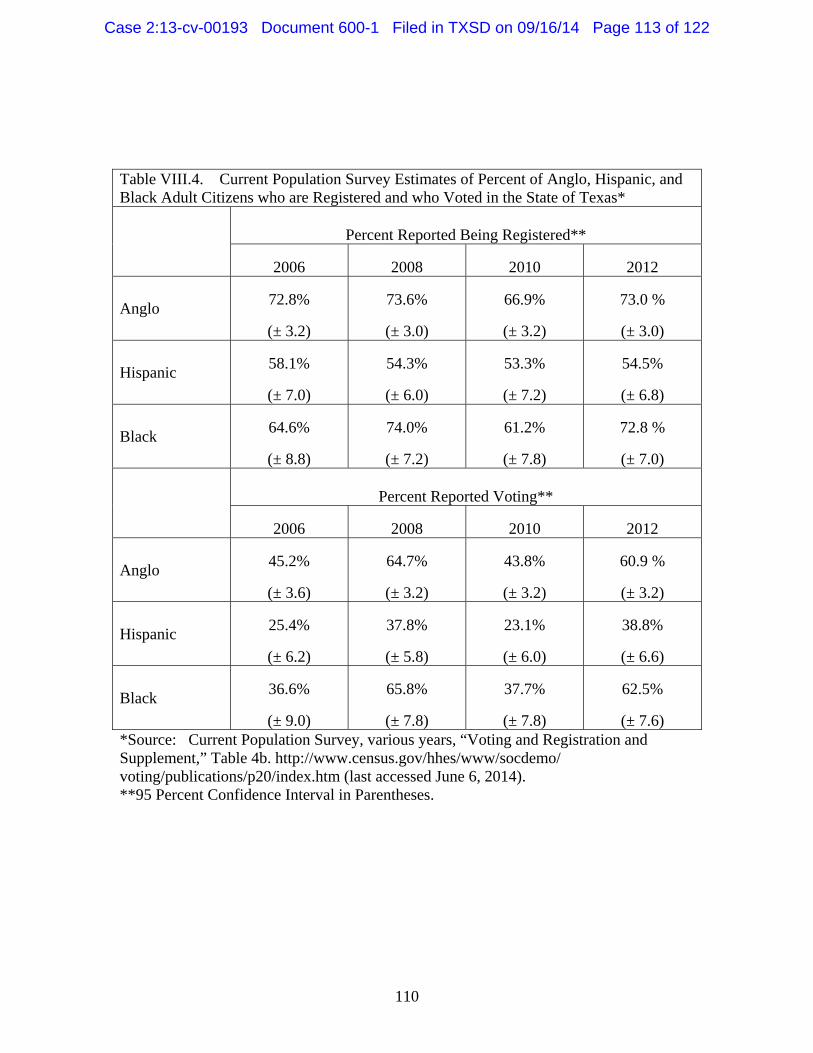
110
Table VIII.4. Current Population Survey Estimates of Percent of Anglo, Hispanic, and Black Adult Citizens who are Registered and who Voted in the State of Texas*
Percent Reported Being Registered**
2006 2008 2010 2012
Anglo 72.8%
(± 3.2)
73.6%
(± 3.0)
66.9%
(± 3.2)
73.0 %
(± 3.0)
Hispanic 58.1%
(± 7.0)
54.3%
(± 6.0)
53.3%
(± 7.2)
54.5%
(± 6.8)
Black 64.6%
(± 8.8)
74.0%
(± 7.2)
61.2%
(± 7.8)
72.8 %
(± 7.0)
Percent Reported Voting**
2006 2008 2010 2012
Anglo 45.2%
(± 3.6)
64.7%
(± 3.2)
43.8%
(± 3.2)
60.9 %
(± 3.2)
Hispanic 25.4%
(± 6.2)
37.8%
(± 5.8)
23.1%
(± 6.0)
38.8%
(± 6.6)
Black 36.6%
(± 9.0)
65.8%
(± 7.8)
37.7%
(± 7.8)
62.5%
(± 7.6) *Source: Current Population Survey, various years, “Voting and Registration and Supplement,” Table 4b. http://www.census.gov/hhes/www/socdemo/ voting/publications/p20/index.htm (last accessed June 6, 2014). **95 Percent Confidence Interval in Parentheses.
Case 2:13-cv-00193 Document 600-1 Filed in TXSD on 09/16/14 Page 113 of 122

111
Table VIII.5. Current Population Survey Estimates of Percent of Registered Anglos, Hispanics, and Blacks who Voted in the State of Texas from 2006 to 2012*
2006 2008 2010 2012
Anglo 62.5%
(± 3.2)
87.8%
(± 3.0)
65.4%
(± 3.0)
83.4 %
(± 3.0)
Hispanic 43.8%
(± 7.0)
69.5%
(± 6.0)
43.4%
(± 7.2)
71.3%
(± 6.8)
Black 56.7%
(± 8.8)
88.5%
(± 7.6)
61.7%
(± 7.8)
85.9%
(± 7.0)
Gross Percentage Point Disparity
Anglo% - Black% 5.8% -0.7% 3.7% -2.5% Anglo% - Hispanic% 18.7% 18.3% 22.0% 12.1%
Percent Difference in Rate of Voting
(Black%-Anglo%) /Black %
10% -1% 06% -3%
(Hispanic% - Anglo %) /Hispanic %
43% 26% 51% 17%
*Source: Current Population Survey, various years, “Voting and Registration and Supplement,” Table 4b. http://www.census.gov/hhes/www/socdemo/voting/ publications/p20/index.htm(last accessed June 6, 2014).
Case 2:13-cv-00193 Document 600-1 Filed in TXSD on 09/16/14 Page 114 of 122

112
Table X.1. Comparison of SSN9 Match and A/D/G/N Match Rates Primary Match Using A/D/G/N Combinations
SSN MATCH
NO SSN MATCH
SSN MATCH
Total NO A/D/G/N MATCH
1,207,739
135,686
1,343,425
A/D/G/N MATCH
119,601
5,249,230
5,368,831
Total
1,327,340
5,384,916
6,712,256
Case 2:13-cv-00193 Document 600-1 Filed in TXSD on 09/16/14 Page 115 of 122

113
APPENDIX List of Documents Appended Following Appendix Tables Ex. A – DOJ Algorithm Ex. B – Texas Algorithm Ex. C – U.S. State Department Declaration Ex. D – U.S. Defense Department Declaration Ex. E – U.S. Citizenship and Immigration Services Declaration Ex. F– U.S. Social Security Administration Declaration Ex. G – U.S. Department of Veterans Affairs, Veterans Benefits Administration Declaration Ex. H – U.S. Department of Veterans Affairs, Veterans Health Administration Declaration Ex. I – Rebuttal Report of Professor Charles Stewart, South Carolina v. United States (D.D.C.). Ex. J – Curriculum Vitae of Dr. Stephen Ansolabehere
Case 2:13-cv-00193 Document 600-1 Filed in TXSD on 09/16/14 Page 116 of 122

114
NOTE: Table A.V.1 not updated since original data production
Table A.V.1. Completeness and Uniqueness of Identifiers on TEAM and State of Texas DPS Driver License Databases
Identifier
Texas Registered Voter List (TEAM)
Texas Department of Public Safety (DPS) (DL only)
Percent Complete
Percent Unique
Percent Complete
Percent Unique
Primary Matches
A 99.7 100.0 100.0 95.7 B 99.8 99.5 100.0 95.5 C 99.8 99.2 100.0 95.4 D 99.9 99.8 100.0 95.7 E 99.8 98.0 100.0 94.1 F 99.8 97.9 100.0 95.4 M 76.3 98.7 100.0 95.7
Secondary Matches
G 85.0 98.3 88.1 95.9 H 62.3 99.7 100.0 95.7 I 62.3 88.7 100.0 95.7 K 85.0 98.3 88.1 95.9 L 0.7 100.0 1.1 88.4 SSN 49.5 98.8 100.0 95.6
Number of Records
13,564,416 16,052,332
Case 2:13-cv-00193 Document 600-1 Filed in TXSD on 09/16/14 Page 117 of 122
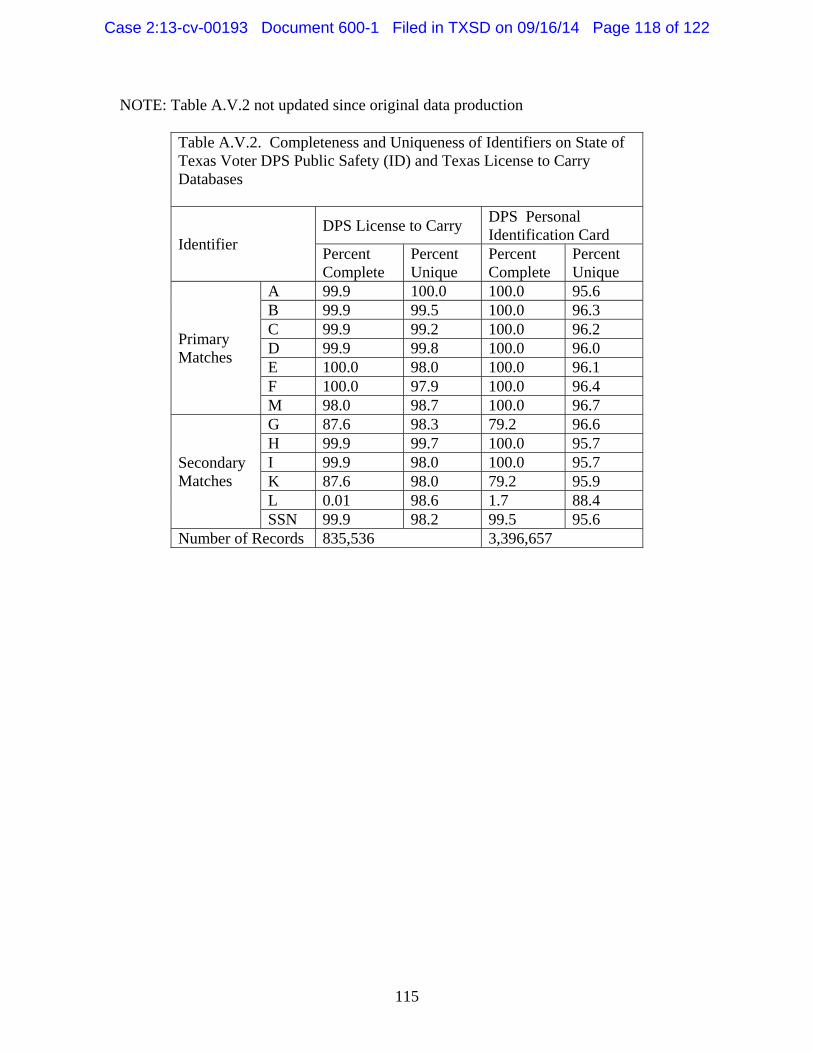
115
NOTE: Table A.V.2 not updated since original data production
Table A.V.2. Completeness and Uniqueness of Identifiers on State of Texas Voter DPS Public Safety (ID) and Texas License to Carry Databases
Identifier DPS License to Carry
DPS Personal Identification Card
Percent Complete
Percent Unique
Percent Complete
Percent Unique
Primary Matches
A 99.9 100.0 100.0 95.6 B 99.9 99.5 100.0 96.3 C 99.9 99.2 100.0 96.2 D 99.9 99.8 100.0 96.0 E 100.0 98.0 100.0 96.1 F 100.0 97.9 100.0 96.4 M 98.0 98.7 100.0 96.7
Secondary Matches
G 87.6 98.3 79.2 96.6 H 99.9 99.7 100.0 95.7 I 99.9 98.0 100.0 95.7 K 87.6 98.0 79.2 95.9 L 0.01 98.6 1.7 88.4 SSN 99.9 98.2 99.5 95.6
Number of Records 835,536 3,396,657
Case 2:13-cv-00193 Document 600-1 Filed in TXSD on 09/16/14 Page 118 of 122

116
NOTE: Table A.V.3 not updated from August 15, 2014 version
Table A.V3. Number Matches of TEAM records to State of Texas Identification Databases By Record Identifier
Identifier DPS Driver License
DPS Public Safety ID
DPS License to Carry
Primary Matches
A 8,247,986 787,346 533,958 B 8,422,296 805,092 545,814 C 8,557,902 829,268 552,372 D 8,281,572 790,781 535,897 E 8,195,758 802,261 528,436 F 9,763,774 1,107,209 676,170 M 7,953,620 504,694 290,779
Secondary Matches
G 61,458 14,209 5,316 H 27,408 9,736 2,189 I 43,291 9,367 3,902 K 64,523 15,690 5,501 L 608 226 50 SSN 107,766 27,451 10,750
Any Identifier 10,663,738 1,284,658 733,008
Case 2:13-cv-00193 Document 600-1 Filed in TXSD on 09/16/14 Page 119 of 122

117
Table A.V4. Number Matches of TEAM records to Federal Identification Databases By Record Identifier
Identifier DOD Military Identification
DOS Passport or Passport Card
USCIS Citizenship Document
Primary Matches
A 350,515 3,018,662 207,387 B 357,465 3,107,218 221,813 C 365,985 3,202,237 213,238 D 352,008 3,036,730 236,996 E 348,402 3,000,346 206,663 F 433,861 4,521,683 304,530
Secondary Matches
G 786 11,404 30,225 H 1,569 31,747 51,524 I 2,379 23,477 60,063 K 1,111 16,810 17,378 L 163 1,001 1,817 SSN 8,127 150,323 52,938
Any Nationwide Match51
166,128 5,386,264 323,425
Any Identifier 638,354 5,731,163 735,086
51 For DOS, this includes additional matches that were performed in order to deal with a different data storage system used by the Department of State.
Case 2:13-cv-00193 Document 600-1 Filed in TXSD on 09/16/14 Page 120 of 122

118
Table A.V5. Number Matches of TEAM records to Federal Identification and Exemption Databases By Record Identifier
Identifier VA (VHA) VIC/VHIC (Identification)
VA (VBA) Disability (Exemption)
SSA Disability (Exemption)
Primary Matches
A 180,483 100,758 412,295 B 186,754 103,528 434,720 C 190,053 105,868 450,148 D 181,146 101,347 417,348 E 181,332 101,491 420,879 F 235,188 146,009 636,806
Secondary Matches
G 454 120,591 2,238 H 1,063 78,406 9,115 I 1,509 95,516 5,096
K 617 120,918 2,704
L 38 391 236 SSN 5,951 78,191 268,58
Any Nationwide Match
33,487 25,228 73,236
Any Identifier 296,005 188,516 804,338
Case 2:13-cv-00193 Document 600-1 Filed in TXSD on 09/16/14 Page 121 of 122

119
Table A.VI.1. Incidence of NO-MATCH By Racial Group, Using Catalist Racial Classification* and Excluding Records indicated as NCOA, Deceased or Deadwood by Catalist
Race No Match /
Not EXEMPTION ELIGIBLE
No Match / Not Age
Vote-By-Mail Eligible
No Match / Not EXEMPTION ELIGIBLE/
Not Age Vote-by-Mail Eligible
Anglo 230,617 (3.1%)
174,158 (2.3%)
151,795 (2.0%)
Black 95,369 (6.2%)
89,525 (5.8%)
75,020 (4.9%)
Hispanic 142,863 (5.1%)
123,463 (4.4%)
112,577 (4.0%)
Other 8,376 (1.8%)
6,844 (1.5%)
6,466 (1.4%)
All 477,225 (3.9%)
393,990 (3.2%)
345,858 (2.8%)
Gross Percentage Point Disparities
Black % - Anglo %
3.1% 3.5% 2.9%
Hispanic % – Anglo %
2.0% 2.1% 2.0%
Relative Rate of NO MATCH
Black % / Anglo %
1.75 2.09 1.97
Hispanic % / Anglo %
1.30 1.43 1.44
Case 2:13-cv-00193 Document 600-1 Filed in TXSD on 09/16/14 Page 122 of 122


