
Improving Men’s Health,Quality of Life, and Cost Outcomes:
Evolving Treatment Strategies for Benign Prostatic Hyperplasia
Faculty
William J. Cardarelli, PharmDDirector of Pharmacy Revenue and Supply
Atrius HealthHarvard Vanguard Medical Associates
Watertown, Massachusetts
Claus G. Roehrborn, MD Professor and Chair
Department of UrologyUT Southwestern Medical Center
Dallas, Texas

Learning Objectives
• Discuss the impact of underdiagnosed and undertreated BPH on clinical, economic, and quality of life outcomes
• Describe the epidemiology and clinical correlation between LUTS/BPH and ED
• Implement health plan policies aimed at educating in-plan clinicians and covered patients on symptoms and evidence-based treatments for LUTS/BPH
• Translate evidence on the benefits and limitations of traditional and newer BPH therapies to formulary discussions and review
Improving Men’s Health,Quality of Life, and Cost Outcomes:
Evolving Treatment Strategies for Benign Prostatic Hyperplasia
Claus G. Roehrborn Professor and Chairman
UT Southwestern Medical CenterDepartment of Urology

A Modern View of Male LUTS and BPHClinical, Anatomic, and Pathophysiologic Changes
• BPH
– Histologic:stromoglandular hyperplasia1
• May be associated with
– Clinical:presence of bothersome LUTS2
– Anatomic:enlargement of the gland (BPE = Benign Prostatic Enlargement)2
– Pathophysiologic:compression of urethra and compromise of urinary flow (BOO = Bladder Outlet Obstruction)2
BOO = bladder outlet obstruction; BPE = benign prostatic enlargement; BPH = benign prostatic hyperplasia; LUTS = lower urinary tract symptoms.1. Roehrborn C (reviewer). Rev Urol. 2002;3:139-145. 2. Nordling J, et al. In: Chatelain C, et al, eds. Benign Prostatic Hyperplasia. Plymouth, UK: Health Publication Ltd; 2001:107-166.
HistologicBPH
All Men>40 y
BOOObstruction
BPEEnlargement
LUTS/Bother
Epidemiology of BPHHistologic Prevalence around the World
Lepor H. Rev Urol. 2004;6(suppl 9):S3-S10; Roehrborn CG, McConnell JD. Etiology, pathophysiology, epidemiology and natural history of benign prostatic hyperplasia. In: Walsh PC, Retik AB, Vaughan ED Jr, Wein AJ, eds. Campbell’s Urology. 8th ed. Philadelphia, PA: WB Saunders Co; 2002:1297-1336; Roehrborn CG. Int J Impot Res. 2008;20(suppl 3):S11-S18.
Holund1980
Franks1954
Karube1961
Harbitz1972
Fang-Lui1991
Baron1941
Moore1943
Swyer1944
Pradhan1975
Pre
vale
nce
(%
)
20-29 30-39 40-49 50-59 60-69 70-79 80-89
Age (years)
80
70
90
60
50
40
30
20
0
10
100
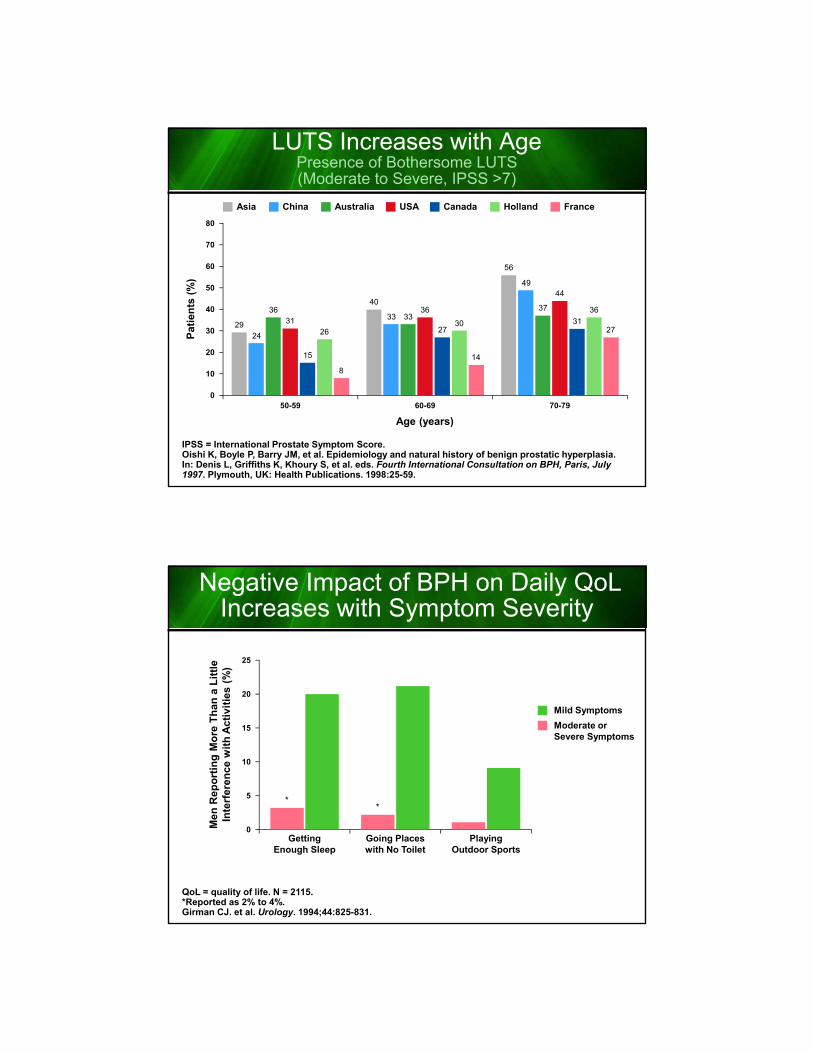
LUTS Increases with AgePresence of Bothersome LUTS(Moderate to Severe, IPSS >7)
IPSS = International Prostate Symptom Score.Oishi K, Boyle P, Barry JM, et al. Epidemiology and natural history of benign prostatic hyperplasia. In: Denis L, Griffiths K, Khoury S, et al. eds. Fourth International Consultation on BPH, Paris, July 1997. Plymouth, UK: Health Publications. 1998:25-59.
50-59 60-69 70-79
Canada FranceUSA HollandChinaAsia Australia
Pat
ien
ts (
%)
80
40
30
0
70
20
10
60
50
15
2731
2630
36
8
14
2729
40
56
24
33
49
3633
37
3136
44
Age (years)
Negative Impact of BPH on Daily QoLIncreases with Symptom Severity
QoL = quality of life. N = 2115.*Reported as 2% to 4%.Girman CJ. et al. Urology. 1994;44:825-831.
Mild Symptoms
Moderate orSevere Symptoms
25
20
10
0Getting
Enough Sleep
Men
Rep
ort
ing
Mo
re T
han
a L
ittl
eIn
terf
eren
ce w
ith
Act
ivit
ies
(%)
15
5
Going Placeswith No Toilet
PlayingOutdoor Sports
**

Q44 “Now I’m going to read you a series of statements and I would like you to tell me whether youagree strongly, agree somewhat, disagree somewhat or disagree strongly with the statement”
Concerns of Men with BPH by LUTS Severity(Agree Strongly or Somewhat)
Worry aboutenlarged prostate
Prostate symptomsare embarrassing
Worry conditionmay be prostate cancer
Prostate conditionreduces QoL
Worry conditionmay get worse
Expect conditionto get worse
0 5 10 15 20 25 30 35 40 45
24
10
13
7
24
9
Percent (%)
25
17
28
33
42
39
Moderate / Severe
(n=419)
LUTZ Severity:
Mild
ConsequencesProblems
AUR = acute urinary retention; UTI = urinary tract infection.1. AUA Practice Guidelines Committee. J Urol. 2003;170:530-547. 2. Rosen R, et al. Eur Urol. 2003;44:637-649. 3. Lepor H, Lowe FC. In: Walsh PC, et al, eds. Campbell’s Urology. 8th ed. Philadelphia, Pa: Saunders; 2002:1337-1377.
LUTS1,2
BPH
BOO3
BothersomeInterference with
daily activities andsexual function
AURSurgery
Nonfunctioning bladderUTI
StonesRenal failure
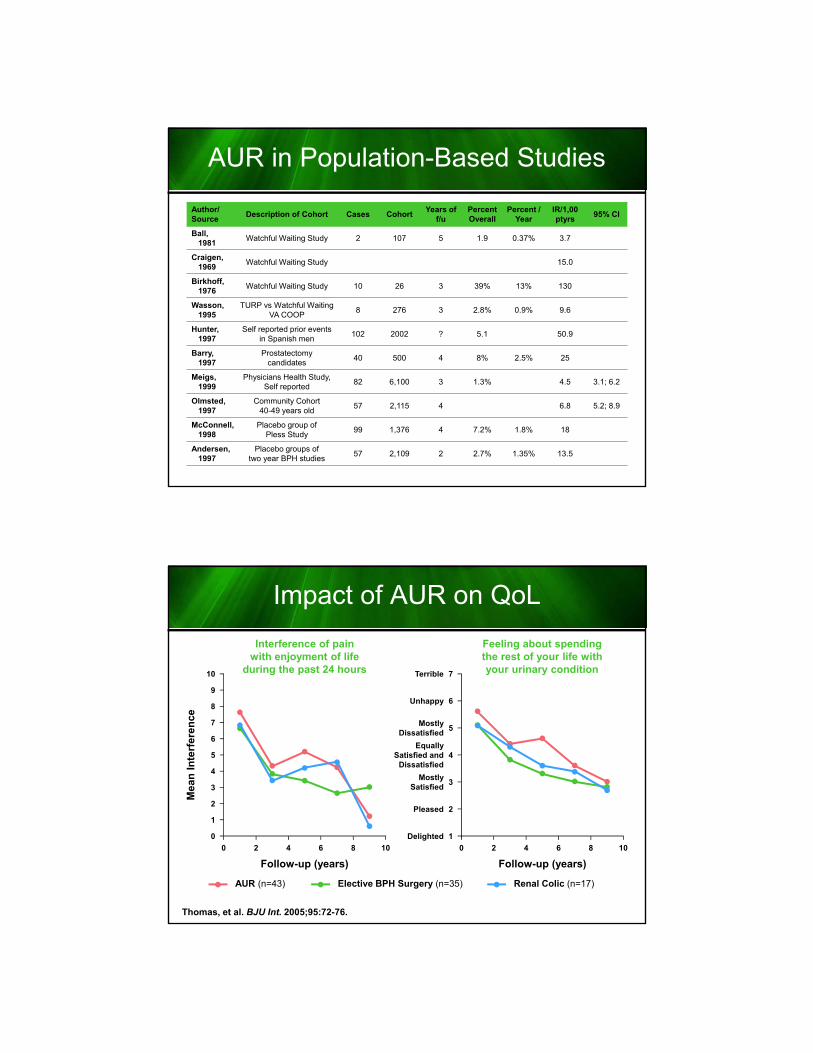
AUR in Population-Based Studies
Author/Source
Description of Cohort Cases CohortYears of
f/uPercentOverall
Percent /Year
IR/1,00ptyrs
95% CI
Ball,1981
Watchful Waiting Study 2 107 5 1.9 0.37% 3.7
Craigen,1969
Watchful Waiting Study 15.0
Birkhoff,1976
Watchful Waiting Study 10 26 3 39% 13% 130
Wasson,1995
TURP vs Watchful WaitingVA COOP
8 276 3 2.8% 0.9% 9.6
Hunter,1997
Self reported prior eventsin Spanish men
102 2002 ? 5.1 50.9
Barry,1997
Prostatectomycandidates
40 500 4 8% 2.5% 25
Meigs,1999
Physicians Health Study,Self reported
82 6,100 3 1.3% 4.5 3.1; 6.2
Olmsted,1997
Community Cohort40-49 years old
57 2,115 4 6.8 5.2; 8.9
McConnell,1998
Placebo group ofPless Study
99 1,376 4 7.2% 1.8% 18
Andersen,1997
Placebo groups oftwo year BPH studies
57 2,109 2 2.7% 1.35% 13.5
Impact of AUR on QoL
Thomas, et al. BJU Int. 2005;95:72-76.
AUR (n=43)
Interference of painwith enjoyment of life
during the past 24 hours
2 4
8
7
10
9
5
3
0
0 6 8 10
Mea
n I
nte
rfer
ence
Follow-up (years)
2
1
6
4
Elective BPH Surgery (n=35) Renal Colic (n=17)
Feeling about spendingthe rest of your life withyour urinary condition
2 4
7
6
4
1
0 6 8 10
Follow-up (years)
3
2
5
Terrible
Unhappy
EquallySatisfied and
Dissatisfied
Delighted
MostlySatisfied
Pleased
MostlyDissatisfied

RetenFrance: Immediate Complications by Duration of Catheterization
Desgrandchamps F, et al. BJU Int. 2006;97:727-733.
Catheter≤3 Days(n=817)
Catheter>3 Days(n=1600)
P
Haematuria
Asymptomatic bacteriuria
Lower UTI
Urosepsis
Urine leak
Catheter obstruction
6.1%
4.9%
1.1%
0.9%
2.2%
0.4%
12.0%
14.1%
4.3%
2.0%
4.6%
2.1&
<.001
<.001
<.001
.03
.003
<.001
Prolongation of hospitalization
Median prolongation (in days)
3.2%
5
6.5%
7
<.001
Use of Treatment Options United States vs Europe
US Market Europe
MIST 1%
SurgeryMIST3%
WaWa40%
WaWa24%
Surgery 2%
Drugs57%
Drugs73%

Center for Disease Control and PreventionHospital procedures, all-listed: US, 1990-2010
(Source: NHDS) Rate per 10,000
The data are from the National Hospital Discharge Survey (NHDS). The NHDS collects data from a sample of inpatient records acquired from a national sample of short stay, non-federal hospitals in the United States. Additional information on technical aspects of the survey, including definitions of terms, is available at the National Hospital Discharge Survey web page .Procedures have been coded using the International Classification of Diseases, 9th Revision, Clinical Modification (ICD-9-CM). Up to four procedures were coded per discharge in the NHDS through 2009. Beginning in 2010, up to eight procedures are coded per discharge in the NHDS. Some estimates of all-listed procedures in 2010 may therefore exhibit marked increases if compared with prior years.
1990
80
120
100
0
Pro
ced
ure
s (p
er 1
0,00
0)
20
60
40
2000 2010
Bariatric Surgery
Removal of Prostate
Transurethral Prostatectomy
Hysterectomy
Vaginal Hysterectomy
Repair of Cystocele(bladder) and Rectocele(rectum)
Excision of IntervertebralDisc and Spinal Fusion
Total Hip Replacement
Total or Partial KneeReplacement
8.6
95.7
53.0
42.2
18.412.311.9
6.1
13.7
16.922.2
25.231.0
38.2
60.1
8.713.315.418.1
26.9
84.6
91.9
30.1
7.0
The Demographic Burden of Urologic Diseases in AmericaNational Physician Office and Hospital
Outpatient Visits for BPH or LUTS
Rate per 100,000 based on 1994, 1996, 1998, and 2000 population estimates from Current Population Survey for relevant demographic categories of American male civilian noninstitutionalized population ≥40 years old.Data from Litwin MS, Saigal CS, editors. Urologic diseases in America. NIH Publication No. 07–5512. Washington: US Department of Health and Human Services, Public Health Service, National Institutes of Health, National Institute of Diabetes and Digestive and Kidney Diseases, US Government Publishing Office; 2007.Miller DC, et al. Urol Clin North Am. 2009;36:11-27.
1994
7,000,000
9,000,000
8,000,000
0
1,000,000
4,000,000
2,000,000
1998 2000
Primary Reason
Any Reason
3,000,000
6,000,000
5,000,000
1996
4,603,426
2,899,300
6,112,287
3,658,367
6,443,185
3,990,359
4,418,425
7,797,781

The Demographic Burden of Urologic Diseases in America (cont)
Urologic Clinics of North America Volume 36, Issue 1, February 2009, Pages 11–27
No. Visits to Office-Based Physicians (NAMCS) Plus Hospital Outpatient Clinics (NHAMCS)
No. Visits toEmergency Rooms
(NHAMCS)
No. Hospital Stays
Total Expenditures
(Million $)Primary Diagnosis Any Diagnosis
ProstateChronic and acute prostatitis — 1,841,066 — — $84,452,000Benign prostatic hyperplasia 4,418,425 7,797,781 117,413 105,185 $1099.5Prostate cancer 3,330,196 — — — $1,295,800,312BladderInterstitial cystitis, painful bladder syndrome — — — — $65,927,937Urinary incontinence in women 1,159,877 2,130,929 — 46,470 $452.8Urinary incontinence in men 207,595 353,065 — 1332 $10.3Bladder cancer — — — — —Lower tract transitional cell cancer — 832,416 — — $1,073,803,094Upper tract transitional cell cancer — — — — $64,309,807KidneyUrolithiasis 1,996,907 2,682,290 617,647 177,496 $2067.4Kidney cancer — 279,564 — — $401,390,672Pediatric urologic disordersVesicoureteral reflux 83,791 140,098 — — $41,725,663Undescended testis 148,551 215,482 — — —Hypospadias — 17,364 — — $16,563,330Ureterocele — — — — $16,803,712Male reproductive healthInfertility — 158,413 — — $17,046,404Erectile dysfunction — 2,904,896 — — $327,626,849Peyronie's disease — — — — —Urethral stricture — 364,389 — — $191,074,350Testicular cancer — 14,790 — — $21,745,500InfectionsUrinary tract infections in women 6,860,160 8,966,738 1,311,359 245,879 $2474Urinary tract infections in men 1,409,963 2,049,232 424,705 121,367 $1027.9
The Cost of Treating the 10 Most PrevalentDiseases in Men 50 Years of Age or Older
*Categories are not exclusive; patients may exist in more than one cohort.SD = standard deviation; CAD = coronary artery disease; GERD = gastroesophageal reflux disease.Fenter TC, et al. Am J Manag Care. 2006;12:S90-S98.
Age, Diagnoses, and Prescription Drug Use by Disease State
Disease* NMead Age
(SD)
Non-Disease-Specific
Prescriptions
Prescription Categories
Diagnoses
Arrhythmias 13,202 63.63 (8.48) 9.9 (10.72) 4.07 (3.52) 11,31 (7.87)
Osteoarthritis 26,835 60.39 (7.7) 7.64 (8.91) 2.91 (2.75) 6.61 (5.22)
Cataracts 68,866 65.46 (7.9) 10.29 (11.53) 3.77 (3.47) 5.97 (5.21)
CAD 21,074 61.78 (8.1) 5.65 (7.98) 2.46 (2.74) 8.32 (6.15)
Bursitis 26,449 58.01 (6.59) 8.26 (9.66) 3.2 (3.03) 5.81 (4.76)
Type 2 Diabetes 22,476 60.16 (7.42) 8.93 (10.48) 3.45 (3.25) 6.12 (4.97)
Enlarged Prostate 25,886 63.56 (8.02) 9.56 (10.59) 3.83 (3.34) 7.63 (5.74)
GERD 23,575 59.29 (7.37) 8.55 (9.58) 3.49 (3.12) 7.48 (5.88)
Depression 25,838 58.92 (7.72) 10.48 (11.04) 4.17 (3.61) 7.2 (6.78)
Hypertension 59,084 59.6 (7.46) 4.47 (6.56) 2.04 (2.37) 5.79 (5.03)
Overall 259,480 60.48 (7.86) 7.77 (9.78) 3.04 (3.09) 5.91 (5.08)

The Cost of Treating the 10 Most PrevalentDiseases in Men 50 Years of Age or Older
CAD = coronary Artery disease; GERD = gastroesophageal reflux disease.Fenter TC, et al. Am J Manag Care. 2006;12:S90-S98.
One-year Disease-specific Medical Costs for the10 Most Prevalent Diagnoses in Men ≥50 Years of Age
Co
st (
$)
1800
1600
1400
800
600
400
0
200
1200
1000 885989
1699
463463
782
217316
401
213
The Cost of Treating the 10 Most PrevalentDiseases in Men 50 Years of Age or Older (cont)
CAD = coronary Artery disease; GERD = gastroesophageal reflux disease.Fenter TC, et al. Am J Manag Care. 2006;12:S90-S98.
Percent Contribution of Disease-specific Total Costs byMedical vs Prescription Costs for each of the
10 Most Prevalent Diagnoses in Men ≥50 Years of Age
Per
cen
t (%
)
100
80
70
40
30
20
0
10
90
60 Prescription
Medical50
0
10088
12
84
16
49
51
82
18
52
48
29
71
33
67
52
48
41
59

The Cost of Treating the 10 Most PrevalentDiseases in Men 50 Years of Age or Older (cont)
CAD = coronary Artery disease; GERD = gastroesophageal reflux disease; MI = myocardial infarction; N/A = not applicable; GI = gastrointestinal.Fenter TC, et al. Am J Manag Care. 2006;12:S90-S98.
One-Year Disease-Specific Medical and Prescription Costs
Definition List of Significant Events after Initiation of Pharmocotherapy for Each Disease
DiseaseMedical Cost ($)
Prescription Cost ($)
Arrhythmias 1699 312
Osteoarthritis 989 131
Cataracts 885 0
CAD 782 710
Bursitis 463 101
Type 2 Diabetes 463 474
Enlarged Prostate 401 371
GERD 316 655
Depression 217 529
Hypertension 213 310
Significant Events
Cardioversion
Arthroscopy, knee replacement
N/A
Acute MI, stroke
Removal or drainage of the bursa sac
Nephropathy, neuropathy, retinopathy, lower extremity amputation
Prostate-related acute urinary retention, surgery
Endoscopy, upper GI surgery
Depression-related inpatient hospitalization
Stroke, acute MI, congestive heart failure, ischemic heart disease
The Cost of Treating the 10 Most PrevalentDiseases in Men 50 Years of Age or Older (cont)
CAD = coronary Artery disease; GERD = gastroesophageal reflux disease.Fenter TC, et al. Am J Manag Care. 2006;12:S90-S98.
Liklihood of Experiencing a Significant Eventwithin 1 Year Classified by Diagnosis
Per
cen
t (%
)
25
20
15
0
5
10
13.5
19.2
23
6.5
8.79.5
0.11.1
2.2

Evaluating Use Patterns of and Adherence to Medications for BPH
Nichol MB, et al. J Urol. 2009;181:2214-2222.
0.4
1.0
0.6
0.2
0
0.8
0 200 400 600
Su
rviv
al
Pro
bab
ility
Time to Discontinue/Censored
Logrank P = .0003
Doxazosin
Finasteri
Multipled
Tamsulosi
Terazosin
0.7
0.9
0.5
0.3
0.1
Population ≥65 Years for Developed andDeveloping Countries by Age
2000 to 2050
US Department of Health and Human Services. 65+ in the United States. 2005. http://www.census.gov/prod/2006pubs/p23-209.pdf. Accessed September 5, 2014.
Po
pu
lati
on
(M
illio
ns)
≥80 Years
65-79 Years
Total ≥65 Years
Developed Countries1200
800
600
0
1000
400
2000
200
238.2
64.8
2010 2020 2030 2040 2050
284.6
81.9
312.7
105.3
326.5
121195.1
52.9171.4
37.4
Year
Developed Countries1200
800
600
0
1000
400
2000
200
476.0
395.9
80.1
2010 2020 2030 2040 2050
689.5
568.5
121
950.7
752.2
198.5
1175.7
870.4
305.3
327.8
274.6
53.2249.0
214.6
34.4
Year
173.4 202.7 207.4 205.5142.2133.7
In the US, the population aged≥65 y is projected to increasefrom 35 million to 71 million
between 2000-2030
≥80 Years
65-79 Years
Total ≥65 Years

The Urologic IcebergDifferentiating the True and Observed
Prevalence of Urologic Conditions
Symptoms Presented, Diagnosed, Treated, and
Counted as Cases
Symptoms Presented, Diagnosed, Treated, and
Counted as Cases
Symptoms Not Recognized and Not Presented
Symptoms Not Recognized and Not Presented
Symptoms RecognizedBut Not Presented(possible self care)
Symptoms RecognizedBut Not Presented(possible self care)
Symptoms PresentedBut Not Diagnosed, Treated,
or Counted
Symptoms PresentedBut Not Diagnosed, Treated,
or Counted
The TruePrevalenceof UrologicConditions
in thePopulation
Note: Iceberg concept adapted from Last (1963; 2001).
Unobservedand
Not Counted
Observedand
Counted
ED = erectile dysfunction.Feldman et al. J Urol. 1994;151:54-61.
Major Risk Factor for ED: Aging
Severe ED
Moderate ED
Mild ED
80
70
40
040
Pre
vale
nce
(%
) 60
20
60 70
39
4850
30
10
Age (years)
50
57
67
(n=1209)

Kohler and McVary. European Urology 55. (2009)38-48.
The Relationship Between ED and LUTS andthe Role of Phosphodiesterase Type 5 Inhibitors
Epidemiology of Erectile Dysfunction:Results of the ‘Cologne Male Survey’
M Braun et al, Int J of Imptence Res 12:305, 2000
Odds Ratio (OR) with 95% confidence intervals (CI) for erectile dysfunctionassociated with age group, pelvic surgery, lower urinary tract symptoms (LUTS),
hypertension, and diabetis mellitus.All odds ratios are significantly different from 1 (P<.0001)
OR 95% CI
Age 40-49 y vs 30-39 y 3.72 (2.37-5.86)
Age 50-59 y vs 30-39 y 5.16 (3.35-7.95)
Age 60-69 y vs 30-39 y 11.02 (7.26-16.75)
Age 70-80 y vs 30-39 y 22.42 (14.35-35.02)
Pelvic surgery 6.03 (4.37-8.31)
LUTS 2.11 (1.75-2.55)
Hypertension 1.58 (1.29-1.93)
Diabetis mellitus 3.95 (2.98-5.23)
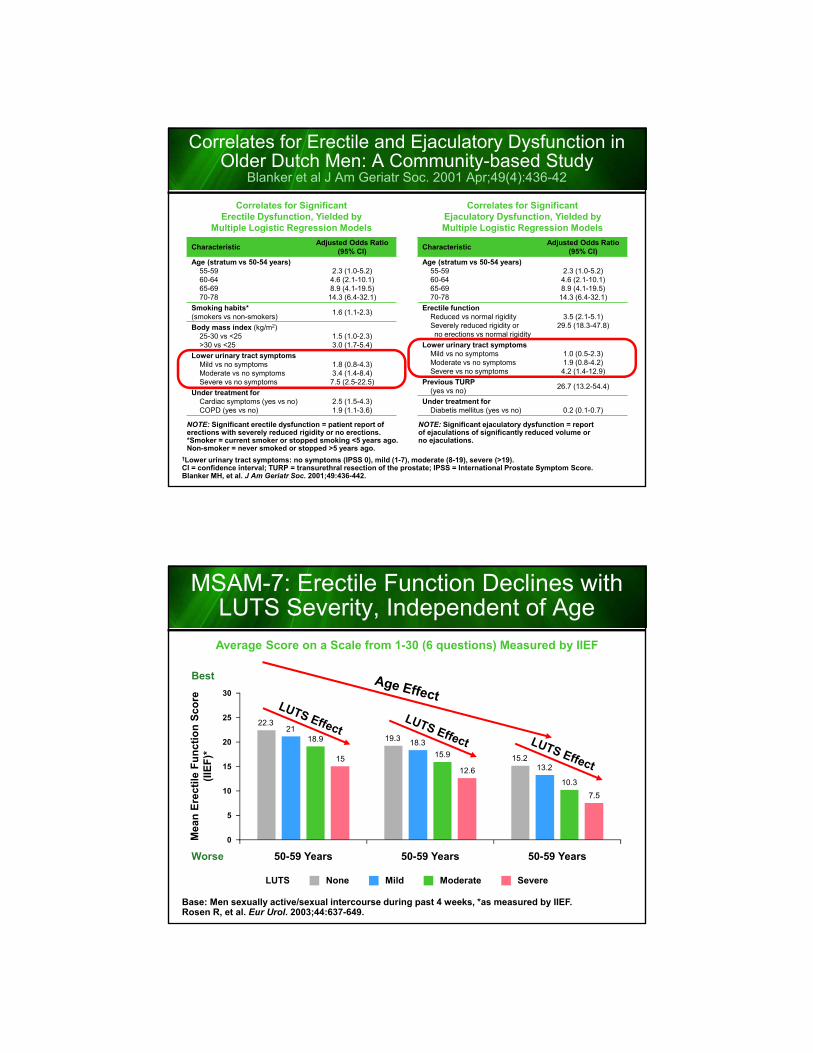
Correlates for Erectile and Ejaculatory Dysfunction in Older Dutch Men: A Community-based Study
Blanker et al J Am Geriatr Soc. 2001 Apr;49(4):436-42
†Lower urinary tract symptoms: no symptoms (IPSS 0), mild (1-7), moderate (8-19), severe (>19).CI = confidence interval; TURP = transurethral resection of the prostate; IPSS = International Prostate Symptom Score.Blanker MH, et al. J Am Geriatr Soc. 2001;49:436-442.
NOTE: Significant erectile dysfunction = patient report of erections with severely reduced rigidity or no erections.*Smoker = current smoker or stopped smoking <5 years ago. Non-smoker = never smoked or stopped >5 years ago.
NOTE: Significant ejaculatory dysfunction = reportof ejaculations of significantly reduced volume or no ejaculations.
Correlates for SignificantErectile Dysfunction, Yielded by
Multiple Logistic Regression Models
Correlates for SignificantEjaculatory Dysfunction, Yielded byMultiple Logistic Regression Models
CharacteristicAdjusted Odds Ratio
(95% CI)
Age (stratum vs 50-54 years)55-5960-6465-6970-78
2.3 (1.0-5.2)4.6 (2.1-10.1)8.9 (4.1-19.5)
14.3 (6.4-32.1)
Smoking habits* (smokers vs non-smokers)
1.6 (1.1-2.3)
Body mass index (kg/m2)25-30 vs <25>30 vs <25
1.5 (1.0-2.3)3.0 (1.7-5.4)
Lower urinary tract symptomsMild vs no symptomsModerate vs no symptomsSevere vs no symptoms
1.8 (0.8-4.3)3.4 (1.4-8.4)7.5 (2.5-22.5)
Under treatment forCardiac symptoms (yes vs no)COPD (yes vs no)
2.5 (1.5-4.3)1.9 (1.1-3.6)
CharacteristicAdjusted Odds Ratio
(95% CI)
Age (stratum vs 50-54 years)55-5960-6465-6970-78
2.3 (1.0-5.2)4.6 (2.1-10.1)8.9 (4.1-19.5)
14.3 (6.4-32.1)
Erectile functionReduced vs normal rigiditySeverely reduced rigidity orno erections vs normal rigidity
3.5 (2.1-5.1)29.5 (18.3-47.8)
Lower urinary tract symptomsMild vs no symptomsModerate vs no symptomsSevere vs no symptoms
1.0 (0.5-2.3)1.9 (0.8-4.2)4.2 (1.4-12.9)
Previous TURP (yes vs no)
26.7 (13.2-54.4)
Under treatment forDiabetis mellitus (yes vs no) 0.2 (0.1-0.7)
MSAM-7: Erectile Function Declines with LUTS Severity, Independent of Age
Base: Men sexually active/sexual intercourse during past 4 weeks, *as measured by IIEF.Rosen R, et al. Eur Urol. 2003;44:637-649.
Average Score on a Scale from 1-30 (6 questions) Measured by IIEF
Mea
n E
rect
ile F
un
ctio
n S
core
(IIE
F)*
30
20
15
0
25
10
5
18.9
50-59 Years
15.9
50-59 Years
10.3
50-59 Years
Mild SevereLUTS None Moderate
Best
Worse
15
12.6
7.5
22.3
19.3
15.2
21
18.3
13.2
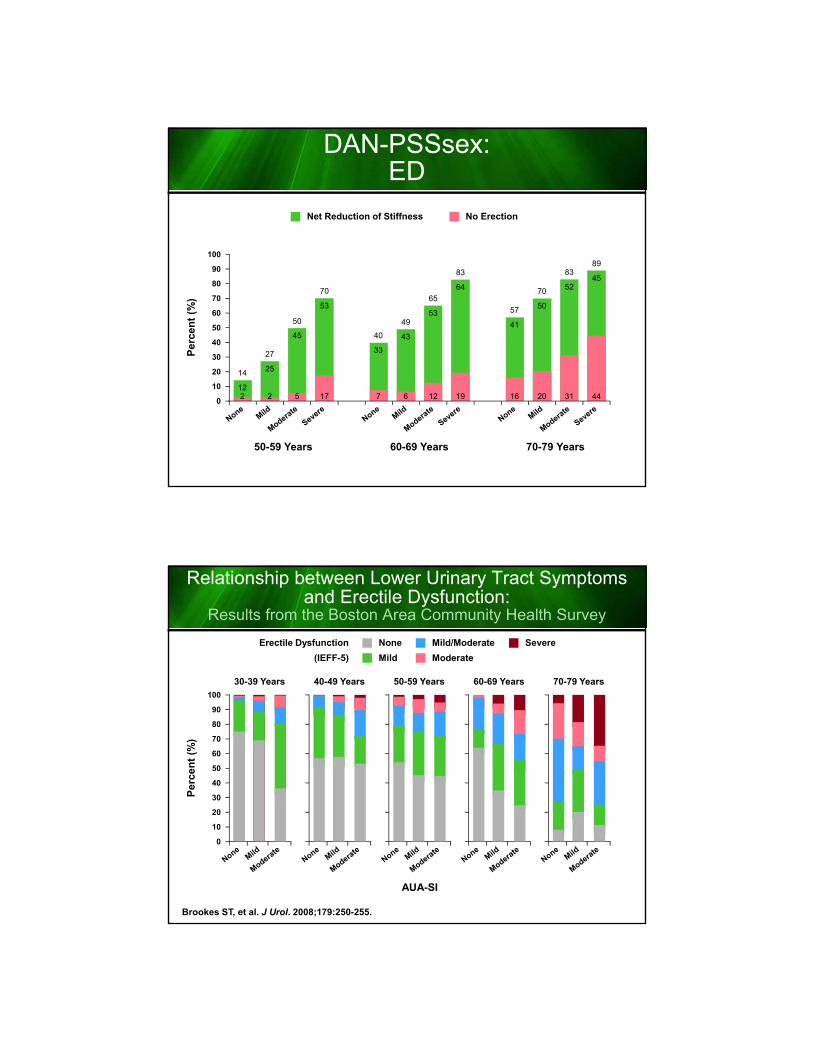
DAN-PSSsex:ED
Per
cen
t (%
)
100
80
70
40
30
20
0
10
90
60
50
Net Reduction of Stiffness No Erection
50
5
45
50-59 Years
65
12
53
60-69 Years
83
31
52
70-79 Years
70
17
53
83
19
64
89
44
45
14
212
40
7
33
57
16
41
27
2
25
49
6
43
70
20
50
Relationship between Lower Urinary Tract Symptoms and Erectile Dysfunction:
Results from the Boston Area Community Health Survey
Brookes ST, et al. J Urol. 2008;179:250-255.
Per
cen
t (%
)
100
80
40
20
0
60
AUA-SI
Mild/Moderate
Moderate
SevereNone
Mild
Erectile Dysfunction
(IEFF-5)
30-39 Years 40-49 Years 50-59 Years 60-69 Years 70-79 Years
90
70
30
10
50
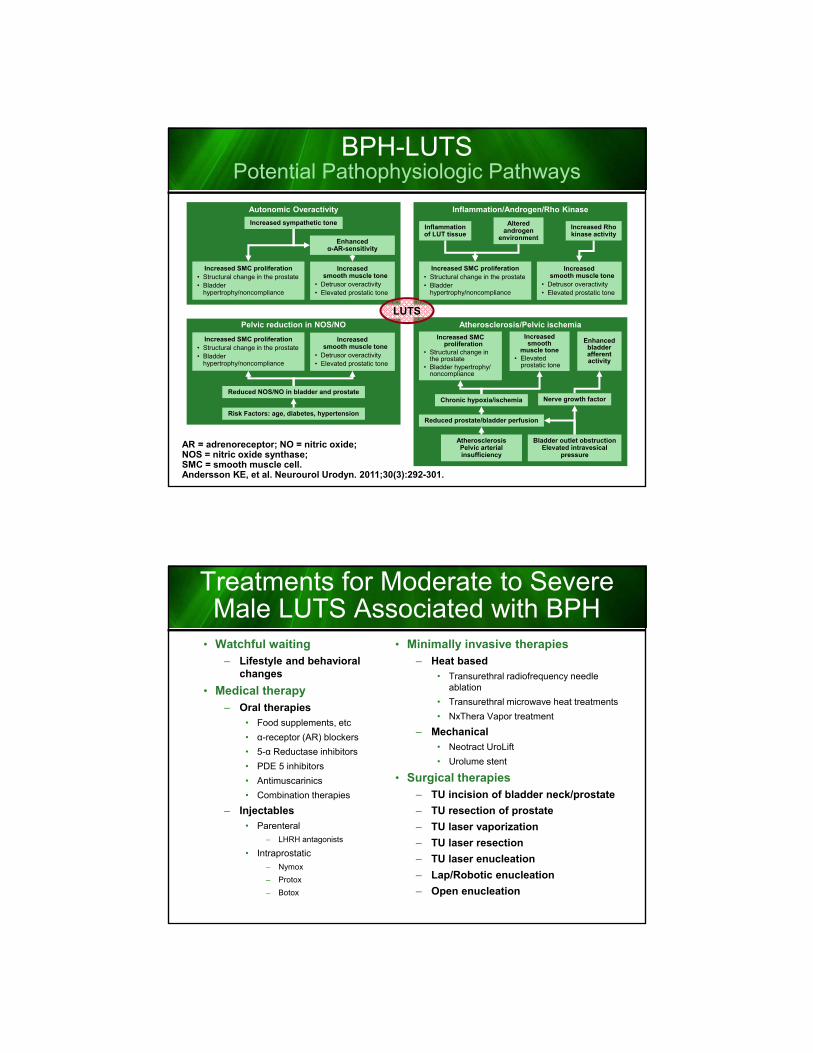
AR = adrenoreceptor; NO = nitric oxide; NOS = nitric oxide synthase; SMC = smooth muscle cell.Andersson KE, et al. Neurourol Urodyn. 2011;30(3):292-301.
Atherosclerosis/Pelvic ischemia
BPH-LUTSPotential Pathophysiologic Pathways
Increased sympathetic tone
Enhancedα-AR-sensitivity
Increased SMC proliferation• Structural change in the prostate• Bladder
hypertrophy/noncompliance
Increasedsmooth muscle tone
• Detrusor overactivity• Elevated prostatic tone
Autonomic Overactivity
Inflammationof LUT tissue
Inflammation/Androgen/Rho Kinase
Alteredandrogen
environment
Increased Rhokinase activity
Reduced NOS/NO in bladder and prostate
Risk Factors: age, diabetes, hypertension
Pelvic reduction in NOS/NO
Increased SMC proliferation
• Structural change in the prostate
• Bladder hypertrophy/ noncompliance
Increasedsmooth
muscle tone• Elevated
prostatic tone
Enhanced bladder afferent activity
Chronic hypoxia/ischemia Nerve growth factor
Reduced prostate/bladder perfusion
AtherosclerosisPelvic arterial insufficiency
Bladder outlet obstructionElevated intravesical
pressure
LUTS
Increased SMC proliferation• Structural change in the prostate• Bladder
hypertrophy/noncompliance
Increasedsmooth muscle tone
• Detrusor overactivity• Elevated prostatic tone
Increased SMC proliferation• Structural change in the prostate• Bladder
hypertrophy/noncompliance
Increasedsmooth muscle tone
• Detrusor overactivity• Elevated prostatic tone
Treatments for Moderate to SevereMale LUTS Associated with BPH
• Watchful waiting– Lifestyle and behavioral
changes
• Medical therapy– Oral therapies
• Food supplements, etc
• α-receptor (AR) blockers
• 5-α Reductase inhibitors
• PDE 5 inhibitors
• Antimuscarinics
• Combination therapies
– Injectables
• Parenteral
– LHRH antagonists
• Intraprostatic
– Nymox
– Protox
– Botox
• Minimally invasive therapies– Heat based
• Transurethral radiofrequency needle ablation
• Transurethral microwave heat treatments
• NxThera Vapor treatment
– Mechanical• Neotract UroLift
• Urolume stent
• Surgical therapies– TU incision of bladder neck/prostate
– TU resection of prostate
– TU laser vaporization
– TU laser resection
– TU laser enucleation
– Lap/Robotic enucleation
– Open enucleation

α-Adrenergic Receptor Antagonists
α1-Blockerα1-Receptor Selectivity
Side Effects*
Doxazosin α1A=α1D=α1B
Dizziness, dyspnea, edema, fatigue,
somnolence
Terazosin α1A=α1D=α1BAsthenia, dizziness, postural hypotension
Alfuzosin α1A=α1D=α1BDizziness, upper
respiratory tract infection
Tamsulosin α1A=α1D>α1B
Abnormal ejaculation†, asthenia, back pain, dizziness, increased
cough, infection‡, rhinitis, sinusitis,
somnolence
Silodosin α1A>α1D>α1B Retrograde ejaculation
Vascular Receptors Prostate Receptors
Prostatic α1A-receptors
Vascular α1B-receptors
α1A Prostatic smooth muscle contractionα1B Vascular smooth muscle contractionα1D Bladder muscle contraction and sacral
spinal cord innervation
*Adverse effects present in ≥2% of treated vs non-treated subjects; †Abnormal ejaculation includes ejaculation failure, ejaculation disorder, retrograde ejaculation, and ejaculation disease; ‡Terms also include cold, common cold, head cold, flu, and flu-like symptoms.Cardura package insert. 2009; Flomax package insert. 2009; Hatano A, et al. Br J Pharmacol. 1994;113(3):723-728; Hytrin package insert. 2009; Lepor H. Rev Urol. 2011;13(1):20-33; Rapaflo package insert. 2011; Schwinn DA, MichelottiGA. BJU Int. 2000;85(suppl 2):6-11; Uroxatral package insert. 2010; Yoo TK, Cho HJ. Korean J Urol. 2012;53:139-148.
5α-Reductase Inhibitors RegulateProstate Growth and BPH Development
*Adverse effects present in ≥2% of treated vs non-treated subjects.DHT = dihydrotestosterone; DNA = deoxyribonucleic acid; T = testosterone.Avodart package insert. 2012; Azzouni F, et al. Adv Urol. 2012:530121; Gravas S, Oelke M. World J Urol. 2010;28:9-15; Proscar package insert. 2012; Roehrborn CG. Int J Impot Res. 2008;20(suppl 3):S11-S18; Rosenberg MT, et al. Int J ClinPract. 2010;64(4):488-496.
Dutasteride Finasteride
5α-Reductasespecificity
Type I and II Type II
Half-life 5 weeks <1 day
Serum DHT ~95% reduction ~70% reduction
IntraprostaticDHT
~98% reduction 68%-85% reduction
PSA ~50% reduction
Prostate volume
~25% reduction
Adverse events*
Reduced libido, impotence
Abnormal ejaculation,
decreased ejaculate volume, impotence,
reduced libidoDHT produced peripherally by Type 1
and Type 2 5α-reductase
Testosterone
DNA
Nucleus
5α-ReductaseType 2
DHT
Androgen receptor Androgen receptor
DNA
Nucleus
Growth factors Growth factors
STROMALCELLS
EPITHELIALCELLS
T T
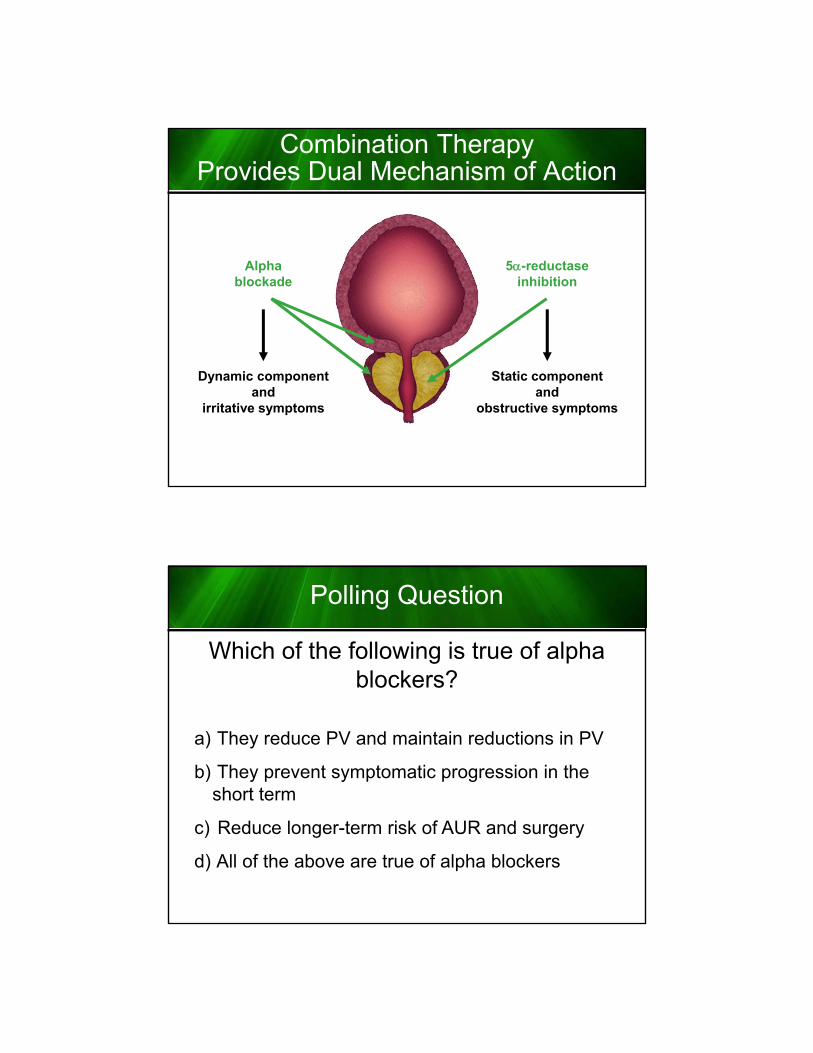
Combination Therapy Provides Dual Mechanism of Action
Alphablockade
5-reductaseinhibition
Dynamic componentand
irritative symptoms
Static componentand
obstructive symptoms
Polling Question
Which of the following is true of alpha blockers?
a) They reduce PV and maintain reductions in PV
b) They prevent symptomatic progression in the short term
c) Reduce longer-term risk of AUR and surgery
d) All of the above are true of alpha blockers

Polling Question
Which of the following is true of alpha blockers?
a) They reduce PV and maintain reductions in PV
b) They prevent symptomatic progression in the short term
c) Reduce longer-term risk of AUR and surgery
d) All of the above are true of alpha blockers
Two Different Patterns of EffectCombination Therapy: The Best of Both Worlds?
1. Madersbacher S, et al. Eur Urol. 2004;46:547-554. 2. Roehrborn CG, et al. J Urol. 2008;179:616-621.3. Roehrborn C, et al. Eur Urol Suppl. 2006;5:716-721.
Alpha blockers
5ARIs
Improve symptoms/flow
Onset of symptom relief
in 1–2 weeks
Prevent symptomatic
progression in the short term
Sustained symptomatic
benefit
Reduce PV
Maintain reductions in PV
Reduce longer-term risk of
AUR and surgery
Time
Magnitude of benefit
Time
Magnitude of benefit

GiGs
Sympathetic Nerve Terminal
tone
cAMP
Ca2+
Ca2++
–
M23
NE
NE
AC Gq
Ca2+
contractionSRCa2+
IP3
Ca2+
Ca2+
Ca2+
IP3
PIPM3
ACh
DG
+
ROC channel
Muscarinic Receptor Signaling
Parasympathetic Nerve Terminal
M1 M2/4
ACh
+ –
AC = adenylate cyclase; Ach = acetylcholine; β3 = β3 adreneregic receptor; cAMP = cyclic adenosine monophosphate; DG = diacylglycerol; IP3 = inositol triphosphate; M1, M2, M2/4, and M3 are muscarinic receptor subtypes; NE = norepinephrine; PIP = phosphatidylinositol; PLC = phospholipase C; ROC = receptor-operated calcium channel; SR = sarcoplasmic reticulum.Andersson K-E. Lancet Neurol. 2004;3:46-53. Ouslander JG. N Engl J Med. 2004;350:786-799; Sellers DJ, et al. J AutonPharmacol. 2000;20:171-176.
PLC
OAB is defined as urgency, with or without urgency incontinence, usually with frequency and nocturia (ICS 2002 definition)
OAB = overactive bladder.Irwin DE, et al. Eur Urol. 2006;50:1306-1315. Abrams P, et al. Urology. 2003;61:37-49.
Most Men with LUTS Have Both Storage and Voiding/Post-Micturition Symptoms
67% of Men
Experience Symptoms
of Both OABand BPH
Storage Symptoms Related
to the Bladder
Voiding/Post-Micturition
Symptoms Related to the Prostate
• Slow stream
• Intermittency
• Straining
• Terminal dribble
• Post-micturition dribble
• Incomplete emptying
• Urgency
• Frequency
• Nocturia
• Urgency urinary
incontinence
• Other incontinence

Phosphodiesterase Type 5 Inhibitors Relax Smooth Muscle and Increase Vascularity
• Smooth muscle cell relaxation in bladder neck, prostate, and urethra
• Smooth muscle cell relaxation of these organs’ vascular supply and increased blood perfusion and oxygenation
• Modulation of the sensory output from the LUT is likely to play a role in both the short and long term
ReviewRelationship between ED and LUTS and the
Role of PDE5 Inhibitors
BII = BPH Impact Index; GAQ = Global Assessment Question; PVR = postvoid residual; Qmax = maximum flow rate.Kohler TS, et al. Eur Urol. 2009;55:38-48.
StudyAgent Dose
DurationN, PDE-I
nInclusion
Placebo Run-in
IPSS ∆: PDE-I vs Placebo(P value)
Other Findings
McVaryet al
Sildenafil50–100 mg qday 12 wk
369189
Age ≥45,history of ED:≤25 IIEF
(EF domain), IPSS ≥12
No6.3 vs 1.9(P<.0001)
No change in Qmax; IIEF, BII, mean IPSS QoL score,
and GAQ all significantlyimproved
Stiefet al
Vardenafil10 mg
bid 8 wk
222109
Age 45–64, IPSS ≥12,
no history of ED required
No5.9 vs 3.6(P=.0013)
No change in Qmax or PVR;IIEF, QoL, irritative and
obstructive IPSS subscoresall significantly improved
McVaryet al
Tadalafil5 mg → 20 mg
qday 4-wk run-in +
12 wk(6 → 6)
281138
Age ≥45, IPSS ≥12 from BPH for 6 mo,
no history of ED required
Yes
5 mg 2.8 vs 1.2 (P=.003)
20 mg 3.8 vs 1.7 (P≤.001)
7.1 vs 4.5 (P≤.001):includes run-in
No change in Qmax; IIEF,irritative and obstructive IPSS
subscores, mean IPSSQoL score all significantly
improved
Roehrbornet al
Tadalafil2.5, 5, 10,
20 mg qday4-wk run-in +
12 wk
1058~212/ group
Age ≥45, IPSS >12 from BPH for 6 mo,
Qmax: 4–15 mL/s
Yes
2.5 mg 3.9 vs. 2.3 (P<.05)
5 mg 4.9 vs 1.8 (P<.05)
10 mg 5.2 vs 4.5 (P<.05)
20 mg 5.3 vs 4.5 (P<.05)
No change in Qmax; IIEF,mean IPSS QoL score, BII,LUTS GAQ all significantly
improved (≥5 mg); dose>5 mg minimal ∆ improvement
but ↑ side effects

IPSS Total Score Mean Change from Baselineto Endpoint after 4, 8, and 12 Weeks
*Tadalafil 2.5 mg, P<.05 at Weeks 4, 8, and 12, and Tadalafil 5, 10, and 20 mg P<.001 for Weeks 4, 8, and 12 compared with placebo. Compared with placebo (Ancova analysis).Broderick GA, et al. Urology. 2010;75:1452-1458.
-2
-3
0
-1
-4
-5
-6
-7
Mea
n C
han
ge
in T
ota
l IP
SS
Sco
refr
om
Bas
elin
e to
En
dp
oin
tBaseline 4 8 12
Week
Placebo
Tad 2.5
Tad 5.0
Tad 10.0
Tad 20
Clinically MeaningfulImprovement
Top 5 Treatment-EmergentAdverse Events
Nasopharyngitis
Myalgia
Back Pain
Dyspepsia
Headache
Roehrborn CG, et al. J Urol. 2008;180:1228-1234.
20
18
14
10
6
2
0212
Placebo
Pat
ien
ts (
%)
16
12
8
4
212.82.4
≥1 TEAE (%)≥1 SAE (%)Discontinued
Patients with
209Tadalafil2.5 mg
212Tadalafil
5 mg
216Tadalafil10 mg
209Tadalafil20 mg
212.82.4
212.82.4
212.82.4
212.82.4
n = 9
n = 20
n = 25
n = 35
n = 40

Placebo
Tad 2.5
Tad 5.0
BIID
Total IPSSB
SEP Q3 (% “Yes” Responses)C
IIEF EF Domain ScoreA
Tadalafil 2.5 or 5 mg Administered Once Daily for 12 Weeksin Men with Both Erectile Dysfunction and
Signs and Symptoms of Benign Prostatic Hyperplasia:Results of a Randomized,Placebo-Controlled, Double-Blind Study
*P<.001 vs placebo; P<.01 vs placebo.LS = least squares.Egerdie RB, et al. J Sex Med. 2012;9:271-281.
Change from baseline in co-primary (International Index of Erectile Function-erectile function [IIEF-EF] domain (A)and total International Prostate Symptom Score [IPSS] (B) and key secondary (Sexual Encounter Profile Question 3
[SEPQ3] (C) and Benign Prostatic Hyperplasia Impact Index [BII] (D) measures at weeks 4, 8, and 12/end-point visits.
0
-1
-2
-4
Weeks Post-Baseline
-3
0 4 12/Endpoint
8
0
-2
-8
-4
-6
0 4 12/Endpoint
82
40
20
0
LS
Mea
n C
han
ge
fro
m B
asel
ine
Weeks Post-Baseline
30
10
0 4 12/Endpoint
8
8
6
0
LS
Mea
n C
han
ge
fro
m B
asel
ine
4
2
0 4 12/Endpoint
8
* * ** *
***
*
*
**
* ***
****
Tadalafil Administered Once Daily for Lower Urinary Tract Symptoms Secondary to Benign Prostatic Hyperplasia:
A 1-Year, Open-Label Extension Study
Donatucci CF, et al. BJU Int. 2011;107:1110-1116.
Wk 12 to EP
BL to 12 Wk
Change in IPSS from BL – Wk 12 – EP2
1
-1
-3
-5
-7PrevPlac
IPS
S S
core
0
-2
-4
-6
PrevTad 2.5
PrevTad 5.0
PrevTad 10
PrevTad 20

Changes in IPSS and BII for Menwith or without ED
Population: All randomized men.n = number randomized to therapy group. Broderick GA, et al. Urology. 2010;75:1452-1458.
Placebo(n=210)
2.5 mg(n=208)
5 mg(n=212)
20 mg(n=208)
Tadalafil
10 mg(n=216)
-4
-6
0
-2
-1
-3
-5
-7
Ch
ang
e in
IP
SS
(LS
Mea
n ±
SE
)
-2.4 -2.4
-3.2-4.3
-5.3-4.8
-5.1 -5.3-4.5
-5.6
0
-1.0
-0.5
-1.5
-2.0
Ch
ang
e in
BII
(LS
Mea
n ±
SE
)
-1
-0.7 -0.7 -0.9
-1.3 -1.3 -1.3 -1.3 -1.2 -1.4Without ED
With ED
0.352 / 0.644
0.753 / 0.852
Subgroup/Interactionp-values
*P<.05 vs placebo.LS = least square.Oelke M, et al. Eur Urol. 2012;61(5):917-925.
Monotherapy with Tadalafil or Tamsulosin Similarly Improves Symptoms and Maximum Urinary Flow Rate in Men with Lower Urinary Tract Symptoms Suggestive of Benign Prostatic Hyperplasia: Results of an International,
Randomized, Double- Blind, Placebo-Controlled Clinical Trial
Mean Change
Placebo (n=172)
Tadalafil5 mg
(n=171)
Tamsulosin0.4 mg(n=168)
Qmax, mL/s
1.2 ± 4.8 2.4 ± 5.5* 2.2 ± 4.1*
Vvoid, mL
4.6 ± 110.9 8.2 ± 101.5 21.4 ± 109.3
Bladder capacity, mL
4.2 ± 123.7 3.5 ± 113.8 11.9 ± 130.4
PVR, mL
-1.2 ± 56.5 -4.6 ± 47.0 -10.2 ± 59.2
0
0
-1
-2
-3
-4
-5
-6
-7
1 4 12/EP
Placebo
Tadalafil 5 mg
Tamsulosin 0.4 mg
IPS
S T
ota
lL
S M
ean
Ch
ang
e fr
om
Bas
elin
e
Duration of Treatment (weeks)

Storage symptoms• c/w overactive bladder (OAB)• No evidence of bladder outlet
obstruction (BOO)
1. Lifestyle intervention2. Behavioral therapy
3. Antimuscarinic monotherapy
Treatment failure
Success: Reassuranceand annual follow up
Evidence of BOODiscuss Rx options
Share decision
Medical Therapy
MIST or surgical intervention
Consider:• Botulinum toxin
• Neuromodulation• Other invasive therapies
Mixed OAB and BOO
Mixed BOOand ED
PredominantBOO
Larger gland Higher PSA
Alpha blocker +5 AR inhibitor
Small gland Low PSA
Alpha blocker
PDE5 inhibitorAlone or withAlpha blocker
Antimuscarinics and
Alpha blocker
Success: Reassurance and annual follow up
Treatment failure
Recommended Tests:1. Validated questionnaire
2. Frequency volume charts (FVC)3. Flow rate recording (FRR)4. Postvoid residual check
Additional optional tests:5. Urethrocystoscopy
6. Transrectal ultrasound (TRUS)7. Urodynamic studies
Improving Men’s Health,Quality of Life, and Cost Outcomes:
Evolving Treatment Strategies for Benign Prostatic Hyperplasia
William J. Cardarelli, PharmDDirector of Pharmacy Revenue and Supply
Atrius HealthHarvard Vanguard Medical Associates
Watertown, Massachusetts

Prevalence of BPH
• Prevalence of BPH
– 4th most prevalent disease in men >50 years
• 50% of men >60 years
• 90% of men >85 years
– Begins in middle age and continues throughout later life
• Goals: improve LUTS, reduce risk of BPH-related surgery, slow progression of disease
• Significant QoL issues: affecting physical, social, and psychological well being
BPH = benign prostatic hyperplasia; LUTS = lower urinary tract symptoms; QOL = quality of life.McVary KT. Am J Manag Care. 2006;12:S122‐S128. Medscape BPH, http://emedicine.medscape.com/article/437359-overview#a0156. Accessed July 21, 2014.
Data from Berry SJ, Coffey DS, Walsh PC, et al. The development of human benign prostatic hyperplasia with age. J Urol. 1984;132:474. Cunningham GR, et al. http://www.uptodate.com/contents/epidemiology-and-pathogenesis-of-benign-prostatic-hyperplasia?source=search_result&search=benign+prostatic+hyperplasia&selectedTitle=3~96. Updated September 10, 2013. Accessed September 1, 2014.
Prevalence of Benign Prostatic Hyperplasia Pathology with Age
Age-associated increase in pathologic evidence of benign prostatic hyperplasia in 1075 men at autopsy.The percentage with benign prostatic hyperplasia was determined during 10-year intervals
from five different studies; the mean values are shown.
11-20 21-30
80
70
100
90
50
30
0
1-10 31-40 51-60 81-90
Per
cen
t o
f P
rost
ates
(%
)
Age Range in Years
20
10
60
40
41-50 61-70 71-80

Economic Burden of BPH
• Annual cost per patient
– $1536 to $2577 (in 1999 Dollars)
• Annual healthcare expenditure to treat BPH
– $3.4 Billion (1999)
• Urologic Diseases in America Project
– Studied BPH in 2000
– Estimated that the disease carried an economic burden of $1.1 Billion in direct annual expense exclusive of outpatient pharmacotherapy costs
• While costs are important, they should not overshadow the negative impact of BPH on QOL
Issa MM, et al. Am J Manag Care. 2007;13:S4‐S9.
Approved Drug Therapies
• Alpha blockers –
– Alpha-blockers help relieve BPH symptoms, but they do not reduce the size of the prostate. They can help improve urine flow and reduce risk of bladder obstruction.
– Terazosin, doxazosin, tamsulosin, alfuzosin, and silodosin
• 5-alpha reductase inhibitors –
– Block the conversion of testosterone to dihydrotestosterone
– Finasteride and dutasteride
• Combination drug –
– Dutasteride 0.5 mg/tamsulosin 0.4 mg
• Phosphodiesterace 5 inhibitors (PDE-5) –
– Recently approved for men with BPH and ED
– Tadalafil 5 mg
http://www.nytimes.com/health/guides/disease/enlarged-prostate/medications.html Accessed July 21, 2014.

Polling Question
According to National Guideline Clearinghouse, it is recommended that BPH should not be treated with ____ in men with LUTS secondary to BPH without prostatic enlargement.
a) Alpha-adrenergic Blockers
b) 5-alpha Reductase Inhibitors
c) Combination therapy [Alpha-adrenergic Blockers and 5-alpha reductase inhibitors]
d) None of the above

Guideline on the Management ofBenign Prostatic Hyperplasia (BPH)National Guideline Clearinghouse
Alpha-adrenergic blockers (Alpha-blockers)
• Option: The older, less costly, generic alpha blockers remain reasonable choices. These require dose titration and blood pressure monitoring. [Based on Panel consensus]
5-ARIs
• Option: 5-ARIs may be used to prevent progression of LUTS secondary to BPH and to reduce the risk of urinary retention and future prostate-related surgery. [Based on review of the data and Panel consensus]
• Recommendation: 5-ARIs should not be used in men with LUTS secondary to BPH without prostatic enlargement. [Based on review of the data and Panel consensus]
• Option: The 5-ARIs are appropriate and effective treatment alternatives for men with LUTS secondary to BPH who have demonstrable prostate enlargement. [Based on review of the data and Panel consensus]
Combination
• Option: The combination of an alpha-blocker and a 5-alpha reductase inhibitor (5-ARIs) (combination therapy) is an appropriate and effective treatment for patients with LUTS associated with demonstrable prostatic enlargement based on volume measurement, prostate-specific antigen (PSA) level as a proxy for volume, and/or enlargement on digital rectal exam (DRE). [Based on review of the data and Panel consensus]
http://www.guideline.gov/content.aspx?id=25635#Section434. Accessed September 1, 2014.
Case Study of Tadalafil
• You’ve been asked to review a newly approved BPH therapy for your company’s P&T Committee
– It was previously approved for ED with a quantity limit of 4 tablets/30 days supply
– Its new indication is for the treatment of BPH and ED when the symptoms occur simultaneously
– As an ED drug, it already has a moderate financial impact on your drug spend
– You’ve been asked to develop coverage language to provide access given the new indication

Case Study of Tadalafil (cont)
• Background
– ED and BPH commonly coexist in older men
– Current therapies address the BPH component but not ED
– ED is a common side effect of current therapies
• Study Design
– Men aged 45 years or older
– Experienced both ED and BPH symptoms
– Random assignment after 4-week washout into 1 of 3 arms
• Tadalafil 2.5 mg
• Tadalafil 5 mg
• Placebo
Egerdie RB, et al. J Sex Med. 2012;9:271‐281.
Case Study of Tadalafil (cont)
• Outcomes
– Improvements in the International Prostate Symptom
– Score (IPSS) and International Index of Erectile Function (IEFF) score at 12 weeks compared with placebo
– Improvement was maintained throughout study
– Improvement scores were significant for the 5-mg dose (P<.001) but not for the 2.5-mg dose
– Drug was well tolerated with no clinically adverse changes in orthostatic vital signs or uroflow parameters
Egerdie RB, et al. J Sex Med. 2012;9:271‐281.

IPSS Total Score Mean Change fromBaseline to Endpoint Using Placebo and
Different Dosages of Tadalafil
*Tadalafil 2.5 mg, P<.05 at Weeks 4, 8, and 12, and Tadalafil 5, 10, and 20 mg P<.001 for Weeks 4, 8, and 12 compared with placebo. Compared with placebo (Ancova analysis).Broderick GA, et al. Urology. 2010;75:1452-1458.
-2
-3
0
-1
-4
-5
-6
-7
Mea
n C
han
ge
in T
ota
l IP
SS
Sco
refr
om
Bas
elin
e to
En
dp
oin
tBaseline 4 8 12
Week
Placebo
Tad 2.5
Tad 5.0
Tad 10.0
Tad 20
Clinically MeaningfulImprovement
Potential Concerns/Benefits
• Pharmacy adjudication at point of sale does not include diagnosis codes; therefore, a drug can’t be covered differentially by indication
• Providing unrestricted access to this drug may result in patients with ED diagnosis receiving much larger supplies of medication than previously, resulting in inappropriate use and increased cost
• Allowing appropriate, defined access will improve the QOL for those patients with simultaneous BPH and ED
Considerations for Managed Care
• Comparative effectiveness
• Cost impact
• Benefit design
• Coverage issues
• Utilization controls
• Patient-reported outcomes?
All of these help to assess
VALUE
Medical Care vs “Lifestyle” Care
• Benefit language has difficulty separating the two
• Need to balance the “mission and margin”
• Fundamental values of benefit management
– Accepting resource constraints
– Helping the sick
– Protecting the worse off
– Respecting autonomy of both patients and physicians
– Promoting inclusive decision making
Burton SL, et al. Health Aff. 2001;20:150‐163.

Utilization Controls
• Prior authorization
– Including molecular testing requirements
• Step therapy
• Formulary design
– Open vs closed formularies
• P&T review process
– Efficacy, tolerability, and safety
– Financial
How Does Comparative Effectiveness Benefit Managed Care?
• Provides meaningful comparisons between healthcare interventions instead of comparing interventions with placebos
• Offers the advantage of pooling findings from various studies and grades the quality of evidence
• Educates payers and providers about different strategies and interventions to treat and monitor patients in “real-world” settings
Oderda GM, et al. J Manag Care Pharm. 2011;17(9‐b):S19‐S24.

Limitations of CER
• Too many trials compare active agents with placebo
• Drugs shown to be equivalent to an average group of patients does not necessarily imply that they are equivalent for all patients
• Broad scope of research makes quality ratings important
• Must place a high value on effectiveness and internal validity
Oderda GM, et al. J Manag Care Pharm. 2011;17(9‐b):S19‐S24.
Pharmacoeconomic Evaluations: Are We Wasting Our Time?
• Resources are scarce
– People, time, facilities, equipment, knowledge
• Many medications are expensive
– Over 20 therapies with cost >$4000 per year
– Is $1000/day acceptable?
• Assists in making the decision process explicit
– Can take into account preferences and attributes
International Society For Pharmacoeconomics And Outcomes Research. Value in Health. http://www.ispor.org/publications/value/abstracts.asp. Accessed April 2, 2012.

What about HRQOL?
• Assesses an individual’s perceived effect of the illness on their physical, psychological, and social daily lives
– In a VA study, PD patients scored lower on the physical and mental health dimensions than patients with 8 other chronic diseases, including diabetes, heart failure, coronary artery disease, and stroke
• Used in determining the effectiveness of therapies both at an individual and population level
• Managed care can use this to measure the effectiveness of treatment strategies and quality of care
• Can be used in determining the appropriate placement of medications on formularies
• Preservation of HRQOL can reduce the need for healthcare resource use and lower total expenditures
VA = Veterans’ Affairs; PD = Parkinson’s disease.Chen JJ. Am J Manag Care. 2010;16(Suppl Implications):S87-S93. Weintraub D, et al. Am J ManagCare. 2008;14(2 Suppl):S49-S58.
So What’s Your Case for Access?
• Is Product X superior to already approved products?
• Where does its cost land?
• Do you need to put in place any utilization controls?
• If all other things are equal, does superior patient-reported outcomes change the analysis?

Algorithm forFormulary Decision-Making
NO
Drug review—oral/writtenpresentation by clinical pharmacist
Experience/opinion—oral comments byinvited consultants and committee members
Does drug offer substantial improvement in therapy overexisting formulary drugs for like indications, or is it a
completely new therapy not previously covered by medications?
Add to formulary with guidelines forcost-effective and safe use if needed
Does drug offer at least equal clinical benefit toexisting formulary drugs for like indications?
Add to formulary with guidelines forcost-effective use if needed
Do not add toformulary
Do not add toformulary
Can any safety concernsbe managed?
Does financial impact of drugsupport formulary addition?
NO
NO
NO
NO
YES
NO
YES
YES
YES
Conclusion
• Managed Care Organizations can contribute to cost-effective improved care in BPH by better understanding the current treatment options, evaluating the value of newer agents, and designing benefit language to address the needs of those patients with concomitant symptomology

Please Join Us for a Live Q&A Session


