Download - Improving Highway Work Zone Safety

Improving Highway Work Zone Safety
Final Report
Prepared by
Yue Li, Graduate Research Assistant Mark Chan, Graduate Research Assistant
Umar Firman, Undergraduate Research Assistant Kris Finger, Undergraduate Research Assistant
Megan M. Mills, Undergraduate Research Assistant Yong Bai, PI and Associate Professor of CEAE Department
Steven D. Schrock, Co-PI and Assistant Professor of CEAE Department Oswald Chong, Co-PI and Assistant Professor of CEAE Department
Paul Atchley, Co-PI and Associate Professor of Psychology Department David D. Perlmutter, Co-PI and Professor of Journalism & Mass Communications
A Report on Research Sponsored By
KANSAS UNIVERSITY TRANSPORTATION RESEARCH INSTITUTE
KANSAS DEPARTMENT OF TRANSPORTATION
And
FEDERAL HIGHWAY ADMINISTRATION
January, 2009

i
ABSTRACT
Highway work zones disrupt normal traffic flow and can create severe safety problems.
Due to the rising needs in highway maintenance and construction in the United States, the
number of work zones is increasing nationwide. With a total of 1,010 fatalities and more than
40,000 injuries occurring in 2006, improvements in work zone safety are necessary. The three
primary objectives of this research project included: 1) to determine the effectiveness of a
Portable Changeable Message Sign (PCMS) in reducing vehicle speeds on two-lane, rural
highway work zones; 2) to determine the effectiveness of a Temporary Traffic Sign (TTS),
(W20-1, “Road Work Ahead”); and 3) to determine motorists’ responses to the signage. To
accomplish these objectives, field experiments were conducted at US-36 and US-73 in Seneca
and Hiawatha, Kansas, respectively. During the field experiments, an evaluation of the
effectiveness of the PCMS was conducted under three different conditions: 1) PCMS on; 2)
PCMS off, but still visible; and 3) PCMS removed from the road and out of sight. The
researchers also divided the vehicles into three classes (passenger car, truck, and semitrailer) and
compared the mean speed change of these classes based on three different sign setups: PCMS on,
PCMS off, and the use of the TTS (W20-1, “Road Work Ahead”). A survey was also conducted
at the experimental work zones to obtain a general understanding of the motorists’ attitudes as
they traveled through the construction areas. Based on the data analysis results, researchers
concluded that the presence of the PCMS effectively reduced vehicle speeds on two-lane
highway work zones. A slow speed is more likely to reduce the probability of a crash or the
severity of a crash. In addition, researchers performed a univariate analysis of the variance test
to determine if a significant interaction existed between motorists’ responses and the sign

ii
conditions. The results showed a significant interaction between the signs and passenger car
vehicles.
iii
ACKNOWLEDGEMENTS
The authors would like to express their gratitude to the following people for their
valuable advice during the course of this study: Mr. Anthony Alrobaire, Senior Traffic Control
Engineer; Mr. Kevin F. Palic, Construction Engineer; Mr. Luke Perry, Senior Engineering
Technician; and Pat Haverkamp, Senior Engineering Technician from Kansas Department of
Transportation (KDOT). The authors would like to also thank to Mr. Mickey Waxman, Statistic
Consultant and Programmer for his advice in statistical analysis. Special thanks are also
extended to the Kansas University Transportation Research Institute, KDOT, and Federal
Highway Administration for providing generous financial support.

iv
TABLE OF CONTENTS
Abstract……………………………………………………………………………………. i
Acknowledgements……………………………………………………………………….. iii
Table of Contents…………………………………………………………………………. iv
List of Tables……………………………………………………………………………… vii
List of Figures…………………………………………………………………………….. ix
CHAPTER 1 – INTRODUCTION……………………………………………………… 1
1.1 Problem Statement………………………………………………………... 1
1.2 Report Organization………………………………………………………. 3
CHAPTER 2 – LITERATURE REVIEW……………………………………………… 5
2.1 Introduction………………………………………………………………… 5
2.2 Traditional Work Zone Traffic Control Methods and Effectiveness……… 5
2.3 Research and Development Trends in Work Zone Safety…………………. 12
2.4 Semitrailers and Safety in Work Zone…………………………………….. 15
2.5 Use of Survey Methodology in Work Zones……………………………… 15
CHAPTER 3 – RESEARCH OBJECTIVES AND METHODOLOGY…………….... 18
3.1 Objectives ………..……………………………………………………….. 18
3.2 Methodology………………………………………………………………. 18
CHAPTER 4 – FIELD EXPERIMENTAL DESIGN………………………………….. 21
4.1 Experimental Device and Installation……………………………………… 21
4.2 Experimental Site Selection and Speed Data Collection Procedure………. 26

v
4.3 Development of Survey Questionnaire……………………………………. 32
CHAPTER 5 – DATA COLLECTION…………………………………………………. 37
5.1 Data collection Procedure…………………………………………………. 37
5.1.1 Vehicle Speed Measurement………………………………………. 37
5.1.2 Driver Survey……………………………………………………… 38
5.2 Collected Datasets………………………………………………………… 39
5.2.1 Vehicle Speed Data………………………………………………… 39
5.2.2 Driver Survey Data………………………………………………… 43
CHAPTER 6 – DATA ANALYSIS……………………………………………………… 45
6.1 Data Analysis Methodology………………………………………………. 45
6.1.1 Change in Vehicle Speeds…………………………………………. 45
6.2 Comparison Analysis ……………………………………………………… 47
6.2.1 Comparison between PCMS on and off…………………………… 48
6.2.2 Comparison between PCMS on and without……………………… 51
6.2.3 Comparison between PCMS off and without…………………….... 53
6.2.4 Summary…………………………………………………………… 55
6.3 Comparison of Three Vehicle Classes……………………………………... 56
6.3.1 Significance of test analysis……………………………………….. 62
6.4 Speeds Analysis…………………………………………………………… 65
6.4.1 Changes in 85th-Percentile Speeds…………………………………. 68
6.5 Driver Survey Results……………………………………………………… 71
6.5.1 Overview…………………………………………………………… 71
6.5.2 Survey Feedback….………………………………………………. 72

vi
CHAPTER 7 – CONCLUSION AND RECOMMENDATIONS…………………….. 95
7.1 Conclusions………………………………………………………………… 95
7.2 Recommendations…………………………………………………………. 97
REFERENCE…………………………………………………………………………….. 100
Appendix………………………………………………………………………………….. 102
Appendix I: Sample Survey Form…………………………………………………. 102
Appendix II: Vehicle Speed Data………………………………………………….. 116
Appendix III: Driver Survey Results………………………………………………. 177

vii
LIST OF TABLES
Table 4.1: Fact Sheet of SmartSensor HD Model 125…………………………………….. 21
Table 5.1: A Portion of the Speed Datasheet………………………………………………. 42
Table 5.2: Speed Data by Different Experimental Conditions……………………………. 43
Table 6.1: Three Conditions and Data Information………………………………..………. 47
Table 6.2: Statistical Value for Condition 1……………………………………………….. 49
Table 6.3: Statistical Value for Condition 2……………………………………………….. 50
Table 6.4: Results of Two-Sample t-Test for Means of Speeds for Case 1………………... 51
Table 6.5: Statistical Value for Condition 3……………………………………………….. 52
Table 6.6: Results of Two-Sample t-Test for Means of Speeds for Case 2……………….. 53
Table 6.7: Results of Two-Sample t-Test for Means of Speeds for Case 3……………...... 54
Table 6.8: Independent Sample Test………………………………………………………. 56
Table 6.9: Mean Speed Values Based on Class for Each Case…………………………… 58
Table 6.10: Break Down of Data Points by Case…………………………………………. 61
Table 6.11: Break Down of Data Points by Vehicle Class………………………………... 62
Table 6.12: UNIANOVA Test of Between-Subjects Effects…………………………….. 63
Table 6.13: Comparison of Individual Vehicle Classes with Cases………………………. 64
Table 6.14: Pairwise Comparison of Class by Case………………………………………. 64
Table 6.15: Percentage of Speeding Cars………………………………………………….. 67
Table 6.16: Measure of 85th Percentile…………………………………………………….. 69
Table 6.17: Percent Speed Classification…………………………………………………...71

viii
Table 6.18: Responses Frequency and Percentage on US-36……………………………… 75
Table 6.19: Responses Frequency and Percentage on US-73……………………………… 76
Table 6.20: Response for Question 6 on US-36…………………………………………… 80
Table 6.21: Response for Question 6 on US-73…………………………………………… 81
Table 6.22: Response for Question 7 on US-36…………………………………………… 82
Table 6.23: Response for Question 7 on US-73…………………………………………… 83
Table 6.24: Response for Question 8 on US-36…………………………………………… 85
Table 6.25: Response for Question 8 on US-73…………………………………………… 85
Table 6.26: Response from Question 1 (misc) on US-36………………………………….. 88
Table 6.27: Response from Question 1 (misc) on US-73………………………………….. 89
Table 6.28: Response for Question 2 (misc) on US-36……………………………………. 91
Table 6.29: Response for Question 2 (misc) on US-76……………………………………. 91

ix
LIST OF FIGURES
Figure 1.1: Histogram of crash per year…………………………………………………… 1
Figure 2.1: Flagger position in the work zone……………………………………………... 7
Figure 4.1: SmartSensor HD system……………………………………………………….. 23
Figure 4.2: Work zone on US-36………………………………………………………….. 24
Figure 4.3: PCMS used for field experiments……………………………………………... 25
Figure 4.4: Experimental layout for test conditions 1 and 2……………………………… 27
Figure 4.5: Experimental layout for test condition 3……………………………………… 27
Figure 4.6: Location of sensors in work zone for setup 3…………………………………. 28
Figure 4.7: Work zone on US-36 between K-87 and K-63……………………………….. 30
Figure 4.8: A pilot car at the US-36 work zone…………………………………………… 30
Figure 4.9: Work zone on US-73 between Hiawatha and Horton………………………… 31
Figure 4.10: Sign used to solicit motorist response……………………………………….. 34
Figure 4.11: Signs used to investigate whether motorists were paying attention…………. 35
Figure 5.1: Work zone layout on US-36 and US-73………………………………………. 37
Figure 5.2: A research assistant conducting a driver survey………………………………. 39
Figure 5.3: Example of the text file……………………………………………………….. 40
Figure 5.4: Schematic of work zone with missing sign at US-73 marked out…………….. 44
Figure 6.1: Data distributions of sensors 1 and 2 when PCMS on………………………… 46
Figure 6.2: Data distribution of sensors 1 and 2 when PCMS off…………………………. 46
Figure 6.3: Data distribution of sensors 1 and 2 without PCMS…………………………... 46
Figure 6.4: Average speed comparison in conditions……………………………………… 55

x
Figure 6.5: Histograms showing frequency of speed change by vehicle class……………. 57
Figure 6.6: Mean speed change of vehicle classes for three cases………………………... 60
Figure 6.7: Distribution speeds by 5-mph speed intervals with PCMS was on…………..... 65
Figure 6.8: Distribution speeds by 5-mph speed intervals with PCMS turn off…………… 66
Figure 6.9: Distribution speeds by 5-mph speed intervals without PCMS………………… 66
Figure 6.10: Percentage speed change when PCMS on………………………………….....69
Figure 6.11: Percentage speed change when PCMS off…………………………………… 70
Figure 6.12: Percentage speed change when without PCMS…………………………….... 70
Figure 6.13: ‘Have you exceeded a work speed limit?’ (US-36)………………………….. 73
Figure 6.14: ‘Have you exceeded a work speed limit?’ (US-73)………………………….. 73
Figure 6.15: ‘What is the top reason you are likely to speed in a work zone?’ (US-36)….. 77
Figure 6.16: ‘What is the top reason you are likely to speed in a work zone?’ (US-73)…... 77
Figure 6.17: ‘What is the most common reason you are likely to obey the speed
limit in a work zone?’ (US-36)…………………………………………………………...... 78
Figure 6.18: ‘What is the most common reason you are likely to obey the speed
limit in a work zone?’ (US-73)…………………………………………………………….. 79
Figure 6.19: Rank the following signs as FIRST and SECOND most effective
for encouraging safe work zone driving?(US-36)…………………………………………. 83
Figure 6.20: Rank the following signs as FIRST and SECOND most effective
for encouraging safe work zone driving?(US-73)…………………………………………. 84
Figure 6.21: Question 8: Which of these signs did you see on the way into
the work zone? (US-36)……………………………………………………………………. 86
Figure 6.22: Question 8: Which of these signs did you see on the way into

xi
the work zone? (HW 73)…………………………………………………………………… 86
Figure 6.23: About how many work zones related accidents occurred in
2006 in the State of Kansas? (US-36)……………………………………………………… 89
Figure 6.24: About how many work zones related accidents occurred
in 2006 in the State of Kansas? (US-73) ………………………………………………….. 90
Figure 6.25: How many work zone related fatalities occurred in
2006 in the State of Kansas? (US-36)……………………………………………………… 92
Figure 6.26: How many work zone related fatalities occurred in
2006 in the State of Kansas? (US-73)……………………………………………………… 92
Figure 6.27: ‘Would presenting this information in a work zone
encourage you to drive more cautiously?” (US-36)………………………………………. 93
Figure 6.28: ‘Would presenting this information in a work zone
encourage you to drive more cautiously?” (US-73)……………………………………….. 94

1
CHAPTER 1 – INTRODUCTION
1.1 Problem Statement
For decades, safety within highway work zones has been a major concern of engineers,
government agencies, the highway industry, and the public. More than 40,000 people are injured
each year as a result of work zone crashes (Fars 2006). In 2006, 466 severe crashes were
reported in Kansas work zones alone, leaving 15 killed and 659 injured. These numbers
contributed to an overall increase of 43% compared to 2005 in the total number of fatalities and
injuries in Kansas (KDOT 2007). Over the last 10 years, the annual number of people killed in
work zone crashes has increased by 45%, up to 1,010 in 2006 (FARS 2006). Figure 1.1 shows
the fatality rate from 1982 to 2006.
Figure 1.1: Histogram of Fatality (FARS 2006)

2
In addition, the United States is one of the leading countries in spending for highway
maintenance and construction. Based on crash data from 1995 to 1997, the direct cost of
highway work zone crashes escalated as high as $6.2 billion per year, an average cost of $3,687
per crash (Mohan and Gautam 2002).
Since the 1960s, researchers have been studying work zone safety (Mohan and Gautam
2002). A significant number of relevant studies have been published to unveil safety problems
and to propose safety improvements in work zones (Bai 2002, Bai and Cao 2003, Schrock et al.
2004, Li and Bai 2008a). Work zone safety is affected in large part by the type of vehicles
passing through a work zone. Benekohal and Shim (1999) found that 90% of surveyed tractor-
trailer truck drivers considered traveling through a work zone to be more dangerous than driving
under normal conditions. Driver precaution is also an important factor in the safety of motorists
and construction workers in work zones. Excessive vehicle speeds, variation of speeds between
different vehicles, driver inattention, and erratic maneuvers are some of the factors that have
been extensively cited as the main causes of traffic crashes in highway work zones (Zech and
Mohan 2008; Daniel et al 2000; Fontaine and Carlson 2001; Hall and Lorenz 1989; Ha and
Nemeth 1995; Migletz et al 1999; Wang et al 1996; Bai and Li 2006; Bai and Li 2007; Bai and
Li 2008).
Researchers are most concerned with reducing traffic speeds in work zones, and believe
speed reductions will ultimately be the most effective in reducing crashes and fatalities (Zech
and Mohan 2008). In order to reduce vehicle speeds, the signage system has been enhanced and
studies of speed control measures have been conducted. With the growth of technology, using
new equipment and adapting to new procedures have been utilized to improve the efficiency of
work zones.

3
Though researchers have published numerous studies on various safety-related work zone
concerns, there are still numerous issues to be resolved and practices to be improved upon.
Safety in two-lane, rural highway work zones is one such issue and the focus of this study. This
report presents the results of a field study conducted on two rural highway work zones in Kansas
(US-36 and US-73) in order to evaluate the effectiveness of Portable Changeable Message Signs
(PCMS). This traffic device was used as a speed control measure under three conditions: 1)
PCMS on; 2) PCMS off, but still visible; and 3) PCMS removed from the road and out of sight.
Researchers also evaluated the effectiveness of temporary traffic control (TTC) devices based on
motorists’ responses to the signs; motorists were placed in one of three vehicle classes including
passenger car, truck, and semitrailer in order to better evaluate the vehicle speeds.
1.2 Report Organization
This report is organized as follows:
1. Introduction. The introduction chapter presents the general problem statement of
the research and a brief description of the report organization.
2. Literature review. Relevant findings from a comprehensive literature review are
synthesized in this chapter. Topics of the review include: impact of CMS on
work zones, effectiveness of speed control measures in rural work zones,
classification and safety countermeasures using PCMS in work zones, and use of
the survey method in work zones. The content studied in the literature review
provides the background information for this research project.
3. Research objective, scope, and methodology. The primary objective, scope, and
methodology of this research project are defined in this chapter.

4
4. Field experimental design. This chapter describes the field experiments
conducted during the research project, as well as the devices used for data
collection. A description of the survey questionnaire is also provided.
5. Data collection. This chapter describes the data collection procedures, as well as
the collected vehicle speed data and survey data.
6. Data analysis. The analyses of the collected speed data and survey data are
included in this chapter. The chapter begins with the methodology of data
analyses and then proceeds with the detailed analysis results of both speed data
and survey feedback collected during the field experiments.
7. Conclusion and recommendation. Based on the results of this research project,
conclusions and recommendations on the effectiveness of the PCMS, the
feasibility of utilizing this traffic control device, and its implementation are
provided in this chapter.

5
CHAPTER 2 – LITERATURE REVIEW
2.1 Introduction
Work zone safety is a major issue across the United States. A national study found that
fatal crash frequencies and average fatalities per crash were higher in work zones, especially
those on rural highways which accounted for 69% of all fatal crashes (AASHTO 1987). Another
study found that accident rates on highways were 7-119% higher in work zones than roads
without any construction (Wang et al 1996). With the increased probability of crashes and
fatalities in work zones and the rising number of work zones across the nation, it is vital that
work zone safety increase.
Numerous studies have been conducted on the subject of work zone safety. According to
the Manual on Uniform Traffic Control Devices (MUTCD), a work zone is divided into four
areas: the advance warning area, the transition area, the activity area, and the termination area
(FHWA 2003). Previous studies agree that an unbalanced distribution of crashes occur within
these four areas; however, different studies have declared each work zone area the most
dangerous. For example, the advanced warning area (Pigman and Agent 1990), the activity area
(Garber and Zhao 2002; Schrock et al 2004), the transition area, and the termination area
(Nemeth and Migletz 1978; Hargroves 1981) have all been identified as the most dangerous
work zone area in terms of severe crash frequency.
2.2 Traditional Work Zone Traffic Control Methods and Effectiveness
Highway work zones use temporary traffic control (TTC) devices to provide continuity of
reasonably safe and efficient traffic flows during road work. As indicated in the MUTCD

6
(FHWA 2003), TTC devices commonly used in work zones include flaggers, traffic signs, arrow
panels, portable changeable message signs, channelizing devices, pavement markings, lighting
devices, temporary traffic control signals, and rumble strips. A review of these traffic control
methods and their related studies is presented herein.
A typical work zone on a two-lane highway occupies one lane for roadwork while the
other remains open for incoming traffic from both directions. This type of work zone is
assembled for a short duration (a few hours to several days) and requires frequent movement due
to roadwork progress. Thus, safely coordinating and guiding two-way traffic through the work
zone is crucial. These one-lane, two-way work zones typically utilize traffic control devices
such as flaggers and pilot-cars to control traffic flows and provide safety for travelers and
highway workers. According to MUTCD, such work zones may require the proper
implementation of the following traffic control methods (FHWA 2003):
Configuration of flagger control. Flaggers are qualified personnel wearing high-visibility
safety apparel and equipped with hand-held devices such as STOP/SLOW paddles, lights, and
red flags to direct vehicles through work zones. The MUTCD suggests that flaggers should be
located at the work zones in order to allow incoming vehicles a sufficient distance to stop at an
intended stopping point. Flaggers should be preceded by an advance warning sign or signs and
should also be illuminated at night. When a one-lane, two-way work zone is short enough to
allow a flagger to see from one end of the work zone to the other, a single flagger may be used to
control traffic. For relatively long work zones, a flagger at each end of the work zone is
necessary. These flaggers should be able to communicate with each other orally, electronically,
or with manual signals. In addition, flaggers should coordinate traffic so that vehicles from one

7
end of the work zone do not proceed until vehicles from the opposite direction have traveled
through the work zone. Figure 2.1 shows a flagger in control of the traffic.
Figure 2.1: Flagger position in the work zone
A study (Richard and Dudek 1986) revealed that flaggers are most efficient on two-lane,
two-way rural highways and urban arterials where they are able to attract the majority of drivers’
attentions. Flaggers are also well-suited for short-duration applications (less than one day) and
for intermittent use at long-duration work zones. Garber and Woo (1990) concluded that the
most effective combinations of traffic control devices for work zones on multilane highways are
cones, flashing arrows, and flaggers. They found that the most effective combinations of traffic
control devices for work zones on urban two-lane highways are cones and flaggers, and static
signs and flaggers. Hill (2003) proved that flaggers were effective in reducing fatal work zone
crashes. However, the study by Benekohal ea al. (1995) indicated there was a need for

8
improving flagging for heavy truck traffic. Their survey showed that one third of the surveyed
truck drivers believed the flaggers were hard to see; half of them thought the directions of the
flaggers were confusing. Recent evaluations (Li and Bai 2008b) showed that the presence of
flaggers in work zones could lower the odds of fatalities caused by severe crashes by 56%.
Proper use of pilot vehicle. A pilot car may be used in a one-way, two-lane work zone to
guide a queue of vehicles. The operation of a pilot vehicle should be coordinated with flagging
operations or other controls at each end of the work zone. A “PILOT CAR FOLLOW ME” sign
should be mounted on the pilot vehicle at a prominent location. The vehicle may also turn on its
emergency lights and additional flashers to improve its visibility.
Other traffic signs and signals. In addition to flaggers and pilot vehicles, other
supplemental traffic control methods used in one-lane, two-way work zones include traffic
control signals and STOP or YIELD traffic signs. When conditions allow (e.g., when the signs
and signals are sufficiently visible to approaching vehicles and drivers are able to see the
opposite end of the work zone), these methods may also be used independently for traffic
control.
As listed in the MUTCD, traffic signs in work zones include regulatory signs, warning
signs, and guide signs. Regulatory signs inform road users of traffic laws or regulations and
indicate the applicability of legal requirements that would not otherwise be apparent. Most
regulatory signs are rectangular with a black legend and border on a white background. Warning
signs notify road users of specific situations or conditions on or adjacent to a roadway that
otherwise might not be apparent. Common warning signs are diamond-shaped with a black
legend and border on a yellow background and are placed in advance of work zones. Guide
signs along highways provide road users with information to help them through work zones.

9
Traffic signs in work zones are important in informing travelers about interrupted traffic
conditions. A survey indicated that 50% of surveyed truck drivers wanted to see warning signs
3-5 miles in advance of a work zone (Benekohal et al. 1995). Garber and Woo (1990) found that
static traffic signs could effectively reduce crashes in work zones on urban two-lane highways
when used with flaggers. However, Li and Bai (2008b) found that stop signs in work zones
could triple the odds of crashes caused by “following too closely.”
Arrow Panels and Portable Changeable Message Signs. An arrow panel is a sign with a
matrix of elements capable of either flashing or sequential display. A portable changeable
message sign is a message sign with the flexibility to display a variety of messages. Arrow
panels and portable changeable message signs usually contain luminous panels with high
visibility that makes them an ideal traffic control supplement during both day and night.
Many studies have been conducted on the development, use, and effectiveness of
changeable message signs (CMS) in reducing speeds and informing traffic of an upcoming work
zone. Various studies have shown that CMS are more effective than traditional traffic control
devices in reducing the number of speeding vehicles in work zones (Garber and Patel 1994,
Garber and Srinivasan 1998, Brewer et al. 2006). However, Richards and Dudek (1986) state
that CMS could result in only modest reductions (less than 10 mph) when used alone, and the
devices would lose their effectiveness if operated continuously for long periods with the same
message. Another evaluation (Dixon and Wang 2002) showed that changeable message signs
with radar effectively reduced vehicle speeds in the immediate vicinity of the sign. But once
again, vehicles tended to return to their original speeds after passing the signs. Huebschman et
al. (2003) argued that changeable message signs are actually no more effective than traditional
message panels.
10
Channelizing Devices. Channelizing devices are used to warn road users of changed
traffic conditions in work zones and to safely and smoothly guide travelers through work zones.
Channelizing devices include cones, tubular markers, vertical panels, drums, barricades, and
temporary raised islands. Results of a study (Pain et al. 1983) showed that most channelizing
devices were effective in alerting and guiding drivers, but the devices only obtained their
maximum effectiveness when properly deployed as a system or array of devices. Garber and
Woo (1990) however, found that the use of barricades in any combination of traffic control
devices on urban multilane highways seemed to reduce the effectiveness of other traffic control
devices.
Temporary Pavement Markings. Temporary pavement markings are maintained along
paved streets and highways in all long- and intermediate- term stationary work zones. In
addition, temporary raised pavement markers and delineators are used sometimes to supplement
pavement markings to highlight travel paths. Pavement markings can be used to control speeds.
A traffic control strategy using modified optical speed bars to meet the conditions of highway
work zones has been applied to control speeds in work zones. Optical speed bars are an
innovative speed control technique that use transverse stripes spaced at gradually decreasing
distances on pavement to affect a driver’s perception of speed. Meyer (2004) conducted a study
to evaluate the effectiveness of this strategy in reducing work zone speed in Kansas. Results of
the study showed that the speed bars had both warning and perceptual effect, and were effective
in controlling speeds and reducing speed variations.
Lighting Devices. Lighting devices are used based on engineering judgment to
supplement retroreflectorized signs, barriers, and channelizing devices. The four types of
lighting devices commonly used in work zones are floodlights, flashing warning beacons,

11
warning lights, and steady-burn electric lamps. These devices attract drivers’ attentions and can
illuminate work zones or warn drivers of the complicated travel conditions throughout the day
and night. It was recommended that properly aimed and aligned lighting was important for
nighttime work zone setup in order to avoid glare (Cottrell 1999). Some studies (Huebschman et
al. 2003; Arnold 2003) found that using flashing warning lights, especially the flashing lights of
police vehicles, was one of the most effective approaches for reducing speeds in work zones.
Temporary Traffic Control Signals. Temporary traffic control signals are typically used
for conditions such as temporary one-way operations in work zones with one operable lane, as
well as work zones containing intersections. The MUTCD suggests that temporary traffic
control signals should be used in accordance with other traffic control devices such as warning
and regulatory signs, pavement markings, and channelizing devices. In addition, temporary
traffic control signals should be designed and placed in connection to other traffic control signals
along the roadway. Those signals not in use should be covered or removed. Some analyses of
fatal crashes in work zones showed that certain temporary traffic control signals, such as
STOP/GO signals, were very effective in reducing fatal crashes in work zones (Hill 2003).
Rumble Strip. Rumble strips consist of intermittent, narrow, transverse areas of rough-
texture or slightly raised or depressed road surface that extend across travel lanes to alert drivers
of unusual traffic conditions through noise and vibration. Longitudinal rumble strips are rough-
textured road surfaces located along the shoulder to alert road users that they are leaving the
travel lanes. Two types of temporary transverse rumble strips were tested by Horowitz and
Notbohm (2005). Test results showed that the rumble strips with a depth of 0.25 in. were as
effective as cut-in-pavement rumble strips when vehicles traveled at 55mph. The rumble strips
with a depth of 0.75 in. were effective for vehicles traveling at a speed between 10 and 40 mph.

12
Another evaluation (Meyer 2006) of temporary rumble strips revealed that properly designed
strips could be easily installed and reinstalled. The disassembly of these rumble strips was not
extremely difficult and could be completed by individual workers. A study by Fontaine and
Carlson (2001) showed a reduced percentage of passenger cars that exceeded the 70 mph speed
limit due to the implementation of rumble strips.
2.3 Research and Development Trends in Work Zone Safety
This section presents an overview of some relatively new technologies and
methodologies that have benefited or could benefit work zone safety practice and research.
Mitchell et al. (2005) conducted a study in a laboratory environment to assess the validity of
using a driving simulator to determine the effectiveness of several speed control techniques in
highway work zones. The AMOSII simulator from Doran Precision Systems, Inc. used in the
study was operated from one control station and networked with five individual computers. The
study simulated a work zone with three different conditions: no speed control, rumble strips
placed in advance of the lane closure taper, and narrow traffic lane through the work zone.
Through the statistical analysis of the data obtained from the simulations, the researchers found
that the narrow-lane scenario was effective in reducing vehicle speed through entire work zones.
The placement of rumble strips appeared to be effective only in the transition area, but not in the
work activity area where construction workers were exposed to traffic.
The new technology of CMS is gaining widespread popularity in many jurisdictions. The
Ontario Ministry of Transportation (OMT) is one location where CMS are widely employed.
More than 41 CMS have been installed on the highways to provide drivers with AMBER alerts

13
and warnings of upcoming traffic conditions such as congestion, construction, incidents, or travel
time information.
According to the MUTCD (FHWA 2003) for streets and highways, a CMS is a sign that
is capable of displaying more than one message and can be changed by manual, remote, or
automatic control. These signs are referred to as Dynamic Message Signs (DMS) in the National
Intelligent Transportation Systems (ITS) Architecture. DMS are commonly used to indicate
traffic flow, weather, speed limits, individual speed, alternative-route guidance systems, and
highway conditions to drivers. DMS could also be referred to as PCMS if the DMS are portable
and can easily be transferred from one location to another. Most research tests the effectiveness
of DMS under a simulated driving environment rather than real life situations (Miller 2007 and
Miller et al 2008). Few investigations have focused on the effectiveness of DMS based on the
reduction of vehicle speed in a work zone environment. CMS have become an integral part of
work zone traffic control, advising motorists of unexpected traffic and routing situations. The
following section briefly reviews research of CMS used in work zones in order to reduce crashes
and improve work zone safety.
Zech, Mohan, and Dmochowski (Zech and Mohan 2008) measured the effectiveness of
three commonly used CMS messages in reducing vehicle speeds and speed variance in highway
work zones. They conducted a field study on Interstate 90 in western New York State and
recorded speed measurements of nearly 180,000 vehicles. The three types of CMS messages
tested in the study were: (1) RIGHT|LANE|CLOSED ~ KEEP|LEFT; (2) WORK ZONE|MAX
SPEED|45 MPH ~ BE|PREPARED|TO STOP; and (3) LEFT|LANE|CLOSED ~ KEEP|RIGHT.
Of the CMS messages tested, the second CMS message proved the most effective, significantly
reducing vehicle speeds by 3.3-6.7 mph (5.3-10.8 km/h). This research revealed that properly

14
selected CMS messages can be significantly effective in reducing speeds of all classes of
vehicles in highway work zones.
Fontaine and Carlson (2001) evaluated the effectiveness of speed displays and portable
rumble strips in reducing vehicle speeds. The field studies were conducted in four sites in the
Childress District in Texas. All four sites were rural-maintenance work zones on low-volume,
two-lane roads with 112.7 km/h (70 mph) speed limits. Fontaine and Carlson found that the
speed display effectively reduced vehicle speeds. Passenger car speeds were between 2 and 9
mph (3.2 and 14.5 km/h) lower in the advance warning area of the work zone than with only
normal traffic control devices present. Also, speed displays appeared to produce a greater speed
reduction in commercial trucks than in passenger cars. Speeds were 3-10 mph (4.8-16.1 km/h)
lower with the speed display for trucks in the advance warning area of the work zone.
Garber and Srinivasan (1998) conducted a research project using a CMS equipped with a
radar unit on highways in Virginia. The CMS was placed within the work area at the beginning
of the lane taper. Four different messages were evaluated during the course of the study, and
researchers found that the message “YOU ARE SPEEDING. SLOW DOWN” was the most
effective. They also concluded that the CMS equipped with a radar unit was effective for work
zones with long durations.
Benekohal and Shu (1992) observed the effectiveness of placing a single CMS in advance
of work zones. Although the speed reductions were statistically significant in general, they were
not practically significant for speed reduction in trucks. However, for some automobiles
exceeding the speed limit, the CMS was able to reduce vehicle speed by 20 %.
Ullman (1991) evaluated the effectiveness of using radar transmissions to reduce speeds
without visible enforcement. Results showed that the radar signal generally reduced speeds by 3

15
mph (4.82 km/h) and had a greater effect on commercial trucks than cars. Jackels and Brannan
(1988) conducted a similar study using a radar-controlled speed sign. The study revealed that the
85th percentile speeds were reduced from 68 to 58 mph (109.3 to 93.26 km/h) with the
installation of the static signs. The installation of the radar-controlled speed sign reduced the
85th percentile further to 53 mph (85.22 km/h).
2.4 Semitrailers and Safety in Work Zones
The frequent involvement of heavy trucks in work zone crashes is a major work zone
safety concern. Studies have found that the percentage of crashes involving trucks are much
higher in work zones (AASHTO 1987, Pigman and Agent 1990). Studies have also found that
crashes related to heavy trucks were more likely to involve multiple vehicles and frequently
resulted in fatalities and large monetary loss (Pigman and Agent 1990, Schrock et al. 2004).
2.5 Use of Survey Method in Work Zones
Surveys are useful in highway research projects to understand drivers’ perceptions of
work zone conditions. Benekohal et al. (1995) conducted a statewide opinion survey of 930
semi-trailer truck drivers to study their concerns about traffic control in Illinois work zones. The
survey contained questions about the drivers’ assessment of work zones and the traffic control
devices and their suggestions for improving traffic flow and safety in work zones. Researchers
found that 90% of the surveyed truck drivers considered driving through work zones more
hazardous than in other areas because of the frequent occurrence of crashes. A portion of the
drivers also suggested that the traditional warning signs were not explicitly clear and that more

16
signs should be added to work zones. In addition, approximately half of the drivers wanted to
see a warning sign 3 to 5 miles in advance of the work zones.
Surveys are also useful in evaluating the effectiveness of traffic control devices in work
zones. Bushman and Berthelot (2005) used a survey to evaluate the effectiveness of the ITS
system utilized in two work zones in North Carolina. Results of the analyses of 333 completed
and returned questionnaires revealed that most motorists agreed that the work zones with this
system provided more up-to-date information of the traffic conditions. Most motorists also
believed that the information provided by the ITS was accurate, or at least accurate 95% of the
time. In addition, over 95 % of motorists supported the future use of these types of systems. The
results of this study proved that drivers acknowledged the benefits of the ITS in work zones.
A survey (Arnold, 2003) was also conducted in Virginia to evaluate the effectiveness of
using policemen as a traffic control method in work zones. The survey was distributed to the
personnel in the Virginia Department of Transportation (VDOT), Virginia State Police (VSP),
and VMS, Inc. Based on the analyses of the results of the survey, the researchers concluded that
the presence of policemen and police cars with flashing lights in highway work zones was
undoubtedly effective in controlling driving speed and alerting inattentive drivers. The results
also revealed that VSP had been cooperating well with VDOT in meeting the goal of controlling
traffic in work zones.
Though there has been a substantial amount of studies published on work zone safety,
particularly in the areas of CMS use and vehicle type causality of crashes, questions remain. A
vast majority of studies have focused their efforts on the interstate highway system and rural
primary roads; only a small number of studies have been devoted to two-lane, rural highways.
Few of these studies have attempted to evaluate CMS or focus on vehicle size. This study

17
evaluates the effectiveness of a portable changeable message sign (PCMS) and a temporary
traffic sign (TTS).

18
CHAPTER 3 – RESEARCH OBJECTIVES AND
METHODOLOGY
3.1 Objectives
The three primary objectives of this research included: 1) to determine the effectiveness
of PCMS in reducing vehicle speeds on two-lane, rural highway work zones; 2) to determine the
effectiveness of a TTS, W20-1 (“Road Work Ahead”); and 3) to determine motorists’ responses
to the signage. The effectiveness of the PCMS was evaluated under three different conditions: 1)
PCMS switched on; 2) PCMS switched off, but still visible; and 3) PCMS removed from the
road and out of sight.
3.2 Methodology
The objectives of this research were achieved through the following steps.
Step 1: Literature review. Researchers first conducted a comprehensive literature review
to gather background information for the study. As presented in Chapter 2 of this report,
researchers synthesized findings from previous studies on topics including: the impact of CMS,
the effectiveness of speed control measures in rural work zones, safety countermeasure using
PCMS in work zones, crash statistics, and use of the survey method in work zones.
Step 2: Assessing the Effectiveness of PCMS to uncover motorists’ responses to the
warning signs. Two methods utilized during the field experiments were used to measure the
effectiveness of the PCMS in the work zones. One method was to compare the changes in
vehicle speeds with and without the PCMS. The vehicle speeds were measured by two
Wavetronix SmartSensor HD Model 125 sensor systems under three cases, including: 1) a

19
comparison of speeds captured when the PCMS was turned on and turned off; 2) a comparison of
speeds captured when the PCMS was turned on and when the device was removed from the road;
and 3) a comparison of speeds captured when the PCMS was turned off and when the device was
absent from the highway. If vehicle speeds decreased significantly in the comparison of these
cases, researchers could conclude that the PCMS impacted drivers’ behaviors.
The second method was to survey those drivers who travelled through the work zones
under one of the three conditions: 1) PCMS on; 2) PCMS off, but still visible; and 3) PCMS
removed from the road and out of sight. Under the third condition, drivers were warned of the
upcoming work zone only with the presence of a TTS (W20-1, “Road Work Ahead”). The
research team developed a questionnaire and surveyed drivers to determine if the PCMS
impacted their driving behaviors. To uncover motorists’ responses to the warning signs,
researchers divided the vehicles into three classes (passenger car, truck, and semitrailer) and
compared the mean speed change of the vehicle classes based on the three different sign
conditions mentioned above.
Step 3: Data analysis. The collected speed data and returned surveys were carefully
analyzed using statistics methods such as t-test, univariate analysis of variance test (ANOVA
test), and frequency analysis. In addition, drivers’ responses to the survey questions were
analyzed to determine the positive and negative implications regarding the potential
implementation of the PCMS and temporary traffic sign.
Step 4: Conclusion and recommendation. Conclusions of the effectiveness of PCMS and
drivers’ responses to the warning signs were reached based on the data analysis outcomes.
Recommendations for the potential implementation of the device and future research needs were
also outlined.

20
The remainder of the report is organized as follows. Authors will first describe the field
experimental design (Chapter 4), followed by data collection (Chapter 5) and data analysis
(Chapter 6). Conclusions and recommendations will then be presented in Chapter 7.

21
CHAPTER 4 – FIELD EXPERIMENTAL DESIGN
To achieve the objectives of this research, field experiments were conducted in two work
zones in Kansas. This chapter describes the field experimental design, including the
experimental device and installation, speed data collection, experimental site selection, and
development of the survey questionnaire.
4.1 Experimental Device and Installation
Vehicle speeds were collected by two SmartSensor HD Model 125 radar sensor systems.
The SmartSensor HD is capable of collecting vehicle speeds up to ten lanes and uses microwave
radar technology to detect speeds with minimal influence from environmental conditions
(TxDOT 2007). Table 4.1 summarizes the major technical data of a SmartSensor HD Model
125.
Table 4.1: Fact Sheet of SmartSensor HD Model 125
Category Description
Installation Relatively easy installation procedure. It can be mounted on an existing pole that provides proper height and distance.
Configuration Auto configuration, low requirement for human adjustments.
Detection Range Up to 10 traffic lanes, 6 to 250 ft.
Data Storage Flash memory-based data storage.
Data Downloading Wireless or cable downloading.
Operating Environment Temperature: -40oC to 75
oC; Humidity: up to 95% RH.
Maintenance Minimum maintenance required.
Source: Wavetronix LLC. (2007). “SmartSensor 125 Cut Sheet.” http://www.wavetronix.com/ support/smartsensor/125/documents/SS125_CutSheet.pdf. (Oct. 20, 2007).

22
Each radar system used in the field experiments of this study included the following components:
• One SmartSensor HD Model 125 unit including power and data cables
• One set of solar panels that charged two 12-volt batteries
• One equipment/battery cabinet - this cabinet housed the central control panel for the
SmartSensor and the solar battery set
• One laptop computer for data collection, monitoring, and downloading
• One set of 12-foot temporary mounting posts assembled by a seven-foot top, a six-foot
base, and three supporting anchors
As illustrated in Figure 4.1, the SmartSensor HD was mounted on the mounting post
approximately 12 feet above the ground and installed 8 to 12 feet away from the travel lane.
This distance provided a relatively safe lateral clearance for the equipment and the researchers
from the passing traffic. In addition, this distance also complied with the manufacturer-
recommended installation requirements. Field tests demonstrated that this installation
configuration enabled accurate speed collection, especially when the speeds of the passing
vehicles were greater than 20 mph.
A 40-foot cable connected the SmartSensor HD with the central control panel located in
the cabinet. This cable also delivered the speed data to the data ports in the control panel. Two
12-volt batteries were stored in the cabinet which could provide the required power to the sensor
for eight consecutive days. To monitor real-time data collection and data processing, a laptop
computer was connected to the central control panel in the cabinet through a RS232 9-pin
straight-through cable or a USB converter. In addition, the sensor was required to have
horizontal and vertical orientations and lane setup (direction, lane width, and lane location) for

23
each installation to ensure proper function. One of the SmartSensor HD speed detection systems
is shown in Figure 4.1. Figure 4.2 is a close up of the SmartSensor HD.
Figure 4.1: SmartSensor HD system

24
Figure 4.2: SmartSensor HD close up
Although the SmartSensor HD system has functions such as data storage and wireless
data downloading, a laptop computer and two researchers were employed in a real-time basis
during the data collection procedure due to the nature of this research project. It was necessary
to differentiate the speed comparison analyses between the different conditions and setups tested.
Therefore, each speed datum collected by the sensor had to be clearly verified with the proper
judgment of the speed corresponding to the speed passing by. The data also had to be labeled
under which of the three PCMS conditions the vehicle speeds were collected. As a result, a
laptop computer and real-time human supervision were needed so that the measured speeds
could be identified and then properly characterized.
In addition to the two radar sensor systems, the main test equipment of this research was
the PCMS. Researchers rented the PCMS model SMC1000 by Precision Solar Controls from
NES Traffic Safety in Eldorado, Kansas. The dimensions of the PCMS panel are 6.5 feet tall by
10 feet wide. The message of the PCMS changed from “SLOW DOWN” to “DRIVE SAFELY”

25
every three seconds. The PCMS was placed on the shoulder of the highway approximately 3 feet
from the road on the side of the highway where drivers approached the work zone. Since the
PCMS was located between the two sensors, the effectiveness of the PCMS was analyzed by the
change in vehicle speed that occurred between the sensors. Figure 4.3 is the PCMS used in this
experiment.
Figure 4.3: PCMS used for field experiments
Vehicle speeds were collected in the following fashion. The first sensor measured the
speed of the vehicle approaching the work zone. Then, a second sensor recorded the same
vehicle’s speed after the driver had passed the PCMS located between the first and second

26
sensor. The speed data were transferred to the laptop. Researchers recorded the time difference
between the two laptops and verified the speed of the car from the first sensor in order to match
the vehicle’s output by the corresponding laptop. Researchers had to verify each setup before
running the experiments.
4.2 Speed Data Collection and Experimental Site Selection
A key element for an accurate speed measurement was the proper location of the speed
detection equipment. The placement of the sensor was at a location that would help to better
understand the drivers’ reactions and deceleration behaviors. Assuming the PCMS was
effective, motorists approaching the work zone would drive more cautiously. Presumably,
drivers would 1) begin reducing their speeds earlier; 2) reduce their speeds more rapidly; or 3)
decelerate their vehicles both earlier and more rapidly. Any of the three reactions would result in
a lower speed at a certain stage during the deceleration process.
The success of the experiments greatly depended on the capture of the vehicle speeds at a
location where pronounced speed differences would occur given the PCMS was effective. For
this research, the SmartSensor HD was placed at the highway location where vehicles would
decelerate to a speed of 45 mph when entering the work zone from a 65 mph speed limit.
In order to collect the speed data of the vehicles, two sensors were utilized. The first
sensor (Sensor 1) was installed 1,050 feet from the first TTS with the message Road Work
Ahead. The second sensor (Sensor 2) was installed 550 feet from the first TTS. The PCMS was
located between the two sensors and was 200 feet away from Sensor 2. The design of the
sensors, PCMS, and the first TTS is shown in Figure 4. This layout was used for test condition 1

27
(PCMS on) and 2 (PCMS off, but still visible). The experimental layout remained the same for
test condition 3 (PCMS absent) except there was no PCMS present as shown in Figure 4.5.
Figure 4.4: Experimental layout for test conditions 1 and 2
Figure 4.5: Experimental layout for test condition 3
To test the motorists’ responses to the warning signs, researchers created three different
sign setups: 1) PCMS on, 2) PCMS off, and 3) TTS (W20-1, “Road Work Ahead”). The first
and second setups are similar to conditions 1 and 2 in Figure 4.4 and 4.5, respectively. In the

28
third setup, the first sensor was located near the first TTS (W20-1) in the advanced warning
zone. Sensor 1 was placed 300 feet away from the first TTS and 200 feet away from Sensor 2.
Figure 4.6 shows the third setup in detail.
Figure 4.6: Location of sensors in work zone for setup 3
The field experiments were conducted at two site locations. These sites were appointed
to the researchers by the KDOT Seneca office. The one-lane, two-way work zones on rural two-
lane highways with speed limits of 65 mph were selected. Other than availability, the two work
zones were selected for two major reasons: roadway type and work zone configurations.
In general, the traffic flows on urban two-lane roadways are considerably affected by
factors such as high traffic volume and traffic signals. The speed limits of these highways are
typically low (i.e. lower than 55 mph). Rural highways, on the other hand, do not have these
limitations and were suitable for this study. Work zones with multiple open lanes do not require
traffic to stop, and consequently may not suffer as severely from rear-end collision problems as
one-lane, two-way work zones where complete stops are required for through traffic. In
addition, one-lane, two-way work zones that require traffic stops give researchers an ideal
opportunity to conduct driver surveys.

29
Traffic characteristics, exclusively traffic volume, were critical factors for the success of
this study. During experiments, flaggers asked drivers to stop for approximately 10 to 15
minutes to wait for the pilot vehicle to lead traffic from the opposite direction. This delay
increased traffic and affected the experiment if the traffic volume of the road was high.
Therefore, it was necessary for the traffic volume of the study work zone to be moderate.
Fortunately, the traffic volume of the experimental work zones was extremely low and
researchers were able to collect enough data for analysis.
The first selected work zone was located on highway US-36 between K-87 and K-63, as
shown in Figure 4.7. This work zone was a two-lane highway section with a speed limit of 65
mph in north Kansas between Marysville and Seneca. The traffic volume for US-36 was 3,630
vehicles per day (vpd). The construction project took place in early June of 2008 and was a
paving (chip and seal) operation used to rehabilitate the roadway surface. The project required
one traffic lane to be closed to overlay the pavement while the other lane was kept in service. A
flagger was used at each end of the work zone for traffic control and a pilot vehicle was
employed to guide through traffic, as shown in Figure 4.8. Two stop locations at each end of the
work zone were moved approximately 3 to 4 times per day, depending on weather conditions and
project progress. Experiments were conducted at this work zone from June 3, 2008 to June 6,
2008.

30
Figure 4.7: Work zone on US-36 between K-87 and K-63
Figure 4.8: A pilot car at the US-36 work zone

31
The second selected work zone was located on US-73 between US-36 and K-20, as
shown in Figure 4.9. This work zone was a two-lane highway section with a speed limit of 65
mph located in northeast Kansas between Horton and Hiawatha. The annual average daily traffic
along the highway section was approximately 3,400 vehicles per day. A paving operation was
also occurring in this work zone in order to rehabilitate the roadway surface. A flagger was used
to control traffic at each end of the work zone and every major highway entrance. Two stop
locations at each end of the work zone were moved 3 or 4 times per day depending on the
weather and project progress. A pilot car was utilized to guide traffic safely through the work
zone. Experiments were conducted at this work zone from June 9, 2008 to June 11, 2008.
Figure 4.9: Work zone on US-73 between Hiawatha and Horton

32
4.3 Development of Survey Questionnaire
Prior to entering the work zone, traffic was required to stop at a flagger location to wait
for a pilot car. Drivers had to wait approximately 13 minutes for the pilot car to return from the
opposite direction. Surveys were conducted during this waiting period, which allowed for an
unhurried administration of the survey and enough time for drivers to provide thoughtful answers
to the questions.
The survey questions focused primarily on the attitudes and behaviors of motorists while
driving through the work zone. Drivers’ perceptions of posted and non-posted signs regarding
work zone conditions were also inquired. Results from this survey may be used to develop future
empirical studies of motorists’ perceptions and attitudes of work zone signage.
Given the limited time between the arrival and departure of motorists at the flagger
location, the survey was designed to take no more than 3 to 5 minutes to complete. All vehicles
except motorcycles and large semi-trucks were surveyed. Under no conditions were other
motorists disqualified from the survey. Drivers had the option of declining to participate in the
survey when approached by researchers at the flagger location. Motorists were informed that no
personal information was recorded and were asked to be as honest as possible with their
responses. The survey was divided into 3 parts: demographics, attitudes, and miscellaneous. An
example of the survey form is included in (APPENDIX I) of this report and the questions
included are described in the following section.
Attitudes
Question 1: Have you exceeded a work zone speed limit?

33
This was a yes-no question. If the motorist answered “yes,” further questions were asked
to understand the driver’s reasons for speeding. If the motorist responded “no,” Question 2 was
omitted.
Question 2: What is the most common reason you might speed in a work zone?
This question was designed to understand motorists’ reasons for speeding in a work zone.
To achieve a more focused answer, responses were limited to the following options: 1) Driving
with flow of traffic; 2) Work zone seemed inactive; 3) Did not see work zone; 4) In a hurry; and
5) Speed limit seemed inappropriate.
Question 3: What is the second most common reason you might speed in a work zone?
This question is an extension of the previous question. Motorists had to choose their
second best reason for speeding from the same responses provided in Question 2.
Question 4: Have you ever carefully obeyed the speed limit in a work zone?
This was a yes-no question. If the motorist answered “yes,” further questions were asked
to better understand the driver’s reasons for speeding. If the motorist answered “no,” Questions 5
and 6 were omitted.
Question 5: What is the most common reason you are likely to obey the speed limit in a
work zone?
This question sought to understand the attitudes of motorists who follow the posted speed
limits in work zones. Motorists were asked to choose from the following responses: 1) Driving
with flow of traffic; 2) Observed worker activity; 3) Motivated by warning signs; 4) Presence of
police; and 5) Speed limit seemed appropriate.
Question 6: What is the second most common reason you are likely to obey the speed
limit in a work zone?

34
This question is an extension of the previous question. Motorists had to choose their
second best reason for obeying the speed limit from the same responses provided in Question 5.
Question 7: Rank the following signs as FIRST and SECOND most effective for
encouraging safe work zone driving.
The following signs in Figure 4.10 were used to solicit motorists’ responses to Question
7. This question was designed to investigate the effectiveness of signs that evoke certain
emotions, such as fear.
Figure 4.10: Sign used to solicit motorist response

35
The first 2 signs, “Give ’Em a Brake” and “Hit a Driver,” were fairly familiar to
motorists in the survey region as they are often displayed on Kansas and Missouri highways. The
other 2 signs were not from the region; thus, the possibility of novelty may have caused
motorists to be more sensitive to these signs.
Question 8: Which of these signs did you see on the way into the work zone?
The signs in Figure 4.11 were used to investigate whether motorists were paying attention
to the signs as they approached the work zone.
Figure 4.11: Signs used to investigate whether motorists were paying attention
Miscellaneous
Question 1: About how many work zone-related accidents occurred in 2006 in the State
of Kansas?
This question was designed to gauge motorists’ baseline of knowledge regarding work
zone related accidents. Individuals who underestimate the baseline may make poor decisions
while driving in work zones. Possible answers included: 1) About 100; 2) About 500; 3) About
2000; and 4) About 5000. (KDOT – Kansas Traffic Accident Facts).

36
Question 2: How many work zone-related fatalities occurred in 2006 in the State of
Kansas?
This question gauged the motorists’ knowledge of work zone safety. Possible answers
included: 1) None; 2) Around a dozen; 3) Around two dozen; and 4) Over two dozen.
Question 3: Would presenting this information in a work zone encourage you to drive
more cautiously?
This was a simple yes-no question designed to understand motorists’ perceptions of signs
that provide statistical information of work zone-related accidents.
In addition to the above questions, the survey also included fields that recorded
demographic information such as gender and age. The duration of the motorists’ driving trips
was also requested. This information served as a means to compare possible group differences
between motorists.

37
CHAPTER 5 – DATA COLLECTION
5.1 Data Collection Procedure
5.1.1 Vehicle Speed Measurement
The research team conducted the experiments in two rural highway work zones in Seneca
and Hiawatha, Kansas. While construction operations were underway, the two lane highways
were reduced to one lane, two-way work zones. These operations required a Temporary Traffic
Control (TTC) device to coordinate vehicles entering the work zones. When the normal function
of the roadway is suspended, TTC provides continuity of motor vehicle movement (FHWA
2003). Inside the TTC zone, Temporary Traffic Signs (TTS) guided the vehicles through and
toward the flagger station where vehicles were stopped in order to wait for the pilot car. The
layout of the work zone is shown in Figure 5.1. The experimental location was located 550 feet
away from the first TTC in order to avoid disturbing the traffic control device and to exclusively
test the PCMS.
Figure 5.1: Work zone layout on US-36 and US-73

38
When the speed of a passing vehicle was captured, the speed detector sent the speed
datum to the connected notebook computer in real time and the computer displayed the speed on
a graphic interface that simulated the passing vehicle labeled with its speed. A research assistant
examined each speed datum displayed on the computer, recorded those that were incorrectly
detected, and made notes for researchers to discard the incorrect data. Factors other than the
considered work zone conditions occasionally interfered with vehicles and caused the data to be
incorrect. External factors included the interference of pedestrians, low-speed farm vehicles, or
construction-related vehicles operating at a very low speed or slowing in response to the
upcoming work zone conditions. In addition, a valid speed (the speed of a vehicle collected
when the PCMS was employed) occurred only when the vehicle speed in Sensor 1 matched the
corresponding vehicle speed in Sensor 2. The speeds were matched by verifying the difference of
the computer times and drawing a correlation between the data from Sensor 1 and Sensor 2.
5.1.2 Driver Survey
Four research assistants, A, B, C and D, were employed in the work zones to collect data.
Research assistants A and B were positioned near Sensor 1 and Sensor 2 while assistant C
assisted A and B with preliminary setup and troubleshooting of the software. Assistant C was
responsible for communicating to the rest of the researchers whether the PCMS was on or off.
Driver surveys were distributed by research assistant D in coordination with the rest of
the team. Once cars were fully stopped at the flagger location, assistant D approached the
motorist with the survey. A survey was considered complete if all the questions were answered
before the car departed. Figure 5.2 shows assistant D conducting a survey.

39
Figure 5.2: A research assistant conducting a driver survey
5.2 Collected Datasets
5.2.1 Vehicle Speed Data
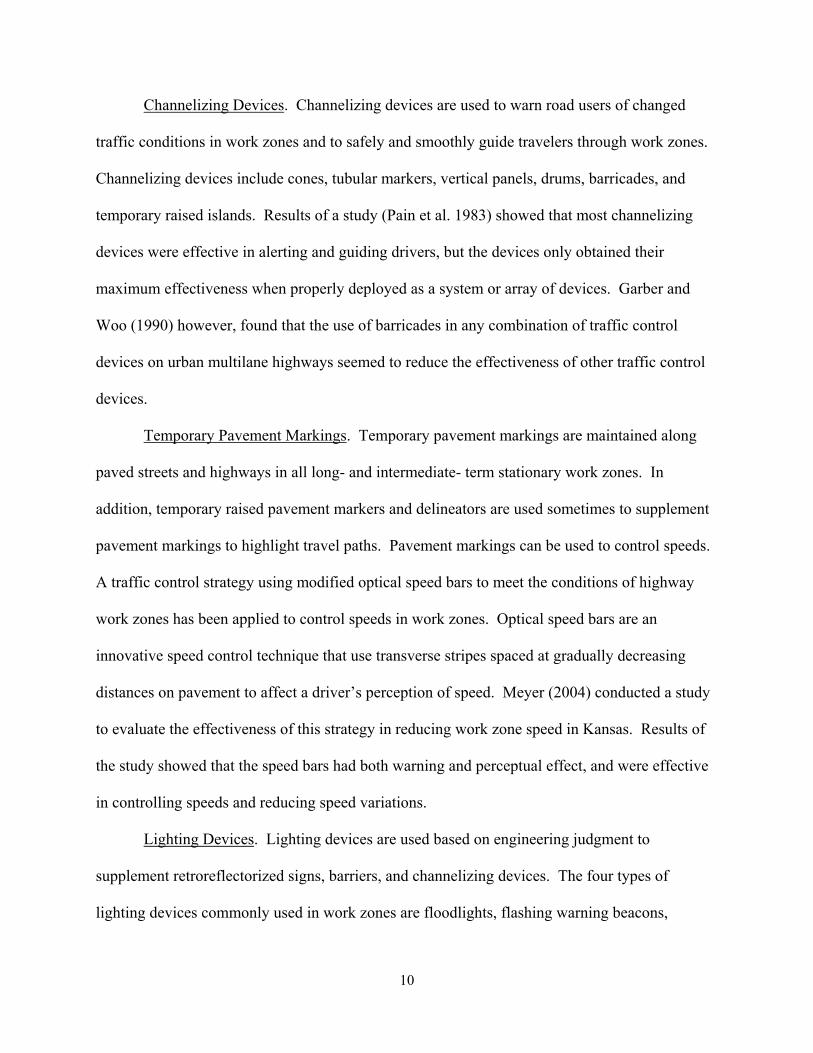
The sensors produced raw data files in a text file (.txt file) and classified the data by
lanes, length of vehicle, speed, vehicle class, range, date, and time as shown in Figure 5.3.
Appendix II presents the entire speed data file. The raw data collected from the field
experiments went through an extensive screening and analysis process. The raw data was first
thoroughly screened by matching individual vehicle data points recorded on Sensors 1 and 2.
Any vehicle that did not have a corresponding data point from both sensors was discarded. In
addition, a data point was discarded from the data population if accurate vehicle length, speed, or
40
any other value was not recorded by one of the sensors, regardless if there were two
corresponding data points. Finally, any data point that recorded a vehicle speed under 20 mph
was omitted from the data set because the sensors were unable to properly record speeds under
20 mph according to sensor specifications. Through this initial data screening and analysis, the
raw data was condensed and sorted before using a statistical analysis program to perform further
calculations and analysis.
Figure 5.3: Example of the text file
Table 5.1 shows a portion of the speed datasheet from Sensor 1 and Appendix II presents
the entire speed data from Sensor 1 and Sensor 2. In addition to the vehicle speeds, the datasheet
also included the following relevant traffic variables:
1. Sensor 1: Indicates whether Sensor 1 or Sensor 2 provided the data. Table 5.1
includes a portion of the data from Sensor 1.
2. Lane: This is a variable indicating the lane which the vehicle has passed by. The
SmartSensor HD has the capability of capturing up to 10 lanes. For this project,
experiments were conducted in two-lane work zones.

41
3. Length: This variable indicates the vehicle length detected by the SmartSensor
HD.
4. MPH: This variable is the detected speeds of the vehicles as they passed the
sensors.
5. CLASS: This variable indicates the type of vehicle passing the sensors. Vehicle
classes included passenger cars, trucks, and semi-trailers. A vehicle’s length
corresponded to its class.
6. RANGE: This is a secondary variable used to verify the classification of the data
in the initial data collection.
7. YYYY-MM-DD: This variable indicates the year, month, and day of the
experiment.
8. HH:MM: SS.SSS: This variable indicates the time when the vehicle passed the
sensor. Researchers used this variable to match data from Sensor 1 to Sensor 2.

42
Table 5.1: A Portion of the Speed Datasheet
Sensor 1
LANE LENGTH (MPH) CLASS RANGE YYYY‐MM‐DD HH:MM:SS.sss
LANE_01 15 15 1 20 6/13/2008 11:17:56
LANE_01 27 19 2 19 6/13/2008 12:36:39
LANE_01 17 27 1 19 6/13/2008 12:46:00
LANE_01 19 31 1 18 6/13/2008 11:11:58
LANE_01 21 31 2 20 6/13/2008 11:15:29
LANE_01 22 32 2 22 6/13/2008 11:53:22
LANE_01 17 34 1 20 6/13/2008 11:02:09
LANE_01 18 34 1 18 6/13/2008 11:11:54
LANE_01 23 35 2 20 6/13/2008 10:45:09
A successful experimental trial depended on both sensors to collect the vehicle speeds
during the experiment. A total of 976 vehicle speed data were collected. Of these, 358 vehicle
speed data were captured with the PCMS on, 435 were collected with the PCMS off, and 183
were collected when the PCMS was removed from the highway. Table 5.2 shows the list of data
collected from US-36 from June 2 to June 6, 2008 and from US-73 from June 9 to June 13, 2008.

43
Table 5.2: Speed Data by Different Experimental Conditions
Work Zone Speed Limit (mph) PCMS ON PCMS OFF Without PCMS
US-36 65 358 435 31
US-73 65 0 0 152
Total 358 435 183
5.2.2 Driver Survey Data
The initial survey design called for combined data sets, but due to on-site changes to the
work zone, separate data sets were created for each work zone. The US-36 work zone followed
protocol and presented all of the necessary signage; however, US-73 failed to display the orange
“No Passing Zone” sign on the left side of the roadway. A diagram of the work zones is
presented in Figure 5.5, with the missing sign from US-73 marked by a square. Note that this is
only a partial representation of the work zones where the surveys were conducted. This is an
important point, and will be discussed in greater detail in Chapter 6. Therefore, a total of 89
surveys at the US-36 work zone and 53 surveys at US-73 work zone were completed. The
completed surveys were compiled in a datasheet (Appendix III). Questions with multiple
responses appear as multiple columns in the datasheet to accommodate all responses.

44
Figure 5.4: Schematic of work zone with missing sign at US-73 marked out.
45
CHAPTER 6 – DATA ANALYSIS
6.1 Data Analysis Methodology
The effectiveness of the PCMS and the TTS was first assessed based on the comparison
tests. If the vehicle speeds evidently changed in favor of safety at the speed collection locations
after the PCMS or TTS was present, researchers concluded that both signs were effective in one-
lane, two-way work zones. In addition, the effectiveness of the PCMS and TTS was further
evaluated based on the responses of driver surveys distributed in these work zones. The
frequency analysis method was used for the analyses of the speed data and driver surveys. The
major task that needed to be accomplished in the analyses of speed data was the evaluation of the
change in vehicle speeds, which is briefly described in the following section.
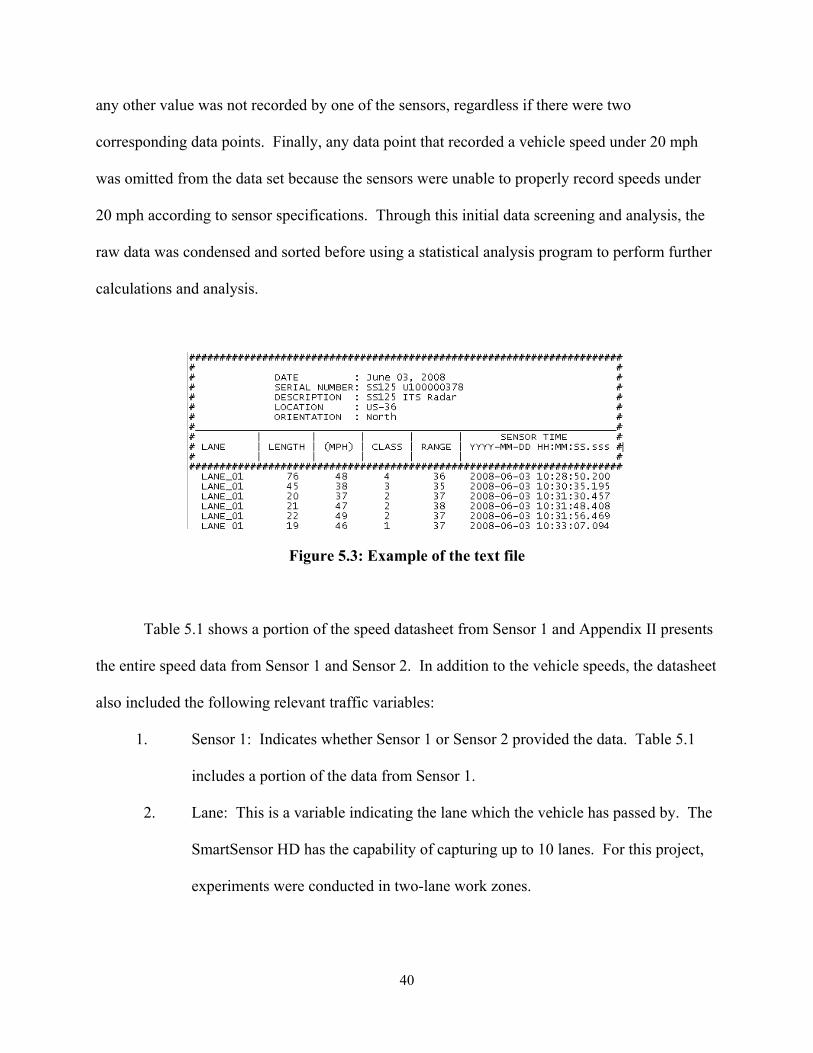
6.1.1 Change in Vehicle Speeds
Researchers sorted the data collected from Sensor 1 and Sensor 2 based on each
individual vehicle. The data collected for each experimental condition followed the normal
distribution. Figures 6.1, 6.2, and 6.3 show the graphs of the normally distributed data for each
condition.

46
Figure 6.1: Data distributions of Sensors 1 and 2 when PCMS on
Figure 6.2: Data distribution of Sensors 1 and 2 when PCMS off

47
Figure 6.3: Data distribution of Sensors 1 and 2 when PCMS absent
Due to the normal distribution, sample t-tests were performed to test for any significant
effects. The two-sample t-tests were developed to statically compare two population means
based on the hypothesis test. Researchers defined 3 comparison analyses to test the three PCMS
conditions as shown in Table 6.1. A more detailed explanation is presented in the comparison
analysis section of this report.
Table 6.1: Three Conditions and Data Information
Conditions Mean PCMS ON Mean PCMS OFF Without PCMS
Speed Limit Sensor 1 Sensor 2 Sensor 1 Sensor 2 Sensor 1 Sensor 2
65 mph 58.50 53.84 60.59 57.29 56.65 54.79
Speed Reduction 4.66 3.30 1.86
Reduction Percent 7.97% 5.45% 3.28%
6.2 Comparison Analysis
The effectiveness of the PCMS was measured based on the correlation of the vehicle
speed change or the difference in speeds from Sensor 1 and Sensor 2 under the three PCMS
conditions. The important tasks that were accomplished in the analyses of speed data include: 1)
analyses of the vehicle speed difference between Sensor 1 and Sensor 2 when the PCMS was
turned on and off; 2) a comparison of the change in vehicle speeds when the PCMS was on and
when the PCMS was removed from the highway; and 3) a comparison of the change in vehicle

48
speed when the PCMS was off and when the PCMS was absent from the road. There are a
number of ways to compare and analyze the effectiveness of the PCMS. One of the data
analyses that researchers discovered was the mean from Sensor 1 was greater than the mean from
Sensor 2 under all three experimental conditions. This could be due to the drivers’ awareness of
the road conditions when the PCMS was either on or off and researchers were present on the side
of the road. However, since researchers wanted to test the effectiveness of the PCMS under
three specific conditions, including the mean speed difference from Sensor 1 and Sensor 2 when
the PCMS was both on and off, the interference from the other sources was neglected and
assumed had little influence on drivers.
6.2.1 Comparison between PCMS on and off
The amount of data collected (population) from the sensors when the PCMS was on and
off was 358 and 435, respectively. Under the first condition of PCMS on, Sensor 1 recorded a
mean vehicle speed of 58.5 mph with a standard deviation of 9.85. Sensor 2 recorded a mean
vehicle speed of 53.84 mph with a standard deviation of 9.89. These values clearly show a 7.97
%, or 4.66 mph, speed reduction from Sensor 1 to Sensor 2. The minimum value and the
maximum value from Sensor 1 to Sensor 2 also show a decreasing pattern. Table 6.2displays
detailed statistical values for the first condition of PCMS on.

49
Table 6.2: Statistical Value for Condition 1
PCMS ON Sensor 1 Sensor 2
Population 358
Mean 58.5 53.84
Median 59 54
Standard Deviation 9.85 9.89
Min 29 26
Max 85 79
Reduction 4.66
Percent Reduction 7.97%
Under the second condition of PCMS off, researchers wanted to see if the blank device
would cause vehicle speeds to increase due to a belief that the work zone was inactive, or if
vehicle speeds would decrease due to the mere presence of the traffic control device. A recent
study shows that the misapplication of PCMS in work zones commonly causes confusion and
anxiety in drivers (Helmuth 2002). The statistic values when the PCMS was turned off also
indicate a decreasing pattern, but not as large as when the PCMS was turned on. The mean
speed reduction for Sensor 1 was 60.59 mph with a standard deviation of 8.76. Sensor 2 had an
average speed reduction of 57.29 with a standard deviation of 8.85. The percent reduction is
5.45 % as indicated in Table 6.3.

50
Table 6.3: Statistical Value for Condition 2
PCMS OFF Sensor 1 Sensor 2
Population 435
Mean 60.59 57.29
Median 62 59
Standard Deviation 8.76 8.85
Min 35 30
Max 86 80
Reduction 3.3
Percent Reduction 5.45%
“Case 1” is the first comparison analysis which compares the mean speed reductions
between the first and second conditions of PCMS on and PCMS off. Researchers defined a null
hypothesis (H0) and alternating hypothesis (H1) as shown below.
(Case 1)
H0 : (μ O1 - μ O2) ≤ (μ F1 - μ F2)
H1 : (μ O1 - μ O2) > (μ F1 - μ F2)
Where μ O1 or μ O2 = mean vehicle speed at Sensor 1 or Sensor 2 when the PCMS was on and
μ F1 or μ F2 = mean vehicle speed at Sensor 1 or Sensor 2 when the PCMS was off.
The null hypothesis was interpreted to indicate that the mean of the PCMS turned off is
no larger than that of the PCMS turned on. The alternating hypothesis, on the other hand, was

51
interpreted to indicate that the mean of the PCMS turned on is larger than that of the PCMS
turned off. A 5 % (0.05) level of confidence is used in the significance test. In other words, if
the result of the t-test indicates significances less than 0.05, then the null hypothesis can be
confidently rejected in favor of the alternating hypothesis.
Table 6.4 shows the results of the t-test for Case 1. Based on the results, the researchers
concluded that the null hypothesis of Case 1 could be confidently rejected in favor of the
alternating hypothesis. It is shown the significance is less than 0.05; in other words, this
indicates the statistical analyses proved that the mean reduction with PCMS on was greater than
the mean reduction with PCMS off.
Table 6.4: Results of Two-Sample t-Test for Means of Speeds for Case 1
Cases Conditions Population Significance Effectiveness
1 PCMS on 358
0.002 Yes PCMS off 435
6.2.2 Comparison between PCMS on and PCMS absent
Data collected at the first experimental location, US-36 between Seneca and Marysville,
was predominantly data with the PCMS present (PCMS on or off). The second location, US-73
between Horton and Hiawatha, was used to collect 183 speed data under condition 3 (PCMS
absent). The statistic values for condition 3 also indicate a decrease in values from Sensor 1 to
Sensor 2. As listed in Table 6.5, the mean for Sensor 1 is 56.65 with the standard deviation of
8.35. The mean for Sensor 2 is 54.79 with the standard deviation of 10.12. The percent
reduction is 3.28%, which was the smallest reduction among the three conditions.

52
Table 6.5: Statistical Value for Condition 3
Without PCMS Sensor 1 Sensor 2
Population 183
Mean 56.65 54.79
Median 58 55
Standard Deviation 8.35 10.12
Min 38 29
Max 74 87
Reduction 1.86
Percent Reduction 3.28%
“Case 2,” the second comparison analysis, compares the mean speed reduction between
the first and third conditions of PCMS on and PCMS absent. Researchers defined a second null
hypothesis (H0) and second alternating hypothesis (H1) as shown below.
(Case 2)
H0 : (μ O1 - μ O2) ≤ (μ N1 - μ N2)
H1 : (μ O1 - μ O2) > (μ N1 - μ N2)
Where μ O1 or μ O2 = mean vehicle speed at Sensor 1 or Sensor 2 when the PCMS was on and
μ N1 or μ N2 = mean vehicle speed at Sensor 1 or Sensor 2 when the PCMS was removed from
the highway (PCMS absent).
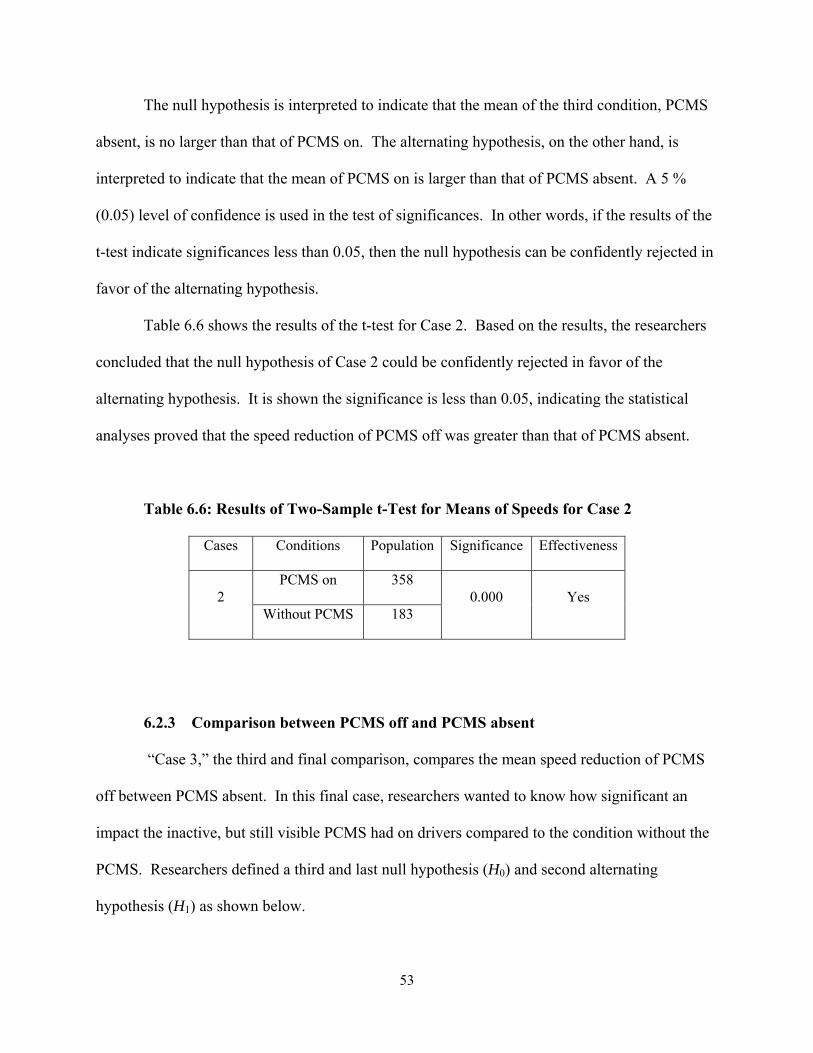
53
The null hypothesis is interpreted to indicate that the mean of the third condition, PCMS
absent, is no larger than that of PCMS on. The alternating hypothesis, on the other hand, is
interpreted to indicate that the mean of PCMS on is larger than that of PCMS absent. A 5 %
(0.05) level of confidence is used in the test of significances. In other words, if the results of the
t-test indicate significances less than 0.05, then the null hypothesis can be confidently rejected in
favor of the alternating hypothesis.
Table 6.6 shows the results of the t-test for Case 2. Based on the results, the researchers
concluded that the null hypothesis of Case 2 could be confidently rejected in favor of the
alternating hypothesis. It is shown the significance is less than 0.05, indicating the statistical
analyses proved that the speed reduction of PCMS off was greater than that of PCMS absent.
Table 6.6: Results of Two-Sample t-Test for Means of Speeds for Case 2
Cases Conditions Population Significance Effectiveness
2 PCMS on 358
0.000 Yes Without PCMS 183
6.2.3 Comparison between PCMS off and PCMS absent
“Case 3,” the third and final comparison, compares the mean speed reduction of PCMS
off between PCMS absent. In this final case, researchers wanted to know how significant an
impact the inactive, but still visible PCMS had on drivers compared to the condition without the
PCMS. Researchers defined a third and last null hypothesis (H0) and second alternating
hypothesis (H1) as shown below.

54
(Case 3)
H0 : (μ F1 - μ F2) ≤ (μ N1 - μ N2)
H1 : (μ F1 - μ F2) > (μ N1 - μ N2)
Where μ F1 or μ F2 = mean vehicle speed at Sensor 1 or Sensor 2 when the PCMS was off and
μ N1 or μ N2 = mean vehicle speed at Sensor 1 or Sensor 2 when the PCMS was removed from
the highway.
The null hypothesis is interpreted to indicate that the mean of PCMS absent was no larger
than that of PCMS off. The alternating hypothesis, on the other hand, is interpreted to indicate
that the mean of PCMS off was larger than that of PCMS absent. A 5 % (0.05) level of
confidence is used in the test of significances. In other words, if the result of the t-test indicates
significances less than 0.05, then the null hypothesis could be confidently rejected in favor of the
alternating hypothesis.
Table 6.7 shows the results of the t-test for Case 3. Based on the results, the researchers
concluded that the null hypothesis of Case 3 could be confidently rejected in favor of the
alternating hypothesis. It is shown the significance is less than 0.05, meaning the statistical
analyses proved that the reduction with PCMS off was greater than the reduction of PCMS
absent.
Table 6.7: Results of Two-Sample t-Test for Means of Speeds for Case 3
Cases Conditions Population Significance Effectiveness
3 PCMS off 435
0.005 Yes Without PCMS 183

55
6.2.4 Summary
As mentioned above, there is a decreasing speed pattern for all of the PCMS conditions,
as shown in Figure 6.4. The normally distributed sample data and equality variances allowed
researchers to test the significances using the t-test within the cases. Using the SPSS software to
calculate the significance by the independent two-sample t-test (unequal sample size and equal
variance), results were 0.002 for Case 1, 0.000 for Case 2, and 0.005 for Case 3. Table 6.8
shows the computed values generated by SPSS. These values are significantly less than 0.05.
As a result, researchers concluded that all three null hypotheses were confidently rejected. Thus,
all three alternative hypotheses were statistically true.
Figure 6.4: Average speed comparison in conditions

56
Table 6.8: Independent Sample Test
Cases Significant Effectiveness? α = 0.05
1 0.002 YES
2 0.000 YES
3 0.005 YES
6.3 Comparison of Three Vehicle Classes
The frequency of individual vehicle speed changes, sorted by vehicle class, are shown in
the histograms in Figure 6.5. Each histogram in Figure 6.5 also contains a bell curve which
represents a plot of the normal distribution of the data set. The frequency of individual vehicle
speed changes tends to follow the normal distribution of the bell curve for each vehicle class.
Table 6.9 shows the results of the data collected during the field experiments broken down by
vehicle class. Results are displayed for each case based on vehicle class.

57
Figure 6.5: Histograms showing frequency of speed change by vehicle class

58
Table 6.9: Mean Speed Values Based on Class for Each Case
Vehicle Class Case N Sensor 1
Speed (mph)
Sensor 2
Speed (mph)
Mean Speed
Change (mph)
Speed Change
Percentage
Passenger Cars PCMS OFF 188 60.2 57.9 2.4 3.9%
PCMS ON 132 58.5 54.5 3.9 6.7%
TTS 74 50.5 45.3 5.2 10.3%
Trucks PCMS OFF 174 59.4 55.7 3.7 6.2%
PCMS ON 154 57.0 52.3 4.7 8.3%
TTS 53 48.2 45.4 2.8 5.8%
Semitrailers PCMS OFF 47 61.6 58.6 3.0 4.8%
PCMS ON 48 59.1 56.1 3.1 5.2%
TTS 6 49.2 44.2 5.0 10.2%
For the passenger car, truck, and semitrailer classes, the speed reductions were 2.4 mph,
3.7 mph, and 3.0 mph over a distance of 500 feet when the PCMS was off. These results reveal
that the PCMS, though turned off, could still affect a vehicle’s speed. The truck class exhibited
the highest speed reduction when the PCMS was off, showing a 6.2% speed reduction over a
distance of 500 feet.
When the PCMS was on, passenger cars, trucks, and semitrailers showed speed
reductions of 3.9 mph, 4.7 mph, and 3.1 mph over a distance of 500 feet. The results indicate
that the speed reduction of passenger cars and trucks increased 1.5 mph and 1.0 mph,
respectively. The activated PCMS affected the speeds of the truck class the most, showing a
speed reduction of 8.3% over a distance of 500 feet.

59
Passenger cars, trucks, and semitrailers experienced speed reductions of 5.2 mph, 2.8
mph, and 5.0 mph, over a distance of 500 feet when the PCMS was absent. Under this condition,
vehicles were warned of the upcoming work zone conditions only with the presence of a TTS.
Passenger cars responded to the TTS the most and exhibited the highest speed reductions among
the three classes approaching the advanced warning area of the work zone. However, the TTS
did not have the same effect as the PCMS.
As shown in Table 6.9, passenger cars exhibited the greatest speed reduction (10.3%)
when approaching the TTS. The greatest speed reduction (8.3%) for the truck class occurred
when the PCMS was on. The semitrailer class experienced the highest speed reduction (10.2%)
when approaching the advance warning area.
For two of the three PCMS conditions, the average speed of the semitrailer class was
greater than the other two vehicle classes. These results reveal that the PCMS was not effective
in reducing semitrailer vehicle speeds on rural highway work zones because semitrailer drivers
usually keep their high speeds when traveling on rural highways. Based on the analysis results,
the PCMS had the greatest effect on the truck class when it was either on or off, better than the
TTS (8.3%, 6.2%, and 5.8%). The change in speed for different vehicle classes is shown in
Figure 6.6.
Figure 6.6 provides a visual of the breakdown of mean speed changes for each case based
on vehicle class. The bar chart indicates that the truck class was the most responsive vehicle
class to Cases 1 and 2, both which involved the PCMS. The chart also indicates that the truck
class was the least responsive vehicle class to Case 3, which involved the TTS in rural work
zones. Another correlation that can be drawn from the chart is that the passenger car and

60
semitrailer classes were more responsive to the TTS than to the inactive, but still visible PCMS
placed on the side of the rural highway.
0
1
2
3
4
5
6
PCMS OFF PCMS ON TTS
Case
Mea
n S
peed
Cha
nge
(mph
)
Passenger CarTruckSemitrailer
Figure 6.6: Mean speed change of vehicle classes for three cases
The values of speed and length for each vehicle collected by the two sensors were
inserted into a statistical analysis program along with a corresponding numerical value to
represent which sign was present when the values were recorded. The differences in the values of
speed and length between Sensors 1 and 2 were then calculated and a frequency analysis was
performed based on these calculated values. The results show that there was a wide range of
values for change in length, with a standard deviation of 3.5 feet. It was decided that the majority
of values were within two standard deviations (7 feet) and therefore, all other points with a
positive or negative change greater than 7 were discarded. This was done to account for errors in
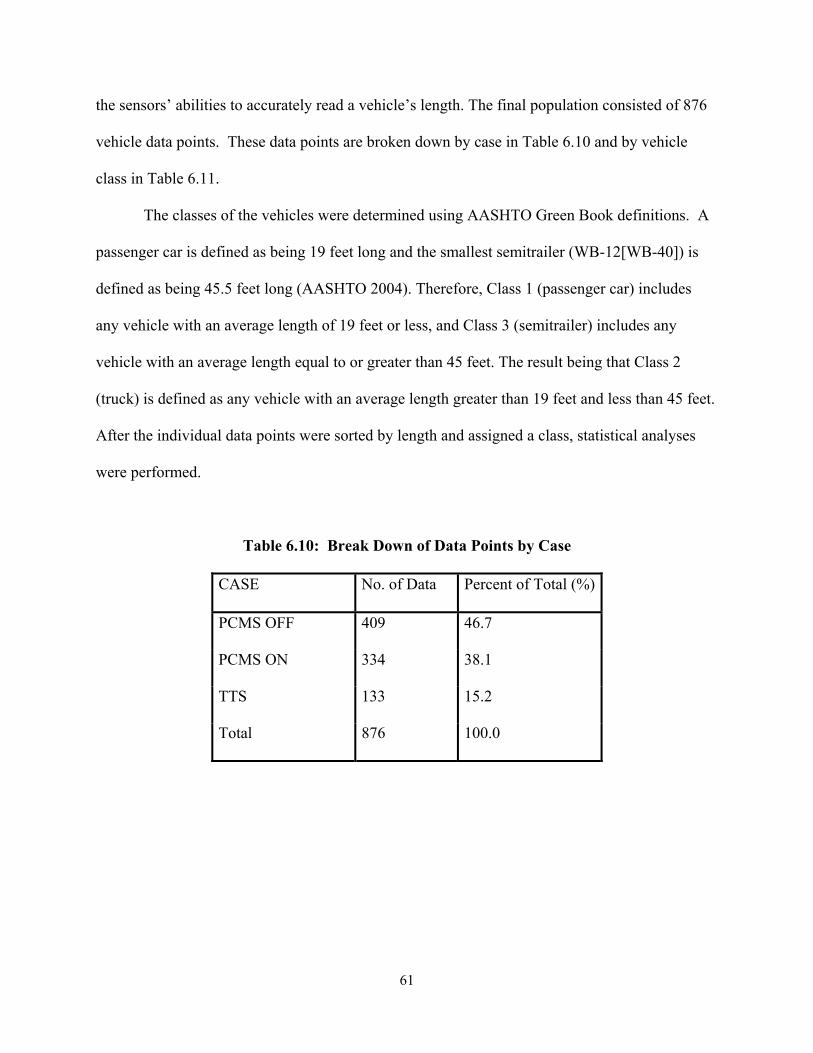
61
the sensors’ abilities to accurately read a vehicle’s length. The final population consisted of 876
vehicle data points. These data points are broken down by case in Table 6.10 and by vehicle
class in Table 6.11.
The classes of the vehicles were determined using AASHTO Green Book definitions. A
passenger car is defined as being 19 feet long and the smallest semitrailer (WB-12[WB-40]) is
defined as being 45.5 feet long (AASHTO 2004). Therefore, Class 1 (passenger car) includes
any vehicle with an average length of 19 feet or less, and Class 3 (semitrailer) includes any
vehicle with an average length equal to or greater than 45 feet. The result being that Class 2
(truck) is defined as any vehicle with an average length greater than 19 feet and less than 45 feet.
After the individual data points were sorted by length and assigned a class, statistical analyses
were performed.
Table 6.10: Break Down of Data Points by Case
CASE No. of Data Percent of Total (%)
PCMS OFF 409 46.7
PCMS ON 334 38.1
TTS 133 15.2
Total 876 100.0

62
Table 6.11: Break Down of Data Points by Vehicle Class
Vehicle Class No. of Data Percent of Total (%)
Passenger Car 394 45.0
Truck 381 43.5
Semitrailer 101 11.5
Total 876 100.0
6.3.1 Significance of test analysis
Besides frequency analysis, hypothesis tests were conducted during the data analysis
process. The null hypothesis of this research is that there is no change between cases in the mean
speeds of the three vehicle classes. The alternative hypothesis is that there is a difference
between cases in the mean speed of one or more of the vehicle classes. A univariate analysis of
variance (UNIANOVA) was performed on the data to determine whether the interaction between
the three cases and the three vehicle classes is significant. UNIANOVA is a two-way analysis of
variance with vehicle class and case as the two factors. The results of the UNIANOVA test are
shown in Table 6.12 and are based on a 95% confidence interval. Table 6.12 shows that the value
must be less than 0.05 for there to be a significant interaction between vehicle class and case and
for the null hypothesis to be rejected. Since the test returned a significance value of 0.019 for the
interaction between vehicle class and case, the null hypothesis was rejected in favor of the
alternative hypothesis.
Further UNIANOVA tests were performed to determine what factor(s) were causing a
significant interaction between vehicle class and case. Tables 6.13 and 6.14 show the
noteworthy findings of the in-depth pairwise comparison. Table 6.13 indicates that the passenger

63
car class is the only class having a significant effect and interaction with the three sign cases
because the significance value was 0.00. Table 6.14 shows a more in-depth, pairwise
comparison of the passenger car class with the three cases. The results in Table 6.14 indicate that
there was a significant interaction between PCMS off and the other two cases for passenger cars.
Table 6.12: UNIANOVA Test of Between-Subjects Effects
Source
Type III
Sum of
Squares
Degrees
of
Freedom
Mean
Square F Significance
Corrected Model 764.395a 8 95.549 3.072 .002
Intercept 4264.488 1 4264.488 137.097 .000
Vehicle Class 1.713 2 .856 .028 .973
Case 142.241 2 71.121 2.286 .102
Interaction
(Vehicle Class by
Case)
367.435 4 91.859 2.953 .019
Error 26968.540 867 31.106
Total 39255.000 876
Corrected Total 27732.935 875
a R Squared = .028 (Adjusted R Squared = .019)
* Dependent Variable = Mean Speed Change

64
Table 6.13: Comparison of Individual Vehicle Classes with Cases
Vehicle
Class
Analysis
Type
Sum of
Squares
Degrees
of
Freedom
Mean
Square F Significance
Passenger
Car
Contrast 478.505 2 239.252 7.692 0.00
Error 26968.54 867 31.106
Truck Contrast 175.1 2 87.55 2.815 0.06
Error 26968.54 867 31.106
Semitrailer Contrast 22.268 2 11.134 0.358 0.699
Error 26968.54 867 31.106
Each F tests the simple effects of sign case within each level combination of the other effects shown. These tests are based on the linearly
independent pairwise comparisons among the estimated marginal means
Table 6.14: Pairwise Comparison of Class by Case
Vehicle Class (I) Case (J) Case
Mean
Difference
(I-J)
Std. Error Significancea
95% Confidence
Interval for Differencea
Lower
Bound
Upper
Bound
Passenger Car PCMS OFF PCMS ON -1.588* 0.633 0.037 -3.107 -0.069
PCMS OFF TTS -2.825* 0.765 0.001 -4.66 -0.989
Based on estimated marginal means
*. The mean difference is significant at the .05 level
a. Adjustment for multiple comparisons: Bonferroni.

65
6.4 Speeds Analysis
Analyses of the distributions of speeds with PCMS on, PCMS off, and PCMS absent
were another approach to demonstrate the effectiveness of PCMS. The basic assumption is that,
if the PCMS was effective, it would reduce the number of speeding drivers, commonly
characterized as inattentive or reckless, approaching the work zones. If the distribution of the
speeds recorded when the PCMS was on illustrates a pronounced reduction in the number of
notably high speeds, then researchers concluded that the PCMS was able to more effectively
reduce the speeding behavior of drivers when approaching the work zones. Figures 6.7, 6.8, and
6.9 show the distribution speeds by 5 mph speed intervals when the PCMS was on, off, and
absent from the highway.
0102030405060708090
100
<29 29-34
35-39
40-44
45-49
50-54
55-59
60-64
65-69
70-74
75-79
80-85
Speed
No.
of V
ehic
l
Speed at Sensor1 Speed at Sensor2
Figure 6.7: Distribution speeds by 5 mph speed intervals with PCMS was on

66
0
20
40
60
80
100
120
35-39 40-44 45-49 50-54 55-59 60-64 65-69 70-74 75-79 80-85Speed
No.
of V
ehic
l
Speed at Sensor1 Speed at Sensor2
Figure 6.8: Distribution speeds by 5 mph speed intervals with PCMS turn off.
0
5
10
15
20
25
30
35
40
45
50
29-34 35-39 40-44 45-49 50-54 55-59 60-64 65-69 70-74 75-79 80-85
Speed
No.
of V
ehic
Speed at Sensor1 Speed at Sensor2
Figure 6.9: Distribution speeds by 5 mph speed intervals without PCMS.
When the PCMS was on, the speeding car percentage of Sensor 1 was 25.4%. After the vehicle
had passed the PCMS, the speeding car percentage was 14.2% when collected by Sensor 2,

67
showing an 11.2% speeding reduction. When the PCMS was off, the speeding car percentage of
Sensor 1 was 35.2%. After the vehicle had passed the PCMS, the speeding car percentage of
Sensor 2 was 23.7%, showing an 11.5% speeding reduction. When the PCMS was absent from
the road, the speeding car percentage of Sensor 1 was 18.6%. After the vehicle had passed the
PCMS, the percentage of Sensor 2 increased to19.7%, showing a1.1% rise in speeding
percentage. Table 6.15 shows the speeding car percentage.
Table 6.15: Percentage of Speeding Cars
Speeding car percentage at
Sensor 1
Speeding car percentage at
Sensor 2
Change of Speeding car
Percentage
PCMS On 25.4% 14.2% 11.2% ↓
PCMS Off 35.2% 23.7% 11.5% ↓
No PCMS 18.6% 19.7% 1.1% ↑
Table 6.15 demonstrates that the speeding car percentage decreased significantly, by more than
10%, for both conditions of PCMS on and off. Researchers noticed that although the distance
from Sensor 2 to the advanced warning area of the work zone was 550 feet, there was a 1.1%
increase in speeding car percentage when the PCMS was absent from the road. Such high speeds
observed at the speed collection locations are difficult to slow in order to comply with the
reduced speed limit of a work zone, causing the risk of an accident to soar significantly. Based
on the analysis above, researchers made the following conclusions:

68
1) The PCMS worked effectively to reduce the excessive speeding of vehicles. The
changing messages of the PCMS attracted a certain proportion of the drivers’
attentions and demonstrated positive results in improving work zone safety.
2) The location of the PCMS affected the drivers’ behaviors. The geographic
conditions of the rural highways affected the placement of the PCMS. The
distance between the PCMS and the TTS (W20-1) remained constant during the
course of the experiments. When the slope of the highway ditch was too steep,
half of the PCMS had to be positioned on the roadside. The size of the PCMS
also affected the change in vehicle speeds.
6.4.1 Changes in 85th-Percentile Speeds
The 85th-percentile speeds indicate the largest speed reductions. However, under a
normal distribution, the 85th-percentile speeds are more than one standard deviation from the
mean speed. A parametric hypothesis test could not be conducted since the 85th-percentile
speeds are not a parameter that defines the normal distribution. Nonparametric tests can be
performed when a value other than the mean is of interest. However, additional assumptions
must be made about the distribution, which decreases the accuracy of the test and makes the
statistical theory generally not accepted. Table 6.16 shows the measure of effectiveness of the
85th percentile.

69
Table 6.16: Measure of 85th Percentile
Measure of Effectiveness Speed change
PCMS on
Speed change
PCMS off
Speed change
No PCMS
85th-percentile speed 4 mph ↓ 2 mph ↓ 0 mph
% of vehicles exceeding speed limit by 5 mph 6.4% ↓ 8.7% ↓ 3.3% ↑
% of vehicles exceeding speed limit by 10 mph 3.1% ↓ 5.1% ↓ 1.1% ↑
Figure 6.10: Percentage speed change when PCMS on

70
Figure 6.11: Percentage speed change when PCMS off
Figure 6.12: Percentage speed change without PCMS
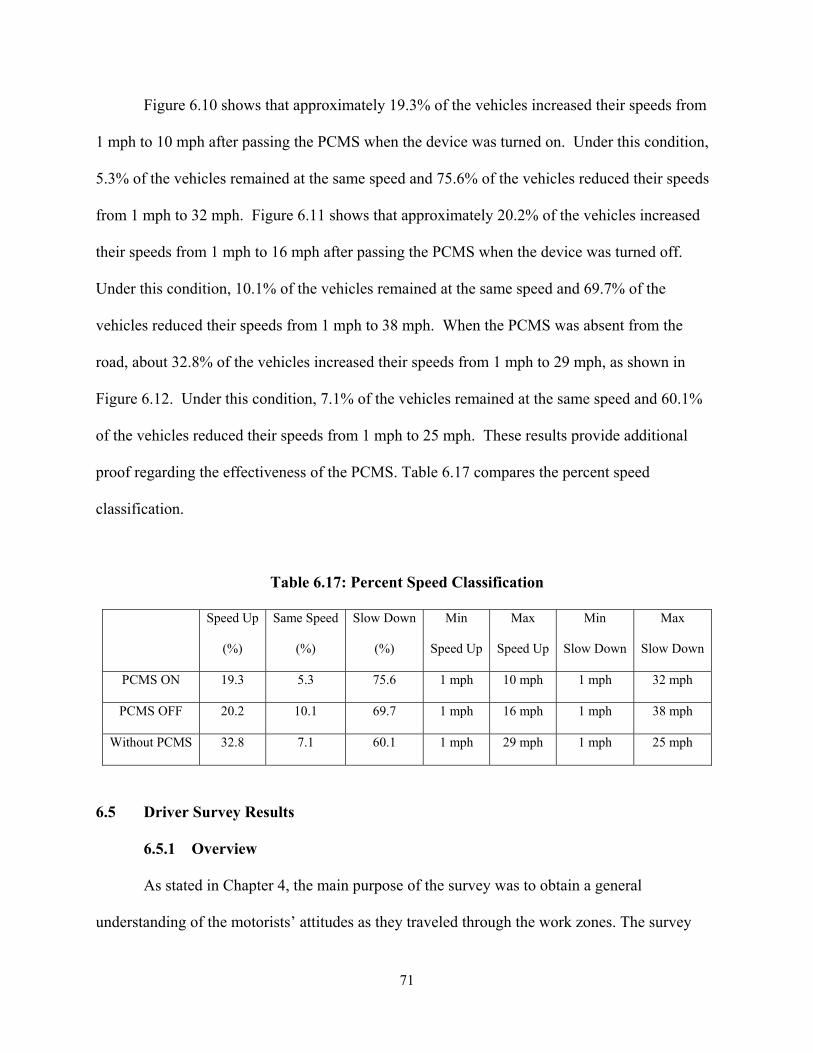
71
Figure 6.10 shows that approximately 19.3% of the vehicles increased their speeds from
1 mph to 10 mph after passing the PCMS when the device was turned on. Under this condition,
5.3% of the vehicles remained at the same speed and 75.6% of the vehicles reduced their speeds
from 1 mph to 32 mph. Figure 6.11 shows that approximately 20.2% of the vehicles increased
their speeds from 1 mph to 16 mph after passing the PCMS when the device was turned off.
Under this condition, 10.1% of the vehicles remained at the same speed and 69.7% of the
vehicles reduced their speeds from 1 mph to 38 mph. When the PCMS was absent from the
road, about 32.8% of the vehicles increased their speeds from 1 mph to 29 mph, as shown in
Figure 6.12. Under this condition, 7.1% of the vehicles remained at the same speed and 60.1%
of the vehicles reduced their speeds from 1 mph to 25 mph. These results provide additional
proof regarding the effectiveness of the PCMS. Table 6.17 compares the percent speed
classification.
Table 6.17: Percent Speed Classification
Speed Up
(%)
Same Speed
(%)
Slow Down
(%)
Min
Speed Up
Max
Speed Up
Min
Slow Down
Max
Slow Down
PCMS ON 19.3 5.3 75.6 1 mph 10 mph 1 mph 32 mph
PCMS OFF 20.2 10.1 69.7 1 mph 16 mph 1 mph 38 mph
Without PCMS 32.8 7.1 60.1 1 mph 29 mph 1 mph 25 mph
6.5 Driver Survey Results
6.5.1 Overview
As stated in Chapter 4, the main purpose of the survey was to obtain a general
understanding of the motorists’ attitudes as they traveled through the work zones. The survey

72
also sought to investigate motorists’ perceptions of posted and non-posted signs in the work
zones, which may lend support to the findings from the PCMS studies. Findings from this
survey may give future researchers suggestions to design better signage, thus further improving
work zone safety for motorists and workers in work zones.
In this section, an overview of the question will be presented, followed by a detailed
description of the results. All results will be discussed in general unless specifically noted. Note
that due to unequal sample sizes between vehicles types, results of the survey will be discussed
based on motorists only.
For US-36, a total of 89 surveys were completed. Among the surveyed motorists, 54 were
male and 35 were female. For US-73, 53 surveys were completed; 34 were male and 19 were
female.
6.5.2 Survey Feedback
Attitudes
Question 1: Have you exceeded a work zone speed limit?
Response to the first question was poor for both work zones. Only 27% (24 out of 89) of
those surveyed at US-36, and 15% (8 out of 53) of those surveyed at US-73 responded that they
had exceeded the work zone speed limit. Poor response to this question could be due to the
following reasons:
1. Motorists were unwilling to admit they had exceeded the work zone speed limit.
As part of the introduction, the researcher administering the survey would inform
motorists that the survey was part of a KDOT study on work zone safety

73
awareness. This reference to the transportation agency may have caused
motorists to be wary of admitting to exceeding the work zone speed limit.
2. Motorists being unaware of their vehicle speed while driving through the work
zone. This is inferred from the common response, “not to my knowledge,”
provided by motorists when asked the above question.
YES27%
NO73%
Figure 6.13: “Have you exceeded a work speed limit?” (US-36)
Yes15%
No85%
Figure 6.14: “Have you exceeded a work speed limit?” (US-73)

74
Question 2: What is the most common reason you might speed in a work zone?
As noted earlier, only 27% (24 out of 89) of those surveyed at US-36, and 15% (8 out of
53) of those surveyed at US-73 responded that they had exceeded a work zone speed limit. Thus,
the analysis will only discuss motorists who admitted to speeding in a work zone. This question
is answered in tandem with Question 3.
Question 3: What is the second most common reason you might speed in a work zone?
Motorists were first told to pick the most common reason for speeding from the following
choices: 1) Driving with flow of traffic; 2) Work zone seemed inactive; 3) Did not see work
zone; 4) In a hurry; and 5) Speed limit seemed inappropriate. After selecting their first choice,
motorists were then asked to choose their second best reason. A graphical representation of the
data is provided in Figure 6.13 and 6.14.
The top reason for exceeding a work zone speed limit was “Driving with flow of traffic.”
As shown by Table 6.18 and 6.19, 62.5% (15 out of 24) of motorists on US-36 selected this
reason, and 75% (6 out 8) of motorists on US-73 chose this reason. This phenomenon is not
unexpected. Psychological studies have shown that when placed in a group, individuals within
the group tend to follow group norms even when the individual is clearly aware that it is not the
case (Asch, 1956). In the case of speeding in a work zone, drivers may feel the impulse to
increase their speeds in order to match those of vehicles already speeding in the work zone,
hence allowing them to follow the flow of traffic.

75
Table 6.18: Responses Frequency and Percentage on US-36
US-36 Top Reason Second Best
Response Frequency Percentage (%) Frequency Percentage (%)
Driving with flow of
traffic (Reason 1) 15 62.5 5 20.8
Work zone seemed
inactive (Reason 2) 3 12.5 9 37.4
Did not see work zone
(Reason3) 2 8.3 6 25
In a Hurry (Reason 4) 3 12.5 0 0
Speed limit seemed
inappropriate (Reason 5) 1 4.2 4 16.8

76
Table 6.19: Responses Frequency and Percentage on US-73
US-73 Top Reason Second Best
Response Frequency Percentage (%) Frequency Percentage (%)
Driving with flow of
traffic (Reason 1) 6 75 2 25
Work zone seemed
inactive (Reason 2) 0 0 1 12.5
Did not see work zone
(Reason3) 1 12.5 2 25
In a Hurry (Reason 4) 1 12.5 2 25
Speed limit seemed
inappropriate (Reason 5) 0 0 1 12.5
The second best reason for exceeding the speed limit of the work zone on US-36 was
“Work zone seemed inactive.” A three-way tie occurred at US-73 between “Driving with flow
of traffic,” “Did not see work zone,” and “In a Hurry” for the second best reason for speeding, as
shown in Table 6.19. Because the results for US-73 are too thinly spread due to a small sample
size, the following information will focus solely on the results of US-36 in order to make any
significant inferences and discussion.
37.4% (9 out of 24) motorists on US-36 selected “Work zone seemed inactive” as their
second best reason for speeding in the work zone. The motorists believed that the absence of
worker activity in the work zone was a sufficient reason to exceed the speed limit. A graphical
representation of the data is presented in Figure 6.15 and Figure 6.16 for US-36 and US-73,
respectively.

77
0
2
4
6
8
10
12
14
16
Reason 1 Reason 2 Reason 3 Reason 4 Reason 5
Top Choice Second Choice
Figure 6.15: “What is the top reason you are likely to speed in a work zone?” (US-36)
0
1
2
3
4
5
6
7
Reason 1 Reason 2 Reason 3 Reason 4 Reason 5
Top Choice Second Choice
Figure 6.16: “What is the top reason you are likely to speed in a work zone?” (US-73)

78
Question 4: Have you ever carefully obeyed the speed limit in a work zone?
All motorists answered “yes” to the above question. This result is once again not
unexpected, as it is highly unlikely that there are motorists who have never carefully obeyed a
work zone speed limit throughout their driving experience.
Question 5: What is the most common reason you are likely to obey the speed limit in a
work zone? This question was asked in tandem with Question 6.
Question 6: What is the second most common reason you are likely to obey the speed
limit in a work zone?
Motorists were asked to explain why they obeyed a work zone speed limit by choosing a
response from the following choices: 1) Driving with flow of traffic; 2) Observed worker
activity; 3) Motivated by warning signs; 4) Presence of police; and 5) Speed limit seemed
appropriate. A graphical representation of the data is given in Figure 6.17 and Figure 6.18.
0
5
10
15
20
25
30
35
40
Reason 1 Reason 2 Reason 3 Reason 4 Reason 5
Top Choice Second Choice
Figure 6.17: “What is the most common reason you are likely to obey the speed limit in a
work zone?” (US-36)
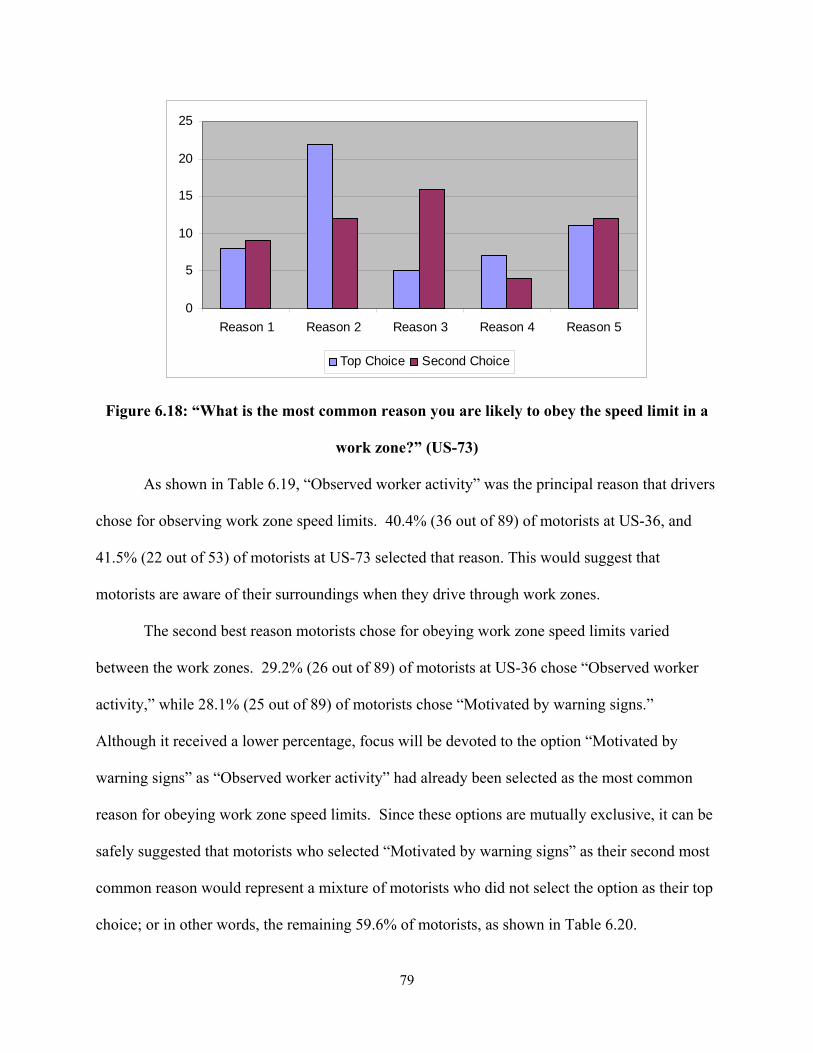
79
0
5
10
15
20
25
Reason 1 Reason 2 Reason 3 Reason 4 Reason 5
Top Choice Second Choice
Figure 6.18: “What is the most common reason you are likely to obey the speed limit in a
work zone?” (US-73)
As shown in Table 6.19, “Observed worker activity” was the principal reason that drivers
chose for observing work zone speed limits. 40.4% (36 out of 89) of motorists at US-36, and
41.5% (22 out of 53) of motorists at US-73 selected that reason. This would suggest that
motorists are aware of their surroundings when they drive through work zones.
The second best reason motorists chose for obeying work zone speed limits varied
between the work zones. 29.2% (26 out of 89) of motorists at US-36 chose “Observed worker
activity,” while 28.1% (25 out of 89) of motorists chose “Motivated by warning signs.”
Although it received a lower percentage, focus will be devoted to the option “Motivated by
warning signs” as “Observed worker activity” had already been selected as the most common
reason for obeying work zone speed limits. Since these options are mutually exclusive, it can be
safely suggested that motorists who selected “Motivated by warning signs” as their second most
common reason would represent a mixture of motorists who did not select the option as their top
choice; or in other words, the remaining 59.6% of motorists, as shown in Table 6.20.

80
Results were similar at US-73, with 30.2% (16 out of 53) of motorists selecting
“Motivated by warning signs” as their second best option. There were no other competing
choices for the second best option for US-73, as shown in Table 6.21.
These findings suggest that the presence of warning signs is an important mitigating
factor for obeying work zone speed limits, in addition to looking out for work zone employees.
This would also further suggest the importance of effective signage in work zones to encourage
safe driving.
Table 6.20: Response for Question 6 on US-36
US-36 Top Reason Second Best
Response Frequency Percentage (%) Frequency Percentage (%)
Driving with flow of
traffic (Reason 1) 9 10.1 19 21.3
Observed worker
activity (Reason 2) 36 40.4 26 29.2
Motivated by warning
signs (Reason3) 18 20.2 25 28.1
Presence of police
(Reason 4) 7 7.9 4 4.5
Speed limit seemed
appropriate (Reason 5) 19 21.3 15 16.9

81
Table 6.21: Response for Question 6 on US-73
US-73 Top Reason Second Best
Response Frequency Percentage (%) Frequency Percentage (%)
Driving with flow of
traffic (Reason 1) 8 15.1 9 16.9
Observed worker
activity (Reson 2) 22 41.5 12 22.6
Motivated by warning
signs (Reason3) 5 9.4 16 30.2
Presence of police
(Reason 4) 7 13.2 4 7.5
Speed limit seemed
appropriate (Reason 5) 11 20.8 12 22.6
Question 7: Rank the following signs as FIRST and SECOND most effective for
encouraging safe work zone driving?
This question was designed to investigate the perceived effectiveness of signage on
motorists as they drove through the work zones. Examples of the signs used in the survey were
provided in Chapter 4. It is worthy to note that participants may have misinterpreted the
question, as the surveyor noted that many motorists stated they had “seen the sign before.” Thus,
motorists may have been encouraged to select those signs they were most familiar with. Let it be
clear that the premise of the question was to verify the effectiveness of the signs and not to
establish whether the motorists had seen them; therefore, the results may not answer the question

82
completely. Nonetheless, results for Question 7 suggest that motorists were aware of the signs
posted in the work zones.
In both work zones, motorists selected Sign 1 as the most effective. 59.6% (53 out of 89)
of drivers on US-36, and 62.3% (33 out of 53) of drivers on US-73 selected the first sign. A
detailed breakdown of the motorists’ choices is provided in Tables 6.22 and 6.23. A graphical
representation is also given in Figures 6.19 and 6.20 for US-36 and US-73, respectively.
Results appear to differ slightly between the work zones for the second best sign. 45.3%
(24 out of 53) of motorists at US-73 clearly favored Sign 2, while motorists at US-36 were
evenly divided between Sign 2 and Sign 3. 29.2% (26 out of 53) of US-36 drivers chose Sign 2
and 30.3% (27 out of 53) chose Sign 3.
Table 6.22: Response for Question 7 on US-36
US-36 Top Reason Second Best
Response Frequency Percentage (%) Frequency Percentage (%)
Sign 1 53 59.6 23 25.8
Sign 2 20 22.4 26 29.2
Sign 3 13 14.6 27 30.3
Sign 4 3 3.4 13 14.6

83
Table 6.23: Response for Question 7 on US-73
US-73 Top Reason Second Best
Response Frequency Percentage (%) Frequency Percentage (%)
Sign 1 33 62.3 10 18.8
Sign 2 8 15.1 24 45.3
Sign 3 11 20.7 12 22.6
Sign 4 1 1.9 7 13.2
0
10
20
30
40
50
60
Sign 1 Sign 2 Sign 3 Sign 4
Figure 6.19: Rank the following signs as FIRST and SECOND most effective for
encouraging safe work zone driving?(US-36)

84
0
5
10
15
20
25
30
35
Sign 1 Sign 2 Sign 3 Sign 4
Figure 6.20: Rank the following signs as FIRST and SECOND most effective for
encouraging safe work zone driving?(US-73)
Question 8: Which of these signs did you see on the way into the work zone?
This question was designed to investigate the awareness of motorists as they entered the
work zone. Question 8 also aimed to see if drivers truly paid attention to the signs in the work
zones or if they simply recalled signs from their past work zone experiences.
As stated in Chapter 5, US-36 displayed all the necessary signage. The results suggest
that 80.9% (72 responses) of motorists were aware of the ‘Be prepared to stop’ (orange) sign on
the right side of the road. Table 6.24 and Table 6.25 provide a breakdown of responses from the
motorists. Figures 6.21 and 6.22 provide a graphical representation of the data for each work
zone.

85
Table 6.24: Response for Question 8 on US-36
Response FrequencyPercentage
(%)
No Passing Zone (Orange) 21 23.6
No Passing Zone (Yellow) 10 11.2
Be Prepared to Stop (Orange) 72 80.9
Be Prepared to Stop (Yellow) 11 12.4
Table 6.25: Response for Question 8 on US-73
Response Frequency Percentage
(%)
No Passing Zone (Orange) 8 15.1
No Passing Zone (Yellow) 8 15.1
Be Prepared to Stop (Orange) 47 88.7
Be Prepared to Stop (Yellow) 4 7.5

86
0
10
20
30
40
50
60
70
80
No Passing Zone(Orange)
No Passing Zone(Yellow)
Be Prepared toStop (Orange)
Be Prepared toStop (Yellow)
Figure 6.21: Question 8: Which of these signs did you see on the way into the work zone?
(US-36)
05
101520253035404550
No PassingZone (Orange)
No PassingZone (Yellow)
Be Prepared toStop (Orange)
Be Prepared toStop (Yellow)
Series1
Figure 6.22: Question 8: Which of these signs did you see on the way into the work zone?
(HW 73)

87
It is interesting to note that even though the ‘No passing zone’ (orange) sign was present
on the roadway, only 23.6% (21 responses) of motorists reported seeing the sign. This lack of
awareness may have implications for events occurring on the left side of the road, such as the
possibility of hitting a worker.
Results for the ‘Be prepared to stop’ (orange) sign on the right side of the work zone on
US-73 were similar to US-36. 88.7% (47 responses) of motorists stated they had seen the sign as
they approached the work zone. US-36 did not display the ‘No passing zone’ (orange) sign on
the left side of the road, yet 15.1% (8 responses) of motorists reported seeing it. Although a
small number, this may suggest that motorists may have been recalling signs they were
previously familiar with when filling out the survey, rather than actually observing the signs
present in the work zone. The same phenomena possibly occurred with the motorists’
perceptions of another work zone sign. 12.4 % (11 responses) of motorists on US-36 and 7.5%
(4 responses) of motorists on US-73 reported they had seen the ‘Be prepared to stop’ (yellow)
sign. However, this sign did not appear in either of the work zones, as orange is the standard
color for work zone signs rather than yellow.
A point to note is that motorists selected responses for ‘No passing zone’ (yellow), which
was likely due to the locations of the work zones. The work zones were located on undulating
terrain; thus, the ‘No passing zone’ (yellow) signs were always present. It is also worthy to note
that the response percentages do not equal 100% as motorists were allowed to select multiple
responses.

88
Miscellaneous
Question 1: About how many work zone- related accidents occurred in 2006 in the State
of Kansas?
This question investigated the baseline of knowledge of motorists regarding work zone-
related accidents. Results suggest that motorists underestimated the number of accidents in work
zones. Note that the accident data used here counts for all types of work zone accidents,
including personal and property damage.
Motorists at both work zones appear to underestimate the number of accidents that had
occurred in Kansas work zones in 2006. 41.6% (37 out of 89) of motorists at US-36 believed
approximately 500 work zone-related accidents occurred in the State of Kansas in 2006.
Motorists on US-73 also underestimated the number, with 45.3% (24 out of 53) of motorists
choosing the same answer. Based on data from KDOT, the correct number of accidents is
approximately 2000, as shown in Tables 6.26 and 6.27, and Figures 6.23 and 6.24. Only 21.3%
(19 out of 89) of motorists on US-36 and 33.9% (18 out of 53) of motorists on US-73 selected
the correct answer.
Table 6.26: Response from Question 1 (misc) on US-36
Response Frequency Percentage (%)
About 100 29 32.6
About500 37 41.6
About 2000 19 21.3
About 5000 4 4.5
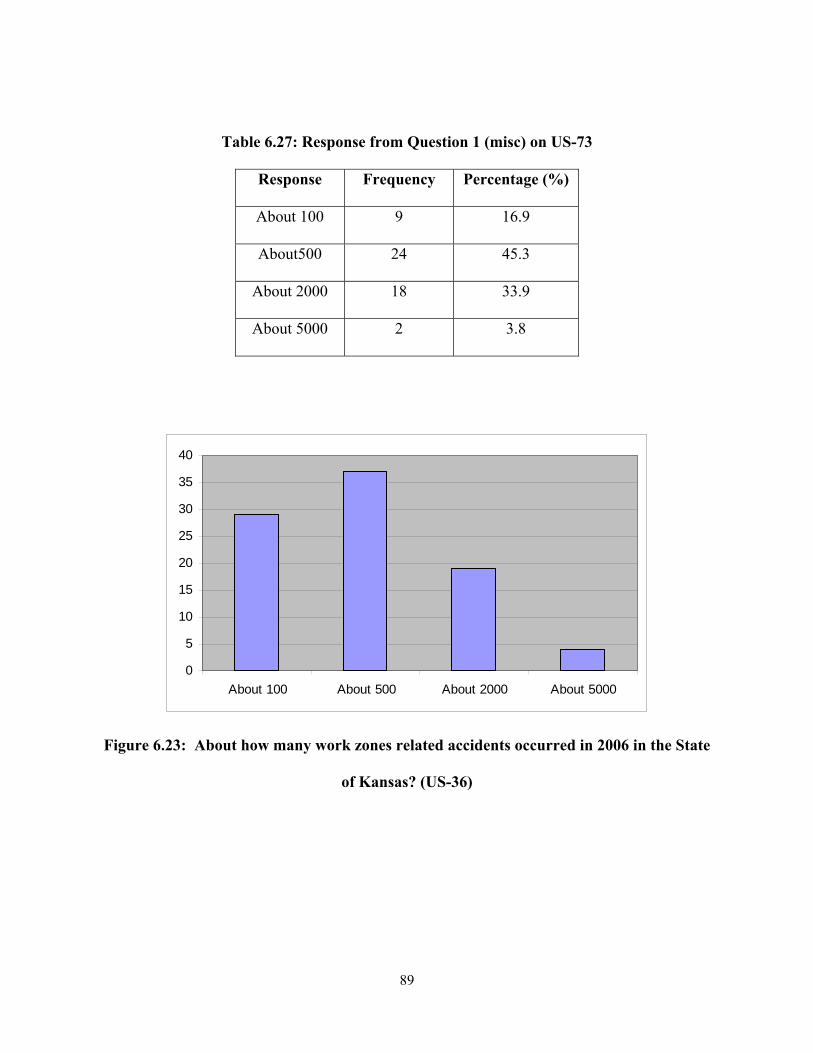
89
Table 6.27: Response from Question 1 (misc) on US-73
Response Frequency Percentage (%)
About 100 9 16.9
About500 24 45.3
About 2000 18 33.9
About 5000 2 3.8
0
5
10
15
20
25
30
35
40
About 100 About 500 About 2000 About 5000
Figure 6.23: About how many work zones related accidents occurred in 2006 in the State
of Kansas? (US-36)

90
0
5
10
15
20
25
30
About 100 About 500 About 2000 About 5000
Figure 6.24: About how many work zones related accidents occurred in 2006 in the State
of Kansas? (US-73)
Question 2: How many work zone-related fatalities occurred in 2006 in the State of
Kansas?
Similar to Question 1, the purpose of this question was to investigate the motorists’
baseline of knowledge regarding fatalities in work zones. Results for this question suggest that
motorists are aware of the number of fatalities that occur in work zones for the State of Kansas.
For this question, motorists at both experimental locations were better at estimating the
correct answers. 59.5% (53 out 89) of motorists from US-36, and 41.5% (22 out of 53) of
motorists from US-73 chose “Approx. 1 Doz.” as their best guess. As shown in Tables 6.28 and
6.29, and Figures 6.25 and 6.26, some motorists did overestimate the number of fatalities;
however, the general trend indicates that the majority of motorists selected the correct choice.

91
Table 6.28: Response for Question 2 (misc) on US-36
Response Frequency Percentage (%)
None 7 7.9
Approx. 1 Dozen 53 59.5
Approx. 2 Dozen 11 12.4
Over 2 Dozen 18 20.2
Table 6.29: Response for Question 2 (misc) on US-76
Response Frequency Percentage (%)
None 1 1.9
Approx. 1 Dozen 22 41.5
Approx. 2 Dozen 14 26.4
Over 2 Dozen 16 30.2

92
0
10
20
30
40
50
60
None Approx. 1 Dozen Approx. 2 Dozen Over 2 Dozen
Figure 6.25: How many work zone related fatalities occurred in 2006 in the State of
Kansas? (US-36)
0
5
10
15
20
25
None Approx. 1 Dozen Approx. 2 Dozen Over 2 Dozen
Figure 6.26: How many work zone related fatalities occurred in 2006 in the State of
Kansas? (US-73)

93
Question 3: Would presenting this information in a work zone encourage you to drive
more cautiously?
This was a simple yes-no question which sought to investigate whether motorists’
attitudes would be affected by statistics if the data were available on work zone warning signage.
83% (74 out of 89) of motorists from US-36 and 89% (47 out of 53) of motorists from US-73
agreed that signage that provides statistics may encourage cautious work zone driving behavior.
Figures 6.27 and 6.28 give a visual break down of the results for Question 3 for both
experimental highways.
Yes83%
No17%
Figure 6.27: ‘Would presenting this information in a work zone encourage you to drive
more cautiously?” (US-36)

94
Yes89%
No11%
Figure 6.28: ‘Would presenting this information in a work zone encourage you to drive
more cautiously?” (US-73)

95
CHAPTER 7 – CONCLUSION AND RECOMMENDATION
7.1 Conclusions
Highway statistics data indicate that 91% of the Kansas public roadway miles are rural,
and approximately 97% of the major rural roadways (interstates, principal and minor arterials,
and major collector) are two-lane highways. Preserving, rehabilitating, expanding, and
enhancing these highways require the construction of a large number of work zones. 63% of the
fatal crashes and a third of the injury crashes of Kansas occurred in two-lane highway work
zones (Bai and Li 2007).
To improve work zone safety, many types of signage have been developed and
employed; however, the effectiveness of some signs has not been quantified. This research
project determined the effectiveness of PCMS and a TSS (“Work Zone Ahead”) in rural highway
work zones under three different conditions: 1) PCMS on; 2) PCMS off, but still visible; and 3)
PCMS removed from the road and out of sight.
Two results of the field experiments are briefly discussed as follows:
1) The data analysis results show that the PCMS was effective in reducing vehicle speeds in
two-lane work zones. The PCMS was significantly effective when turned on compared
to when the device was turned off. The results also indicate that the PCMS, whether on
or off, was significantly effective compared to the PCMS being removed from the
highway. Vehicle speeds were reduced by 4.7 mph over an average distance of 500 feet
when the PCMS was turned on. This was an approximate reduction of 147 % in
comparison to the condition when the PCMS was absent. When the PCMS was off but
still visible, the vehicle speeds reduced 3.3 mph over an average distance of 500 feet, a

96
reduction of about 74 % compared to the condition when the PCMS was removed from
the road. A mere 1.9 mph speed reduction occurred over an average distance of 500 feet
when the PCMS was absent. Based on the data analysis results, researchers concluded
that a visible and active PCMS significantly reduces the speed of vehicles approaching
work zones. A reduction in vehicular speed allows for greater reaction time to avoid
crashes and potentially creates a safer environment for drivers and workers in the work
zones.
2) The second part of the data analysis results show that the PCMS was effective in
reducing truck speeds in one-way, two-lane work zones. When the PCMS was on,
passenger car vehicle speeds were reduced by 3.9 mph, truck speeds by 4.7 mph, and
semitrailer speeds by 3.1 mph over an average distance of 500 feet. When the PCMS was
off, passenger car vehicle speeds were reduced by 2.4 mph, truck speeds by 3.7 mph, and
semitrailer speeds by 3.0 mph over an average distance of 500 feet. When the PCMS was
absent and vehicles approaching the advance warning area of a work zone were warned
solely by a TTS, passenger car speeds declined by 5.2 mph, truck speeds by 2.8 mph, and
semitrailer speeds by 5.0 mph over an average distance of 500 feet. Based on these
results, researchers concluded that a visible and active PCMS in a work zone significantly
reduces the speed of truck vehicles approaching work zones. One TTS, (W20-1), has a
greater effect in reducing vehicle speeds for passenger cars and semitrailer drivers than
an activated and visible PCMS.

97
7.2 Recommendations
The purpose of this study was to reveal the effectiveness of PCMS in highway work
zones. Based on the results, the researchers recommend some potential safety improvements.
For example, the researchers recommend the implementation of an active PCMS in one-lane,
two-way work zones. Statewide, a large percentage of two-lane rural highways are low-volume
roads where there exists an urgent need for a highly effective traffic control method. One-lane,
two-way work zones on these highways typically remain in operation for relatively short
durations and require frequent movement. Therefore, high visibility, high flexibility, and
efficiency become critical qualifications for an effective warning sign in these work zones. The
implementation of the PCMS in these work zones would be ideal because the device is easy to
assemble and remove.
Not only do researchers recommend the implementation of PCMS in one-lane, two-way
work zones, but in all work zones. Researchers believe it is critical to conduct research of the
success of the PCMS before implementing the device in other work zones. A review of the
PCMS Handbook would also be instrumental given that some PCMS messages are more
effective than others, as presented in the literature review. If implemented in other work zones,
the researchers suggest that the PCMS should be located 500 feet away from the first temporary
traffic sign. This distance allows motorists enough time to respond to the PCMS and TTS
warnings regarding the upcoming work zone conditions.
Improvement of traffic control is the most direct method to reduce highway work zone
crashes. Based on the characteristics of highway work zone crashes, the researchers recommend
more effective speed control strategies. The high composition of crashes in high-speed zones
and the dominance of rear-end collisions in injury crashes indicate a strong association between

98
high speeds and work zone injury and fatal crashes. Therefore, controlling speeds is a key step
towards improving work zone safety. The crash analysis results suggest a need of more effective
and more strictly enforced speed control strategies in highway work zones in order to prevent
high-severity crashes causing injuries and fatalities. In particular, more strictly enforced speed
limits should be considered in work zones with complex highway geometric alignments.
However, the question of how to properly determine work zone speed limits remains. A
previous study indicated that a sharp speed reduction (a reduction of more than 10 mph) might
increase the number of crashes in highway work zones. Further research in this area is
necessary.
Certain trends in respect to driver attitudes and sign efficacy emerged in the evaluation of
the survey conducted in the two experimental work zones. These trends led the research team to
suggest the following recommendations to improve work zone safety.
First, one of the biggest findings from the survey was that many drivers failed to notice
the presence of a road sign on the left side of the road. This may be due to a learned behavior, as
drivers are accustomed to only observing traffic flow that travels in their same direction. This
behavior has serious implications, as workers on the left side of the road may be in danger since
drivers may not see them. It is recommended that future research investigates why drivers are
unaware of objects on the left visual field when driving on the right side of the road.
Second, most drivers reported that work zone signs that gave roadway statistics, such as
accidents and fatalities, may help encourage safe work zone driving. This finding is also
corroborated with data that suggest that most drivers underestimate accident rates in work zones.
Thus, it is recommended that future signs contain some degree of information that provides
drivers with empirical evidence of work zone hazards. It must be noted that these signs should
99
not contain too much information which could draw drivers’ attentions away from their primary
task of driving.
Finally, it is recommended that future studies investigate the attitudes of motorists toward
certain signs. Results from the survey suggest that the “Give ‘Em A Brake” sign was most
effective for encouraging safe work zone driving. Yet, among the four signs presented to the
drivers, the “Give ‘Em A Brake” sign is the most common on Kansas roads. This raises the
question as to whether the drivers’ responses were biased or they were truly affected by the sign.
Possible future studies could evaluate signs not common in the State of Kansas or novel signs
recommended in the preceding paragraph.
As noted by the surveys, the presence of workers and warning signs are the two most
important reasons why drivers observe work zone speed limits. Thus, future research should
continue to focus on improving driver awareness as vehicles enter work zones. Researchers
believe there is potential for the PCMS system to aid in improving driver awareness if deployed
in work zones.

100
REFERENCES
AASHTO (2004). AASHTO Green Book: A Policy on Geometric Design of Highways and
Streets, 5th Edition. American Association of State Highway and Transportation Officials,
Washington, D.C.
AASHTO (1987). Summary Report on work Zone Crashes. Standing Committee on Highway
Traffic Safety. American Association of State Highway and Transportation Officials,
Washington, D.C.
Arnold, E. D. (2003). Use of Police in Work Zones on Highways in Virginia. Final Report
VTRC 04-R9, Virginia Transportation Research Council, Charlottesville, Virginia.
Bai, Y. (2002). Improving Highway Work Zone Safety. Proceedings of Texas Section of
American Society of Civil Engineers Fall Meeting, Waco, Texas, October 2-5, 2002, pp 1-10.
Bai, Y. and Cao, Q. (2003). Reducing Fatalities in Highway Construction Work Zones. In
Proceedings of 33rd Annual Meeting of Southeast Decision Sciences Institute, Williamsburg,
Virginia, pp.367-369.
Bai, Y. and Li, Y. (2006). Determining Major Causes of Highway Work Zone Accidents in
Kansas. Final Report for K-TRAN Project KU-05-1, the University of Kansas, Lawrence,
Kansas.

101
Bai, Y. and Li, Y. (2007). Determining Major Causes of Highway Work Zone Accidents in
Kansas-Phase II, Final Report for K-TRAN Project KU-06-1, the University of Kansas,
Lawrence, Kansas.
Bai, Y. and Li, Y. (2008). Reducing Work Zone Crashes by Using Vehicle’s Flashers as a
Warning Sign, Final Report for K-TRAN Project KU-07-3, the University of Kansas,
Lawrence, Kansas.
Benekohal, R. F., and J. Shu. (1992). Speed Reduction Effects of Changeable Message Signs in a
Construction Zone. Report FHWA/IL/UI-239. FHWA, U.S. Department of Transportation.
Benekohal, R. F., Shim, E., and Resende, T. V. (1995). “Truck Drivers’ Concerns in Work
Zones: Travel Characteristics and Accident Experiences”. Transportation Research Record
1509, Transportation Research Board, Washington D. C., pp55 – 64.
Benekohal, R. F., E. Shim, and P. T. V. Resende (1995). Truck Drivers’ Concerns in Work
Zones: Travel Characteristics and Accident Experiences. Transportation Research Record
1509, Transportation Research Board, Washington D.C., pp. 55 – 64.
Benekohal, R. F. and Shim, E. (1999). Multivariate Analysis of Truck Drives’ Assessment of
Work Zone Safety. ASCE Journal of Transportation Engineering, Vol. 125, No. 5.

102
Brewer, M. A., Pesti, G., and Schneider, W. IV (2006). “Improving Compliance with Work Zone
Speed Limits: Effectiveness of Selected Devices.” Transportation Research Record 1948.
Transportation Research Board, Washington, D.C., pp. 67–76.
Bushman, R. and Berthelot, C. (2005). “Response of North Carolina Motorists to a Smart Work
Zone System”. TRB 84th Annual Meeting CD-ROM, January 9 – 13, 2005. Transportation
Research Board, Washington D.C.
Cottrell, B. H. Jr. (1999). Improving Night Work Zone Traffic Control. Research Report.
Virginia Transportation Research Council, Charlottesville, Virginia.
Daniel, J., Dixon, K., and Jared, D. (2000). “Analysis of fatal crashes in Georgia work zones.”
Transportation Research Record. 1715, Transportation Research Board, National Research
Council, Washington, D.C., 18-23.
Dixon, K. K. and Wang, C. (2002). Development of Speed Reduction Strategies for Highway
Work Zones. Research Report. Georgia Transportation Institute, Georgia Institute of
Technology, Atlanta, Georgia.
FARS (2006). Fatal Analysis Report System, National Highway and Traffic Safety
Administration, U.S. Department of Transportation,
<http://www.fars.nhtsa.dot.gov/Main/index.aspx> (July 1st 2008).

103
Federal Highway Administration (FHWA). (2003). Manual on Uniform Traffic Control Devices
(MUTCD) for Streets and Highway, 2003 Ed., U.S. Department of Transportation,
Washington, D.C.
Fontaine, M. D., and Carlson, P.J., 2001. Evaluation of speed displays and rumble strip at rural
maintenance work zones. Proceedings of the 80th Annual Meeting of the Transportation
Research Board, Washington, D.C.
Garber, N. J., and Woo, T. H. (1990). Accident Characteristics at Construction and Maintenance
Zones in Urban Areas. Report No. VTRC 90-R12. Virginia Transportation Research Council.
Garber, N. J. and Patel, S. T. (1994). Effectiveness of Changeable Message Signs in Controlling
Vehicles Speeds in Work Zones Report No. VTRC 95-R4. Virginia Transportation Research
Council, Charlottesville, Virginia.
Garber, N. J., and Srinivasan, S. (1998). “Influence of exposure duration on the effectiveness of
changeable-message signs in controlling vehicle speeds at work zones.” Transportation
Research Record. 1650, Transportation Research Board, National Research Council,
Washington, D.C., 62-70.
Garber, N. J. and Zhao, M. (2002). “Crash Characteristics at Work Zones”. Research Report
VTRC 02-R12, Virginia Transportation Research Council, Charlottesville, Virginia.

104
Ha, T., and Nemeth, Z. A. (1995). “Detailed study of accident experience in construction and
maintenance zones.” Transportation Research Record. 1509, Transportation Research Board,
National Research Council, Washington, D.C., 38-45.
Hall, J. W., and Lorenz, V.M. (1989). “Characteristics of construction zone accidents.”
Transportation Research Record. 1230, Transportation Research Board, National Research
Council, Washington, D.C., 20-27.
Hargroves, B. T. (1981). “Vehicle Crashes in Highway Work Zones”. Journal of Transportation
Engineering 107 (TE5), ASCE, pp 525 – 539
Helmuth, J. L. (2002). Visual Complexity in Highway Work Zones: An Exploratory Study. MS
thesis. Department of Civil Engineering, Texas A&M University, College Station.
Hill, R. W. (2003). Statistical Analysis of Fatal Traffic Accident Data. Master’s Thesis, Texas
Tech University.
Horowitz, A. J. and Notbohm, T. (2005). Testing Temporary Work Zone Rumble Strips.
Research Report. University of Wisconsin at Milwaukee, Milwaukee, Wisconsin.
Huebschman, C. R., Garcia, C., Bullock, D. M., and Abraham, D. M. (2003). Construction Work
Zone Safety. Report No. FHWA/IN/JTRP-2002/34, Joint Transportation Research Program,
Purdue University, West Lafayette, Indiana.

105
Jackels, J. and D. Brannan. (1988). Work Zone Speed Limit Demonstration in District 1A.
Minnesota Department of Transportation.
KDOT (2007). Work Zone Accident Summary. 2006 Kansas Traffic Accident Facts. Kansas
Department of Transportation (KDOT). http://www.ksdot.org/burTransPlan/
prodinfo/accista.asp.
Li, Y. and Bai, Y., Investigating the Impacts of Human Factors on Severe Crashes in Highway
Work Zones, Proceedings of Mid-Continent Transportation Symposium, Iowa State
University, August 16-17, 2007.
Li, Y. and Bai, Y. (2008a). Comparison of Characteristics between Fatal and Injury Accidents in
the Highway Construction Zones. Journal of Safety Science, Elsevier, Vol. 46, No. 4, pp 646-
660.
Li, Y. and Bai, Y. (2008b). Development of Crash-Severity-Index Models for the Measurement
of Work Zone Risk Levels, Accident Analysis and Prevention, Elsevier, Vol. 40, No. 5,
pp1724-1731.
Meyer, E. (2004). Evaluation of Data from Test Application of Optical Speed Bars to Highway
Work Zones. Final Report for K-TRAN Project KU-00-4, the University of Kansas, Kansas.

106
Meyer, E. (2006). Evaluation of Portable Rumble Strips – ATM. Research Report. Meyer ITS,
Lawrence, Kansas.
Migletz, J., Graham, J. L., Anderson, I. B., Harwood, D. W., and Bauer, K. M. (1999). “Work
zone speed limit procedure.”Transportation Research Record. 1657, Transportation Research
Board, National Research Council, Washington, D.C., 24-30.
Miller, L. (2007). Effectiveness of speed control measures on nighttime construction and
maintenance projects, MSCE thesis, Purdue University, West Lafayette, IN.
Miller, L., Abraham, D., and Mannering, F. (2008). “Effectiveness of speed control measures on
nighttime construction and maintenance projects: Some new evidence.” Proceedings of the
87th Annual Transportation Research Board Meeting, Washington, D.C.
Mitchell, G., Schattler, K. L., and Datta, T. K. (2005). “Use of a Driving Simulator for
Evaluation of Safety Measures in Highway Work Zones”. TRB 84th
Annual Meeting CD-
ROM, January 9 – 13, 2005. Transportation Research Board, Washington D.C.
Mohan, S. B. and Gautam, P. (2002). “Cost of Highway Work Zone Injuries”. Practical
periodical on Structural Design and Construction 7(2), ASCE, pp 68 – 73.

107
Nemeth Z. A., and D. J. Migletz. (1978). Accident Characteristics Before, During and After
Safety Upgrading projects on Ohio’s Rural Interstate System. Transportation Research
Record 672, Transportation Research Board, Washington, D.C., pp. 19 – 23.
Pain, R. F., McGee, H. W., and Knapp, B. G. (1983). “Evaluation of Traffic Controls for
Highway Work Zones”. National Cooperative Highway Research Program Report 236,
Transportation Research Board, Washington D. C.
Pigman, J. G. and Agent, K. R. (1990). “Highway Crashes in Construction and Maintenance
Work Zones”. Transportation Research Record 1270, Transportation Research Borad,
Washington D.C., pp12 – 21.
Portable Changeable Message Sign Handbook. (2008). Federal Highway Administration,
(http://www.tfhrc.gov/pavement/ltpp/reports/03066/index.htm).
Richards. S. H. and Dudek, C. L. (1986). Implementation of Work-Zone Speed Control
Measures. Transportation Research Record 1086, Transportation Research Board,
Washington D.C., pp36 – 42.
Schrock, D. S., Ullman, G. L., Cothron, A. S., Kraus, E., and Voigt, A. P. (2004). “An Analysis
of Fatal Work Zone Crashes in Texas”. Report FHWA/TX-05/0-4028-1, FHWA, U.S.
Department of Transportation.

108
TxDOT. (2007). “RTI Project Summary: Long-Term Research into Vehicle Detector
Technologies.” Texas Department of Transportation (TxDOT), ftp://ftp.dot.state.tx.us
/pub/txdot-info/rti/psr/4750.pdf, Oct. 25.
Ullman, G. L. (1991). Effect of Radar Transmissions on Traffic Operations at Highway Work
Zones. Transportation Research Record. 1304, Transportation Research Board, National
Research Council, Washington, D.C., 261-269.
Wang, J., Hughes, W. E., Council, F. M., and Paniati, J. F. (1996). “Investigation of highway
work zone crashes: What we know and what we don’t know.” Transportation Research
Record. Transportation Research Board, National Research Council, Washington, D.C., 54-
62.
Zech, W.C. and Mohan, S.B. (2008).“Evaluation of Messages on Changeable Message Signs as a
Speed Control Measure in Highway Work Zones”. Practical periodical on Structural Design
and Construction 13(1), ASCE, pp11-18.

109
APPENDIX
Appendix I: Sample Survey Form

110
EXCUSE ME, THE KANSAS DEPARTMENT OF TRANSPORTATION IS TRYING TO
IMPROVE WORKZONE SAFETY.
WOULD YOU MIND IF I ASK YOU A FEW QUESTSIONS ABOUT WORK ZONES?
ALL OF THE INFORMATION WILL BE ANONYMOUS.

111
DEMOGRAPHICS
1. Note gender
2. Which age-group do you fall under? (SKIP IF YOU CAN TELL)
a. Under 30
b. 30 to 60
c. over 60
3. How many hours have you been driving today?
a. Less than an hour
b. Over three hours
c. Between one and three hours
ATTITUDES
1. Have you ever exceeded a work zone speed limit?
IF YES ASK:
2. What is the most common reason you might speed in a work zone?
a. Driving with flow of traffic
b. Work zone seemed inactive
c. Did not see work zone
d. In a hurry
e. Speed limit seemed inappropriate

112
3. What is the SECOND most common reason you might speed in a work zone?
USE SAME ALTERNATIVES MINUS FIRST CHOICE
4. Have you ever carefully obeyed the speed limit in a work zone?
IF YES ASK
5. What is the most common reason you are likely to obey the speed limit in a work zone?
a. Driving with flow of traffic
b. Observed worker activity
c. Motivated by warning signs
d. Presence of police
e. Speed limit seemed appropriate
6. What is the SECOND most common reason you are likely to obey the speed limit in a work zone?
USE SAME ALTERNATIVES MINUS FIRST CHOICE
7. Rank the following signs as FIRST and SECOND most effective for encouraging safe work zone
driving

113

114
8. Which of these signs did you see on the way into the work zone?
1 2 3 4

115
MISCELLANEOUS
1. About how many work zone related accidents occurred in 2006 in the state of Kansas?
About 100
About 500
About 2000
About 5000
2. How many work zone related fatalities occurred in 2006 in the state of Kansas?
None
Around a dozen
Around two dozen
Over two dozen
3. GIVE ANSWERS
Would presenting this information in a work zone encourage you to drive more cautiously?
THANK YOU FOR YOUR HELP.

116
Appendix II: Vehicle Speed Data

117
Sensor 1
Avg.
LENG
TH
Sensor 2
LANE LENG
TH
(MP
H)
CLA
SS
RAN
GE
YYY
Y-
MM-
DD
HH:MM:S
S.sss LANE
LENG
TH
(MP
H)
CLA
SS
RAN
GE
YYY
Y-
MM-
DD
HH:MM:S
S.sss
Message sign On
LANE_
01 19 31 1 35
6/3/20
08 10:57:02 19
LANE_
01 19 31 1 32
6/3/20
08 10:56:46
LANE_
01 70 33 4 38
6/3/20
08 10:51:38 71
LANE_
01 72 41 4 33
6/3/20
08 10:51:17
LANE_
01 19 36 1 35
6/3/20
08 10:31:52 20
LANE_
01 20 37 2 37
6/3/20
08 10:31:30
LANE_
01 51 41 3 40
6/3/20
08 10:53:51 50
LANE_
01 49 43 3 36
6/3/20
08 10:53:29
LANE_
01 20 43 2 37
6/3/20
08 10:51:15 19
LANE_
01 18 42 1 35
6/3/20
08 10:50:53
LANE_
01 77 44 4 38
6/3/20
08 10:51:51 79
LANE_
01 81 46 4 32
6/3/20
08 10:51:28
LANE_
01 23 45 2 38
6/3/20
08 10:53:32 23
LANE_
01 22 48 2 37
6/3/20
08 10:53:08
LANE_
01 19 46 1 39
6/3/20
08 10:55:24 18
LANE_
01 16 48 1 36
6/3/20
08 10:55:00
LANE_
01 20 47 2 38
6/3/20
08 10:33:31 20
LANE_
01 19 46 1 37
6/3/20
08 10:33:07
LANE_
01 21 47 2 37
6/3/20
08 10:54:38 22
LANE_
01 22 47 2 33
6/3/20
08 10:54:15
LANE_
01 47 48 3 42
6/3/20
08 10:49:57 48
LANE_
01 48 46 3 35
6/3/20
08 10:49:34
LANE_
01 22 50 2 36
6/3/20
08 10:32:21 22
LANE_
01 22 49 2 37
6/3/20
08 10:31:56
LANE_
01 20 56 2 36
6/3/20
08 10:32:13 21
LANE_
01 21 47 2 38
6/3/20
08 10:31:48
LANE_
01 69 56 4 35
6/3/20
08 10:35:47 69
LANE_
01 69 50 4 39
6/3/20
08 10:35:22
LANE_
01 77 56 4 37
6/3/20
08 10:29:15 77
LANE_
01 76 48 4 36
6/3/20
08 10:28:50
LANE_
01 19 59 1 38
6/3/20
08 10:50:18 19
LANE_
01 18 59 1 36
6/3/20
08 10:49:53
LANE_ 23 60 2 42 6/3/20 10:55:54 22 LANE_ 21 55 2 40 6/3/20 10:55:29

118
01 08 01 08
LANE_
01 23 60 2 37
6/3/20
08 10:35:35 23
LANE_
01 23 46 2 37
6/3/20
08 10:35:11
LANE_
01 26 60 2 37
6/3/20
08 10:34:16 27
LANE_
01 27 47 2 38
6/3/20
08 10:33:51
LANE_
01 21 61 2 42
6/3/20
08 10:53:01 20
LANE_
01 19 58 1 34
6/3/20
08 10:52:36
LANE_
01 70 61 4 35
6/3/20
08 10:52:28 70
LANE_
01 70 61 4 32
6/3/20
08 10:52:03
LANE_
01 19 63 1 38
6/3/20
08 10:50:46 18
LANE_
01 17 57 1 34
6/3/20
08 10:50:20
LANE_
01 67 63 4 38
6/3/20
08 10:38:02 68
LANE_
01 69 63 4 39
6/3/20
08 10:37:36
LANE_
01 18 65 1 37
6/3/20
08 10:35:07 18
LANE_
01 18 57 1 37
6/3/20
08 10:34:41
LANE_
01 77 65 4 34
6/3/20
08 10:35:32 74
LANE_
01 70 58 4 36
6/3/20
08 10:35:06
LANE_
01 68 68 4 35
6/3/20
08 10:30:59 57
LANE_
01 45 38 3 35
6/3/20
08 10:30:35
Message sign Off
LANE_
01 16 70 1 39
6/3/20
08 12:09:02 16
LANE_
01 16 67 1 35
6/3/20
08 12:08:35
LANE_
01 18 60 1 38
6/3/20
08 11:01:39 17
LANE_
01 15 57 1 35
6/3/20
08 11:01:14
LANE_
01 16 61 1 36
6/3/20
08 12:20:05 17
LANE_
01 17 63 1 34
6/3/20
08 12:19:39
LANE_
01 17 66 1 38
6/3/20
08 12:25:56 17
LANE_
01 16 64 1 34
6/3/20
08 12:25:30
LANE_
01 17 70 1 39
6/3/20
08 12:09:08 17
LANE_
01 17 65 1 36
6/3/20
08 12:08:41
LANE_
01 17 53 1 37
6/3/20
08 12:14:52 17
LANE_
01 17 54 1 34
6/3/20
08 12:14:27
LANE_
01 19 65 1 35
6/3/20
08 11:10:58 18
LANE_
01 16 57 1 32
6/3/20
08 11:10:33
LANE_
01 18 63 1 39
6/3/20
08 11:12:31 18
LANE_
01 17 64 1 37
6/3/20
08 11:12:05
LANE_
01 18 63 1 38
6/3/20
08 12:10:52 18
LANE_
01 17 50 1 36
6/3/20
08 12:10:26
LANE_ 17 63 1 37 6/3/20 12:10:58 18 LANE_ 18 65 1 36 6/3/20 12:10:32
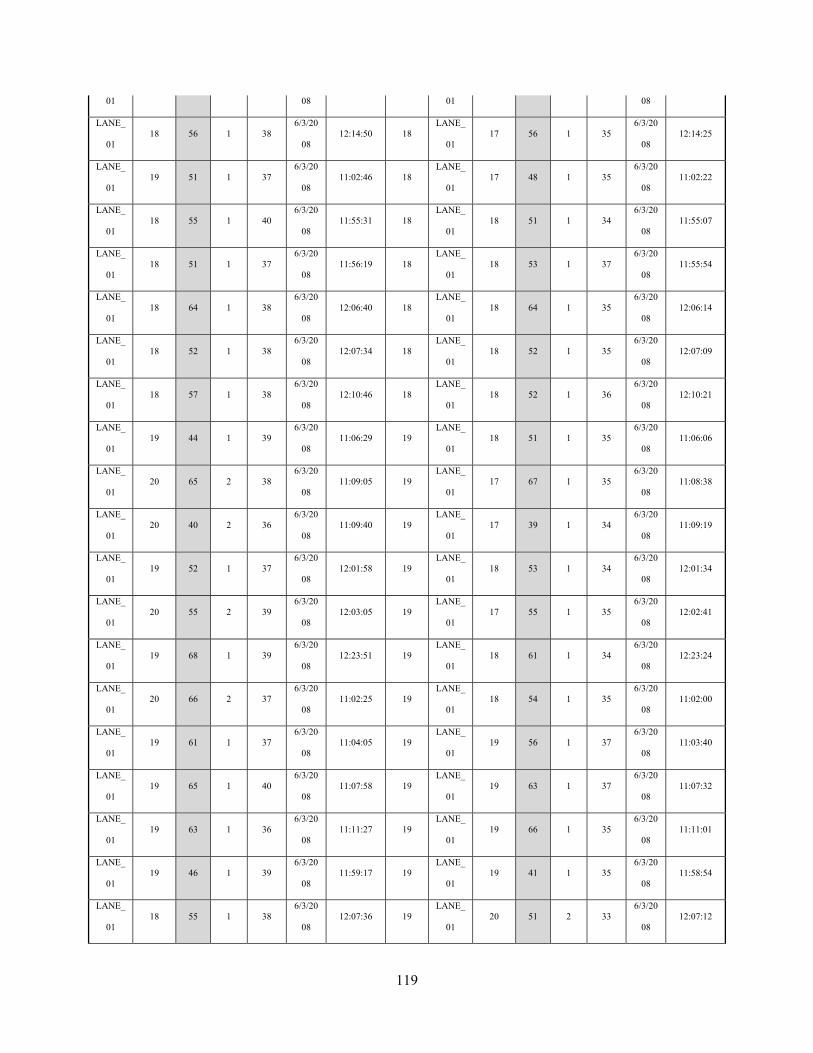
119
01 08 01 08
LANE_
01 18 56 1 38
6/3/20
08 12:14:50 18
LANE_
01 17 56 1 35
6/3/20
08 12:14:25
LANE_
01 19 51 1 37
6/3/20
08 11:02:46 18
LANE_
01 17 48 1 35
6/3/20
08 11:02:22
LANE_
01 18 55 1 40
6/3/20
08 11:55:31 18
LANE_
01 18 51 1 34
6/3/20
08 11:55:07
LANE_
01 18 51 1 37
6/3/20
08 11:56:19 18
LANE_
01 18 53 1 37
6/3/20
08 11:55:54
LANE_
01 18 64 1 38
6/3/20
08 12:06:40 18
LANE_
01 18 64 1 35
6/3/20
08 12:06:14
LANE_
01 18 52 1 38
6/3/20
08 12:07:34 18
LANE_
01 18 52 1 35
6/3/20
08 12:07:09
LANE_
01 18 57 1 38
6/3/20
08 12:10:46 18
LANE_
01 18 52 1 36
6/3/20
08 12:10:21
LANE_
01 19 44 1 39
6/3/20
08 11:06:29 19
LANE_
01 18 51 1 35
6/3/20
08 11:06:06
LANE_
01 20 65 2 38
6/3/20
08 11:09:05 19
LANE_
01 17 67 1 35
6/3/20
08 11:08:38
LANE_
01 20 40 2 36
6/3/20
08 11:09:40 19
LANE_
01 17 39 1 34
6/3/20
08 11:09:19
LANE_
01 19 52 1 37
6/3/20
08 12:01:58 19
LANE_
01 18 53 1 34
6/3/20
08 12:01:34
LANE_
01 20 55 2 39
6/3/20
08 12:03:05 19
LANE_
01 17 55 1 35
6/3/20
08 12:02:41
LANE_
01 19 68 1 39
6/3/20
08 12:23:51 19
LANE_
01 18 61 1 34
6/3/20
08 12:23:24
LANE_
01 20 66 2 37
6/3/20
08 11:02:25 19
LANE_
01 18 54 1 35
6/3/20
08 11:02:00
LANE_
01 19 61 1 37
6/3/20
08 11:04:05 19
LANE_
01 19 56 1 37
6/3/20
08 11:03:40
LANE_
01 19 65 1 40
6/3/20
08 11:07:58 19
LANE_
01 19 63 1 37
6/3/20
08 11:07:32
LANE_
01 19 63 1 36
6/3/20
08 11:11:27 19
LANE_
01 19 66 1 35
6/3/20
08 11:11:01
LANE_
01 19 46 1 39
6/3/20
08 11:59:17 19
LANE_
01 19 41 1 35
6/3/20
08 11:58:54
LANE_
01 18 55 1 38
6/3/20
08 12:07:36 19
LANE_
01 20 51 2 33
6/3/20
08 12:07:12

120
LANE_
01 19 58 1 38
6/3/20
08 12:14:50 19
LANE_
01 19 55 1 33
6/3/20
08 12:14:25
LANE_
01 20 37 2 37
6/3/20
08 11:09:42 20
LANE_
01 19 36 1 33
6/3/20
08 11:09:21
LANE_
01 19 63 1 36
6/3/20
08 12:01:07 20
LANE_
01 20 60 2 34
6/3/20
08 12:00:42
LANE_
01 19 62 1 37
6/3/20
08 12:01:52 20
LANE_
01 20 56 2 33
6/3/20
08 12:01:27
LANE_
01 19 54 1 38
6/3/20
08 12:21:45 20
LANE_
01 20 58 2 35
6/3/20
08 12:21:20
LANE_
01 20 44 2 37
6/3/20
08 11:02:10 20
LANE_
01 20 42 2 35
6/3/20
08 11:01:47
LANE_
01 19 58 1 36
6/3/20
08 11:09:31 20
LANE_
01 21 60 2 33
6/3/20
08 11:09:05
LANE_
01 20 66 2 35
6/3/20
08 11:10:48 20
LANE_
01 20 66 2 31
6/3/20
08 11:10:22
LANE_
01 20 64 2 36
6/3/20
08 12:05:29 20
LANE_
01 20 63 2 33
6/3/20
08 12:05:03
LANE_
01 20 44 2 38
6/3/20
08 12:13:09 20
LANE_
01 20 41 2 34
6/3/20
08 12:12:46
LANE_
01 21 59 2 39
6/3/20
08 12:03:33 21
LANE_
01 20 57 2 35
6/3/20
08 12:03:08
LANE_
01 21 51 2 38
6/3/20
08 12:16:00 21
LANE_
01 20 50 2 36
6/3/20
08 12:15:36
LANE_
01 21 62 2 37
6/3/20
08 11:13:15 21
LANE_
01 21 61 2 34
6/3/20
08 11:12:49
LANE_
01 21 48 2 34
6/3/20
08 12:13:13 22
LANE_
01 22 43 2 34
6/3/20
08 12:12:51
LANE_
01 21 58 2 37
6/3/20
08 12:06:05 22
LANE_
01 23 59 2 33
6/3/20
08 12:05:39
LANE_
01 25 61 2 39
6/3/20
08 11:01:36 23
LANE_
01 21 51 2 34
6/3/20
08 11:01:11
LANE_
01 24 61 2 36
6/3/20
08 11:02:24 23
LANE_
01 22 55 2 34
6/3/20
08 11:01:59
LANE_
01 23 59 2 34
6/3/20
08 11:10:20 23
LANE_
01 23 58 2 31
6/3/20
08 11:09:55
LANE_
01 23 59 2 34
6/3/20
08 12:04:01 23
LANE_
01 23 58 2 32
6/3/20
08 12:03:35
LANE_ 24 49 2 37 6/3/20 11:04:25 24 LANE_ 23 43 2 39 6/3/20 11:04:02

121
01 08 01 08
LANE_
01 23 59 2 37
6/3/20
08 12:18:39 24
LANE_
01 24 52 2 33
6/3/20
08 12:18:14
LANE_
01 26 65 2 34
6/3/20
08 12:18:02 26
LANE_
01 26 62 2 33
6/3/20
08 12:17:36
LANE_
01 32 61 2 35
6/3/20
08 11:01:32 32
LANE_
01 32 57 2 33
6/3/20
08 11:01:07
LANE_
01 35 54 2 36
6/3/20
08 11:01:41 36
LANE_
01 37 53 2 32
6/3/20
08 11:01:16
LANE_
01 37 49 2 38
6/3/20
08 11:03:52 37
LANE_
01 36 49 2 34
6/3/20
08 11:03:28
LANE_
01 38 60 2 37
6/3/20
08 11:12:34 38
LANE_
01 37 60 2 35
6/3/20
08 11:12:09
LANE_
01 38 56 2 35
6/3/20
08 12:04:09 38
LANE_
01 38 54 2 31
6/3/20
08 12:03:44
LANE_
01 42 62 3 37
6/3/20
08 12:11:36 46
LANE_
01 50 64 3 33
6/3/20
08 12:11:10
LANE_
01 54 68 3 35
6/3/20
08 12:14:13 48
LANE_
01 41 67 3 33
6/3/20
08 12:13:47
LANE_
01 51 66 3 35
6/3/20
08 12:02:38 56
LANE_
01 60 65 4 33
6/3/20
08 12:02:12
LANE_
01 58 51 3 34
6/3/20
08 12:18:14 56
LANE_
01 54 46 3 31
6/3/20
08 12:17:51
LANE_
01 64 60 4 39
6/3/20
08 12:17:20 64
LANE_
01 63 55 4 33
6/3/20
08 12:16:55
LANE_
01 69 44 4 36
6/3/20
08 12:13:11 69
LANE_
01 68 43 4 34
6/3/20
08 12:12:49
LANE_
01 70 65 4 36
6/3/20
08 12:10:36 70
LANE_
01 69 63 4 34
6/3/20
08 12:10:10
LANE_
01 70 65 4 37
6/3/20
08 12:01:50 71
LANE_
01 71 63 4 32
6/3/20
08 12:01:24
LANE_
01 72 58 4 36
6/3/20
08 12:01:57 71
LANE_
01 70 55 4 35
6/3/20
08 12:01:32
LANE_
01 73 64 4 36
6/3/20
08 12:22:31 72
LANE_
01 71 62 4 34
6/3/20
08 12:22:05
LANE_
01 70 53 4 36
6/3/20
08 12:26:55 73
LANE_
01 75 47 4 33
6/3/20
08 12:26:31
LANE_
01 76 65 4 37
6/3/20
08 12:23:56 77
LANE_
01 78 58 4 33
6/3/20
08 12:23:30

122
LANE_
01 90 79 4 35
6/3/20
08 12:04:56 86
LANE_
01 81 67 4 32
6/3/20
08 12:04:30
Message sign Off
LANE_
01 17 60 1 20
6/3/20
08 16:30:03 17
LANE_
01 16 47 1 23
6/3/20
08 16:29:45
LANE_
01 16 63 1 21
6/3/20
08 16:31:21 17
LANE_
01 17 58 1 22
6/3/20
08 16:31:02
LANE_
01 15 59 1 24
6/3/20
08 16:53:39 17
LANE_
01 19 71 1 24
6/3/20
08 16:53:17
LANE_
01 18 54 1 23
6/3/20
08 16:49:18 18
LANE_
01 17 51 1 23
6/3/20
08 16:49:01
LANE_
01 18 62 1 23
6/3/20
08 16:53:24 18
LANE_
01 17 55 1 23
6/3/20
08 16:53:03
LANE_
01 18 50 1 19
6/3/20
08 16:30:49 19
LANE_
01 19 45 1 23
6/3/20
08 16:30:33
LANE_
01 18 50 1 19
6/3/20
08 16:52:02 19
LANE_
01 19 52 1 20
6/3/20
08 16:51:45
LANE_
01 21 71 2 21
6/3/20
08 16:31:20 19
LANE_
01 17 58 1 22
6/3/20
08 16:31:00
LANE_
01 19 64 1 21
6/3/20
08 16:52:56 19
LANE_
01 19 59 1 21
6/3/20
08 16:52:36
LANE_
01 19 40 1 21
6/3/20
08 16:59:21 19
LANE_
01 19 37 1 20
6/3/20
08 16:59:09
LANE_
01 19 51 1 20
6/3/20
08 16:49:27 20
LANE_
01 21 55 2 21
6/3/20
08 16:49:08
LANE_
01 20 63 2 23
6/3/20
08 16:54:04 20
LANE_
01 20 63 2 22
6/3/20
08 16:53:43
LANE_
01 20 59 2 21
6/3/20
08 16:55:31 20
LANE_
01 20 40 2 21
6/3/20
08 16:55:14
LANE_
01 21 62 2 21
6/3/20
08 16:54:11 21
LANE_
01 20 61 2 22
6/3/20
08 16:53:52
LANE_
01 21 45 2 22
6/3/20
08 16:55:19 21
LANE_
01 20 38 2 21
6/3/20
08 16:55:05
LANE_
01 21 49 2 18
6/3/20
08 16:59:42 21
LANE_
01 21 42 2 22
6/3/20
08 16:59:26
LANE_
01 22 51 2 21
6/3/20
08 16:55:22 22
LANE_
01 21 41 2 21
6/3/20
08 16:55:08
LANE_
01 25 60 2 21
6/3/20
08 16:48:55 22
LANE_
01 19 52 1 22
6/3/20
08 16:48:36

123
LANE_
01 23 61 2 21
6/3/20
08 16:58:03 23
LANE_
01 23 41 2 21
6/3/20
08 16:57:47
LANE_
01 26 43 2 20
6/3/20
08 16:55:20 25
LANE_
01 24 37 2 20
6/3/20
08 16:55:07
LANE_
01 45 65 3 21
6/3/20
08 16:52:24 44
LANE_
01 42 56 3 23
6/3/20
08 16:52:04
LANE_
01 99 83 4 18
6/3/20
08 16:52:18 79
LANE_
01 59 45 3 19
6/3/20
08 16:51:57
Message sign On
LANE_
01 16 50 1 21
6/3/20
08 17:06:38 16
LANE_
01 16 42 1 21
6/3/20
08 17:06:22
LANE_
01 15 51 1 24
6/3/20
08 17:22:45 17
LANE_
01 18 55 1 22
6/3/20
08 17:22:26
LANE_
01 17 50 1 21
6/3/20
08 17:40:04 17
LANE_
01 17 54 1 20
6/3/20
08 17:39:47
LANE_
01 16 51 1 20
6/3/20
08 17:40:57 17
LANE_
01 18 45 1 19
6/3/20
08 17:40:41
LANE_
01 16 61 1 21
6/3/20
08 17:46:28 17
LANE_
01 18 60 1 24
6/3/20
08 17:46:10
LANE_
01 16 45 1 20
6/3/20
08 17:08:15 18
LANE_
01 19 51 1 22
6/3/20
08 17:07:59
LANE_
01 18 51 1 24
6/3/20
08 17:18:45 18
LANE_
01 17 37 1 21
6/3/20
08 17:18:30
LANE_
01 17 48 1 20
6/3/20
08 17:21:57 18
LANE_
01 18 42 1 19
6/3/20
08 17:21:42
LANE_
01 18 61 1 22
6/3/20
08 17:22:59 18
LANE_
01 17 46 1 20
6/3/20
08 17:22:41
LANE_
01 17 58 1 22
6/3/20
08 17:29:37 18
LANE_
01 18 51 1 20
6/3/20
08 17:29:19
LANE_
01 17 44 1 22
6/3/20
08 17:31:42 18
LANE_
01 18 39 1 21
6/3/20
08 17:31:27
LANE_
01 18 49 1 20
6/3/20
08 17:35:39 18
LANE_
01 17 40 1 22
6/3/20
08 17:35:25
LANE_
01 17 64 1 24
6/3/20
08 17:43:15 18
LANE_
01 18 48 1 23
6/3/20
08 17:42:56
LANE_
01 17 52 1 23
6/3/20
08 17:46:19 18
LANE_
01 18 48 1 22
6/3/20
08 17:46:02
LANE_
01 17 60 1 23
6/3/20
08 17:47:37 18
LANE_
01 18 57 1 21
6/3/20
08 17:47:17

124
LANE_
01 19 59 1 22
6/3/20
08 17:14:28 18
LANE_
01 17 53 1 22
6/3/20
08 17:14:10
LANE_
01 18 53 1 24
6/3/20
08 17:16:04 18
LANE_
01 18 36 1 22
6/3/20
08 17:15:51
LANE_
01 18 53 1 24
6/3/20
08 17:19:35 18
LANE_
01 18 40 1 22
6/3/20
08 17:19:18
LANE_
01 18 85 1 21
6/3/20
08 17:25:26 18
LANE_
01 18 74 1 22
6/3/20
08 17:25:05
LANE_
01 19 63 1 21
6/3/20
08 17:25:45 18
LANE_
01 17 63 1 20
6/3/20
08 17:25:24
LANE_
01 18 52 1 23
6/3/20
08 17:26:27 18
LANE_
01 18 50 1 22
6/3/20
08 17:26:09
LANE_
01 18 58 1 21
6/3/20
08 17:29:46 18
LANE_
01 18 52 1 20
6/3/20
08 17:29:27
LANE_
01 19 49 1 20
6/3/20
08 17:30:28 18
LANE_
01 17 36 1 22
6/3/20
08 17:30:09
LANE_
01 18 44 1 22
6/3/20
08 17:35:43 18
LANE_
01 18 41 1 22
6/3/20
08 17:35:29
LANE_
01 18 48 1 20
6/3/20
08 17:41:03 18
LANE_
01 18 43 1 20
6/3/20
08 17:40:47
LANE_
01 19 48 1 21
6/3/20
08 17:01:41 19
LANE_
01 18 41 1 22
6/3/20
08 17:01:25
LANE_
01 18 68 1 22
6/3/20
08 17:05:54 19
LANE_
01 19 62 1 23
6/3/20
08 17:05:33
LANE_
01 20 57 2 23
6/3/20
08 17:16:36 19
LANE_
01 17 43 1 22
6/3/20
08 17:16:19
LANE_
01 20 62 2 21
6/3/20
08 17:36:47 19
LANE_
01 17 56 1 22
6/3/20
08 17:36:27
LANE_
01 19 62 1 22
6/3/20
08 17:46:46 19
LANE_
01 18 54 1 23
6/3/20
08 17:46:25
LANE_
01 19 57 1 22
6/3/20
08 17:19:00 19
LANE_
01 19 51 1 21
6/3/20
08 17:18:43
LANE_
01 19 48 1 21
6/3/20
08 17:20:47 19
LANE_
01 19 44 1 23
6/3/20
08 17:20:30
LANE_
01 19 49 1 20
6/3/20
08 17:20:58 19
LANE_
01 19 49 1 21
6/3/20
08 17:20:41
LANE_
01 20 72 2 23
6/3/20
08 17:25:46 19
LANE_
01 18 60 1 22
6/3/20
08 17:25:25
LANE_ 20 68 2 21 6/3/20 17:33:17 19 LANE_ 18 62 1 22 6/3/20 17:32:56

125
01 08 01 08
LANE_
01 19 57 1 21
6/3/20
08 17:35:47 19
LANE_
01 19 36 1 20
6/3/20
08 17:35:32
LANE_
01 19 57 1 22
6/3/20
08 17:36:03 19
LANE_
01 19 46 1 21
6/3/20
08 17:35:45
LANE_
01 20 59 2 23
6/3/20
08 17:38:57 19
LANE_
01 18 53 1 21
6/3/20
08 17:38:38
LANE_
01 19 52 1 22
6/3/20
08 17:41:48 19
LANE_
01 19 45 1 21
6/3/20
08 17:41:32
LANE_
01 19 52 1 20
6/3/20
08 17:47:59 19
LANE_
01 19 48 1 23
6/3/20
08 17:47:41
LANE_
01 20 66 2 22
6/3/20
08 17:52:40 19
LANE_
01 18 65 1 22
6/3/20
08 17:52:19
LANE_
01 19 59 1 22
6/3/20
08 17:00:31 20
LANE_
01 20 52 2 21
6/3/20
08 17:00:11
LANE_
01 19 58 1 23
6/3/20
08 17:07:10 20
LANE_
01 20 56 2 21
6/3/20
08 17:06:52
LANE_
01 19 64 1 18
6/3/20
08 17:11:38 20
LANE_
01 20 63 2 21
6/3/20
08 17:11:18
LANE_
01 21 67 2 23
6/3/20
08 17:12:15 20
LANE_
01 18 56 1 22
6/3/20
08 17:11:57
LANE_
01 19 56 1 23
6/3/20
08 17:14:26 20
LANE_
01 20 57 2 22
6/3/20
08 17:14:08
LANE_
01 19 53 1 20
6/3/20
08 17:20:08 20
LANE_
01 20 43 2 22
6/3/20
08 17:19:51
LANE_
01 21 63 2 23
6/3/20
08 17:32:55 20
LANE_
01 18 55 1 23
6/3/20
08 17:32:35
LANE_
01 19 53 1 20
6/3/20
08 17:37:26 20
LANE_
01 20 54 2 23
6/3/20
08 17:37:08
LANE_
01 21 51 2 22
6/3/20
08 17:47:21 20
LANE_
01 18 48 1 22
6/3/20
08 17:47:04
LANE_
01 20 47 2 21
6/3/20
08 17:51:22 20
LANE_
01 19 42 1 21
6/3/20
08 17:51:07
LANE_
01 20 59 2 19
6/3/20
08 17:07:51 20
LANE_
01 20 52 2 20
6/3/20
08 17:07:33
LANE_
01 19 54 1 22
6/3/20
08 17:22:20 20
LANE_
01 21 54 2 22
6/3/20
08 17:22:03
LANE_
01 20 57 2 21
6/3/20
08 17:24:10 20
LANE_
01 20 62 2 20
6/3/20
08 17:23:53

126
LANE_
01 20 48 2 19
6/3/20
08 17:24:40 20
LANE_
01 20 34 2 19
6/3/20
08 17:24:22
LANE_
01 21 60 2 21
6/3/20
08 17:29:31 20
LANE_
01 19 51 1 22
6/3/20
08 17:29:14
LANE_
01 20 60 2 17
6/3/20
08 17:02:21 21
LANE_
01 21 54 2 23
6/3/20
08 17:02:01
LANE_
01 21 56 2 21
6/3/20
08 17:03:47 21
LANE_
01 20 60 2 22
6/3/20
08 17:03:28
LANE_
01 21 70 2 21
6/3/20
08 17:39:25 21
LANE_
01 20 54 2 21
6/3/20
08 17:39:05
LANE_
01 22 69 2 21
6/3/20
08 17:52:54 21
LANE_
01 19 62 1 21
6/3/20
08 17:52:34
LANE_
01 21 55 2 20
6/3/20
08 17:29:34 21
LANE_
01 21 48 2 21
6/3/20
08 17:29:16
LANE_
01 21 62 2 22
6/3/20
08 17:39:12 21
LANE_
01 21 46 2 21
6/3/20
08 17:38:55
LANE_
01 20 58 2 21
6/3/20
08 17:43:35 21
LANE_
01 22 57 2 23
6/3/20
08 17:43:16
LANE_
01 22 69 2 21
6/3/20
08 17:03:20 22
LANE_
01 21 59 2 21
6/3/20
08 17:02:59
LANE_
01 22 58 2 24
6/3/20
08 17:06:34 22
LANE_
01 21 43 2 23
6/3/20
08 17:06:18
LANE_
01 19 70 1 20
6/3/20
08 17:11:30 22
LANE_
01 24 78 2 21
6/3/20
08 17:11:10
LANE_
01 22 58 2 21
6/3/20
08 17:36:05 22
LANE_
01 21 42 2 22
6/3/20
08 17:35:48
LANE_
01 22 57 2 21
6/3/20
08 17:36:15 22
LANE_
01 21 50 2 22
6/3/20
08 17:35:56
LANE_
01 22 51 2 20
6/3/20
08 17:14:44 22
LANE_
01 22 44 2 21
6/3/20
08 17:14:29
LANE_
01 23 69 2 21
6/3/20
08 17:22:22 22
LANE_
01 21 45 2 20
6/3/20
08 17:22:04
LANE_
01 23 48 2 23
6/3/20
08 17:32:45 22
LANE_
01 21 42 2 22
6/3/20
08 17:32:30
LANE_
01 23 67 2 20
6/3/20
08 17:37:51 22
LANE_
01 21 68 2 21
6/3/20
08 17:37:30
LANE_
01 24 52 2 21
6/3/20
08 17:15:00 23
LANE_
01 22 47 2 21
6/3/20
08 17:14:42
LANE_ 23 51 2 21 6/3/20 17:39:51 24 LANE_ 24 43 2 21 6/3/20 17:39:37

127
01 08 01 08
LANE_
01 25 63 2 22
6/3/20
08 17:34:56 24
LANE_
01 23 51 2 21
6/3/20
08 17:34:37
LANE_
01 30 62 2 20
6/3/20
08 17:15:35 25
LANE_
01 19 30 1 22
6/3/20
08 17:15:22
LANE_
01 26 66 2 22
6/3/20
08 17:34:17 25
LANE_
01 24 58 2 23
6/3/20
08 17:33:56
LANE_
01 37 45 2 18
6/3/20
08 17:40:48 37
LANE_
01 36 43 2 18
6/3/20
08 17:40:32
LANE_
01 42 52 3 20
6/3/20
08 17:03:03 41
LANE_
01 39 53 2 23
6/3/20
08 17:02:46
LANE_
01 44 47 3 21
6/3/20
08 17:22:26 42
LANE_
01 40 45 3 21
6/3/20
08 17:22:10
LANE_
01 55 66 3 22
6/3/20
08 17:01:25 54
LANE_
01 53 62 3 23
6/3/20
08 17:01:04
LANE_
01 64 49 4 19
6/3/20
08 17:46:26 68
LANE_
01 71 54 4 20
6/3/20
08 17:46:07
LANE_
01 69 33 4 19
6/3/20
08 17:28:22 69
LANE_
01 68 33 4 22
6/3/20
08 17:28:13
LANE_
01 66 84 4 22
6/3/20
08 17:49:19 69
LANE_
01 71 79 4 22
6/3/20
08 17:48:57
LANE_
01 86 58 4 19
6/3/20
08 17:11:07 77
LANE_
01 68 47 4 18
6/3/20
08 17:10:49
LANE_
01 81 63 4 18
6/3/20
08 17:07:47 84
LANE_
01 87 62 4 20
6/3/20
08 17:07:29
LANE_
01 89 54 4 22
6/3/20
08 17:14:42 87
LANE_
01 85 49 4 24
6/3/20
08 17:14:25
LANE_
01 95 68 4 22
6/3/20
08 17:26:35 107
LANE_
01 119 78 4 21
6/3/20
08 17:26:16
Message sign Off
LANE_
01 10 53 1 27
6/3/20
08 18:47:23 10
LANE_
01 10 45 1 21
6/3/20
08 18:47:06
LANE_
01 14 66 1 22
6/3/20
08 18:13:11 14
LANE_
01 14 61 1 21
6/3/20
08 18:12:51
LANE_
01 16 56 1 24
6/3/20
08 18:43:52 16
LANE_
01 16 55 1 23
6/3/20
08 18:43:33
LANE_
01 17 53 1 21
6/3/20
08 18:03:28 17
LANE_
01 17 47 1 22
6/3/20
08 18:03:11
LANE_ 17 68 1 24 6/3/20 18:09:57 17 LANE_ 17 67 1 23 6/3/20 18:09:36

128
01 08 01 08
LANE_
01 18 59 1 23
6/3/20
08 18:36:13 18
LANE_
01 17 47 1 20
6/3/20
08 18:35:54
LANE_
01 17 52 1 19
6/3/20
08 18:16:29 18
LANE_
01 19 53 1 21
6/3/20
08 18:16:11
LANE_
01 19 57 1 20
6/3/20
08 18:22:49 18
LANE_
01 17 48 1 22
6/3/20
08 18:22:34
LANE_
01 21 50 2 22
6/3/20
08 18:03:18 19
LANE_
01 16 39 1 21
6/3/20
08 18:03:04
LANE_
01 19 54 1 20
6/3/20
08 18:26:43 19
LANE_
01 18 46 1 20
6/3/20
08 18:26:25
LANE_
01 18 57 1 22
6/3/20
08 18:41:06 19
LANE_
01 19 55 1 21
6/3/20
08 18:40:47
LANE_
01 20 66 2 22
6/3/20
08 18:06:22 19
LANE_
01 18 55 1 25
6/3/20
08 18:06:01
LANE_
01 18 39 1 24
6/3/20
08 18:07:47 19
LANE_
01 20 47 2 23
6/3/20
08 18:07:34
LANE_
01 20 54 2 22
6/3/20
08 18:19:27 19
LANE_
01 18 47 1 23
6/3/20
08 18:19:09
LANE_
01 20 52 2 21
6/3/20
08 18:23:10 19
LANE_
01 18 51 1 22
6/3/20
08 18:22:52
LANE_
01 21 71 2 22
6/3/20
08 18:31:10 19
LANE_
01 17 60 1 23
6/3/20
08 18:30:48
LANE_
01 19 56 1 23
6/3/20
08 18:02:37 20
LANE_
01 20 50 2 23
6/3/20
08 18:02:20
LANE_
01 19 43 1 22
6/3/20
08 18:04:47 20
LANE_
01 20 39 2 23
6/3/20
08 18:04:33
LANE_
01 20 47 2 20
6/3/20
08 18:16:10 20
LANE_
01 19 46 1 22
6/3/20
08 18:15:55
LANE_
01 20 65 2 21
6/3/20
08 18:11:10 20
LANE_
01 20 62 2 22
6/3/20
08 18:10:49
LANE_
01 20 62 2 21
6/3/20
08 18:15:50 20
LANE_
01 20 65 2 22
6/3/20
08 18:15:30
LANE_
01 20 57 2 21
6/3/20
08 18:37:14 20
LANE_
01 20 51 2 21
6/3/20
08 18:36:55
LANE_
01 20 48 2 22
6/3/20
08 18:40:43 20
LANE_
01 20 48 2 23
6/3/20
08 18:40:25
LANE_
01 20 59 2 20
6/3/20
08 18:14:01 21
LANE_
01 21 60 2 22
6/3/20
08 18:13:42

129
LANE_
01 20 52 2 23
6/3/20
08 18:22:27 21
LANE_
01 21 55 2 21
6/3/20
08 18:22:31
LANE_
01 20 58 2 22
6/3/20
08 18:34:49 21
LANE_
01 21 58 2 22
6/3/20
08 18:34:30
LANE_
01 22 53 2 20
6/3/20
08 18:16:22 21
LANE_
01 20 50 2 22
6/3/20
08 18:16:04
LANE_
01 22 66 2 22
6/3/20
08 18:29:10 21
LANE_
01 20 57 2 19
6/3/20
08 18:28:50
LANE_
01 22 77 2 24
6/3/20
08 18:19:12 22
LANE_
01 21 67 2 23
6/3/20
08 18:18:51
LANE_
01 21 66 2 21
6/3/20
08 18:32:45 22
LANE_
01 22 59 2 22
6/3/20
08 18:32:25
LANE_
01 23 56 2 22
6/3/20
08 18:08:51 22
LANE_
01 21 56 2 22
6/3/20
08 18:08:32
LANE_
01 22 49 2 19
6/3/20
08 18:16:16 22
LANE_
01 22 43 2 21
6/3/20
08 18:15:59
LANE_
01 23 55 2 21
6/3/20
08 18:30:55 23
LANE_
01 22 56 2 22
6/3/20
08 18:30:36
LANE_
01 22 60 2 21
6/3/20
08 18:19:33 23
LANE_
01 24 65 2 21
6/3/20
08 18:19:13
LANE_
01 23 74 2 21
6/3/20
08 18:26:52 23
LANE_
01 23 66 2 22
6/3/20
08 18:26:30
LANE_
01 43 51 3 21
6/3/20
08 18:14:11 44
LANE_
01 45 42 3 21
6/3/20
08 18:13:59
LANE_
01 49 53 3 22
6/3/20
08 18:20:38 48
LANE_
01 47 50 3 22
6/3/20
08 18:20:20
LANE_
01 67 63 4 19
6/3/20
08 18:30:09 66
LANE_
01 64 60 4 25
6/3/20
08 18:29:48
LANE_
01 76 58 4 19
6/3/20
08 18:39:11 71
LANE_
01 66 50 4 21
6/3/20
08 18:38:50
LANE_
01 91 81 4 22
6/3/20
08 18:35:32 88
LANE_
01 84 63 4 22
6/3/20
08 18:35:10
LANE_
01 96 80 4 20
6/3/20
08 18:35:47 89
LANE_
01 82 60 4 24
6/3/20
08 18:35:26
LANE_
01 84 70 4 21
6/3/20
08 18:39:40 89
LANE_
01 94 79 4 22
6/3/20
08 18:39:19
LANE_
01 79 50 4 18
6/3/20
08 18:16:13 90
LANE_
01 101 60 4 18
6/3/20
08 18:15:57
Sensor 1 Avg. Sensor 2

130
LANE LENG
TH
(MP
H)
CLA
SS
RAN
GE
YYY
Y-
MM-
DD
HH:MM:S
S.sss
LENG
TH LANE
LENG
TH
(MP
H)
CLA
SS
RAN
GE
YYY
Y-
MM-
DD
HH:MM:S
S.sss
Message sign Off
LANE_
01 22 42 2 16
6/4/20
08 10:56:10 23
LANE_
01 23 43 2 18
6/4/20
08 10:56:53
LANE_
01 22 43 2 22
6/4/20
08 10:57:49 22
LANE_
01 21 45 2 25
6/4/20
08 10:58:31
LANE_
01 18 50 1 18
6/4/20
08 10:57:45 18
LANE_
01 18 47 1 21
6/4/20
08 10:58:27
LANE_
01 32 51 2 21
6/4/20
08 10:57:03 32
LANE_
01 31 33 2 20
6/4/20
08 10:57:45
LANE_
01 19 53 1 18
6/4/20
08 10:54:43 19
LANE_
01 19 54 1 19
6/4/20
08 10:55:25
Message sign On
LANE_
01 16 47 1 19
6/4/20
08 11:01:07 17
LANE_
01 17 43 1 21
6/4/20
08 11:01:50
LANE_
01 16 43 1 20
6/4/20
08 11:14:02 17
LANE_
01 17 46 1 22
6/4/20
08 11:14:45
LANE_
01 16 50 1 18
6/4/20
08 11:38:37 17
LANE_
01 18 46 1 21
6/4/20
08 11:39:19
LANE_
01 17 53 1 19
6/4/20
08 11:24:25 18
LANE_
01 18 48 1 21
6/4/20
08 11:25:07
LANE_
01 17 50 1 17
6/4/20
08 11:44:00 18
LANE_
01 18 46 1 19
6/4/20
08 11:44:41
LANE_
01 17 59 1 19
6/4/20
08 11:26:58 18
LANE_
01 19 53 1 22
6/4/20
08 11:27:39
LANE_
01 16 40 1 18
6/4/20
08 11:34:14 18
LANE_
01 20 43 2 19
6/4/20
08 11:34:57
LANE_
01 17 55 1 18
6/4/20
08 11:41:08 18
LANE_
01 19 47 1 21
6/4/20
08 11:41:49
LANE_
01 19 51 1 20
6/4/20
08 11:00:23 19
LANE_
01 18 47 1 21
6/4/20
08 11:01:05
LANE_
01 19 63 1 17
6/4/20
08 11:15:12 19
LANE_
01 18 56 1 19
6/4/20
08 11:15:53
LANE_
01 18 63 1 16
6/4/20
08 11:43:07 19
LANE_
01 19 62 1 19
6/4/20
08 11:43:47
LANE_ 18 46 1 20 6/4/20 11:50:36 19 LANE_ 19 44 1 20 6/4/20 11:51:18

131
01 08 01 08
LANE_
01 19 50 1 18
6/4/20
08 11:11:02 19
LANE_
01 19 45 1 20
6/4/20
08 11:11:44
LANE_
01 19 69 1 21
6/4/20
08 11:15:14 19
LANE_
01 19 58 1 22
6/4/20
08 11:15:54
LANE_
01 19 62 1 19
6/4/20
08 11:20:34 19
LANE_
01 19 60 1 20
6/4/20
08 11:21:15
LANE_
01 20 73 2 22
6/4/20
08 11:53:13 19
LANE_
01 18 61 1 24
6/4/20
08 11:53:53
LANE_
01 19 37 1 18
6/4/20
08 11:06:42 20
LANE_
01 20 39 2 18
6/4/20
08 11:07:26
LANE_
01 19 56 1 22
6/4/20
08 11:38:44 20
LANE_
01 20 47 2 23
6/4/20
08 11:39:26
LANE_
01 20 56 2 20
6/4/20
08 11:39:05 20
LANE_
01 19 52 1 21
6/4/20
08 11:39:46
LANE_
01 21 64 2 20
6/4/20
08 11:01:03 20
LANE_
01 19 51 1 21
6/4/20
08 11:01:44
LANE_
01 21 72 2 18
6/4/20
08 11:01:13 20
LANE_
01 19 55 1 20
6/4/20
08 11:01:54
LANE_
01 20 52 2 19
6/4/20
08 11:06:33 20
LANE_
01 20 47 2 19
6/4/20
08 11:07:15
LANE_
01 21 52 2 17
6/4/20
08 11:35:58 20
LANE_
01 19 51 1 20
6/4/20
08 11:36:40
LANE_
01 20 59 2 21
6/4/20
08 11:39:58 20
LANE_
01 20 55 2 22
6/4/20
08 11:40:39
LANE_
01 22 61 2 25
6/4/20
08 11:51:39 20
LANE_
01 18 44 1 23
6/4/20
08 11:52:21
LANE_
01 20 42 2 16
6/4/20
08 11:41:56 21
LANE_
01 21 26 2 17
6/4/20
08 11:42:41
LANE_
01 21 50 2 16
6/4/20
08 11:19:34 21
LANE_
01 21 46 2 18
6/4/20
08 11:20:17
LANE_
01 22 45 2 18
6/4/20
08 11:10:03 22
LANE_
01 21 45 2 21
6/4/20
08 11:10:46
LANE_
01 21 45 2 20
6/4/20
08 11:33:04 22
LANE_
01 22 41 2 21
6/4/20
08 11:33:47
LANE_
01 20 40 2 18
6/4/20
08 11:12:02 22
LANE_
01 24 39 2 19
6/4/20
08 11:12:46
LANE_
01 23 50 2 18
6/4/20
08 11:12:13 22
LANE_
01 21 41 2 19
6/4/20
08 11:12:55

132
LANE_
01 21 61 2 17
6/4/20
08 11:18:59 22
LANE_
01 23 58 2 17
6/4/20
08 11:19:39
LANE_
01 22 55 2 16
6/4/20
08 11:07:25 23
LANE_
01 23 53 2 18
6/4/20
08 11:08:06
LANE_
01 23 39 2 17
6/4/20
08 11:13:24 23
LANE_
01 22 33 2 18
6/4/20
08 11:14:09
LANE_
01 23 55 2 18
6/4/20
08 11:22:41 23
LANE_
01 22 43 2 19
6/4/20
08 11:23:23
LANE_
01 22 42 2 20
6/4/20
08 11:54:04 23
LANE_
01 23 36 2 21
6/4/20
08 11:54:48
LANE_
01 22 29 2 17
6/4/20
08 11:54:15 23
LANE_
01 23 29 2 19
6/4/20
08 11:55:02
LANE_
01 23 34 2 18
6/4/20
08 11:54:22 23
LANE_
01 22 33 2 19
6/4/20
08 11:55:07
LANE_
01 22 43 2 17
6/4/20
08 11:06:38 23
LANE_
01 24 43 2 19
6/4/20
08 11:07:21
LANE_
01 23 60 2 19
6/4/20
08 11:09:48 23
LANE_
01 23 56 2 17
6/4/20
08 11:10:29
LANE_
01 23 50 2 18
6/4/20
08 11:11:00 23
LANE_
01 23 47 2 20
6/4/20
08 11:11:42
LANE_
01 23 64 2 18
6/4/20
08 11:21:50 23
LANE_
01 23 59 2 21
6/4/20
08 11:22:30
LANE_
01 23 53 2 17
6/4/20
08 11:39:06 23
LANE_
01 23 50 2 20
6/4/20
08 11:39:48
LANE_
01 23 57 2 18
6/4/20
08 11:51:16 23
LANE_
01 23 57 2 19
6/4/20
08 11:51:57
LANE_
01 24 52 2 17
6/4/20
08 11:45:08 24
LANE_
01 24 49 2 19
6/4/20
08 11:45:50
LANE_
01 27 35 2 19
6/4/20
08 11:54:13 27
LANE_
01 26 31 2 21
6/4/20
08 11:54:59
LANE_
01 37 59 2 17
6/4/20
08 11:24:07 38
LANE_
01 38 44 2 21
6/4/20
08 11:24:48
LANE_
01 41 58 3 17
6/4/20
08 11:38:43 39
LANE_
01 37 45 2 20
6/4/20
08 11:39:24
LANE_
01 42 50 3 21
6/4/20
08 11:01:01 41
LANE_
01 39 48 2 20
6/4/20
08 11:01:43
LANE_
01 49 74 3 15
6/4/20
08 11:08:31 46
LANE_
01 43 60 3 17
6/4/20
08 11:09:12
LANE_ 57 38 3 18 6/4/20 11:22:21 56 LANE_ 55 42 3 18 6/4/20 11:23:04

133
01 08 01 08
LANE_
01 61 54 4 22
6/4/20
08 11:50:08 61
LANE_
01 60 49 4 18
6/4/20
08 11:50:49
LANE_
01 74 44 4 17
6/4/20
08 11:22:16 72
LANE_
01 69 39 4 18
6/4/20
08 11:22:59
LANE_
01 72 35 4 22
6/4/20
08 11:54:10 74
LANE_
01 76 31 4 22
6/4/20
08 11:54:56
LANE_
01 85 83 4 15
6/4/20
08 11:20:55 77
LANE_
01 68 60 4 18
6/4/20
08 11:21:35
LANE_
01 79 54 4 14
6/4/20
08 11:42:31 79
LANE_
01 78 50 4 16
6/4/20
08 11:43:12
LANE_
01 81 60 4 23
6/4/20
08 11:47:54 79
LANE_
01 77 54 4 23
6/4/20
08 11:48:35
LANE_
01 86 59 4 17
6/4/20
08 11:38:01 80
LANE_
01 73 49 4 18
6/4/20
08 11:38:43
LANE_
01 85 55 4 24
6/4/20
08 11:48:11 81
LANE_
01 77 51 4 20
6/4/20
08 11:48:52
LANE_
01 88 59 4 15
6/4/20
08 11:24:02 84
LANE_
01 79 46 4 18
6/4/20
08 11:24:44
LANE_
01 83 59 4 22
6/4/20
08 11:48:04 85
LANE_
01 87 54 4 17
6/4/20
08 11:48:46
Message sign Off
LANE_
01 19 62 1 23
6/4/20
08 14:17:23 18
LANE_
01 17 59 1 22
6/4/20
08 14:18:03
LANE_
01 17 41 1 18
6/4/20
08 14:49:38 19
LANE_
01 20 45 2 19
6/4/20
08 14:50:21
LANE_
01 20 58 2 17
6/4/20
08 14:36:47 20
LANE_
01 19 51 1 19
6/4/20
08 14:37:28
LANE_
01 21 65 2 23
6/4/20
08 14:13:08 20
LANE_
01 19 49 1 25
6/4/20
08 14:13:49
LANE_
01 20 45 2 19
6/4/20
08 14:37:52 20
LANE_
01 20 44 2 19
6/4/20
08 14:38:35
LANE_
01 20 58 2 18
6/4/20
08 14:38:03 20
LANE_
01 20 55 2 19
6/4/20
08 14:38:44
LANE_
01 21 48 2 21
6/4/20
08 14:59:42 20
LANE_
01 19 43 1 22
6/4/20
08 15:00:24
LANE_
01 21 47 2 26
6/4/20
08 14:39:19 21
LANE_
01 21 46 2 21
6/4/20
08 14:40:01
LANE_ 22 46 2 20 6/4/20 14:31:53 22 LANE_ 21 43 2 22 6/4/20 14:32:36

134
01 08 01 08
LANE_
01 22 56 2 18
6/4/20
08 14:39:16 22
LANE_
01 21 49 2 21
6/4/20
08 14:39:58
LANE_
01 23 63 2 23
6/4/20
08 14:32:41 23
LANE_
01 22 59 2 22
6/4/20
08 14:33:21
LANE_
01 23 67 2 20
6/4/20
08 14:45:39 23
LANE_
01 22 66 2 22
6/4/20
08 14:46:19
LANE_
01 22 49 2 20
6/4/20
08 14:51:16 23
LANE_
01 23 53 2 21
6/4/20
08 14:51:58
LANE_
01 23 41 2 19
6/4/20
08 14:56:48 23
LANE_
01 22 37 2 20
6/4/20
08 14:57:32
LANE_
01 22 46 2 17
6/4/20
08 14:34:59 23
LANE_
01 24 44 2 20
6/4/20
08 14:35:41
LANE_
01 23 56 2 21
6/4/20
08 14:54:35 23
LANE_
01 23 52 2 19
6/4/20
08 14:55:17
LANE_
01 26 57 2 18
6/4/20
08 14:45:52 25
LANE_
01 24 51 2 20
6/4/20
08 14:46:34
LANE_
01 39 50 2 19
6/4/20
08 14:33:46 38
LANE_
01 37 48 2 19
6/4/20
08 14:34:28
LANE_
01 42 48 3 21
6/4/20
08 14:32:12 44
LANE_
01 45 46 3 26
6/4/20
08 14:32:54
LANE_
01 71 63 4 17
6/4/20
08 14:44:21 71
LANE_
01 71 61 4 18
6/4/20
08 14:45:01
LANE_
01 88 51 4 17
6/4/20
08 14:57:44 84
LANE_
01 80 46 4 18
6/4/20
08 14:58:27
Message sign On
LANE_
01 17 52 1 19
6/4/20
08 15:50:27 17
LANE_
01 17 49 1 21
6/4/20
08 15:50:44
LANE_
01 18 55 1 19
6/4/20
08 15:35:40 18
LANE_
01 17 54 1 20
6/4/20
08 15:36:22
LANE_
01 18 38 1 18
6/4/20
08 15:06:47 19
LANE_
01 20 35 2 18
6/4/20
08 15:07:30
LANE_
01 20 57 2 21
6/4/20
08 15:27:47 19
LANE_
01 18 38 1 21
6/4/20
08 15:28:29
LANE_
01 19 62 1 18
6/4/20
08 15:04:16 20
LANE_
01 20 55 2 19
6/4/20
08 15:04:57
LANE_
01 20 66 2 18
6/4/20
08 15:56:35 20
LANE_
01 19 53 1 21
6/4/20
08 15:56:51
LANE_ 20 57 2 18 6/4/20 15:56:57 20 LANE_ 19 44 1 23 6/4/20 15:57:13

135
01 08 01 08
LANE_
01 20 62 2 19
6/4/20
08 15:57:03 20
LANE_
01 19 43 1 23
6/4/20
08 15:57:19
LANE_
01 19 43 1 17
6/4/20
08 15:57:41 20
LANE_
01 20 40 2 21
6/4/20
08 15:57:58
LANE_
01 20 61 2 18
6/4/20
08 15:53:49 20
LANE_
01 20 55 2 23
6/4/20
08 15:54:04
LANE_
01 21 50 2 18
6/4/20
08 15:08:06 22
LANE_
01 22 49 2 18
6/4/20
08 15:08:48
LANE_
01 21 47 2 19
6/4/20
08 15:50:49 22
LANE_
01 22 44 2 21
6/4/20
08 15:51:06
LANE_
01 22 60 2 17
6/4/20
08 15:54:14 22
LANE_
01 21 53 2 22
6/4/20
08 15:54:30
LANE_
01 21 42 2 17
6/4/20
08 15:57:43 22
LANE_
01 22 38 2 19
6/4/20
08 15:58:01
LANE_
01 23 57 2 21
6/4/20
08 15:33:20 23
LANE_
01 22 43 2 22
6/4/20
08 15:34:02
LANE_
01 23 70 2 19
6/4/20
08 15:47:04 23
LANE_
01 22 68 2 20
6/4/20
08 15:47:18
LANE_
01 25 55 2 18
6/4/20
08 15:34:30 23
LANE_
01 21 47 2 20
6/4/20
08 15:35:13
LANE_
01 23 49 2 18
6/4/20
08 15:33:07 24
LANE_
01 24 39 2 21
6/4/20
08 15:33:50
LANE_
01 25 59 2 16
6/4/20
08 15:58:45 25
LANE_
01 25 46 2 19
6/4/20
08 15:59:01
LANE_
01 31 56 2 18
6/4/20
08 15:04:51 26
LANE_
01 20 50 2 21
6/4/20
08 15:05:33
LANE_
01 37 51 2 21
6/4/20
08 15:07:40 36
LANE_
01 34 43 2 21
6/4/20
08 15:08:22
LANE_
01 39 41 2 16
6/4/20
08 15:08:30 37
LANE_
01 34 42 2 19
6/4/20
08 15:09:13
LANE_
01 46 56 3 20
6/4/20
08 15:50:24 45
LANE_
01 44 52 3 22
6/4/20
08 15:50:40
LANE_
01 74 64 4 18
6/4/20
08 15:06:24 70
LANE_
01 65 56 4 18
6/4/20
08 15:07:04
LANE_
01 78 67 4 20
6/4/20
08 15:08:57 77
LANE_
01 76 63 4 21
6/4/20
08 15:09:37
LANE_
01 89 64 4 19
6/4/20
08 15:07:55 81
LANE_
01 73 57 4 18
6/4/20
08 15:08:36

136
Message sign Off
LANE_
01 16 67 1 18
6/4/20
08 16:27:49 16
LANE_
01 16 60 1 22
6/4/20
08 16:28:04
LANE_
01 17 61 1 18
6/4/20
08 16:01:58 17
LANE_
01 16 53 1 20
6/4/20
08 16:02:14
LANE_
01 16 56 1 17
6/4/20
08 16:09:53 17
LANE_
01 18 49 1 21
6/4/20
08 16:10:09
LANE_
01 16 59 1 18
6/4/20
08 16:28:22 17
LANE_
01 18 48 1 22
6/4/20
08 16:28:38
LANE_
01 16 40 1 19
6/4/20
08 16:01:38 18
LANE_
01 19 32 1 21
6/4/20
08 16:01:58
LANE_
01 16 50 1 17
6/4/20
08 16:09:40 18
LANE_
01 19 48 1 19
6/4/20
08 16:09:56
LANE_
01 17 46 1 18
6/4/20
08 16:11:32 18
LANE_
01 18 47 1 22
6/4/20
08 16:11:49
LANE_
01 17 62 1 17
6/4/20
08 16:15:59 18
LANE_
01 18 50 1 20
6/4/20
08 16:16:14
LANE_
01 17 61 1 19
6/4/20
08 16:38:10 18
LANE_
01 18 54 1 21
6/4/20
08 16:38:26
LANE_
01 16 47 1 16
6/4/20
08 16:01:33 18
LANE_
01 20 30 2 19
6/4/20
08 16:01:52
LANE_
01 17 49 1 17
6/4/20
08 16:11:27 18
LANE_
01 19 46 1 22
6/4/20
08 16:11:43
LANE_
01 19 65 1 19
6/4/20
08 16:19:34 18
LANE_
01 17 61 1 20
6/4/20
08 16:19:49
LANE_
01 18 71 1 21
6/4/20
08 16:27:36 18
LANE_
01 18 67 1 22
6/4/20
08 16:27:50
LANE_
01 19 63 1 20
6/4/20
08 16:40:35 18
LANE_
01 17 56 1 21
6/4/20
08 16:40:51
LANE_
01 18 57 1 18
6/4/20
08 16:41:06 18
LANE_
01 18 54 1 20
6/4/20
08 16:41:21
LANE_
01 16 53 1 18
6/4/20
08 16:43:06 18
LANE_
01 20 49 2 19
6/4/20
08 16:43:22
LANE_
01 17 48 1 17
6/4/20
08 16:01:35 19
LANE_
01 20 36 2 20
6/4/20
08 16:01:55
LANE_
01 18 44 1 19
6/4/20
08 16:03:49 19
LANE_
01 19 46 1 21
6/4/20
08 16:04:06
LANE_
01 19 64 1 18
6/4/20
08 16:29:36 19
LANE_
01 18 62 1 21
6/4/20
08 16:29:51

137
LANE_
01 18 70 1 16
6/4/20
08 16:33:14 19
LANE_
01 19 63 1 19
6/4/20
08 16:33:28
LANE_
01 17 60 1 17
6/4/20
08 16:38:18 19
LANE_
01 20 55 2 20
6/4/20
08 16:38:34
LANE_
01 18 60 1 20
6/4/20
08 16:40:57 19
LANE_
01 19 57 1 21
6/4/20
08 16:41:13
LANE_
01 19 56 1 18
6/4/20
08 16:43:07 19
LANE_
01 18 48 1 20
6/4/20
08 16:43:24
LANE_
01 19 59 1 18
6/4/20
08 16:02:18 19
LANE_
01 19 44 1 20
6/4/20
08 16:02:34
LANE_
01 18 49 1 20
6/4/20
08 16:09:15 19
LANE_
01 20 47 2 22
6/4/20
08 16:09:32
LANE_
01 19 54 1 18
6/4/20
08 16:09:18 19
LANE_
01 19 44 1 21
6/4/20
08 16:09:35
LANE_
01 19 66 1 20
6/4/20
08 16:22:52 19
LANE_
01 19 65 1 20
6/4/20
08 16:23:07
LANE_
01 19 74 1 17
6/4/20
08 16:30:23 19
LANE_
01 19 70 1 21
6/4/20
08 16:30:37
LANE_
01 19 65 1 19
6/4/20
08 16:37:33 19
LANE_
01 19 48 1 21
6/4/20
08 16:37:48
LANE_
01 19 65 1 19
6/4/20
08 16:39:01 19
LANE_
01 19 63 1 21
6/4/20
08 16:39:16
LANE_
01 20 54 2 16
6/4/20
08 16:15:20 20
LANE_
01 19 38 1 21
6/4/20
08 16:15:38
LANE_
01 20 68 2 18
6/4/20
08 16:32:56 20
LANE_
01 19 57 1 20
6/4/20
08 16:33:11
LANE_
01 20 53 2 18
6/4/20
08 16:09:16 20
LANE_
01 20 41 2 19
6/4/20
08 16:09:33
LANE_
01 20 52 2 20
6/4/20
08 16:13:52 20
LANE_
01 20 47 2 22
6/4/20
08 16:14:08
LANE_
01 20 67 2 19
6/4/20
08 16:20:10 20
LANE_
01 20 62 2 20
6/4/20
08 16:20:24
LANE_
01 21 75 2 18
6/4/20
08 16:30:07 20
LANE_
01 19 60 1 22
6/4/20
08 16:30:22
LANE_
01 20 76 2 19
6/4/20
08 16:33:53 20
LANE_
01 20 68 2 20
6/4/20
08 16:34:07
LANE_
01 21 59 2 19
6/4/20
08 16:35:36 20
LANE_
01 19 51 1 20
6/4/20
08 16:35:52
LANE_ 20 71 2 18 6/4/20 16:40:04 20 LANE_ 20 64 2 18 6/4/20 16:40:19

138
01 08 01 08
LANE_
01 21 56 2 18
6/4/20
08 16:13:53 21
LANE_
01 20 44 2 20
6/4/20
08 16:14:10
LANE_
01 21 75 2 18
6/4/20
08 16:26:25 21
LANE_
01 20 70 2 20
6/4/20
08 16:26:40
LANE_
01 21 76 2 17
6/4/20
08 16:28:01 21
LANE_
01 20 65 2 19
6/4/20
08 16:28:16
LANE_
01 20 77 2 20
6/4/20
08 16:36:24 21
LANE_
01 21 73 2 20
6/4/20
08 16:36:38
LANE_
01 20 59 2 17
6/4/20
08 16:37:23 21
LANE_
01 21 45 2 20
6/4/20
08 16:37:38
LANE_
01 21 75 2 20
6/4/20
08 16:23:21 21
LANE_
01 21 65 2 20
6/4/20
08 16:23:36
LANE_
01 21 62 2 17
6/4/20
08 16:37:25 21
LANE_
01 21 39 2 20
6/4/20
08 16:37:41
LANE_
01 20 66 2 17
6/4/20
08 16:38:15 21
LANE_
01 22 71 2 21
6/4/20
08 16:38:30
LANE_
01 22 47 2 17
6/4/20
08 16:11:30 22
LANE_
01 21 46 2 23
6/4/20
08 16:11:46
LANE_
01 22 58 2 18
6/4/20
08 16:13:45 22
LANE_
01 21 51 2 21
6/4/20
08 16:14:00
LANE_
01 21 62 2 16
6/4/20
08 16:43:03 22
LANE_
01 22 59 2 20
6/4/20
08 16:43:18
LANE_
01 21 55 2 18
6/4/20
08 16:15:29 22
LANE_
01 23 42 2 21
6/4/20
08 16:15:46
LANE_
01 23 65 2 16
6/4/20
08 16:28:21 22
LANE_
01 21 50 2 20
6/4/20
08 16:28:36
LANE_
01 22 58 2 17
6/4/20
08 16:37:54 22
LANE_
01 22 53 2 20
6/4/20
08 16:38:10
LANE_
01 24 65 2 18
6/4/20
08 16:29:30 23
LANE_
01 22 61 2 22
6/4/20
08 16:29:45
LANE_
01 23 58 2 17
6/4/20
08 16:41:01 23
LANE_
01 23 55 2 18
6/4/20
08 16:41:17
LANE_
01 24 48 2 16
6/4/20
08 16:01:34 24
LANE_
01 23 35 2 20
6/4/20
08 16:01:53
LANE_
01 23 47 2 18
6/4/20
08 16:12:36 24
LANE_
01 24 45 2 20
6/4/20
08 16:12:53
LANE_
01 23 35 2 16
6/4/20
08 16:10:55 24
LANE_
01 25 35 2 19
6/4/20
08 16:11:13
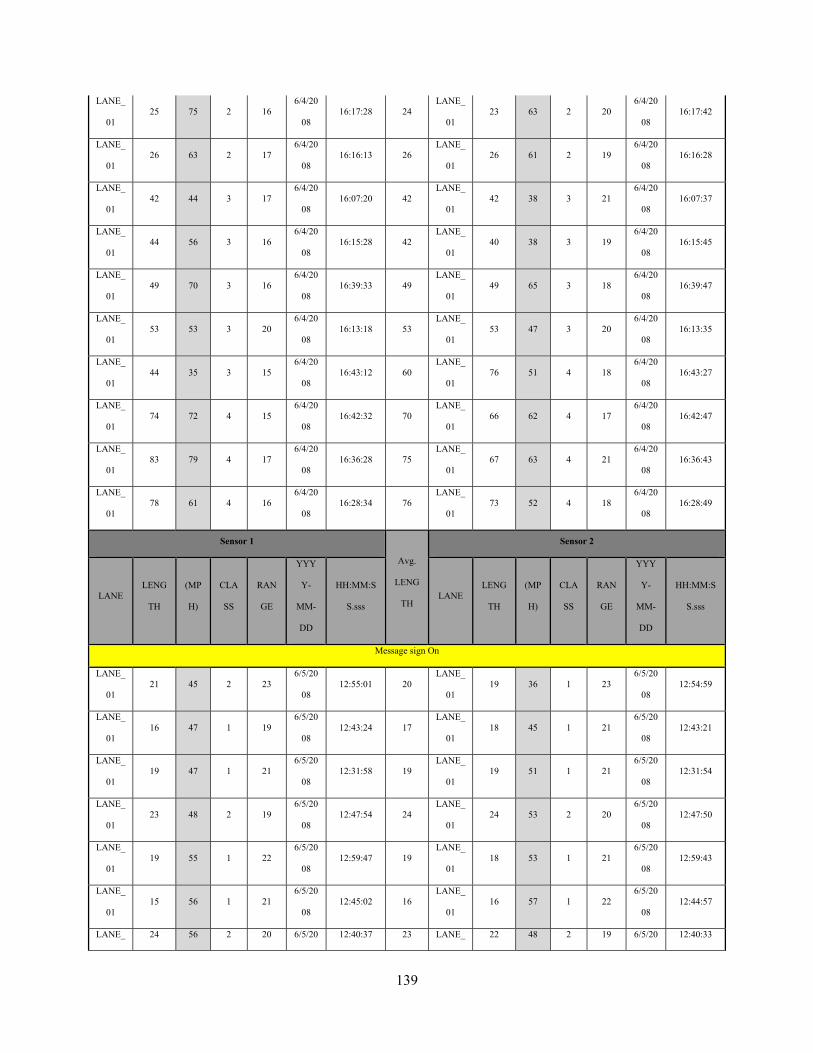
139
LANE_
01 25 75 2 16
6/4/20
08 16:17:28 24
LANE_
01 23 63 2 20
6/4/20
08 16:17:42
LANE_
01 26 63 2 17
6/4/20
08 16:16:13 26
LANE_
01 26 61 2 19
6/4/20
08 16:16:28
LANE_
01 42 44 3 17
6/4/20
08 16:07:20 42
LANE_
01 42 38 3 21
6/4/20
08 16:07:37
LANE_
01 44 56 3 16
6/4/20
08 16:15:28 42
LANE_
01 40 38 3 19
6/4/20
08 16:15:45
LANE_
01 49 70 3 16
6/4/20
08 16:39:33 49
LANE_
01 49 65 3 18
6/4/20
08 16:39:47
LANE_
01 53 53 3 20
6/4/20
08 16:13:18 53
LANE_
01 53 47 3 20
6/4/20
08 16:13:35
LANE_
01 44 35 3 15
6/4/20
08 16:43:12 60
LANE_
01 76 51 4 18
6/4/20
08 16:43:27
LANE_
01 74 72 4 15
6/4/20
08 16:42:32 70
LANE_
01 66 62 4 17
6/4/20
08 16:42:47
LANE_
01 83 79 4 17
6/4/20
08 16:36:28 75
LANE_
01 67 63 4 21
6/4/20
08 16:36:43
LANE_
01 78 61 4 16
6/4/20
08 16:28:34 76
LANE_
01 73 52 4 18
6/4/20
08 16:28:49
Sensor 1
Avg.
LENG
TH
Sensor 2
LANE LENG
TH
(MP
H)
CLA
SS
RAN
GE
YYY
Y-
MM-
DD
HH:MM:S
S.sss LANE
LENG
TH
(MP
H)
CLA
SS
RAN
GE
YYY
Y-
MM-
DD
HH:MM:S
S.sss
Message sign On
LANE_
01 21 45 2 23
6/5/20
08 12:55:01 20
LANE_
01 19 36 1 23
6/5/20
08 12:54:59
LANE_
01 16 47 1 19
6/5/20
08 12:43:24 17
LANE_
01 18 45 1 21
6/5/20
08 12:43:21
LANE_
01 19 47 1 21
6/5/20
08 12:31:58 19
LANE_
01 19 51 1 21
6/5/20
08 12:31:54
LANE_
01 23 48 2 19
6/5/20
08 12:47:54 24
LANE_
01 24 53 2 20
6/5/20
08 12:47:50
LANE_
01 19 55 1 22
6/5/20
08 12:59:47 19
LANE_
01 18 53 1 21
6/5/20
08 12:59:43
LANE_
01 15 56 1 21
6/5/20
08 12:45:02 16
LANE_
01 16 57 1 22
6/5/20
08 12:44:57
LANE_ 24 56 2 20 6/5/20 12:40:37 23 LANE_ 22 48 2 19 6/5/20 12:40:33

140
01 08 01 08
LANE_
01 23 57 2 20
6/5/20
08 12:44:32 23
LANE_
01 22 52 2 20
6/5/20
08 12:44:28
LANE_
01 22 58 2 22
6/5/20
08 12:50:56 22
LANE_
01 21 57 2 22
6/5/20
08 12:50:51
LANE_
01 19 60 1 22
6/5/20
08 12:57:46 19
LANE_
01 18 57 1 21
6/5/20
08 12:57:41
LANE_
01 19 60 1 22
6/5/20
08 12:57:00 21
LANE_
01 22 64 2 25
6/5/20
08 12:56:54
LANE_
01 67 61 4 22
6/5/20
08 12:57:22 66
LANE_
01 65 59 4 22
6/5/20
08 12:57:17
LANE_
01 80 61 4 17
6/5/20
08 12:44:25 77
LANE_
01 74 52 4 20
6/5/20
08 12:44:20
LANE_
01 15 62 1 22
6/5/20
08 12:37:53 16
LANE_
01 17 61 1 22
6/5/20
08 12:37:48
LANE_
01 18 62 1 21
6/5/20
08 12:44:58 18
LANE_
01 18 58 1 22
6/5/20
08 12:44:52
LANE_
01 17 63 1 22
6/5/20
08 12:52:50 19
LANE_
01 20 65 2 24
6/5/20
08 12:52:45
LANE_
01 39 63 2 22
6/5/20
08 12:50:43 40
LANE_
01 41 59 3 22
6/5/20
08 12:50:38
LANE_
01 19 64 1 21
6/5/20
08 12:29:52 19
LANE_
01 18 63 1 23
6/5/20
08 12:29:47
LANE_
01 70 64 4 18
6/5/20
08 12:32:45 70
LANE_
01 69 60 4 18
6/5/20
08 12:32:40
LANE_
01 18 65 1 21
6/5/20
08 12:57:47 18
LANE_
01 18 60 1 22
6/5/20
08 12:57:42
LANE_
01 17 67 1 22
6/5/20
08 12:46:17 17
LANE_
01 17 61 1 21
6/5/20
08 12:46:11
LANE_
01 16 67 1 21
6/5/20
08 12:52:28 18
LANE_
01 19 49 1 24
6/5/20
08 12:52:22
LANE_
01 18 67 1 22
6/5/20
08 12:37:07 18
LANE_
01 18 64 1 22
6/5/20
08 12:37:01
LANE_
01 22 68 2 25
6/5/20
08 12:59:07 22
LANE_
01 22 70 2 27
6/5/20
08 12:59:01
LANE_
01 22 71 2 22
6/5/20
08 12:58:13 23
LANE_
01 24 66 2 25
6/5/20
08 12:58:06
LANE_
01 19 73 1 19
6/5/20
08 12:43:43 19
LANE_
01 19 64 1 21
6/5/20
08 12:43:37

141
LANE_
01 37 75 2 18
6/5/20
08 12:47:15 35
LANE_
01 32 58 2 23
6/5/20
08 12:47:10
LANE_
01 88 75 4 19
6/5/20
08 12:59:33 81
LANE_
01 74 62 4 18
6/5/20
08 12:59:27
LANE_
01 80 79 4 18
6/5/20
08 12:59:17 76
LANE_
01 71 69 4 20
6/5/20
08 12:59:11
Message sign Off
LANE_
01 22 28 2 19
6/5/20
08 13:54:31 22
LANE_
01 21 16 2 21
6/5/20
08 13:54:33
LANE_
01 18 42 1 20
6/5/20
08 13:55:39 18
LANE_
01 18 45 1 21
6/5/20
08 13:55:36
LANE_
01 21 47 2 21
6/5/20
08 13:29:44 21
LANE_
01 21 44 2 20
6/5/20
08 13:29:41
LANE_
01 73 51 4 17
6/5/20
08 13:27:02 72
LANE_
01 71 53 4 19
6/5/20
08 13:26:57
LANE_
01 19 52 1 23
6/5/20
08 13:33:01 19
LANE_
01 19 54 1 22
6/5/20
08 13:32:57
LANE_
01 35 52 2 19
6/5/20
08 13:21:15 36
LANE_
01 36 52 2 20
6/5/20
08 13:21:11
LANE_
01 58 52 3 18
6/5/20
08 13:14:39 57
LANE_
01 55 49 3 17
6/5/20
08 13:14:35
LANE_
01 67 52 4 18
6/5/20
08 13:26:53 66
LANE_
01 65 50 4 20
6/5/20
08 13:26:48
LANE_
01 12 53 1 21
6/5/20
08 13:26:55 12
LANE_
01 12 51 1 23
6/5/20
08 13:26:51
LANE_
01 17 53 1 22
6/5/20
08 13:33:21 18
LANE_
01 19 59 1 22
6/5/20
08 13:33:16
LANE_
01 19 53 1 24
6/5/20
08 13:26:54 19
LANE_
01 18 53 1 24
6/5/20
08 13:26:50
LANE_
01 19 53 1 22
6/5/20
08 13:47:32 19
LANE_
01 19 52 1 24
6/5/20
08 13:47:28
LANE_
01 22 53 2 18
6/5/20
08 13:07:12 23
LANE_
01 23 54 2 20
6/5/20
08 13:07:08
LANE_
01 18 54 1 23
6/5/20
08 13:25:16 18
LANE_
01 18 48 1 23
6/5/20
08 13:25:12
LANE_
01 11 55 1 24
6/5/20
08 13:26:58 11
LANE_
01 11 52 1 22
6/5/20
08 13:26:53
LANE_
01 17 55 1 22
6/5/20
08 13:51:33 18
LANE_
01 19 59 1 21
6/5/20
08 13:51:28

142
LANE_
01 39 55 2 19
6/5/20
08 13:13:11 40
LANE_
01 40 54 3 21
6/5/20
08 13:13:06
LANE_
01 51 55 3 21
6/5/20
08 13:14:23 50
LANE_
01 48 52 3 21
6/5/20
08 13:14:18
LANE_
01 76 55 4 21
6/5/20
08 13:34:04 75
LANE_
01 73 51 4 19
6/5/20
08 13:34:00
LANE_
01 19 56 1 23
6/5/20
08 13:32:59 19
LANE_
01 18 56 1 22
6/5/20
08 13:32:54
LANE_
01 78 56 4 24
6/5/20
08 13:32:57 77
LANE_
01 76 54 4 24
6/5/20
08 13:32:52
LANE_
01 18 57 1 23
6/5/20
08 13:35:04 18
LANE_
01 17 60 1 24
6/5/20
08 13:34:58
LANE_
01 17 57 1 22
6/5/20
08 13:04:55 18
LANE_
01 19 57 1 22
6/5/20
08 13:04:49
LANE_
01 68 57 4 21
6/5/20
08 13:14:18 69
LANE_
01 69 57 4 22
6/5/20
08 13:14:13
LANE_
01 16 58 1 22
6/5/20
08 13:38:55 17
LANE_
01 18 60 1 24
6/5/20
08 13:38:50
LANE_
01 18 58 1 21
6/5/20
08 13:47:29 18
LANE_
01 18 60 1 22
6/5/20
08 13:47:24
LANE_
01 33 58 2 22
6/5/20
08 13:51:28 33
LANE_
01 33 56 2 23
6/5/20
08 13:51:23
LANE_
01 46 58 3 19
6/5/20
08 13:37:32 46
LANE_
01 45 55 3 19
6/5/20
08 13:37:27
LANE_
01 18 59 1 23
6/5/20
08 13:19:50 18
LANE_
01 17 59 1 22
6/5/20
08 13:19:45
LANE_
01 15 60 1 20
6/5/20
08 13:30:46 16
LANE_
01 17 64 1 21
6/5/20
08 13:30:40
LANE_
01 18 60 1 21
6/5/20
08 13:22:08 18
LANE_
01 17 52 1 22
6/5/20
08 13:22:03
LANE_
01 20 60 2 24
6/5/20
08 13:47:22 20
LANE_
01 20 59 2 23
6/5/20
08 13:47:17
LANE_
01 67 60 4 21
6/5/20
08 13:13:24 68
LANE_
01 68 60 4 22
6/5/20
08 13:13:18
LANE_
01 19 61 1 22
6/5/20
08 13:20:03 20
LANE_
01 20 59 2 21
6/5/20
08 13:19:57
LANE_
01 35 61 2 21
6/5/20
08 13:47:27 36
LANE_
01 37 66 2 21
6/5/20
08 13:47:21
LANE_ 17 62 1 21 6/5/20 13:30:47 18 LANE_ 18 63 1 21 6/5/20 13:30:42

143
01 08 01 08
LANE_
01 19 62 1 20
6/5/20
08 13:02:41 19
LANE_
01 18 62 1 21
6/5/20
08 13:02:35
LANE_
01 23 62 2 22
6/5/20
08 13:41:50 23
LANE_
01 22 52 2 21
6/5/20
08 13:41:45
LANE_
01 28 62 2 23
6/5/20
08 13:59:57 28
LANE_
01 28 61 2 21
6/5/20
08 13:59:52
LANE_
01 68 62 4 18
6/5/20
08 13:26:43 67
LANE_
01 65 57 4 19
6/5/20
08 13:26:38
LANE_
01 16 63 1 21
6/5/20
08 13:14:00 17
LANE_
01 17 62 1 22
6/5/20
08 13:13:55
LANE_
01 19 63 1 21
6/5/20
08 13:51:30 19
LANE_
01 18 61 1 22
6/5/20
08 13:51:25
LANE_
01 20 63 2 23
6/5/20
08 13:50:08 20
LANE_
01 19 62 1 22
6/5/20
08 13:50:03
LANE_
01 20 63 2 21
6/5/20
08 13:38:54 20
LANE_
01 20 63 2 21
6/5/20
08 13:38:49
LANE_
01 21 63 1 19
6/5/20
08 13:40:34 20
LANE_
01 19 54 1 19
6/5/20
08 13:40:30
LANE_
01 24 63 2 21
6/5/20
08 13:58:18 25
LANE_
01 25 62 2 21
6/5/20
08 13:58:12
LANE_
01 57 63 3 21
6/5/20
08 13:56:27 56
LANE_
01 54 60 3 22
6/5/20
08 13:56:21
LANE_
01 67 63 4 21
6/5/20
08 13:14:11 68
LANE_
01 68 62 4 24
6/5/20
08 13:14:06
LANE_
01 77 63 4 17
6/5/20
08 13:50:46 76
LANE_
01 75 61 4 16
6/5/20
08 13:50:41
LANE_
01 18 64 1 21
6/5/20
08 13:20:12 18
LANE_
01 18 66 1 19
6/5/20
08 13:20:07
LANE_
01 19 64 1 22
6/5/20
08 13:23:27 20
LANE_
01 20 66 2 22
6/5/20
08 13:23:21
LANE_
01 22 64 2 20
6/5/20
08 13:38:57 22
LANE_
01 22 62 2 20
6/5/20
08 13:38:52
LANE_
01 54 64 3 21
6/5/20
08 13:13:27 54
LANE_
01 53 63 3 22
6/5/20
08 13:13:22
LANE_
01 85 64 4 20
6/5/20
08 13:31:18 80
LANE_
01 75 53 4 21
6/5/20
08 13:31:13
LANE_
01 19 65 1 22
6/5/20
08 13:44:25 20
LANE_
01 20 67 2 23
6/5/20
08 13:44:19

144
LANE_
01 49 65 3 22
6/5/20
08 13:42:57 48
LANE_
01 47 62 3 21
6/5/20
08 13:42:51
LANE_
01 19 66 1 21
6/5/20
08 13:52:01 19
LANE_
01 19 66 1 20
6/5/20
08 13:51:55
LANE_
01 77 66 4 20
6/5/20
08 13:14:14 74
LANE_
01 70 60 4 23
6/5/20
08 13:14:09
LANE_
01 77 66 4 17
6/5/20
08 13:58:15 75
LANE_
01 72 60 4 20
6/5/20
08 13:58:09
LANE_
01 81 66 4 17
6/5/20
08 13:00:47 78
LANE_
01 74 61 4 20
6/5/20
08 13:00:41
LANE_
01 77 66 4 21
6/5/20
08 13:09:03 78
LANE_
01 79 66 4 22
6/5/20
08 13:08:57
LANE_
01 84 66 4 21
6/5/20
08 13:12:59 80
LANE_
01 76 61 4 23
6/5/20
08 13:12:53
LANE_
01 16 67 1 20
6/5/20
08 13:36:07 16
LANE_
01 16 66 1 20
6/5/20
08 13:36:01
LANE_
01 20 67 2 22
6/5/20
08 13:59:43 20
LANE_
01 19 65 1 22
6/5/20
08 13:59:37
LANE_
01 20 67 2 21
6/5/20
08 13:02:21 20
LANE_
01 20 68 2 20
6/5/20
08 13:02:15
LANE_
01 21 67 2 21
6/5/20
08 13:20:05 20
LANE_
01 19 59 1 19
6/5/20
08 13:19:59
LANE_
01 45 67 3 17
6/5/20
08 13:34:54 43
LANE_
01 40 59 3 21
6/5/20
08 13:34:49
LANE_
01 52 67 3 19
6/5/20
08 13:58:10 51
LANE_
01 49 56 3 19
6/5/20
08 13:58:04
LANE_
01 68 67 4 21
6/5/20
08 13:56:23 64
LANE_
01 60 58 4 22
6/5/20
08 13:56:18
LANE_
01 87 67 4 18
6/5/20
08 13:10:21 87
LANE_
01 87 61 4 19
6/5/20
08 13:10:16
LANE_
01 19 68 1 21
6/5/20
08 13:19:54 18
LANE_
01 17 61 1 22
6/5/20
08 13:19:48
LANE_
01 23 68 2 22
6/5/20
08 13:05:22 23
LANE_
01 22 69 2 20
6/5/20
08 13:05:16
LANE_
01 74 68 4 20
6/5/20
08 13:23:43 74
LANE_
01 73 65 4 23
6/5/20
08 13:23:37
LANE_
01 18 69 1 23
6/5/20
08 13:57:50 18
LANE_
01 18 67 1 22
6/5/20
08 13:57:44
LANE_ 23 69 2 23 6/5/20 13:25:46 23 LANE_ 23 65 2 22 6/5/20 13:25:40

145
01 08 01 08
LANE_
01 18 70 1 21
6/5/20
08 13:37:55 18
LANE_
01 17 66 1 23
6/5/20
08 13:37:49
LANE_
01 18 70 1 24
6/5/20
08 13:13:40 18
LANE_
01 18 68 1 23
6/5/20
08 13:13:34
LANE_
01 18 70 1 21
6/5/20
08 13:54:09 18
LANE_
01 18 71 1 21
6/5/20
08 13:54:03
LANE_
01 26 70 2 24
6/5/20
08 13:41:08 26
LANE_
01 25 66 2 21
6/5/20
08 13:41:02
LANE_
01 32 70 2 19
6/5/20
08 13:51:54 32
LANE_
01 31 63 2 17
6/5/20
08 13:51:49
LANE_
01 24 72 2 21
6/5/20
08 13:10:47 23
LANE_
01 22 64 2 21
6/5/20
08 13:10:42
LANE_
01 76 72 4 22
6/5/20
08 13:53:30 75
LANE_
01 73 66 4 19
6/5/20
08 13:53:24
LANE_
01 73 73 4 22
6/5/20
08 13:00:38 71
LANE_
01 68 67 4 22
6/5/20
08 13:00:32
LANE_
01 76 73 4 20
6/5/20
08 13:35:15 71
LANE_
01 66 62 4 20
6/5/20
08 13:35:10
LANE_
01 15 74 1 20
6/5/20
08 13:02:38 15
LANE_
01 14 70 1 22
6/5/20
08 13:02:32
LANE_
01 21 77 2 22
6/5/20
08 13:01:14 21
LANE_
01 20 71 2 23
6/5/20
08 13:01:08
LANE_
01 58 77 3 19
6/5/20
08 13:58:12 53
LANE_
01 48 61 3 19
6/5/20
08 13:58:06
LANE_
01 52 86 3 18
6/5/20
08 13:33:27 45
LANE_
01 37 63 2 18
6/5/20
08 13:33:22
Message sign On
LANE_
01 18 43 1 21
6/5/20
08 14:41:03 18
LANE_
01 18 53 1 23
6/5/20
08 14:40:59
LANE_
01 19 45 1 21
6/5/20
08 14:29:28 19
LANE_
01 19 53 1 23
6/5/20
08 14:29:24
LANE_
01 14 46 1 20
6/5/20
08 14:14:15 15
LANE_
01 16 50 1 21
6/5/20
08 14:14:11
LANE_
01 20 52 2 21
6/5/20
08 14:39:20 20
LANE_
01 19 55 1 21
6/5/20
08 14:39:16
LANE_
01 17 53 1 20
6/5/20
08 14:37:17 17
LANE_
01 17 45 1 21
6/5/20
08 14:37:12
LANE_ 18 54 1 22 6/5/20 14:15:58 19 LANE_ 19 48 1 22 6/5/20 14:15:54

146
01 08 01 08
LANE_
01 21 54 2 23
6/5/20
08 14:08:58 21
LANE_
01 20 54 2 24
6/5/20
08 14:08:54
LANE_
01 21 54 2 22
6/5/20
08 14:08:56 21
LANE_
01 21 56 2 24
6/5/20
08 14:08:51
LANE_
01 22 54 2 24
6/5/20
08 14:08:54 22
LANE_
01 22 56 2 24
6/5/20
08 14:08:49
LANE_
01 17 55 1 21
6/5/20
08 14:19:44 18
LANE_
01 18 60 1 22
6/5/20
08 14:19:39
LANE_
01 65 55 4 18
6/5/20
08 14:16:27 64
LANE_
01 63 51 4 18
6/5/20
08 14:16:23
LANE_
01 58 56 3 24
6/5/20
08 14:17:37 58
LANE_
01 57 60 3 22
6/5/20
08 14:17:32
LANE_
01 77 56 4 21
6/5/20
08 14:11:37 77
LANE_
01 76 56 4 21
6/5/20
08 14:11:32
LANE_
01 92 56 4 18
6/5/20
08 14:14:19 88
LANE_
01 83 53 4 20
6/5/20
08 14:14:15
LANE_
01 20 57 2 23
6/5/20
08 14:05:57 21
LANE_
01 21 64 2 24
6/5/20
08 14:05:52
LANE_
01 77 58 4 20
6/5/20
08 14:14:13 74
LANE_
01 70 56 4 22
6/5/20
08 14:14:08
LANE_
01 75 59 4 21
6/5/20
08 14:13:00 75
LANE_
01 74 61 4 23
6/5/20
08 14:12:54
LANE_
01 76 59 4 19
6/5/20
08 14:13:13 76
LANE_
01 75 57 4 19
6/5/20
08 14:13:08
LANE_
01 16 60 1 22
6/5/20
08 14:27:41 17
LANE_
01 17 66 1 22
6/5/20
08 14:27:36
LANE_
01 21 60 2 21
6/5/20
08 14:15:56 21
LANE_
01 20 49 2 20
6/5/20
08 14:15:51
LANE_
01 75 60 4 19
6/5/20
08 14:14:08 73
LANE_
01 71 55 4 20
6/5/20
08 14:14:03
LANE_
01 20 61 2 21
6/5/20
08 14:27:14 19
LANE_
01 18 55 1 21
6/5/20
08 14:27:09
LANE_
01 20 61 2 22
6/5/20
08 14:12:40 20
LANE_
01 19 63 1 21
6/5/20
08 14:12:35
LANE_
01 20 63 2 24
6/5/20
08 14:25:32 21
LANE_
01 21 60 2 23
6/5/20
08 14:25:27
LANE_
01 23 63 2 19
6/5/20
08 14:03:18 25
LANE_
01 26 69 2 20
6/5/20
08 14:03:12

147
LANE_
01 20 64 2 23
6/5/20
08 14:38:57 21
LANE_
01 21 65 2 23
6/5/20
08 14:38:51
LANE_
01 22 64 2 23
6/5/20
08 14:24:41 22
LANE_
01 21 55 2 23
6/5/20
08 14:24:36
LANE_
01 54 65 3 21
6/5/20
08 14:34:54 51
LANE_
01 47 54 3 21
6/5/20
08 14:34:48
LANE_
01 22 66 2 24
6/5/20
08 14:15:00 22
LANE_
01 22 65 2 22
6/5/20
08 14:14:54
LANE_
01 23 66 2 21
6/5/20
08 14:21:27 23
LANE_
01 22 59 2 21
6/5/20
08 14:21:21
LANE_
01 81 66 4 20
6/5/20
08 14:19:47 77
LANE_
01 73 58 4 20
6/5/20
08 14:19:41
LANE_
01 15 67 1 21
6/5/20
08 14:30:51 16
LANE_
01 16 70 1 21
6/5/20
08 14:30:44
LANE_
01 19 67 1 21
6/5/20
08 14:41:06 18
LANE_
01 17 59 1 22
6/5/20
08 14:41:01
LANE_
01 23 67 2 21
6/5/20
08 14:03:01 23
LANE_
01 22 62 2 21
6/5/20
08 14:02:55
LANE_
01 59 67 3 19
6/5/20
08 14:02:21 58
LANE_
01 56 60 3 20
6/5/20
08 14:02:15
LANE_
01 79 67 4 23
6/5/20
08 14:18:10 78
LANE_
01 76 61 4 22
6/5/20
08 14:18:05
LANE_
01 17 68 1 19
6/5/20
08 14:36:26 18
LANE_
01 18 71 1 21
6/5/20
08 14:36:20
LANE_
01 20 69 2 20
6/5/20
08 14:38:58 20
LANE_
01 20 65 2 21
6/5/20
08 14:38:53
LANE_
01 18 70 1 22
6/5/20
08 14:26:44 19
LANE_
01 19 65 1 22
6/5/20
08 14:26:38
LANE_
01 25 70 2 23
6/5/20
08 14:18:32 25
LANE_
01 25 67 2 23
6/5/20
08 14:18:26
LANE_
01 26 71 2 22
6/5/20
08 14:30:44 25
LANE_
01 24 66 2 22
6/5/20
08 14:30:38
LANE_
01 35 71 2 18
6/5/20
08 14:09:07 35
LANE_
01 34 64 2 20
6/5/20
08 14:09:01
LANE_
01 23 72 2 23
6/5/20
08 14:39:09 23
LANE_
01 22 69 2 24
6/5/20
08 14:39:02
LANE_
01 21 73 2 22
6/5/20
08 14:12:14 20
LANE_
01 19 67 1 22
6/5/20
08 14:12:08
LANE_ 17 74 1 22 6/5/20 14:36:22 18 LANE_ 18 73 1 23 6/5/20 14:36:16

148
01 08 01 08
LANE_
01 72 75 4 18
6/5/20
08 14:04:48 69
LANE_
01 65 67 4 19
6/5/20
08 14:04:42
LANE_
01 60 76 4 18
6/5/20
08 14:42:47 55
LANE_
01 50 61 3 20
6/5/20
08 14:42:41
LANE_
01 19 78 1 21
6/5/20
08 14:01:42 19
LANE_
01 18 73 1 24
6/5/20
08 14:01:36
LANE_
01 23 81 2 24
6/5/20
08 14:36:16 22
LANE_
01 20 69 2 20
6/5/20
08 14:36:10
LANE_
01 83 82 4 18
6/5/20
08 14:12:37 75
LANE_
01 66 65 4 18
6/5/20
08 14:12:31
Sensor 1
Avg.
LENG
TH
Sensor 2
LANE LENG
TH
(MP
H)
CLA
SS
RAN
GE
YYY
Y-
MM-
DD
HH:MM:S
S.sss LANE
LENG
TH
(MP
H)
CLA
SS
RAN
GE
YYY
Y-
MM-
DD
HH:MM:S
S.sss
Message sign Off
LANE_
01 21 48 2 20
6/6/20
08 9:40:51 22
LANE_
01 22 56 2 20
6/6/20
08 9:40:44
LANE_
01 17 50 1 22
6/6/20
08 9:41:56 17
LANE_
01 17 53 1 24
6/6/20
08 9:41:50
LANE_
01 20 51 2 22
6/6/20
08 9:42:04 20
LANE_
01 19 60 1 23
6/6/20
08 9:41:58
LANE_
01 20 51 2 22
6/6/20
08 9:44:01 22
LANE_
01 24 61 2 22
6/6/20
08 9:43:55
LANE_
01 22 52 2 20
6/6/20
08 9:53:46 22
LANE_
01 21 54 2 23
6/6/20
08 9:53:39
LANE_
01 18 54 1 22
6/6/20
08 9:50:07 18
LANE_
01 18 55 1 24
6/6/20
08 9:50:00
LANE_
01 14 56 1 22
6/6/20
08 9:58:28 16
LANE_
01 17 61 1 24
6/6/20
08 9:58:21
LANE_
01 15 57 1 24
6/6/20
08 9:46:14 16
LANE_
01 17 61 1 22
6/6/20
08 9:46:07
LANE_
01 23 57 2 21
6/6/20
08 9:53:48 22
LANE_
01 20 50 2 23
6/6/20
08 9:53:41
LANE_
01 65 57 4 17
6/6/20
08 9:58:33 66
LANE_
01 66 57 4 22
6/6/20
08 9:58:27
LANE_
01 16 58 1 22
6/6/20
08 9:58:25 17
LANE_
01 18 65 1 23
6/6/20
08 9:58:17

149
LANE_
01 19 58 1 20
6/6/20
08 9:41:05 19
LANE_
01 19 58 1 22
6/6/20
08 9:40:58
LANE_
01 17 60 1 22
6/6/20
08 9:56:10 17
LANE_
01 17 58 1 23
6/6/20
08 9:56:03
LANE_
01 18 60 1 23
6/6/20
08 9:53:13 18
LANE_
01 17 59 1 23
6/6/20
08 9:53:06
LANE_
01 17 62 1 23
6/6/20
08 9:53:40 16
LANE_
01 15 56 1 25
6/6/20
08 9:53:33
LANE_
01 64 63 4 19
6/6/20
08 9:44:20 65
LANE_
01 65 65 4 22
6/6/20
08 9:44:13
LANE_
01 71 63 4 19
6/6/20
08 9:56:08 72
LANE_
01 73 63 4 20
6/6/20
08 9:56:00
LANE_
01 18 64 1 23
6/6/20
08 9:43:36 19
LANE_
01 19 65 1 26
6/6/20
08 9:43:29
LANE_
01 19 64 1 23
6/6/20
08 9:48:32 19
LANE_
01 18 61 1 24
6/6/20
08 9:48:25
LANE_
01 70 64 4 21
6/6/20
08 9:41:37 70
LANE_
01 70 63 4 20
6/6/20
08 9:41:30
LANE_
01 18 65 1 22
6/6/20
08 9:41:12 18
LANE_
01 17 59 1 25
6/6/20
08 9:41:05
LANE_
01 16 66 1 23
6/6/20
08 9:49:03 16
LANE_
01 16 65 1 22
6/6/20
08 9:48:56
LANE_
01 20 66 2 21
6/6/20
08 9:52:41 20
LANE_
01 20 68 2 23
6/6/20
08 9:52:34
LANE_
01 22 66 2 22
6/6/20
08 9:52:16 21
LANE_
01 20 62 2 22
6/6/20
08 9:52:08
LANE_
01 44 66 3 18
6/6/20
08 9:41:14 42
LANE_
01 40 60 3 21
6/6/20
08 9:41:07
LANE_
01 18 67 1 24
6/6/20
08 9:49:27 18
LANE_
01 17 65 1 23
6/6/20
08 9:49:19
LANE_
01 17 68 1 23
6/6/20
08 9:48:01 18
LANE_
01 19 71 1 23
6/6/20
08 9:47:53
LANE_
01 19 68 1 22
6/6/20
08 9:42:29 19
LANE_
01 19 68 1 22
6/6/20
08 9:42:22
LANE_
01 55 69 3 22
6/6/20
08 9:54:03 54
LANE_
01 53 67 3 23
6/6/20
08 9:53:55
LANE_
01 16 70 1 23
6/6/20
08 9:49:12 16
LANE_
01 16 73 1 23
6/6/20
08 9:49:04
LANE_ 81 74 4 25 6/6/20 9:57:58 75 LANE_ 69 64 4 25 6/6/20 9:57:50
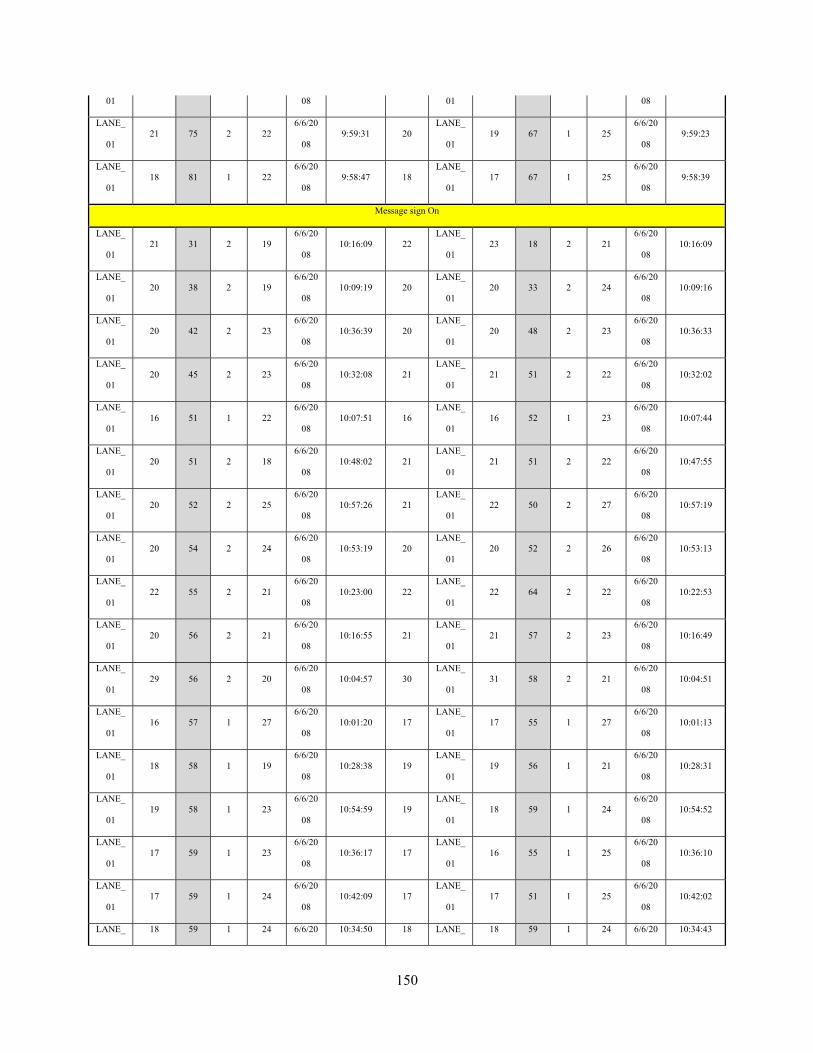
150
01 08 01 08
LANE_
01 21 75 2 22
6/6/20
08 9:59:31 20
LANE_
01 19 67 1 25
6/6/20
08 9:59:23
LANE_
01 18 81 1 22
6/6/20
08 9:58:47 18
LANE_
01 17 67 1 25
6/6/20
08 9:58:39
Message sign On
LANE_
01 21 31 2 19
6/6/20
08 10:16:09 22
LANE_
01 23 18 2 21
6/6/20
08 10:16:09
LANE_
01 20 38 2 19
6/6/20
08 10:09:19 20
LANE_
01 20 33 2 24
6/6/20
08 10:09:16
LANE_
01 20 42 2 23
6/6/20
08 10:36:39 20
LANE_
01 20 48 2 23
6/6/20
08 10:36:33
LANE_
01 20 45 2 23
6/6/20
08 10:32:08 21
LANE_
01 21 51 2 22
6/6/20
08 10:32:02
LANE_
01 16 51 1 22
6/6/20
08 10:07:51 16
LANE_
01 16 52 1 23
6/6/20
08 10:07:44
LANE_
01 20 51 2 18
6/6/20
08 10:48:02 21
LANE_
01 21 51 2 22
6/6/20
08 10:47:55
LANE_
01 20 52 2 25
6/6/20
08 10:57:26 21
LANE_
01 22 50 2 27
6/6/20
08 10:57:19
LANE_
01 20 54 2 24
6/6/20
08 10:53:19 20
LANE_
01 20 52 2 26
6/6/20
08 10:53:13
LANE_
01 22 55 2 21
6/6/20
08 10:23:00 22
LANE_
01 22 64 2 22
6/6/20
08 10:22:53
LANE_
01 20 56 2 21
6/6/20
08 10:16:55 21
LANE_
01 21 57 2 23
6/6/20
08 10:16:49
LANE_
01 29 56 2 20
6/6/20
08 10:04:57 30
LANE_
01 31 58 2 21
6/6/20
08 10:04:51
LANE_
01 16 57 1 27
6/6/20
08 10:01:20 17
LANE_
01 17 55 1 27
6/6/20
08 10:01:13
LANE_
01 18 58 1 19
6/6/20
08 10:28:38 19
LANE_
01 19 56 1 21
6/6/20
08 10:28:31
LANE_
01 19 58 1 23
6/6/20
08 10:54:59 19
LANE_
01 18 59 1 24
6/6/20
08 10:54:52
LANE_
01 17 59 1 23
6/6/20
08 10:36:17 17
LANE_
01 16 55 1 25
6/6/20
08 10:36:10
LANE_
01 17 59 1 24
6/6/20
08 10:42:09 17
LANE_
01 17 51 1 25
6/6/20
08 10:42:02
LANE_ 18 59 1 24 6/6/20 10:34:50 18 LANE_ 18 59 1 24 6/6/20 10:34:43

151
01 08 01 08
LANE_
01 19 59 1 23
6/6/20
08 10:22:26 19
LANE_
01 18 51 1 23
6/6/20
08 10:22:19
LANE_
01 14 60 1 25
6/6/20
08 10:28:33 14
LANE_
01 13 54 1 25
6/6/20
08 10:28:26
LANE_
01 16 60 1 25
6/6/20
08 10:13:59 17
LANE_
01 17 64 1 23
6/6/20
08 10:13:51
LANE_
01 17 60 1 25
6/6/20
08 10:26:03 17
LANE_
01 17 56 1 26
6/6/20
08 10:25:56
LANE_
01 17 60 1 23
6/6/20
08 10:45:55 17
LANE_
01 17 52 1 24
6/6/20
08 10:45:48
LANE_
01 22 60 2 23
6/6/20
08 10:31:36 21
LANE_
01 20 55 2 22
6/6/20
08 10:31:30
LANE_
01 67 60 4 17
6/6/20
08 10:48:20 64
LANE_
01 61 31 4 19
6/6/20
08 10:48:14
LANE_
01 63 60 4 21
6/6/20
08 10:14:09 65
LANE_
01 66 66 4 22
6/6/20
08 10:14:01
LANE_
01 16 61 1 25
6/6/20
08 10:56:52 17
LANE_
01 18 64 1 29
6/6/20
08 10:56:44
LANE_
01 17 61 1 23
6/6/20
08 10:13:08 18
LANE_
01 18 66 1 24
6/6/20
08 10:13:00
LANE_
01 18 61 1 23
6/6/20
08 10:15:53 18
LANE_
01 18 60 1 23
6/6/20
08 10:15:46
LANE_
01 21 61 2 24
6/6/20
08 10:50:03 21
LANE_
01 21 58 2 24
6/6/20
08 10:49:56
LANE_
01 16 62 1 23
6/6/20
08 10:03:15 16
LANE_
01 16 58 1 24
6/6/20
08 10:03:08
LANE_
01 16 62 1 23
6/6/20
08 10:23:24 16
LANE_
01 16 64 1 24
6/6/20
08 10:23:17
LANE_
01 17 62 1 22
6/6/20
08 10:40:16 17
LANE_
01 16 56 1 28
6/6/20
08 10:40:09
LANE_
01 19 62 1 22
6/6/20
08 10:53:41 20
LANE_
01 20 54 2 23
6/6/20
08 10:53:34
LANE_
01 20 62 2 21
6/6/20
08 10:12:41 20
LANE_
01 20 64 2 22
6/6/20
08 10:12:34
LANE_
01 31 62 2 23
6/6/20
08 10:28:36 31
LANE_
01 30 60 2 24
6/6/20
08 10:28:29
LANE_
01 60 62 4 19
6/6/20
08 10:36:16 60
LANE_
01 60 61 4 20
6/6/20
08 10:36:09

152
LANE_
01 16 63 1 24
6/6/20
08 10:25:21 16
LANE_
01 15 56 1 24
6/6/20
08 10:25:14
LANE_
01 17 63 1 23
6/6/20
08 10:36:24 18
LANE_
01 18 65 1 24
6/6/20
08 10:36:17
LANE_
01 20 63 2 22
6/6/20
08 10:34:59 20
LANE_
01 19 64 1 23
6/6/20
08 10:34:52
LANE_
01 21 63 2 23
6/6/20
08 10:38:21 21
LANE_
01 21 56 2 23
6/6/20
08 10:38:14
LANE_
01 24 63 2 21
6/6/20
08 10:35:49 24
LANE_
01 24 55 2 24
6/6/20
08 10:35:42
LANE_
01 76 63 4 19
6/6/20
08 10:12:01 78
LANE_
01 80 66 4 21
6/6/20
08 10:11:54
LANE_
01 17 64 1 23
6/6/20
08 10:26:10 17
LANE_
01 16 65 1 24
6/6/20
08 10:26:02
LANE_
01 17 64 1 22
6/6/20
08 10:40:00 18
LANE_
01 19 73 1 23
6/6/20
08 10:39:52
LANE_
01 19 64 1 24
6/6/20
08 10:59:21 19
LANE_
01 18 62 1 26
6/6/20
08 10:59:14
LANE_
01 41 64 3 23
6/6/20
08 10:00:40 41
LANE_
01 40 59 3 25
6/6/20
08 10:00:33
LANE_
01 72 64 4 22
6/6/20
08 10:03:11 72
LANE_
01 72 65 4 23
6/6/20
08 10:03:03
LANE_
01 75 64 4 20
6/6/20
08 10:54:52 77
LANE_
01 79 66 4 22
6/6/20
08 10:54:45
LANE_
01 16 65 1 22
6/6/20
08 10:42:28 17
LANE_
01 17 52 1 23
6/6/20
08 10:42:21
LANE_
01 18 65 1 21
6/6/20
08 10:05:53 18
LANE_
01 17 58 1 24
6/6/20
08 10:05:45
LANE_
01 23 65 2 20
6/6/20
08 10:43:15 23
LANE_
01 23 65 2 22
6/6/20
08 10:43:07
LANE_
01 17 66 1 23
6/6/20
08 10:46:50 17
LANE_
01 17 69 1 24
6/6/20
08 10:46:42
LANE_
01 18 66 1 22
6/6/20
08 10:01:26 18
LANE_
01 17 64 1 23
6/6/20
08 10:01:18
LANE_
01 27 66 2 20
6/6/20
08 10:34:27 28
LANE_
01 28 66 2 22
6/6/20
08 10:34:20
LANE_
01 59 66 3 19
6/6/20
08 10:36:12 60
LANE_
01 61 68 4 21
6/6/20
08 10:36:04
LANE_ 73 66 4 24 6/6/20 10:59:47 72 LANE_ 71 63 4 23 6/6/20 10:59:39

153
01 08 01 08
LANE_
01 16 67 1 22
6/6/20
08 10:21:35 16
LANE_
01 16 63 1 22
6/6/20
08 10:21:27
LANE_
01 18 67 1 22
6/6/20
08 10:41:33 18
LANE_
01 17 62 1 25
6/6/20
08 10:41:25
LANE_
01 19 67 1 22
6/6/20
08 10:55:09 19
LANE_
01 18 59 1 25
6/6/20
08 10:55:01
LANE_
01 22 67 2 19
6/6/20
08 10:45:32 22
LANE_
01 21 60 2 23
6/6/20
08 10:45:25
LANE_
01 16 68 1 26
6/6/20
08 10:10:00 17
LANE_
01 17 65 1 27
6/6/20
08 10:09:53
LANE_
01 21 68 2 20
6/6/20
08 10:47:00 21
LANE_
01 21 65 2 23
6/6/20
08 10:46:52
LANE_
01 66 68 4 23
6/6/20
08 10:29:26 65
LANE_
01 63 66 4 23
6/6/20
08 10:29:18
LANE_
01 81 68 4 21
6/6/20
08 10:56:29 80
LANE_
01 78 65 4 23
6/6/20
08 10:56:22
LANE_
01 18 69 1 23
6/6/20
08 10:21:37 18
LANE_
01 17 64 1 24
6/6/20
08 10:21:30
LANE_
01 17 69 1 22
6/6/20
08 10:46:24 18
LANE_
01 18 68 1 23
6/6/20
08 10:46:16
LANE_
01 20 69 2 23
6/6/20
08 10:31:47 19
LANE_
01 18 63 1 25
6/6/20
08 10:31:39
LANE_
01 81 69 4 20
6/6/20
08 10:54:47 78
LANE_
01 75 63 4 22
6/6/20
08 10:54:40
LANE_
01 81 69 4 20
6/6/20
08 10:31:57 79
LANE_
01 77 64 4 23
6/6/20
08 10:31:50
LANE_
01 24 70 2 21
6/6/20
08 10:07:30 23
LANE_
01 21 60 2 25
6/6/20
08 10:07:23
LANE_
01 17 71 1 22
6/6/20
08 10:58:15 17
LANE_
01 17 59 1 23
6/6/20
08 10:58:08
LANE_
01 17 72 1 25
6/6/20
08 10:35:38 17
LANE_
01 17 76 1 26
6/6/20
08 10:35:29
LANE_
01 65 72 4 23
6/6/20
08 10:02:23 64
LANE_
01 63 68 4 25
6/6/20
08 10:02:15
LANE_
01 23 73 2 22
6/6/20
08 10:31:08 23
LANE_
01 22 67 2 24
6/6/20
08 10:31:01
LANE_
01 45 75 3 19
6/6/20
08 10:21:32 44
LANE_
01 43 72 3 22
6/6/20
08 10:21:24

154
LANE_
01 17 76 1 20
6/6/20
08 10:38:37 17
LANE_
01 17 79 1 23
6/6/20
08 10:38:28
LANE_
01 48 79 3 18
6/6/20
08 10:17:00 46
LANE_
01 43 70 3 20
6/6/20
08 10:16:52
LANE_
01 33 82 2 18
6/6/20
08 10:54:48 30
LANE_
01 26 58 2 21
6/6/20
08 10:54:41
LANE_
01 25 85 2 22
6/6/20
08 10:00:35 22
LANE_
01 18 60 1 24
6/6/20
08 10:00:27
Message sign Off
LANE_
01 18 47 1 22
6/6/20
08 11:48:55 18
LANE_
01 17 47 1 23
6/6/20
08 11:48:49
LANE_
01 18 47 1 21
6/6/20
08 11:41:37 19
LANE_
01 19 47 1 24
6/6/20
08 11:41:32
LANE_
01 43 49 3 22
6/6/20
08 11:20:23 43
LANE_
01 42 58 3 23
6/6/20
08 11:20:17
LANE_
01 22 50 2 21
6/6/20
08 11:59:25 22
LANE_
01 22 53 2 23
6/6/20
08 11:59:19
LANE_
01 22 51 2 21
6/6/20
08 11:24:43 22
LANE_
01 22 55 2 27
6/6/20
08 11:24:36
LANE_
01 17 52 1 22
6/6/20
08 11:46:23 18
LANE_
01 18 55 1 23
6/6/20
08 11:46:17
LANE_
01 18 53 1 22
6/6/20
08 11:32:06 18
LANE_
01 17 49 1 25
6/6/20
08 11:32:00
LANE_
01 16 55 1 25
6/6/20
08 11:55:47 17
LANE_
01 17 57 1 25
6/6/20
08 11:55:39
LANE_
01 15 56 1 22
6/6/20
08 11:30:51 16
LANE_
01 17 62 1 22
6/6/20
08 11:30:43
LANE_
01 18 56 1 22
6/6/20
08 11:02:29 18
LANE_
01 18 55 1 22
6/6/20
08 11:02:22
LANE_
01 20 56 2 19
6/6/20
08 11:31:28 21
LANE_
01 22 55 2 25
6/6/20
08 11:31:22
LANE_
01 16 59 1 20
6/6/20
08 11:14:43 16
LANE_
01 16 61 1 22
6/6/20
08 11:14:35
LANE_
01 17 59 1 22
6/6/20
08 11:30:12 18
LANE_
01 18 55 1 22
6/6/20
08 11:30:05
LANE_
01 36 59 2 28
6/6/20
08 11:11:56 37
LANE_
01 38 59 2 29
6/6/20
08 11:11:49
LANE_
01 19 60 1 21
6/6/20
08 11:42:14 19
LANE_
01 19 55 1 23
6/6/20
08 11:42:07

155
LANE_
01 20 60 2 27
6/6/20
08 11:44:50 21
LANE_
01 22 60 2 29
6/6/20
08 11:44:42
LANE_
01 18 61 1 21
6/6/20
08 11:30:19 18
LANE_
01 18 61 1 24
6/6/20
08 11:30:12
LANE_
01 19 61 1 22
6/6/20
08 11:30:32 19
LANE_
01 18 61 1 25
6/6/20
08 11:30:24
LANE_
01 18 61 1 22
6/6/20
08 11:07:06 19
LANE_
01 20 69 2 22
6/6/20
08 11:06:59
LANE_
01 20 61 2 22
6/6/20
08 11:07:02 21
LANE_
01 21 61 2 22
6/6/20
08 11:06:54
LANE_
01 21 61 2 28
6/6/20
08 11:44:48 21
LANE_
01 21 62 2 26
6/6/20
08 11:44:40
LANE_
01 63 61 4 17
6/6/20
08 11:19:36 66
LANE_
01 68 67 4 21
6/6/20
08 11:19:29
LANE_
01 16 62 1 19
6/6/20
08 11:07:05 16
LANE_
01 16 65 1 22
6/6/20
08 11:06:57
LANE_
01 18 62 1 22
6/6/20
08 11:37:43 18
LANE_
01 17 62 1 23
6/6/20
08 11:37:35
LANE_
01 18 62 1 20
6/6/20
08 11:34:09 19
LANE_
01 19 66 1 21
6/6/20
08 11:34:02
LANE_
01 18 62 1 19
6/6/20
08 11:38:17 19
LANE_
01 19 60 1 22
6/6/20
08 11:38:10
LANE_
01 19 62 1 19
6/6/20
08 11:29:35 19
LANE_
01 19 59 1 24
6/6/20
08 11:29:27
LANE_
01 22 62 2 24
6/6/20
08 11:24:54 22
LANE_
01 21 61 2 28
6/6/20
08 11:24:46
LANE_
01 22 62 2 24
6/6/20
08 11:24:40 22
LANE_
01 22 62 2 26
6/6/20
08 11:24:33
LANE_
01 33 62 2 26
6/6/20
08 11:24:46 33
LANE_
01 33 57 2 27
6/6/20
08 11:24:39
LANE_
01 17 63 1 22
6/6/20
08 11:23:03 17
LANE_
01 17 68 1 24
6/6/20
08 11:22:55
LANE_
01 17 63 1 24
6/6/20
08 11:52:52 17
LANE_
01 17 66 1 22
6/6/20
08 11:52:45
LANE_
01 18 63 1 21
6/6/20
08 11:36:02 19
LANE_
01 19 66 1 23
6/6/20
08 11:35:54
LANE_
01 19 63 1 28
6/6/20
08 11:25:07 20
LANE_
01 20 61 2 24
6/6/20
08 11:24:59
LANE_ 35 63 2 22 6/6/20 11:07:04 37 LANE_ 39 64 2 20 6/6/20 11:06:56

156
01 08 01 08
LANE_
01 17 64 1 21
6/6/20
08 11:40:00 17
LANE_
01 17 64 1 24
6/6/20
08 11:39:52
LANE_
01 18 64 1 23
6/6/20
08 11:35:53 18
LANE_
01 17 58 1 23
6/6/20
08 11:35:46
LANE_
01 20 64 2 22
6/6/20
08 11:30:14 19
LANE_
01 18 56 1 25
6/6/20
08 11:30:07
LANE_
01 21 64 2 20
6/6/20
08 11:34:43 21
LANE_
01 21 65 2 25
6/6/20
08 11:34:36
LANE_
01 21 64 2 18
6/6/20
08 11:34:37 22
LANE_
01 22 64 2 23
6/6/20
08 11:34:30
LANE_
01 77 64 4 18
6/6/20
08 11:30:18 75
LANE_
01 73 62 4 22
6/6/20
08 11:30:10
LANE_
01 10 65 1 26
6/6/20
08 11:16:11 10
LANE_
01 10 64 1 28
6/6/20
08 11:16:03
LANE_
01 18 65 1 23
6/6/20
08 11:15:03 18
LANE_
01 17 61 1 24
6/6/20
08 11:14:56
LANE_
01 18 65 1 27
6/6/20
08 11:10:39 18
LANE_
01 18 65 1 27
6/6/20
08 11:10:31
LANE_
01 19 65 1 21
6/6/20
08 11:05:57 19
LANE_
01 18 64 1 24
6/6/20
08 11:05:49
LANE_
01 20 65 2 21
6/6/20
08 11:57:45 20
LANE_
01 19 68 1 22
6/6/20
08 11:57:37
LANE_
01 20 65 2 23
6/6/20
08 11:12:44 21
LANE_
01 21 71 2 23
6/6/20
08 11:12:36
LANE_
01 21 65 2 22
6/6/20
08 11:02:55 21
LANE_
01 21 68 2 21
6/6/20
08 11:02:47
LANE_
01 81 65 4 16
6/6/20
08 11:51:27 78
LANE_
01 74 60 4 19
6/6/20
08 11:51:20
LANE_
01 110 65 4 23
6/6/20
08 11:29:33 110
LANE_
01 110 65 4 25
6/6/20
08 11:29:25
LANE_
01 10 66 1 27
6/6/20
08 11:00:25 10
LANE_
01 10 65 1 28
6/6/20
08 11:00:17
LANE_
01 16 66 1 21
6/6/20
08 11:38:57 16
LANE_
01 16 67 1 23
6/6/20
08 11:38:49
LANE_
01 17 66 1 25
6/6/20
08 11:11:34 17
LANE_
01 16 61 1 26
6/6/20
08 11:11:26
LANE_
01 17 66 1 22
6/6/20
08 11:14:20 17
LANE_
01 16 61 1 23
6/6/20
08 11:14:13

157
LANE_
01 17 66 1 25
6/6/20
08 11:28:43 17
LANE_
01 16 66 1 29
6/6/20
08 11:28:35
LANE_
01 16 66 1 22
6/6/20
08 11:58:23 17
LANE_
01 18 78 1 21
6/6/20
08 11:58:15
LANE_
01 18 66 1 23
6/6/20
08 11:08:00 18
LANE_
01 17 65 1 24
6/6/20
08 11:07:52
LANE_
01 18 66 1 20
6/6/20
08 11:32:39 18
LANE_
01 17 63 1 24
6/6/20
08 11:32:31
LANE_
01 19 66 1 22
6/6/20
08 11:55:35 20
LANE_
01 21 72 2 22
6/6/20
08 11:55:27
LANE_
01 21 66 2 24
6/6/20
08 11:47:14 21
LANE_
01 21 66 2 26
6/6/20
08 11:47:06
LANE_
01 34 66 2 25
6/6/20
08 11:25:04 33
LANE_
01 32 58 2 28
6/6/20
08 11:24:57
LANE_
01 16 67 1 23
6/6/20
08 11:00:37 16
LANE_
01 16 69 1 25
6/6/20
08 11:00:29
LANE_
01 17 67 1 27
6/6/20
08 11:00:24 17
LANE_
01 17 67 1 29
6/6/20
08 11:00:16
LANE_
01 17 67 1 23
6/6/20
08 11:21:47 17
LANE_
01 17 69 1 24
6/6/20
08 11:21:39
LANE_
01 18 67 1 22
6/6/20
08 11:14:08 18
LANE_
01 18 73 1 23
6/6/20
08 11:14:00
LANE_
01 19 67 1 21
6/6/20
08 11:17:49 18
LANE_
01 17 64 1 22
6/6/20
08 11:17:41
LANE_
01 21 67 2 23
6/6/20
08 11:30:50 20
LANE_
01 19 61 1 24
6/6/20
08 11:30:42
LANE_
01 21 67 2 21
6/6/20
08 11:30:27 21
LANE_
01 20 66 2 25
6/6/20
08 11:30:19
LANE_
01 23 67 2 22
6/6/20
08 11:32:58 22
LANE_
01 21 54 2 23
6/6/20
08 11:32:50
LANE_
01 35 67 2 19
6/6/20
08 11:05:51 36
LANE_
01 36 65 2 21
6/6/20
08 11:05:43
LANE_
01 16 68 1 23
6/6/20
08 11:28:46 17
LANE_
01 17 67 1 24
6/6/20
08 11:28:38
LANE_
01 17 68 1 20
6/6/20
08 11:35:07 17
LANE_
01 17 64 1 23
6/6/20
08 11:34:59
LANE_
01 18 68 1 26
6/6/20
08 11:29:17 19
LANE_
01 19 65 1 26
6/6/20
08 11:29:09
LANE_ 38 68 2 21 6/6/20 11:14:18 38 LANE_ 38 67 2 25 6/6/20 11:14:11

158
01 08 01 08
LANE_
01 17 69 1 22
6/6/20
08 11:05:03 17
LANE_
01 16 67 1 24
6/6/20
08 11:04:55
LANE_
01 19 69 1 22
6/6/20
08 11:23:54 19
LANE_
01 19 68 1 24
6/6/20
08 11:23:46
LANE_
01 75 69 4 20
6/6/20
08 11:52:58 74
LANE_
01 72 68 4 22
6/6/20
08 11:52:50
LANE_
01 18 70 1 22
6/6/20
08 11:38:50 18
LANE_
01 18 70 1 23
6/6/20
08 11:38:42
LANE_
01 20 70 2 21
6/6/20
08 11:05:19 20
LANE_
01 19 67 1 23
6/6/20
08 11:05:11
LANE_
01 20 70 2 20
6/6/20
08 11:36:47 21
LANE_
01 21 71 2 23
6/6/20
08 11:36:39
LANE_
01 51 70 3 18
6/6/20
08 11:53:59 51
LANE_
01 50 68 3 20
6/6/20
08 11:53:52
LANE_
01 62 70 4 24
6/6/20
08 11:13:30 60
LANE_
01 58 62 3 20
6/6/20
08 11:13:23
LANE_
01 14 71 1 24
6/6/20
08 11:40:11 14
LANE_
01 14 68 1 25
6/6/20
08 11:40:03
LANE_
01 18 71 1 21
6/6/20
08 11:04:20 18
LANE_
01 18 69 1 23
6/6/20
08 11:04:12
LANE_
01 41 71 3 21
6/6/20
08 11:28:19 41
LANE_
01 40 67 3 23
6/6/20
08 11:28:11
LANE_
01 16 72 1 20
6/6/20
08 11:28:21 16
LANE_
01 15 65 1 23
6/6/20
08 11:28:13
LANE_
01 24 72 2 21
6/6/20
08 11:37:22 23
LANE_
01 22 68 2 23
6/6/20
08 11:37:14
LANE_
01 19 73 1 21
6/6/20
08 11:05:52 19
LANE_
01 18 70 1 23
6/6/20
08 11:05:45
LANE_
01 20 73 2 24
6/6/20
08 11:09:59 19
LANE_
01 18 71 1 25
6/6/20
08 11:09:51
LANE_
01 28 73 2 22
6/6/20
08 11:38:22 27
LANE_
01 25 64 2 24
6/6/20
08 11:38:14
LANE_
01 80 75 4 22
6/6/20
08 11:29:07 74
LANE_
01 68 70 4 24
6/6/20
08 11:28:59
LANE_
01 17 76 1 21
6/6/20
08 11:17:51 17
LANE_
01 16 73 1 22
6/6/20
08 11:17:43
LANE_
01 60 77 4 21
6/6/20
08 11:05:49 59
LANE_
01 57 71 3 21
6/6/20
08 11:05:42

159
LANE_
01 22 79 2 21
6/6/20
08 11:10:24 22
LANE_
01 21 80 2 23
6/6/20
08 11:10:16
LANE_
01 71 80 4 21
6/6/20
08 11:16:52 67
LANE_
01 62 71 4 22
6/6/20
08 11:16:44
LANE_
01 47 81 3 21
6/6/20
08 11:36:42 44
LANE_
01 40 69 3 21
6/6/20
08 11:36:34
without PCMS
LANE_
01 18 38 1 27
6/6/20
08 12:11:17 19
LANE_
01 19 52 1 26
6/6/20
08 12:11:12
LANE_
01 19 38 1 25
6/6/20
08 12:11:15 20
LANE_
01 21 49 2 22
6/6/20
08 12:11:10
LANE_
01 21 42 2 22
6/6/20
08 12:03:05 21
LANE_
01 20 47 2 25
6/6/20
08 12:03:00
LANE_
01 18 43 1 29
6/6/20
08 12:11:14 18
LANE_
01 17 51 1 24
6/6/20
08 12:11:08
LANE_
01 20 55 2 29
6/6/20
08 12:09:45 21
LANE_
01 21 59 2 22
6/6/20
08 12:09:38
LANE_
01 70 58 4 22
6/6/20
08 12:07:15 71
LANE_
01 71 61 4 22
6/6/20
08 12:07:08
LANE_
01 18 60 1 22
6/6/20
08 12:06:32 18
LANE_
01 17 54 1 24
6/6/20
08 12:06:25
LANE_
01 17 61 1 25
6/6/20
08 12:03:30 18
LANE_
01 18 63 1 31
6/6/20
08 12:03:23
LANE_
01 18 61 1 29
6/6/20
08 12:12:44 18
LANE_
01 17 61 1 23
6/6/20
08 12:12:37
LANE_
01 19 61 1 23
6/6/20
08 12:12:37 19
LANE_
01 18 60 1 22
6/6/20
08 12:12:30
LANE_
01 80 63 4 28
6/6/20
08 12:14:17 80
LANE_
01 80 65 4 20
6/6/20
08 12:14:09
LANE_
01 17 64 1 27
6/6/20
08 12:16:43 19
LANE_
01 21 73 2 23
6/6/20
08 12:16:36
LANE_
01 20 65 2 19
6/6/20
08 12:04:21 21
LANE_
01 21 68 2 21
6/6/20
08 12:04:13
LANE_
01 18 66 1 22
6/6/20
08 12:15:10 19
LANE_
01 19 69 1 21
6/6/20
08 12:15:02
LANE_
01 19 67 1 22
6/6/20
08 12:02:21 18
LANE_
01 17 65 1 24
6/6/20
08 12:02:13
LANE_
01 20 67 2 23
6/6/20
08 12:01:34 20
LANE_
01 20 65 2 31
6/6/20
08 12:01:26

160
LANE_
01 78 67 4 23
6/6/20
08 12:03:47 79
LANE_
01 79 68 4 25
6/6/20
08 12:03:40
LANE_
01 79 68 4 23
6/6/20
08 12:16:40 78
LANE_
01 77 65 4 20
6/6/20
08 12:16:33
LANE_
01 81 69 4 24
6/6/20
08 12:12:35 81
LANE_
01 81 70 4 21
6/6/20
08 12:12:27
LANE_
01 17 71 1 21
6/6/20
08 12:02:11 17
LANE_
01 16 66 1 25
6/6/20
08 12:02:03
LANE_
01 70 71 4 20
6/6/20
08 12:15:04 68
LANE_
01 66 68 4 20
6/6/20
08 12:14:56
LANE_
01 65 72 4 28
6/6/20
08 12:13:25 66
LANE_
01 67 73 4 24
6/6/20
08 12:13:17
Sensor 1
Avg.
LENG
TH
Sensor 2
LANE LENG
TH
(MP
H)
CLA
SS
RAN
GE
YYY
Y-
MM-
DD
HH:MM:S
S.sss LANE
LENG
TH
(MP
H)
CLA
SS
RAN
GE
YYY
Y-
MM-
DD
HH:MM:S
S.sss
LANE_
01 27 48 2 22
6/9/20
08 13:46:12 26
LANE_
01 24 29 2 22
6/9/20
08 13:46:04
LANE_
01 20 55 2 20
6/9/20
08 13:49:52 21
LANE_
01 22 53 2 21
6/9/20
08 13:49:40
LANE_
01 19 56 1 21
6/9/20
08 14:17:19 18
LANE_
01 17 49 1 21
6/9/20
08 14:17:07
LANE_
01 18 58 1 22
6/9/20
08 13:50:35 19
LANE_
01 20 44 2 19
6/9/20
08 13:52:11
LANE_
01 20 60 2 23
6/9/20
08 14:17:41 20
LANE_
01 20 66 2 20
6/9/20
08 14:17:28
LANE_
01 27 62 2 21
6/9/20
08 13:47:27 26
LANE_
01 25 53 2 20
6/9/20
08 13:47:15
LANE_
01 19 64 1 22
6/9/20
08 14:17:15 18
LANE_
01 17 52 1 20
6/9/20
08 14:17:03
LANE_
01 20 66 2 21
6/9/20
08 14:21:58 19
LANE_
01 17 53 1 20
6/9/20
08 14:21:46
LANE_
01 46 66 3 22
6/9/20
08 14:15:17 47
LANE_
01 48 67 3 20
6/9/20
08 14:15:04

161
Sensor 1 Avg.
LENG
TH
Sensor 2
LANE LENG
TH
(MP
H)
CLA
SS
RAN
GE
YYYY
-MM-
DD
HH:MM:S
S.sss LANE
LENG
TH
(MP
H)
CLA
SS
RAN
GE
YYYY
-MM-
DD
HH:MM:S
S.sss
LANE
_01 22 38 2 20
6/10/20
08 14:52:45 21
LANE
_01 20 37 2 24
6/10/20
08 52:05.2
LANE
_01 22 38 2 22
6/10/20
08 14:45:01 22
LANE
_01 22 38 2 22
6/10/20
08 44:50.2
LANE
_01 74 38 4 17
6/10/20
08 10:11:09 72
LANE
_01 70 38 4 18
6/10/20
08 10:57.4
LANE
_01 17 39 1 18
6/10/20
08 11:35:51 17
LANE
_01 17 38 1 19
6/10/20
08 35:39.1
LANE
_01 20 40 2 20
6/10/20
08 10:55:24 20
LANE
_01 20 40 2 22
6/10/20
08 55:12.1
LANE
_01 47 40 3 19
6/10/20
08 11:35:53 47
LANE
_01 46 41 3 22
6/10/20
08 35:41.0
LANE
_01 20 41 2 20
6/10/20
08 11:03:17 19
LANE
_01 18 39 1 22
6/10/20
08 03:05.2
LANE
_01 16 42 1 21
6/10/20
08 10:57:30 16
LANE
_01 16 42 1 22
6/10/20
08 57:17.3
LANE
_01 18 42 1 23
6/10/20
08 11:21:21 18
LANE
_01 17 44 1 25
6/10/20
08 21:09.0
LANE
_01 19 43 1 23
6/10/20
08 14:46:42 19
LANE
_01 19 40 1 23
6/10/20
08 46:29.2
LANE
_01 19 43 1 22
6/10/20
08 14:45:14 20
LANE
_01 21 49 2 23
6/10/20
08 45:01.1
LANE
_01 18 44 1 22
6/10/20
08 15:05:09 18
LANE
_01 18 40 1 23
6/10/20
08 04:57.1
LANE
_01 25 44 2 19
6/10/20
08 15:01:32 25
LANE
_01 24 41 2 21
6/10/20
08 01:19.2
LANE
_01 46 44 3 20
6/10/20
08 11:22:02 46
LANE
_01 46 36 3 21
6/10/20
08 21:50.2
LANE
_01 66 44 4 19
6/10/20
08 11:07:18 67
LANE
_01 68 41 4 24
6/10/20
08 07:05.3
LANE
_01 79 44 4 20
6/10/20
08 11:03:47 76
LANE
_01 73 47 4 21
6/10/20
08 03:34.2
LANE 11 45 1 24 6/10/20 14:56:18 12 LANE 12 43 1 25 6/10/20 56:05.1

162
_01 08 _01 08
LANE
_01 20 45 2 22
6/10/20
08 15:00:53 20
LANE
_01 19 44 1 23
6/10/20
08 00:40.1
LANE
_01 23 45 2 18
6/10/20
08 10:29:23 23
LANE
_01 22 47 2 21
6/10/20
08 29:10.3
LANE
_01 18 46 1 22
6/10/20
08 14:52:55 19
LANE
_01 20 31 2 21
6/10/20
08 52:33.4
LANE
_01 21 46 2 19
6/10/20
08 11:45:43 22
LANE
_01 23 43 2 21
6/10/20
08 45:30.3
LANE
_01 19 47 1 20
6/10/20
08 15:03:37 19
LANE
_01 18 45 1 22
6/10/20
08 03:24.2
LANE
_01 23 47 2 21
6/10/20
08 10:40:53 22
LANE
_01 21 38 2 23
6/10/20
08 40:40.4
LANE
_01 22 47 2 20
6/10/20
08 11:03:31 22
LANE
_01 22 51 2 27
6/10/20
08 03:17.2
LANE
_01 22 47 2 22
6/10/20
08 14:52:18 23
LANE
_01 23 47 2 24
6/10/20
08 50:59.3
LANE
_01 26 47 2 21
6/10/20
08 15:03:39 26
LANE
_01 26 42 2 24
6/10/20
08 03:26.3
LANE
_01 18 48 1 22
6/10/20
08 14:49:51 18
LANE
_01 18 11 1 16
6/10/20
08 49:02.4
LANE
_01 17 49 1 20
6/10/20
08 10:34:48 17
LANE
_01 17 46 1 22
6/10/20
08 34:35.2
LANE
_01 17 49 1 22
6/10/20
08 9:12:53 18
LANE
_01 18 47 1 24
6/10/20
08 12:39.3
LANE
_01 18 49 1 22
6/10/20
08 10:56:04 18
LANE
_01 17 46 1 24
6/10/20
08 55:51.0
LANE
_01 21 49 2 20
6/10/20
08 11:23:04 22
LANE
_01 23 49 2 22
6/10/20
08 22:51.2
LANE
_01 25 49 2 20
6/10/20
08 15:04:43 25
LANE
_01 24 47 2 22
6/10/20
08 04:30.1
LANE
_01 33 49 2 21
6/10/20
08 10:57:26 32
LANE
_01 31 47 2 22
6/10/20
08 57:12.3
LANE
_01 49 49 3 19
6/10/20
08 9:16:37 48
LANE
_01 46 35 3 22
6/10/20
08 16:25.3
LANE
_01 82 49 4 20
6/10/20
08 10:16:56 84
LANE
_01 86 51 4 23
6/10/20
08 16:43.3
LANE
_01 18 50 1 20
6/10/20
08 14:56:14 18
LANE
_01 18 47 1 22
6/10/20
08 56:01.1
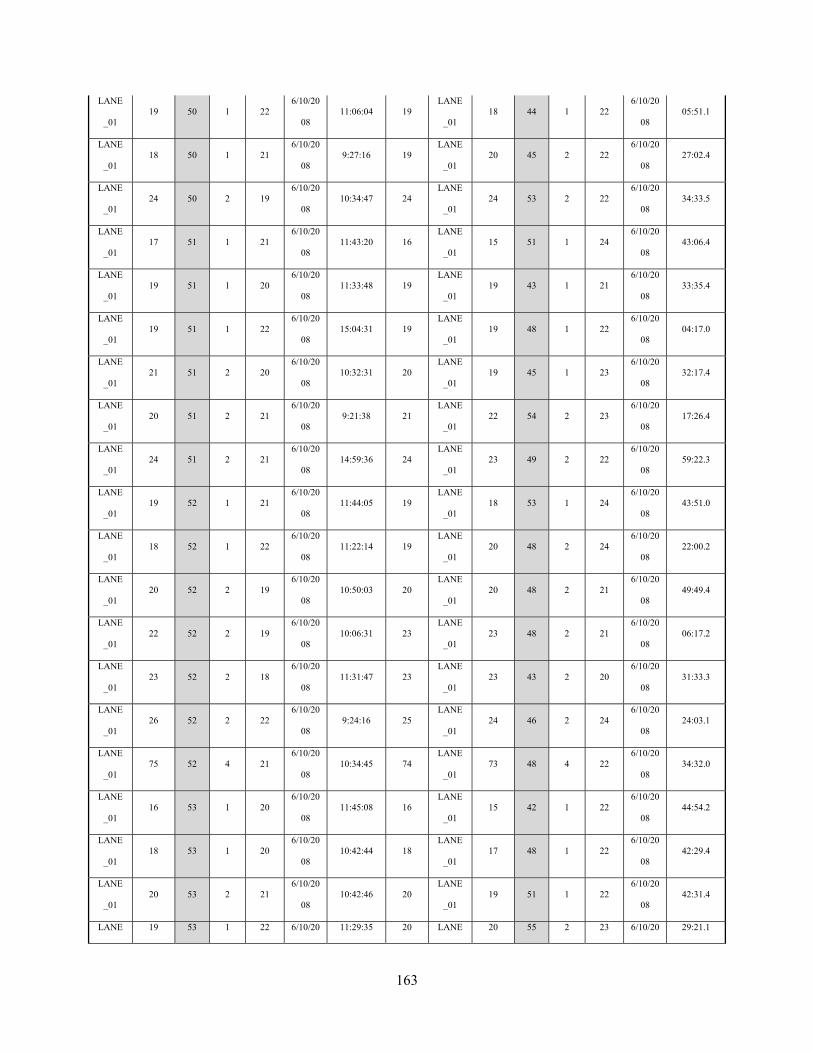
163
LANE
_01 19 50 1 22
6/10/20
08 11:06:04 19
LANE
_01 18 44 1 22
6/10/20
08 05:51.1
LANE
_01 18 50 1 21
6/10/20
08 9:27:16 19
LANE
_01 20 45 2 22
6/10/20
08 27:02.4
LANE
_01 24 50 2 19
6/10/20
08 10:34:47 24
LANE
_01 24 53 2 22
6/10/20
08 34:33.5
LANE
_01 17 51 1 21
6/10/20
08 11:43:20 16
LANE
_01 15 51 1 24
6/10/20
08 43:06.4
LANE
_01 19 51 1 20
6/10/20
08 11:33:48 19
LANE
_01 19 43 1 21
6/10/20
08 33:35.4
LANE
_01 19 51 1 22
6/10/20
08 15:04:31 19
LANE
_01 19 48 1 22
6/10/20
08 04:17.0
LANE
_01 21 51 2 20
6/10/20
08 10:32:31 20
LANE
_01 19 45 1 23
6/10/20
08 32:17.4
LANE
_01 20 51 2 21
6/10/20
08 9:21:38 21
LANE
_01 22 54 2 23
6/10/20
08 17:26.4
LANE
_01 24 51 2 21
6/10/20
08 14:59:36 24
LANE
_01 23 49 2 22
6/10/20
08 59:22.3
LANE
_01 19 52 1 21
6/10/20
08 11:44:05 19
LANE
_01 18 53 1 24
6/10/20
08 43:51.0
LANE
_01 18 52 1 22
6/10/20
08 11:22:14 19
LANE
_01 20 48 2 24
6/10/20
08 22:00.2
LANE
_01 20 52 2 19
6/10/20
08 10:50:03 20
LANE
_01 20 48 2 21
6/10/20
08 49:49.4
LANE
_01 22 52 2 19
6/10/20
08 10:06:31 23
LANE
_01 23 48 2 21
6/10/20
08 06:17.2
LANE
_01 23 52 2 18
6/10/20
08 11:31:47 23
LANE
_01 23 43 2 20
6/10/20
08 31:33.3
LANE
_01 26 52 2 22
6/10/20
08 9:24:16 25
LANE
_01 24 46 2 24
6/10/20
08 24:03.1
LANE
_01 75 52 4 21
6/10/20
08 10:34:45 74
LANE
_01 73 48 4 22
6/10/20
08 34:32.0
LANE
_01 16 53 1 20
6/10/20
08 11:45:08 16
LANE
_01 15 42 1 22
6/10/20
08 44:54.2
LANE
_01 18 53 1 20
6/10/20
08 10:42:44 18
LANE
_01 17 48 1 22
6/10/20
08 42:29.4
LANE
_01 20 53 2 21
6/10/20
08 10:42:46 20
LANE
_01 19 51 1 22
6/10/20
08 42:31.4
LANE 19 53 1 22 6/10/20 11:29:35 20 LANE 20 55 2 23 6/10/20 29:21.1

164
_01 08 _01 08
LANE
_01 20 53 2 21
6/10/20
08 9:12:34 21
LANE
_01 21 45 2 23
6/10/20
08 12:20.1
LANE
_01 24 53 2 19
6/10/20
08 10:50:05 24
LANE
_01 24 48 2 21
6/10/20
08 49:51.1
LANE
_01 26 53 2 22
6/10/20
08 14:42:38 26
LANE
_01 25 52 2 22
6/10/20
08 42:23.4
LANE
_01 20 54 2 20
6/10/20
08 10:03:53 21
LANE
_01 21 55 2 22
6/10/20
08 03:39.2
LANE
_01 23 54 2 20
6/10/20
08 10:07:20 23
LANE
_01 23 52 2 21
6/10/20
08 07:06.1
LANE
_01 53 54 3 18
6/10/20
08 11:31:26 54
LANE
_01 54 52 3 21
6/10/20
08 31:12.5
LANE
_01 19 55 1 21
6/10/20
08 14:59:12 18
LANE
_01 17 49 1 24
6/10/20
08 58:57.4
LANE
_01 19 55 1 22
6/10/20
08 9:17:05 19
LANE
_01 19 49 1 24
6/10/20
08 16:51.0
LANE
_01 20 55 2 20
6/10/20
08 10:31:36 20
LANE
_01 19 47 1 22
6/10/20
08 31:22.3
LANE
_01 21 55 2 20
6/10/20
08 10:06:15 21
LANE
_01 20 52 2 22
6/10/20
08 06:01.3
LANE
_01 23 55 2 22
6/10/20
08 14:51:13 21
LANE
_01 19 52 1 25
6/10/20
08 50:52.1
LANE
_01 28 55 2 19
6/10/20
08 10:36:21 28
LANE
_01 27 51 2 21
6/10/20
08 36:07.2
LANE
_01 18 56 1 22
6/10/20
08 11:02:47 18
LANE
_01 18 57 1 24
6/10/20
08 02:32.3
LANE
_01 18 56 1 21
6/10/20
08 10:07:17 19
LANE
_01 20 59 2 21
6/10/20
08 07:03.2
LANE
_01 19 56 1 23
6/10/20
08 11:07:48 19
LANE
_01 19 50 1 25
6/10/20
08 07:33.4
LANE
_01 23 56 2 18
6/10/20
08 10:51:45 24
LANE
_01 25 56 2 21
6/10/20
08 51:30.3
LANE
_01 43 56 3 18
6/10/20
08 10:36:19 46
LANE
_01 48 60 3 19
6/10/20
08 36:05.1
LANE
_01 19 57 1 19
6/10/20
08 10:51:06 19
LANE
_01 18 51 1 22
6/10/20
08 50:52.2
LANE
_01 19 57 1 21
6/10/20
08 10:51:54 19
LANE
_01 18 54 1 23
6/10/20
08 51:40.1

165
LANE
_01 18 57 1 20
6/10/20
08 11:14:16 19
LANE
_01 19 59 1 22
6/10/20
08 14:02.1
LANE
_01 19 57 1 21
6/10/20
08 11:36:02 20
LANE
_01 20 55 2 22
6/10/20
08 35:47.4
LANE
_01 20 57 2 22
6/10/20
08 14:51:06 20
LANE
_01 20 49 2 23
6/10/20
08 49:38.1
LANE
_01 22 57 2 20
6/10/20
08 10:19:51 22
LANE
_01 22 56 2 23
6/10/20
08 19:36.2
LANE
_01 17 58 1 21
6/10/20
08 9:36:36 17
LANE
_01 17 56 1 23
6/10/20
08 36:21.5
LANE
_01 17 58 1 22
6/10/20
08 10:46:58 17
LANE
_01 17 52 1 25
6/10/20
08 46:44.2
LANE
_01 18 58 1 20
6/10/20
08 9:12:01 18
LANE
_01 17 59 1 24
6/10/20
08 11:55.0
LANE
_01 17 58 1 21
6/10/20
08 11:16:11 18
LANE
_01 18 56 1 22
6/10/20
08 15:56.4
LANE
_01 19 58 1 21
6/10/20
08 10:54:17 20
LANE
_01 20 55 2 22
6/10/20
08 54:02.4
LANE
_01 19 58 1 20
6/10/20
08 11:29:22 20
LANE
_01 20 60 2 22
6/10/20
08 29:07.4
LANE
_01 22 58 2 21
6/10/20
08 10:57:47 21
LANE
_01 20 49 2 23
6/10/20
08 57:33.0
LANE
_01 21 58 2 19
6/10/20
08 11:16:43 22
LANE
_01 23 57 2 22
6/10/20
08 16:28.3
LANE
_01 43 58 3 21
6/10/20
08 10:08:00 46
LANE
_01 48 54 3 23
6/10/20
08 07:45.4
LANE
_01 46 58 3 22
6/10/20
08 10:56:54 52
LANE
_01 58 87 3 23
6/10/20
08 56:39.5
LANE
_01 17 59 1 22
6/10/20
08 11:21:25 18
LANE
_01 19 55 1 23
6/10/20
08 21:10.3
LANE
_01 20 59 2 21
6/10/20
08 14:48:48 20
LANE
_01 20 60 2 24
6/10/20
08 48:33.3
LANE
_01 68 59 4 20
6/10/20
08 14:58:28 65
LANE
_01 61 40 4 22
6/10/20
08 58:15.0
LANE
_01 11 60 1 24
6/10/20
08 14:58:20 11
LANE
_01 10 35 1 27
6/10/20
08 58:06.2
LANE
_01 18 60 1 21
6/10/20
08 11:44:02 18
LANE
_01 18 64 1 23
6/10/20
08 43:47.4
LANE 19 60 1 19 6/10/20 10:22:41 19 LANE 19 55 1 21 6/10/20 22:26.2

166
_01 08 _01 08
LANE
_01 19 60 1 21
6/10/20
08 11:29:39 19
LANE
_01 19 60 1 23
6/10/20
08 29:24.3
LANE
_01 19 60 1 21
6/10/20
08 10:22:42 20
LANE
_01 20 54 2 22
6/10/20
08 22:27.3
LANE
_01 19 60 1 21
6/10/20
08 11:44:00 20
LANE
_01 20 60 2 23
6/10/20
08 43:45.3
LANE
_01 21 60 2 21
6/10/20
08 15:01:14 21
LANE
_01 20 58 2 24
6/10/20
08 00:59.0
LANE
_01 21 60 2 21
6/10/20
08 11:12:07 21
LANE
_01 21 65 2 22
6/10/20
08 11:52.1
LANE
_01 22 60 2 21
6/10/20
08 11:38:58 22
LANE
_01 22 55 2 22
6/10/20
08 38:43.5
LANE
_01 19 61 1 21
6/10/20
08 11:09:03 19
LANE
_01 18 57 1 23
6/10/20
08 08:48.1
LANE
_01 19 61 1 20
6/10/20
08 11:12:08 19
LANE
_01 19 62 1 21
6/10/20
08 11:53.1
LANE
_01 22 61 2 20
6/10/20
08 11:29:16 22
LANE
_01 21 59 2 23
6/10/20
08 29:01.4
LANE
_01 16 62 1 19
6/10/20
08 11:27:33 17
LANE
_01 18 64 1 21
6/10/20
08 27:17.5
LANE
_01 19 62 1 20
6/10/20
08 10:29:50 20
LANE
_01 20 58 2 21
6/10/20
08 29:34.4
LANE
_01 20 62 2 25
6/10/20
08 14:46:06 20
LANE
_01 20 61 2 23
6/10/20
08 45:50.4
LANE
_01 19 62 1 21
6/10/20
08 10:53:24 21
LANE
_01 22 70 2 22
6/10/20
08 53:09.1
LANE
_01 21 62 2 22
6/10/20
08 11:27:47 21
LANE
_01 20 58 2 24
6/10/20
08 27:32.2
LANE
_01 23 62 2 19
6/10/20
08 10:26:02 23
LANE
_01 23 62 2 21
6/10/20
08 25:47.3
LANE
_01 32 62 2 17
6/10/20
08 11:18:43 33
LANE
_01 34 66 2 19
6/10/20
08 18:28.1
LANE
_01 42 62 3 21
6/10/20
08 11:35:22 42
LANE
_01 42 61 3 20
6/10/20
08 35:07.3
LANE
_01 17 63 1 20
6/10/20
08 10:49:58 17
LANE
_01 17 59 1 22
6/10/20
08 49:43.3
LANE
_01 18 63 1 21
6/10/20
08 9:26:04 18
LANE
_01 18 62 1 23
6/10/20
08 25:49.0

167
LANE
_01 19 63 1 22
6/10/20
08 9:26:39 19
LANE
_01 18 52 1 21
6/10/20
08 26:25.2
LANE
_01 19 63 1 21
6/10/20
08 11:38:19 19
LANE
_01 18 61 1 22
6/10/20
08 38:03.3
LANE
_01 19 63 1 20
6/10/20
08 14:55:40 19
LANE
_01 18 40 1 22
6/10/20
08 52:42.3
LANE
_01 19 63 1 21
6/10/20
08 10:52:13 19
LANE
_01 19 60 1 23
6/10/20
08 51:58.0
LANE
_01 18 63 1 19
6/10/20
08 11:25:33 19
LANE
_01 20 64 2 22
6/10/20
08 25:18.1
LANE
_01 22 63 2 20
6/10/20
08 11:40:57 23
LANE
_01 23 67 2 22
6/10/20
08 40:42.2
LANE
_01 35 63 2 19
6/10/20
08 10:30:43 37
LANE
_01 38 67 2 21
6/10/20
08 30:28.4
LANE
_01 40 63 3 23
6/10/20
08 11:12:48 41
LANE
_01 42 62 3 24
6/10/20
08 12:33.2
LANE
_01 17 64 1 18
6/10/20
08 10:23:11 17
LANE
_01 17 61 1 21
6/10/20
08 22:55.4
LANE
_01 17 64 1 20
6/10/20
08 10:52:57 19
LANE
_01 21 69 2 23
6/10/20
08 52:41.4
LANE
_01 21 64 2 21
6/10/20
08 9:22:06 21
LANE
_01 21 60 2 22
6/10/20
08 21:51.1
LANE
_01 23 64 2 21
6/10/20
08 11:09:52 23
LANE
_01 22 59 2 22
6/10/20
08 09:37.0
LANE
_01 33 64 2 17
6/10/20
08 10:20:27 31
LANE
_01 29 59 2 21
6/10/20
08 20:12.3
LANE
_01 39 64 2 20
6/10/20
08 10:45:10 40
LANE
_01 41 64 3 23
6/10/20
08 44:55.4
LANE
_01 19 65 1 21
6/10/20
08 10:30:12 19
LANE
_01 19 70 1 24
6/10/20
08 29:57.1
LANE
_01 18 66 1 22
6/10/20
08 11:07:56 18
LANE
_01 18 62 1 25
6/10/20
08 07:40.3
LANE
_01 19 66 1 21
6/10/20
08 9:27:53 19
LANE
_01 19 49 1 23
6/10/20
08 27:38.2
LANE
_01 19 66 1 20
6/10/20
08 11:32:14 19
LANE
_01 19 68 1 22
6/10/20
08 31:59.1
LANE
_01 21 66 2 21
6/10/20
08 11:40:09 21
LANE
_01 20 67 2 25
6/10/20
08 39:53.2
LANE 67 66 4 18 6/10/20 11:38:17 67 LANE 67 64 4 20 6/10/20 38:02.3

168
_01 08 _01 08
LANE
_01 65 66 4 23
6/10/20
08 11:36:48 68
LANE
_01 70 67 4 23
6/10/20
08 36:33.3
LANE
_01 18 67 1 18
6/10/20
08 10:43:10 17
LANE
_01 16 58 1 21
6/10/20
08 42:55.2
LANE
_01 18 67 1 23
6/10/20
08 11:10:14 18
LANE
_01 17 61 1 20
6/10/20
08 09:58.4
LANE
_01 20 67 2 20
6/10/20
08 11:10:16 20
LANE
_01 20 61 2 22
6/10/20
08 10:00.4
LANE
_01 25 67 2 20
6/10/20
08 10:10:34 26
LANE
_01 26 72 2 21
6/10/20
08 10:18.4
LANE
_01 79 67 4 18
6/10/20
08 10:53:32 81
LANE
_01 83 68 4 21
6/10/20
08 53:16.5
LANE
_01 20 68 2 20
6/10/20
08 11:09:19 20
LANE
_01 20 71 2 24
6/10/20
08 09:03.4
LANE
_01 23 68 2 20
6/10/20
08 14:58:01 23
LANE
_01 22 64 2 21
6/10/20
08 57:45.2
LANE
_01 25 68 2 21
6/10/20
08 10:53:50 26
LANE
_01 27 72 2 23
6/10/20
08 53:35.1
LANE
_01 18 74 1 22
6/10/20
08 10:14:03 18
LANE
_01 17 67 1 22
6/10/20
08 13:48.1

169
Sensor 1 Avg.
LENG
TH
Sensor 2
LANE LENG
TH
(MP
H)
CLA
SS
RAN
GE
YYYY
-MM-
DD
HH:MM:S
S.sss LANE
LENG
TH
(MP
H)
CLA
SS
RAN
GE
YYYY
-MM-
DD
HH:MM:S
S.sss
LANE
_01 15 15 1 20
6/13/20
08 11:17:56 16
LANE
_01 17 24 1 18
6/13/20
08 11:17:44
LANE
_01 27 19 2 19
6/13/20
08 12:36:39 21
LANE
_01 14 9 1 16
6/13/20
08 12:36:29
LANE
_01 17 27 1 19
6/13/20
08 12:46:00 19
LANE
_01 21 38 2 18
6/13/20
08 12:45:42
LANE
_01 19 31 1 18
6/13/20
08 11:11:58 19
LANE
_01 18 37 1 18
6/13/20
08 11:11:41
LANE
_01 21 31 2 20
6/13/20
08 11:15:29 20
LANE
_01 18 31 1 17
6/13/20
08 11:15:14
LANE
_01 22 32 2 22
6/13/20
08 11:53:22 20
LANE
_01 18 36 1 19
6/13/20
08 11:53:06
LANE
_01 17 34 1 20
6/13/20
08 11:02:09 18
LANE
_01 19 31 1 19
6/13/20
08 11:01:52
LANE
_01 18 34 1 18
6/13/20
08 11:11:54 19
LANE
_01 19 38 1 17
6/13/20
08 11:11:37
LANE
_01 23 35 2 20
6/13/20
08 10:45:09 24
LANE
_01 24 36 2 17
6/13/20
08 10:44:52
LANE
_01 51 35 3 16
6/13/20
08 10:59:46 51
LANE
_01 51 33 3 22
6/13/20
08 10:59:30
LANE
_01 16 36 1 20
6/13/20
08 12:45:58 16
LANE
_01 15 41 1 17
6/13/20
08 12:45:39
LANE
_01 20 36 2 19
6/13/20
08 12:45:14 21
LANE
_01 22 38 2 18
6/13/20
08 12:44:57
LANE
_01 30 36 2 19
6/13/20
08 10:47:39 30
LANE
_01 30 32 2 18
6/13/20
08 10:47:24
LANE
_01 14 37 1 21
6/13/20
08 10:17:56 17
LANE
_01 19 43 1 20
6/13/20
08 10:17:37
LANE
_01 19 37 1 17
6/13/20
08 10:58:45 20
LANE
_01 21 39 2 16
6/13/20
08 10:58:27
LANE
_01 19 37 1 18
6/13/20
08 13:03:02 20
LANE
_01 21 45 2 20
6/13/20
08 13:02:43
LANE 17 38 1 21 6/13/20 9:56:21 17 LANE 16 32 1 20 6/13/20 9:56:05

170
_01 08 _01 08
LANE
_01 16 38 1 20
6/13/20
08 12:53:08 17
LANE
_01 18 39 1 17
6/13/20
08 12:52:51
LANE
_01 18 38 1 17
6/13/20
08 11:36:57 18
LANE
_01 17 38 1 17
6/13/20
08 11:36:39
LANE
_01 21 38 2 20
6/13/20
08 12:54:26 21
LANE
_01 21 37 2 18
6/13/20
08 12:54:08
LANE
_01 17 39 1 19
6/13/20
08 11:35:55 17
LANE
_01 17 51 1 17
6/13/20
08 11:35:36
LANE
_01 22 39 2 22
6/13/20
08 11:52:29 20
LANE
_01 18 36 1 19
6/13/20
08 11:52:13
LANE
_01 20 39 2 23
6/13/20
08 11:38:54 21
LANE
_01 22 41 2 17
6/13/20
08 11:38:35
LANE
_01 63 39 4 18
6/13/20
08 10:18:21 70
LANE
_01 76 47 4 16
6/13/20
08 10:18:02
LANE
_01 17 40 1 22
6/13/20
08 10:43:07 17
LANE
_01 16 39 1 18
6/13/20
08 10:42:49
LANE
_01 19 41 1 19
6/13/20
08 12:52:00 21
LANE
_01 22 46 2 18
6/13/20
08 12:51:41
LANE
_01 14 42 1 20
6/13/20
08 12:09:40 15
LANE
_01 16 43 1 19
6/13/20
08 12:09:20
LANE
_01 52 42 3 18
6/13/20
08 12:03:19 50
LANE
_01 48 36 3 16
6/13/20
08 12:03:02
LANE
_01 16 43 1 21
6/13/20
08 12:03:34 17
LANE
_01 17 33 1 19
6/13/20
08 12:03:17
LANE
_01 17 43 1 21
6/13/20
08 11:30:30 18
LANE
_01 18 42 1 19
6/13/20
08 11:30:11
LANE
_01 18 43 1 20
6/13/20
08 11:11:48 18
LANE
_01 18 38 1 18
6/13/20
08 11:11:30
LANE
_01 19 43 1 19
6/13/20
08 11:44:39 18
LANE
_01 17 36 1 17
6/13/20
08 11:44:21
LANE
_01 19 43 1 20
6/13/20
08 13:08:48 18
LANE
_01 17 39 1 20
6/13/20
08 13:08:29
LANE
_01 19 43 1 19
6/13/20
08 11:08:38 19
LANE
_01 19 34 1 18
6/13/20
08 11:08:20
LANE
_01 21 43 2 21
6/13/20
08 11:51:19 20
LANE
_01 19 34 1 19
6/13/20
08 11:51:02
LANE
_01 23 43 2 20
6/13/20
08 12:57:06 23
LANE
_01 23 43 2 18
6/13/20
08 12:56:47

171
LANE
_01 18 44 1 19
6/13/20
08 12:15:42 19
LANE
_01 19 35 1 19
6/13/20
08 12:15:23
LANE
_01 18 44 1 19
6/13/20
08 11:37:14 19
LANE
_01 20 48 2 18
6/13/20
08 11:36:54
LANE
_01 20 44 2 20
6/13/20
08 11:13:15 20
LANE
_01 19 36 1 19
6/13/20
08 11:12:58
LANE
_01 23 44 2 21
6/13/20
08 10:43:09 22
LANE
_01 20 39 2 16
6/13/20
08 10:42:51
LANE
_01 23 44 2 23
6/13/20
08 13:46:59 23
LANE
_01 23 46 2 20
6/13/20
08 13:46:40
LANE
_01 17 45 1 21
6/13/20
08 10:40:29 17
LANE
_01 16 51 1 18
6/13/20
08 10:40:09
LANE
_01 19 45 1 20
6/13/20
08 13:03:49 19
LANE
_01 19 41 1 20
6/13/20
08 13:03:30
LANE
_01 20 45 2 20
6/13/20
08 12:24:19 21
LANE
_01 21 43 2 19
6/13/20
08 12:24:00
LANE
_01 21 45 2 21
6/13/20
08 13:16:21 22
LANE
_01 23 46 2 20
6/13/20
08 13:16:01
LANE
_01 17 46 1 20
6/13/20
08 11:46:05 18
LANE
_01 18 44 1 19
6/13/20
08 11:45:46
LANE
_01 18 46 1 21
6/13/20
08 11:27:16 18
LANE
_01 18 44 1 19
6/13/20
08 11:26:57
LANE
_01 19 46 1 18
6/13/20
08 11:37:35 19
LANE
_01 18 43 1 18
6/13/20
08 11:37:16
LANE
_01 17 47 1 21
6/13/20
08 10:42:10 17
LANE
_01 16 50 1 18
6/13/20
08 10:41:50
LANE
_01 18 47 1 21
6/13/20
08 10:49:03 19
LANE
_01 19 38 1 20
6/13/20
08 10:48:44
LANE
_01 19 47 1 18
6/13/20
08 10:57:14 19
LANE
_01 18 41 1 17
6/13/20
08 10:56:55
LANE
_01 19 47 1 22
6/13/20
08 13:49:37 19
LANE
_01 19 47 1 20
6/13/20
08 13:49:18
LANE
_01 20 47 2 21
6/13/20
08 11:16:19 20
LANE
_01 20 49 2 17
6/13/20
08 11:15:59
LANE
_01 20 47 2 17
6/13/20
08 11:48:45 21
LANE
_01 21 41 2 18
6/13/20
08 11:48:26
LANE
_01 22 47 2 18
6/13/20
08 11:03:22 21
LANE
_01 20 34 2 16
6/13/20
08 11:03:05
LANE 22 47 2 20 6/13/20 11:37:12 22 LANE 21 49 2 18 6/13/20 11:36:53

172
_01 08 _01 08
LANE
_01 19 48 1 20
6/13/20
08 11:10:59 18
LANE
_01 17 49 1 17
6/13/20
08 11:10:40
LANE
_01 19 48 1 21
6/13/20
08 11:42:14 19
LANE
_01 19 38 1 20
6/13/20
08 11:41:55
LANE
_01 21 48 2 17
6/13/20
08 12:06:49 20
LANE
_01 18 43 1 18
6/13/20
08 12:06:30
LANE
_01 21 48 2 19
6/13/20
08 10:52:14 21
LANE
_01 21 37 2 18
6/13/20
08 10:51:56
LANE
_01 22 48 2 18
6/13/20
08 11:20:47 22
LANE
_01 21 47 2 16
6/13/20
08 11:20:28
LANE
_01 22 48 2 22
6/13/20
08 13:46:00 22
LANE
_01 21 52 2 19
6/13/20
08 13:45:40
LANE
_01 24 48 2 19
6/13/20
08 11:13:19 24
LANE
_01 24 40 2 17
6/13/20
08 11:13:01
LANE
_01 35 48 2 18
6/13/20
08 10:18:15 34
LANE
_01 33 44 2 16
6/13/20
08 10:17:56
LANE
_01 42 48 3 18
6/13/20
08 13:04:56 42
LANE
_01 41 49 3 17
6/13/20
08 13:04:36
LANE
_01 63 48 4 19
6/13/20
08 10:45:31 75
LANE
_01 87 69 4 15
6/13/20
08 10:45:10
LANE
_01 16 49 1 20
6/13/20
08 10:55:17 15
LANE
_01 14 41 1 19
6/13/20
08 10:54:59
LANE
_01 19 49 1 20
6/13/20
08 11:31:28 18
LANE
_01 17 40 1 17
6/13/20
08 11:31:09
LANE
_01 20 49 2 21
6/13/20
08 12:57:09 19
LANE
_01 17 42 1 18
6/13/20
08 12:56:50
LANE
_01 18 49 1 19
6/13/20
08 13:02:01 19
LANE
_01 19 41 1 17
6/13/20
08 13:01:41
LANE
_01 21 49 2 17
6/13/20
08 10:56:57 20
LANE
_01 19 41 1 17
6/13/20
08 10:56:38
LANE
_01 22 49 2 17
6/13/20
08 11:40:14 22
LANE
_01 21 50 2 17
6/13/20
08 11:39:54
LANE
_01 22 49 2 19
6/13/20
08 10:42:38 22
LANE
_01 22 52 2 18
6/13/20
08 10:42:19
LANE
_01 66 49 4 21
6/13/20
08 12:39:13 70
LANE
_01 73 55 4 16
6/13/20
08 12:38:53
LANE
_01 17 50 1 20
6/13/20
08 13:16:50 17
LANE
_01 17 45 1 20
6/13/20
08 13:16:31

173
LANE
_01 18 50 1 22
6/13/20
08 12:26:37 18
LANE
_01 18 48 1 17
6/13/20
08 12:26:17
LANE
_01 21 50 2 18
6/13/20
08 10:48:26 19
LANE
_01 17 31 1 18
6/13/20
08 10:48:09
LANE
_01 22 50 2 17
6/13/20
08 10:54:46 23
LANE
_01 23 48 2 18
6/13/20
08 10:54:27
LANE
_01 76 50 4 21
6/13/20
08 11:51:25 76
LANE
_01 76 41 4 20
6/13/20
08 11:51:06
LANE
_01 16 51 1 21
6/13/20
08 12:15:48 16
LANE
_01 15 37 1 18
6/13/20
08 12:15:30
LANE
_01 16 51 1 19
6/13/20
08 12:10:27 17
LANE
_01 17 49 1 17
6/13/20
08 12:10:07
LANE
_01 19 51 1 16
6/13/20
08 12:15:12 19
LANE
_01 19 34 1 18
6/13/20
08 12:15:06
LANE
_01 19 51 1 20
6/13/20
08 12:27:07 20
LANE
_01 20 51 2 17
6/13/20
08 12:26:46
LANE
_01 22 51 2 18
6/13/20
08 11:43:03 22
LANE
_01 21 46 2 18
6/13/20
08 11:42:44
LANE
_01 21 51 2 21
6/13/20
08 12:00:20 22
LANE
_01 22 50 2 17
6/13/20
08 12:00:00
LANE
_01 41 51 3 19
6/13/20
08 10:53:20 39
LANE
_01 36 40 2 17
6/13/20
08 10:53:01
LANE
_01 71 51 4 19
6/13/20
08 11:55:38 69
LANE
_01 67 47 4 15
6/13/20
08 11:55:19
LANE
_01 16 52 1 19
6/13/20
08 12:26:20 16
LANE
_01 15 55 1 16
6/13/20
08 12:25:59
LANE
_01 17 52 1 20
6/13/20
08 12:28:45 17
LANE
_01 16 49 1 18
6/13/20
08 12:28:25
LANE
_01 17 52 1 19
6/13/20
08 11:25:39 17
LANE
_01 17 45 1 16
6/13/20
08 11:25:19
LANE
_01 18 52 1 20
6/13/20
08 11:42:15 19
LANE
_01 19 40 1 20
6/13/20
08 11:41:57
LANE
_01 22 52 2 18
6/13/20
08 10:58:00 22
LANE
_01 21 47 2 17
6/13/20
08 10:57:41
LANE
_01 30 52 2 21
6/13/20
08 12:27:34 30
LANE
_01 30 51 2 18
6/13/20
08 12:27:13
LANE
_01 18 53 1 20
6/13/20
08 12:15:24 18
LANE
_01 18 39 1 19
6/13/20
08 12:15:13
LANE 20 53 2 19 6/13/20 11:36:07 20 LANE 20 54 2 18 6/13/20 11:35:47

174
_01 08 _01 08
LANE
_01 21 53 2 22
6/13/20
08 12:00:03 20
LANE
_01 19 40 1 19
6/13/20
08 11:59:45
LANE
_01 73 53 4 17
6/13/20
08 9:59:24 75
LANE
_01 76 51 4 15
6/13/20
08 9:59:05
LANE
_01 20 54 2 20
6/13/20
08 13:16:53 20
LANE
_01 19 45 1 19
6/13/20
08 13:16:33
LANE
_01 21 54 2 20
6/13/20
08 11:46:59 20
LANE
_01 19 49 1 17
6/13/20
08 11:46:39
LANE
_01 17 55 1 21
6/13/20
08 12:39:10 16
LANE
_01 14 45 1 18
6/13/20
08 12:38:50
LANE
_01 17 55 1 24
6/13/20
08 11:54:49 17
LANE
_01 16 48 1 20
6/13/20
08 11:54:29
LANE
_01 20 55 2 21
6/13/20
08 11:49:56 19
LANE
_01 18 46 1 19
6/13/20
08 11:49:36
LANE
_01 18 55 1 21
6/13/20
08 13:12:30 19
LANE
_01 20 57 2 21
6/13/20
08 13:12:09
LANE
_01 20 55 2 18
6/13/20
08 11:46:54 20
LANE
_01 19 55 1 16
6/13/20
08 11:46:34
LANE
_01 67 55 4 20
6/13/20
08 11:08:49 71
LANE
_01 74 56 4 15
6/13/20
08 11:08:29
LANE
_01 19 56 1 19
6/13/20
08 11:09:07 17
LANE
_01 15 44 1 18
6/13/20
08 11:08:47
LANE
_01 19 56 1 20
6/13/20
08 12:12:30 18
LANE
_01 17 47 1 19
6/13/20
08 12:12:10
LANE
_01 19 56 1 17
6/13/20
08 12:26:13 18
LANE
_01 17 55 1 17
6/13/20
08 12:25:53
LANE
_01 23 56 2 17
6/13/20
08 10:41:21 19
LANE
_01 14 39 1 16
6/13/20
08 10:41:02
LANE
_01 18 56 1 19
6/13/20
08 10:50:18 19
LANE
_01 19 46 1 18
6/13/20
08 10:49:59
LANE
_01 20 56 2 21
6/13/20
08 11:30:48 19
LANE
_01 18 47 1 20
6/13/20
08 11:30:29
LANE
_01 21 56 2 17
6/13/20
08 11:37:06 20
LANE
_01 19 56 1 16
6/13/20
08 11:36:46
LANE
_01 20 56 2 19
6/13/20
08 12:00:12 21
LANE
_01 21 50 2 18
6/13/20
08 11:59:52
LANE
_01 16 57 1 19
6/13/20
08 12:49:32 16
LANE
_01 15 47 1 17
6/13/20
08 12:49:12

175
LANE
_01 17 57 1 21
6/13/20
08 11:38:26 17
LANE
_01 17 48 1 19
6/13/20
08 11:38:06
LANE
_01 21 57 2 22
6/13/20
08 12:36:31 20
LANE
_01 19 54 1 17
6/13/20
08 12:36:10
LANE
_01 19 58 1 23
6/13/20
08 11:13:55 19
LANE
_01 18 41 1 19
6/13/20
08 11:13:37
LANE
_01 20 58 2 22
6/13/20
08 13:11:20 20
LANE
_01 19 52 1 21
6/13/20
08 13:11:00
LANE
_01 55 58 3 19
6/13/20
08 12:47:32 51
LANE
_01 46 42 3 18
6/13/20
08 12:47:12
LANE
_01 17 59 1 19
6/13/20
08 13:13:42 16
LANE
_01 15 61 1 17
6/13/20
08 13:13:21
LANE
_01 16 59 1 22
6/13/20
08 10:18:34 17
LANE
_01 17 56 1 18
6/13/20
08 10:18:14
LANE
_01 19 59 1 18
6/13/20
08 12:21:36 17
LANE
_01 14 46 1 17
6/13/20
08 12:21:16
LANE
_01 18 60 1 22
6/13/20
08 11:05:53 18
LANE
_01 17 50 1 19
6/13/20
08 11:05:33
LANE
_01 21 60 2 19
6/13/20
08 11:23:52 19
LANE
_01 17 39 1 17
6/13/20
08 11:23:34
LANE
_01 19 60 1 20
6/13/20
08 12:12:37 19
LANE
_01 19 54 1 18
6/13/20
08 12:12:17
LANE
_01 17 61 1 21
6/13/20
08 11:52:40 17
LANE
_01 17 67 1 18
6/13/20
08 11:52:19
LANE
_01 21 61 2 21
6/13/20
08 12:15:32 20
LANE
_01 18 25 1 13
6/13/20
08 12:15:17
LANE
_01 18 62 1 21
6/13/20
08 13:11:13 18
LANE
_01 17 53 1 20
6/13/20
08 13:10:52
LANE
_01 21 62 2 21
6/13/20
08 12:01:07 20
LANE
_01 19 57 1 18
6/13/20
08 12:00:46
LANE
_01 22 62 2 19
6/13/20
08 10:52:09 22
LANE
_01 21 53 2 17
6/13/20
08 10:51:48
LANE
_01 17 63 1 20
6/13/20
08 13:07:18 17
LANE
_01 16 53 1 20
6/13/20
08 13:06:58
LANE
_01 16 64 1 21
6/13/20
08 12:07:30 16
LANE
_01 15 63 1 17
6/13/20
08 12:07:09
LANE
_01 19 64 1 20
6/13/20
08 10:57:41 18
LANE
_01 17 61 1 18
6/13/20
08 10:57:20
LANE 80 64 4 22 6/13/20 13:15:03 79 LANE 77 57 4 23 6/13/20 13:14:42

176
_01 08 _01 08
LANE
_01 18 65 1 21
6/13/20
08 11:43:50 17
LANE
_01 16 55 1 20
6/13/20
08 11:43:29
LANE
_01 18 65 1 21
6/13/20
08 12:59:33 18
LANE
_01 18 58 1 18
6/13/20
08 12:59:12
LANE
_01 22 65 2 20
6/13/20
08 12:16:21 21
LANE
_01 19 45 1 17
6/13/20
08 12:16:02
LANE
_01 20 67 2 18
6/13/20
08 12:25:53 18
LANE
_01 16 48 1 18
6/13/20
08 12:25:32
LANE
_01 87 68 4 14
6/13/20
08 10:51:45 82
LANE
_01 76 59 4 16
6/13/20
08 10:51:24
LANE
_01 20 69 2 21
6/13/20
08 12:45:40 19
LANE
_01 18 54 1 18
6/13/20
08 12:45:18
LANE
_01 22 71 2 22
6/13/20
08 11:55:17 21
LANE
_01 19 57 1 19
6/13/20
08 11:54:56
LANE
_01 19 73 1 22
6/13/20
08 12:58:49 18
LANE
_01 17 65 1 18
6/13/20
08 12:58:27
LANE
_01 78 77 4 18
6/13/20
08 10:43:28 70
LANE
_01 62 58 4 15
6/13/20
08 10:43:07
LANE
_01 24 78 2 22
6/13/20
08 10:42:20 21
LANE
_01 17 62 1 20
6/13/20
08 10:41:59

177
Appendix III: Driver Survey Results

178
XSpeed1
MOD
XSpeed2
MOD
OSpeed1
MOD
OSpeed2
MOD
N
o
T
y
p
e
M
/
F
A
g
e
D
H
r
s
X
s
p
e
e
d
X
S
p
e
e
d
1
A
X
S
p
e
e
d
1
B
X
S
p
e
e
d
1
C
X
S
p
e
e
d
1
D
X
S
p
e
e
d
1
E
X
S
p
e
e
d
2
A
X
S
p
e
e
d
2
B
X
S
p
e
e
d
2
C
X
S
p
e
e
d
2
D
X
S
p
e
e
d
2
E
X
s
p
e
e
d
1
X
s
p
e
e
d
2
O
s
p
e
e
d
O
S
p
e
e
d
1
A
O
S
p
e
e
d
1
B
O
S
p
e
e
d
1
C
O
S
p
e
e
d
1
D
O
S
p
e
e
d
1
E
O
S
p
e
e
d
2
A
O
S
p
e
e
d
2
B
O
S
p
e
e
d
2
C
O
S
p
e
e
d
2
D
O
S
p
e
e
d
2
E
O
s
p
e
e
d
1
O
s
p
e
e
d
2
S
i
g
n
P
r
e
f
1
S
i
g
n
P
r
e
f
2
V
i
s
S
i
g
n
1
V
i
s
S
i
g
n
2
V
i
s
S
i
g
n
3
V
i
s
S
i
g
n
4
W
k
Z
A
c
c
W
k
Z
F
t
l
E
n
Y
e
s
1 2 1 3 3 1 1 0 0 0 0 0 1 0 0 0 1 2 1 0 1 0 0 0 0 0 1 0 0 2 3 2 1 0 0 1 0 2 3 1
2 1 0 1 1 0 0 0 0 0 0 0 0 0 0 0 1 0 0 1 0 0 0 0 0 0 1 3 5 2 3 0 0 1 0 2 4 1
3 2 1 2 2 0 0 0 0 0 0 0 0 0 0 0 1 0 0 0 0 1 0 1 0 0 0 5 2 2 3 0 0 1 0 2 1 1
4 1 0 1 1 0 0 0 0 0 0 0 0 0 0 0 1 0 0 1 0 0 0 0 0 0 1 3 5 4 3 1 0 1 0 1 3 1
5 1 0 3 3 0 0 0 0 0 0 0 0 0 0 0 1 0 0 1 0 0 1 0 0 0 0 3 1 1 3 0 0 1 0 3 2 1
6 2 1 3 3 0 0 0 0 0 0 0 0 0 0 0 1 0 1 0 0 0 0 0 1 0 0 2 3 1 2 0 0 1 0 1 3 1
7 1 0 3 3 0 0 0 0 0 0 0 0 0 0 0 1 0 1 0 0 0 0 1 0 0 0 2 2 1 2 0 0 1 0 2 2 1
8 1 0 1 1 1 1 0 0 0 0 0 1 0 0 0 1 2 1 1 0 0 0 0 0 0 0 0 1 1 5 1 3 0 0 1 0 2 4 0
9 4 1 2 3 1 0 1 0 0 0 1 0 0 0 0 2 1 1 0 1 0 0 0 1 0 0 0 0 2 1 1 2 0 0 1 0 2 2 1
1
04 1 2 2 1 0 0 0 1 0 0 0 1 0 0 4 3 1 0 0 0 0 1 1 0 0 0 0 5 1 1 2 0 0 1 0 1 1 1
1
11 1 2 1 0 0 0 0 0 0 0 0 0 0 0 1 0 0 1 0 0 0 1 0 0 0 3 2 1 3 0 0 1 0 1 2 1
1
21 0 2 1 1 1 0 0 0 0 0 1 0 0 0 1 2 1 0 0 0 0 1 0 1 0 0 0 5 2 1 4 0 0 1 0 3 3 1

179
1
31 0 2 1 0 0 0 0 0 0 0 0 0 0 0 1 0 0 0 0 1 0 0 1 0 0 5 3 3 1 0 0 1 0 2 2 1
1
43 1 2 1 1 0 0 1 0 0 0 1 0 0 0 3 2 1 0 1 0 0 0 0 0 1 0 0 2 3 1 3 0 0 1 0 1 1 1
1
55 0 2 1 0 0 0 0 0 0 0 0 0 0 0 1 1 0 0 0 0 0 0 1 0 0 1 3 1 4 0 0 1 0 1 2 1
1
61 0 3 2 0 0 0 0 0 0 0 0 0 0 0 1 0 0 0 0 1 0 1 0 0 0 5 2 1 2 0 0 1 1 3 3 1
1
71 0 2 1 1 1 0 0 0 0 0 1 0 0 0 1 2 1 1 0 0 0 0 0 1 0 0 0 1 2 1 4 0 0 1 0 2 2 0
1
81 0 2 1 1 0 0 1 0 0 0 0 0 0 1 3 5 1 0 0 1 0 0 1 0 0 0 0 3 1 2 3 0 0 1 0 3 2 1
1
95 1 2 1 0 0 0 0 0 0 0 0 0 0 0 1 0 1 0 0 0 0 0 0 1 0 2 4 2 1 0 0 0 1 3 2 1
2
01 0 2 1 0 0 0 0 0 0 0 0 0 0 0 1 0 1 0 0 0 0 0 1 0 0 2 3 1 2 0 0 1 0 1 2 1
2
15 0 2 1 0 0 0 0 0 0 0 0 0 0 0 1 0 1 0 0 0 0 0 0 0 1 2 5 3 1 0 0 1 0 2 3 1
2
21 1 2 1 0 0 0 0 0 0 0 0 0 0 0 1 0 0 0 0 1 0 1 0 0 0 5 2 1 2 1 0 1 0 2 2 1
2
31 1 3 1 0 0 0 0 0 0 0 0 0 0 0 1 0 0 0 0 1 1 0 0 0 0 5 1 3 1 0 0 1 0 1 2 0
2
42 1 2 1 0 0 0 0 0 0 0 0 0 0 0 1 0 0 0 0 1 0 0 1 0 0 5 3 2 1 0 0 1 0 3 4 1
2
51 1 2 1 1 1 0 0 0 0 0 0 1 0 0 1 3 1 0 0 0 1 0 1 0 0 0 0 4 1 1 2 1 0 0 0 2 2 1
2 2 1 2 2 0 0 0 0 0 0 0 0 0 0 0 1 0 0 0 0 1 0 0 0 1 0 5 4 1 2 0 1 1 0 2 2 1
180
6
2
75 1 3 3 1 1 0 0 0 0 0 1 0 0 0 1 2 1 1 0 0 0 0 0 1 0 0 0 1 2 3 1 1 0 1 0 2 2 1
2
82 1 2 2 0 0 0 0 0 0 0 0 0 0 0 1 0 0 1 0 0 1 0 0 0 0 3 1 1 4 1 0 1 0 1 2 1
2
92 1 3 3 0 0 0 0 0 0 0 0 0 0 0 1 0 0 0 1 0 0 1 0 0 0 4 2 1 3 0 0 1 1 3 4 1
3
05 0 1 1 0 0 0 0 0 0 0 0 0 0 0 1 0 1 0 0 0 0 0 1 0 0 2 3 2 3 0 0 1 0 1 4 1
3
11 0 2 1 0 0 0 0 0 0 0 0 0 0 0 1 0 0 0 0 1 0 1 0 0 0 5 2 1 3 0 0 1 0 2 4 0
3
22 1 2 3 0 0 0 0 0 0 0 0 0 0 0 1 0 0 0 1 0 1 0 0 0 0 4 1 3 1 0 0 1 0 4 2 0
3
32 0 2 3 0 0 0 0 0 0 0 0 0 0 0 1 0 0 1 0 0 0 1 0 0 0 3 2 1 2 0 0 1 0 3 4 1
3
41 1 3 3 0 0 0 0 0 0 0 0 0 0 0 1 0 1 0 0 0 0 0 1 0 0 2 3 1 2 0 0 1 0 2 2 1
3
55 0 2 1 0 0 0 0 0 0 0 0 0 0 0 1 0 0 0 0 1 0 1 0 0 0 5 2 1 2 0 0 0 1 4 2 1
3
61 0 2 1 0 0 0 0 0 0 0 0 0 0 0 1 1 0 0 0 0 0 1 0 0 0 1 2 1 2 0 0 1 0 1 2 1
3
72 1 2 3 0 0 0 0 0 0 0 0 0 0 0 1 0 0 1 0 0 0 0 0 0 1 3 5 1 2 1 0 0 0 1 2 1
3
81 1 2 3 0 0 0 0 0 0 0 0 0 0 0 1 0 0 1 0 0 0 0 0 0 1 3 5 2 1 0 0 0 1 2 2 1
3
93 1 3 1 0 0 0 0 0 0 0 0 0 0 0 1 0 0 1 0 0 1 0 0 0 0 3 1 3 1 0 0 1 0 1 2 1

181
4
02 1 2 1 0 0 0 0 0 0 0 0 0 0 0 1 0 1 0 0 0 0 0 0 0 1 2 5 2 3 0 0 1 0 1 2 1
4
12 0 2 1 0 0 0 0 0 0 0 0 0 0 0 1 0 0 0 0 1 0 0 1 0 0 5 3 3 4 0 0 1 0 2 2 1
4
21 0 3 1 0 0 0 0 0 0 0 0 0 0 0 1 0 0 0 0 1 0 0 1 0 0 5 3 2 1 0 0 0 1 2 2 1
4
31 0 3 1 0 0 0 0 0 0 0 0 0 0 0 1 0 1 0 0 0 0 0 1 0 0 2 3 1 3 0 1 1 0 3 4 1
4
42 1 3 1 0 0 0 0 0 0 0 0 0 0 0 1 0 1 0 0 0 0 0 1 0 0 2 3 1 2 0 0 1 0 2 2 0
4
52 1 2 2 0 0 0 0 0 0 0 0 0 0 0 1 0 1 0 0 0 0 0 1 0 0 2 3 1 3 1 0 1 0 2 2 1
4
62 0 2 3 0 0 0 0 0 0 0 0 0 0 0 1 0 1 0 0 0 0 0 1 0 0 2 3 1 1 0 0 1 0 2 2 0
4
72 1 2 2 0 0 0 0 0 0 0 0 0 0 0 1 1 0 0 0 0 0 1 0 0 0 1 2 1 2 0 0 1 0 1 2 1
4
81 0 2 3 0 0 0 0 0 0 0 0 0 0 0 1 0 0 1 0 0 0 1 0 0 0 3 2 1 3 0 0 1 0 2 2 1
4
92 1 2 2 0 0 0 0 0 0 0 0 0 0 0 1 0 0 1 0 0 0 1 0 0 0 3 2 1 4 0 0 1 0 3 4 1
5
01 0 3 3 0 0 0 0 0 0 0 0 0 0 0 1 1 0 0 0 0 0 1 0 0 0 1 2 1 4 0 1 0 0 1 2 1
5
13 1 2 1 1 1 0 0 0 0 0 0 1 0 0 1 3 1 0 1 0 0 0 0 0 1 0 0 2 3 1 4 0 0 1 0 3 2 1
5
22 1 2 3 0 0 0 0 0 0 0 0 0 0 0 1 0 0 1 0 0 0 0 0 0 1 3 5 2 1 0 0 1 0 2 3 1
5 2 1 2 1 0 0 0 0 0 0 0 0 0 0 0 1 0 1 0 0 0 0 0 0 1 0 2 4 1 2 1 0 0 0 2 2 0

182
3
5
41 1 2 1 1 1 0 0 0 0 0 0 1 0 0 1 3 1 0 0 0 0 1 0 1 0 0 0 5 2 1 3 0 0 1 0 1 2 0
5
51 0 1 1 1 0 0 0 1 0 0 0 0 0 1 4 5 1 0 0 0 1 0 0 1 0 0 0 4 2 2 3 0 1 1 0 3 4 1
5
61 1 3 3 1 0 1 0 0 0 1 0 0 0 0 2 1 1 0 1 0 0 0 0 0 0 0 1 2 5 3 1 0 0 0 1 2 2 1
5
74 1 3 2 0 0 0 0 0 0 0 0 0 0 0 1 0 1 0 0 0 0 0 1 0 0 2 3 2 1 1 0 1 0 1 1 0
5
81 1 2 2 1 1 0 0 0 0 0 0 1 0 0 1 3 1 0 1 0 0 0 0 0 1 0 0 2 3 2 1 0 0 1 0 2 2 1
5
91 0 2 1 1 1 0 0 0 0 0 0 0 0 1 1 5 1 0 1 0 0 0 1 0 0 0 0 2 1 1 3 1 1 1 0 3 2 1
6
02 1 2 3 0 0 0 0 0 0 0 0 0 0 0 1 0 0 0 0 1 0 0 1 0 0 5 3 3 1 1 0 1 0 1 2 0
6
11 0 1 1 0 0 0 0 0 0 0 0 0 0 0 1 0 1 0 0 0 0 0 0 0 1 2 5 4 1 0 1 1 0 1 3 1
6
25 1 1 3 1 0 1 0 0 0 1 0 0 0 0 2 1 1 0 0 0 1 0 1 0 0 0 0 4 1 3 4 1 0 1 0 2 3 1
6
31 1 1 3 0 0 0 0 0 0 0 0 0 0 0 1 1 0 0 0 0 0 0 0 0 1 1 5 1 3 1 0 0 0 3 4 1
6
41 1 1 1 0 0 0 0 0 0 0 0 0 0 0 1 0 1 0 0 0 1 0 0 0 0 2 1 1 4 0 0 1 0 4 1 1
6
54 0 3 2 0 0 0 0 0 0 0 0 0 0 0 1 0 1 0 0 0 1 0 0 0 0 2 1 2 1 0 0 1 0 2 2 1
6
62 1 2 1 0 0 0 0 0 0 0 0 0 0 0 1 0 1 0 0 0 1 0 0 0 0 2 1 1 2 0 1 0 0 4 2 1

183
6
72 1 3 3 0 0 0 0 0 0 0 0 0 0 0 1 0 0 1 0 0 1 0 0 0 0 3 1 1 2 1 0 1 0 3 2 0
6
82 1 2 1 0 0 0 0 0 0 0 0 0 0 0 1 0 0 1 0 0 0 1 0 0 0 3 2 2 1 0 0 0 0 2 2 1
6
92 1 2 1 1 1 0 0 0 0 0 0 0 0 1 1 5 1 0 1 0 0 0 0 0 1 0 0 2 3 3 1 0 0 1 0 1 2 0
7
05 1 2 3 0 0 0 0 0 0 0 0 0 0 0 1 0 0 0 0 1 0 1 0 0 0 5 2 3 1 1 0 0 0 1 2 1
7
13 0 2 1 1 1 0 0 0 0 0 1 0 0 0 1 2 1 0 0 1 0 0 1 0 0 0 0 3 1 1 4 0 0 1 0 3 3 1
7
22 1 2 3 1 1 0 0 0 0 0 1 0 0 0 1 2 1 0 0 1 0 0 0 0 0 1 0 3 4 2 3 0 0 1 0 2 4 1
7
32 1 2 3 1 1 0 0 0 0 0 1 0 0 0 1 2 1 0 1 0 0 0 0 0 0 0 1 2 5 2 3 1 0 1 1 2 2 1
7
43 0 1 1 0 0 0 0 0 0 0 0 0 0 0 1 0 0 0 0 1 0 1 0 0 0 5 2 3 2 0 0 1 0 2 4 1
7
51 0 2 1 0 0 0 0 0 0 0 0 0 0 0 1 0 1 0 0 0 1 0 0 0 0 2 1 1 3 0 0 1 0 1 2 1
7
62 1 2 3 0 0 0 0 0 0 0 0 0 0 0 1 0 1 0 0 0 0 0 1 0 0 2 3 1 3 0 1 0 0 1 2 1
7
71 1 3 3 0 0 0 0 0 0 0 0 0 0 0 1 0 1 0 0 0 0 0 1 0 0 2 3 1 2 0 0 1 0 3 4 1
7
81 1 2 2 1 0 0 0 1 0 1 0 0 0 0 4 1 1 0 0 0 1 0 0 1 0 0 0 4 2 2 1 0 0 1 0 1 2 1
7
94 1 3 3 0 0 0 0 0 0 0 0 0 0 0 1 0 0 1 0 0 0 0 0 0 1 3 5 1 2 0 1 0 1 3 4 1
8 5 0 2 1 0 0 0 0 0 0 0 0 0 0 0 1 0 1 0 0 0 0 0 0 0 1 2 5 1 3 1 0 1 0 1 1 1

184
0
8
11 1 3 3 0 0 0 0 0 0 0 0 0 0 0 1 0 0 0 0 1 0 1 0 0 0 5 2 2 4 0 0 1 0 2 3 1
8
21 1 2 1 0 0 0 0 0 0 0 0 0 0 0 1 1 0 0 0 0 0 1 0 0 0 1 2 1 2 0 0 1 0 1 2 0
8
34 0 2 2 0 0 0 0 0 0 0 0 0 0 0 1 0 1 0 0 0 1 0 0 0 0 2 1 1 3 0 0 1 0 2 4 1
8
42 1 1 1 0 0 0 0 0 0 0 0 0 0 0 1 0 1 0 0 0 0 0 0 0 1 2 5 1 4 0 0 1 0 1 4 1
8
51 1 3 1 0 0 0 0 0 0 0 0 0 0 0 1 0 0 0 0 1 1 0 0 0 0 5 1 1 2 1 0 1 0 2 4 1
8
65 0 3 1 0 0 0 0 0 0 0 0 0 0 0 1 0 1 0 0 0 0 0 1 0 0 2 3 4 2 0 0 0 1 2 2 0
8
75 0 2 1 1 1 0 0 0 0 0 0 1 0 0 1 3 1 0 1 0 0 0 0 0 1 0 0 2 3 1 3 1 0 1 0 2 2 1
8
85 1 1 1 1 0 0 0 0 1 1 0 0 0 0 5 1 1 0 0 0 1 0 0 1 0 0 0 4 2 1 2 1 0 1 0 3 1 1
8
92 1 2 2 0 0 0 0 0 0 0 0 0 0 0 1 0 1 0 0 0 0 0 1 0 0 2 3 1 3 1 1 1 1 1 2 1


