
Improvement in Use of Photometric Methods
for Measurement of Birefringence
Indeterminacy in measurement of fractional isochromatic order by goniometric compensation and light sensors may be reduced through a simple procedure
by Gary L. Cloud
ABSTRACT----Visual or graphical determination of iso- chromatic order in photoelastic models is not sufficiently a c c u r a t e for many photoelastic observations. This is especially true in the long-wavelength spectral region where fringe o r d e r s are low and photometric devices must be used for observation. In such cases, some method of fractional-fringe measurement is required. T h e T a r d y a n d S6narmont methods are often chosen for convenience, with preference given to the S6narmont method because of smaller system error. These methods are b a s e d on detection of the analyzer angle at which the light transmitted through the given point in the model is minimum. The experimental problem is poorly condi- tioned, and the procedure is incompatible with nonideal light-sensing apparatus. The equations of the S6nar- mont technique show that the intensity of radiation is an even function of the rotation of the analyzer from the position which produces minimmn intensity. The in- determinacy in the measurement of minimum-intensity angle may be reduced by observing the angles at which the intensity reaches arbitrary values greater than minimum. The average of two such readings on both sides of the minimum-intensi ty angle provides an im- proved measurement of this angle. Best results are obtained if observations are made where the intensity reaches half its maximum value. For a signal-to-noise ratio of 1000, this procedure improves results by a factor of 16. Improvement is greater as S / N is increased.
List of Symbols A = amplitude of electromagnetic wave d = thickness of birefringent model E = electric intensity I = intensity of light
m = relative retardation in wavelengths=isochro- matic order
ms = fraction of a whole isochromatic order m~ = integral isochromatic order
nl, n2 = absolute principal indexes of refraction of bi- refringent plate
no = absolute index of refraction of medium sur- rounding measuring system
t = time v = velocity of electromagnetic wave z = distance along optical path x = wavelength of light 0 = inclination of analyzer of polariscope from
crossed position
Gary L. Cloud is Assistant Professor of Mechanics, Department of Metal- lurgy, Mechanics and Materials Science, Michigan State University, East Lansing, Mich.
Introduction Photoe las t i c obse rva t ions ind ica te d i rec t ly the locus of po in ts where the re la t ive r e t a r d a t i o n in a bire- f r ingen t p l a t e a t t a in s ce r t a in discrete values. T h e re la t ive r e t a r d a t i o n a t po in t s no t on these loci, which are cal led i sochromat ic fringes, m a y be de- t e r m i n e d w i t h accuracy sufficient for m a n y photo- elastic s tud ies by s imple v i sua l in te rpo la t ion . Ac- curacy m a y be grea t ly increased b y us ing refined g raph ica l - in t e rpo la t ion techniques . B u t these me thods are insuff icient where high accuracy is re- quired, where stress levels or stress g rad ien t s in the photoelas t ic mode l are low, where the model mate - rial is of low opt ica l sens i t iv i ty , or where long-wave- l eng th r a d i a t i o n is used in the m e a s u r e m e n t of birefr ingence. I n such cases, the b i ref r ingence m a y be accura te ly de t e rmined b y some m e t h o d of "com- pensa t i on , " or f rac t iona l - f r inge-order m e a s u r e m e n t . These t echn iques are mos t useful when a comple te field plot of the re la t ive r e t a r d a t i o n is no t ava i lab le or is no t desired. Th i s s i t u a t i o n arises, for in- s tance, w h e n point -wise l ight sensors or o ther pho- tomet r ic devices are used to de tec t the presence of l ight or measu re i ts in tens i ty .
Several m e t h o d s of me a su r i ng f rac t iona l f r inge order have been developed. Some of these me thods require t h a t a n auxi l iary device, such as a ca l ib ra ted r e t a rd ing plate , be placed in the opt ical p a t h in l ine wi th the p o i n t in the model a t which the exact rela- t ive r e t a r d a t i o n is to be de te rmined . Tw o other me thods of f rac t iona l - f r inge m e a s u r e m e n t are based on r o t a t i o n of one of the polar iz ing e lements in the opt ical sys tem. These goniomet r ic me thods of c o m p e n s a t i o n have the o u t s t a n d i n g a d v a n t a g e s of s impl ic i ty a n d no r e q u i r e m e n t for special equip- men t . M i n d l i n 1 and Jessop ~ have ana lyzed the er- rors in the two c o m m o n methods , which are bas ica l ly s imilar . Jessop shows t h a t the errors i nhe ren t in the S d n a r m o n t t e c hn i que are a lways smal ler t h a n those of the T a r d y method . Th i s fact seems to be n o t widely apprecia ted, and m a n y in- ves t iga tors use the less accura te m e t h o d wi th the m i s t a k e n n o t i o n t h a t the m e t h o d invo lv ing two q u a r t e r - w a v e pla tes is a lways mos t accurate .
138 I M a r c h 1 9 6 8
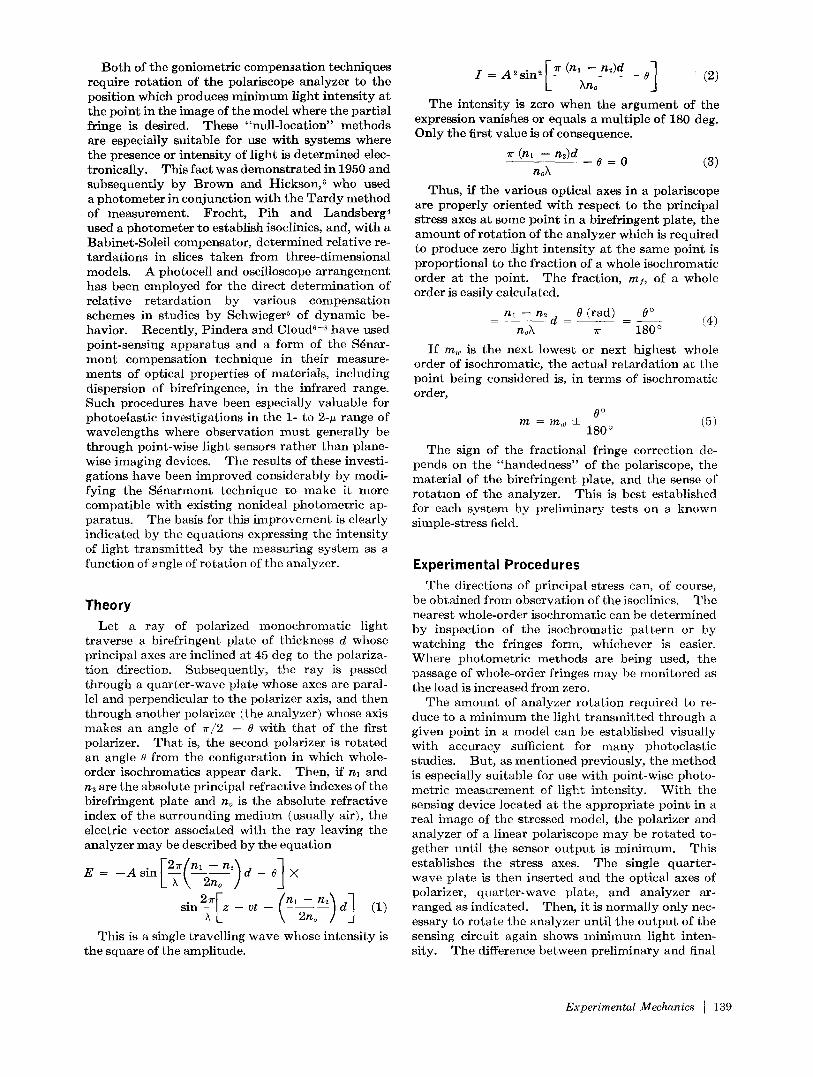
Both of the goniometric compensation techniques require rotat ion of the polariscope analyzer to the position which produces minimum light intensity at the point in the image of the model where the partial fringe is desired. These "null-location" methods are especially suitable for use with systems where the presence or intensity of light is determined elec- tronically. This fact was demonstrated in 1950 and subsequently by Brown and Hickson, 3 who used a photometer in conjunction with the Ta rdy method of measurement. Frocht, Pih and Landsberg 4 used a photometer to establish isoclinlcs, and, with a Babinet-Soleil compensator, determined relative re- tardat ions in slices taken from three-dimensional models. A photocell and oscilloscope arrangement has been employed for the direct determination of relative retardat ion by various compensation schemes in studies by Schwieger 5 of dynamic be- havior. Recently, Pindera and Cloud 6-s have used point-sensing apparatus and a form of the S6nar- mont compensation technique in their measure- ments of optical properties of materials, including dispersion of birefringence, in the infrared range. Such procedures have been especially valuable for photoelastic investigations in the 1- to 2-~ range of wavelengths where observation must generally be through point-wise light sensors rather than plane- wise imaging devices. The results of these investi- gations have been improved considerably by modi- fying the Sdnarmont technique to make it more compatible with existing nonideal photometric ap- paratus. The basis for this improvement is clearly indicated by the equations expressing the intensity of light t ransmit ted by the measuring system as a function of ~ngle of rotat ion of the analyzer.
Theory Let a ray of polarized monochromatic light
traverse a birefringent plate of thickness d whose principal axes are inclined at 45 deg to the polariza- t ion direction. Subsequently, the ray is passed through a quarter-wave plate whose axes are paral- lel and perpendicular to the polarizer axis, and then through another polarizer (the analyzer) whose axis makes an angle of ~/2 - 6 with tha t of the first polarizer. Tha t is, the second polarizer is rotated an angle 0 from the configuration in which whole- order isochromatics appear dark. Then, if nl and n~ are the absolute principal refractive indexes of the birefringent plate and no is the absolute refractive index of the surrounding medium (usually air), the electric vector associated with the ray leaving the analyzer may be described by the equation
E = sin -o] • L X \ 2no ]
s i n a i z - v t - (n~ \ 2no ]-n2~d] (1)
This is a single travelling wave whose intensity is the square of the amplitude.
The intensity is zero when the argument of the expression vanishes or equals a multiple of 180 deg. Only the first value is of consequence.
~r (nl - n~)d 8 = 0 ( 3 )
noh Thus, if the various optical axes in a polariscope
are properly oriented with respect to the principal stress axes at some point in a birefringent plate, the amount of rotat ion of the analyzer which is required to produce zero light intensity at the same point is proportional to the fraction of a whole isochromatic order at the point. The fraction, ml, of a whole order is easily calculated.
nl - - n2 d 0 (rad) 0~ - - - ( 4 ) noh v 180 o
I f m,, is the next lowest or next highest whole order of isochromatic, the actual retardat ion at the point being considered is, in terms of isochromatic order,
0 o m = m ~ • - - ( 5 )
180 ~
The sign of the fractional fringe correction de- pends on the "handedness" of the polariscope, the material of the birefringent plate, and the sense of rotat ion of the analyzer. This is best established for each system by preliminary tests on a known simple-stress field.
Experimental Procedures The directions of principal stress can, of course,
be obtained from observation of the isoclinics. The nearest whole-order isochromatic can be determined by inspection of the isochromatic pat tern or by watching the fringes form, whichever is easier. Where photometr ic methods are being used, the passage of whole-order fringes may be monitored as the load is increased from zero.
The amount of analyzer rotat ion required to re- duce to a minimum the light t ransmit ted through a given point in a model can be established visually with accuracy sufficient for many photoelastic studies. But, as mentioned previously, the method is especially suitable for use with point-wise photo- metric measurement of light intensity. With the sensing device located at the appropriate point in a real image of the stressed model, the polarizer and analyzer of a linear polariscope may be rota ted to- gether until the sensor output is minimum. This establishes the stress axes. The single quarter- wave plate is then inserted and the optical axes of polarizer, quarter-wave plate, and analyzer ar- ranged as indicated. Then, it is normally only nec- essary to rotate the analyzer until the ou tpu t of the sensing circuit again shows minimum light inten- sity. The difference between preliminary and final
Experimental Mechanics I 139
values of analyzer angle indicates directly the frac- tional isochromatic order. Unfortunately, this simple procedure does not yield opt imum results where real photometric systems are used. At a certain loss of simplicity, the technique may be changed to overcome a procedural and system weakness and improve accuracy.
Improvement of the Technique Expression (2) for the light intensity as a function
of the relative retardat ion and inclination of the polarizer from the crossed position may be rewritten in terms of the deviation as:
I = ~A 2 { 1 - cos 2r 7r(n~ - n2)d (6)
A plot of intensity vs. the angular difference of the argument is thus a cosine curve whose amplitude varies between I = 0 and I = A 2. The Sgnarmont null-detection technique reduces to a search for the values of the argument at which the intensity be- comes zero. Otherwise stated, the problem is to determine the angle at which a sine or cosine curve reaches minimum amplitude by observation of the amplitude. Since the slope of such a curve is zero at the minimum, the problem is basically poorly conditioned. The detection of minimum amplitude is further complicated by noise in the intensity de- tection system. In most electronic systems, in- cluding the intensity detection circuit used in the author ' s investigations, a certain small amount of random noise will appear at the output regardless of the signal amplitude. As the signal, in this case the light intensity, is reduced in magnitude, it will dip below the noise level and become undetectable at
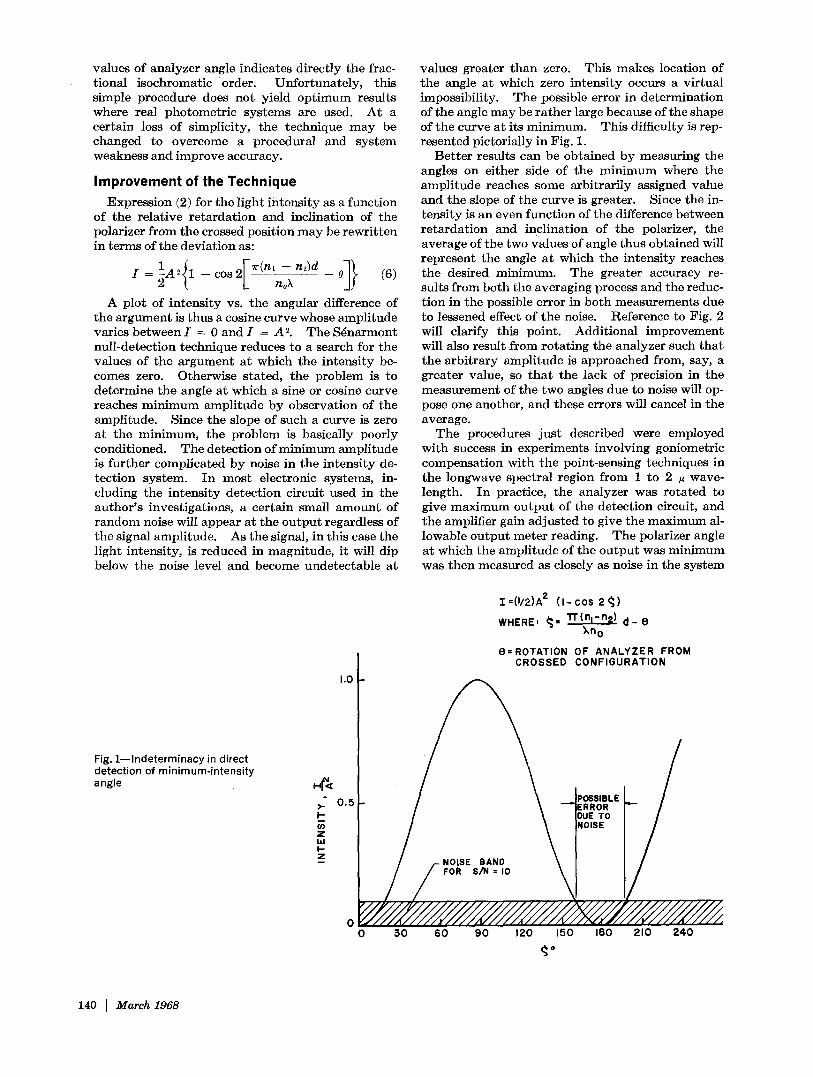
values greater than zero. This makes location of the angle at which zero intensity occurs a virtual impossibility. The possible error in determination of the angle may be rather large because of the shape of the curve at its minimum. This difficulty is rep- resented pictorially in Fig. 1.
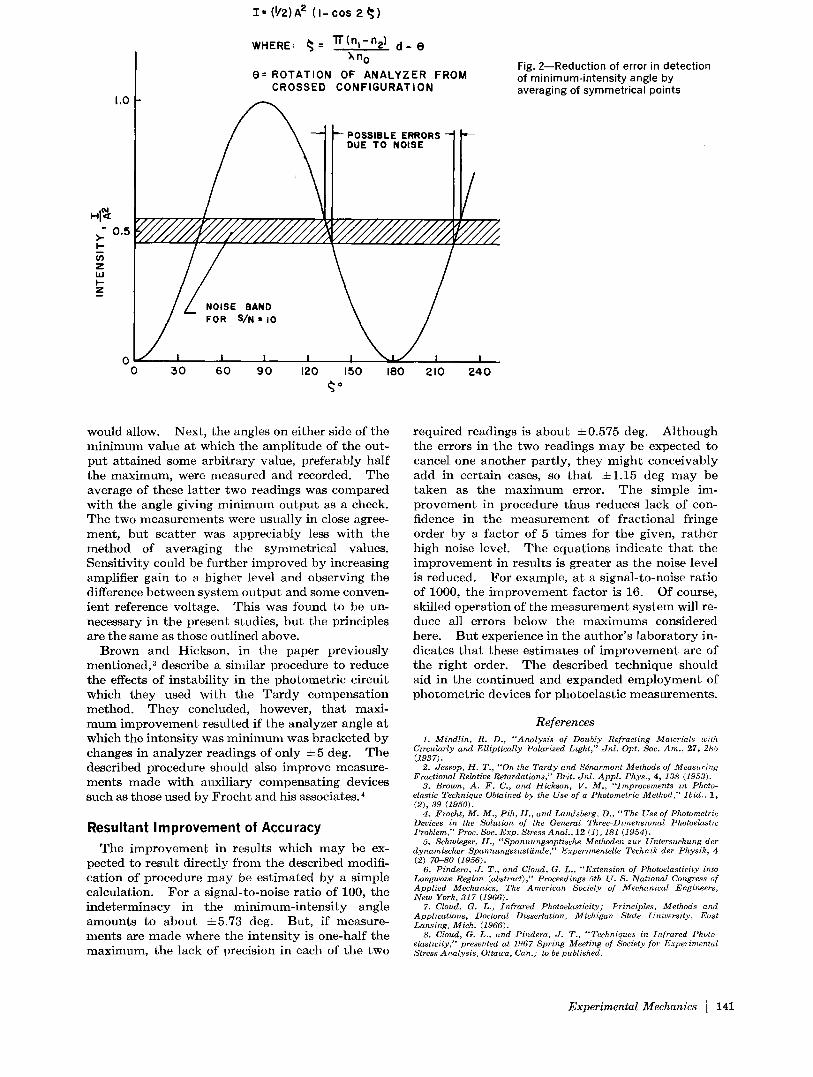
Bet ter results can be obtained by measuring the angles on either side of the minimum where the amplitude reaches some arbitrarily assigned value and the slope of the curve is greater. Since the in- tensity is an even function of the difference between retardat ion and inclination of the polarizer, the average of the two Values of angle thus obtained will represent the angle at which the intensity reaches the desired minimum. The greater accuracy re- sults from both the averaging process and the reduc- tion in the possible error in both measurements due to lessened effect of the noise. Reference to Fig. 2 will clarify this point. Additional improvement will also result from rotat ing the analyzer such that the arbitrary amplitude is approached from, say, a greater value, so tha t the lack of precision in the measurement of the two angles due to noise will op- pose one another, and these errors will cancel in the average.
The procedures just described were employed with success in experiments involving goniometric compensation with the point-sensing techniques in the longwave spectral region from 1 to 2 ~ wave- length. In practice, the analyzer was rotated to give maximum outpu t of the detection circuit, and the amplifier gain adjusted to give the maximum al- lowable output meter reading. The polarizer angle at which the amplitude of the ou tpu t was minimum was then measured as closely as noise in the system
Fig. I - - Indeterminacy in direct detection of minimum-intensity angle
i.O
~" 0.5
0
Z=(i/2)A a (I-cos 2~;) WHERE, ~= l"r(n=-nz) d - e
xn o e-ROT.T,ON OF ...YZER FRO. CROSSE~
P--,.'.L / i \ -E"o r- i
0 30 60 90 120 150 180 210 240
140 I March 1968
hO
I = ( I /2)A 2 ( I - c o s 2 ~ )
WHERE= ~ = T l ' (n l -n2 ) d - e Xn 0
6 = ROTATION OF ANALYZER FROM CROSSED CONFIGURATION
Fig. 2- -Reduct ion of error in detection of minimum-intensity angle by averaging of symmetr ica l points
P O S S I B L E ERRORS DUE T O N O I S E
" 0.5 >- I -
Z LIJ I-- Z
NOISE BAND FOR SIN = I 0
o L / I I I I 0 30 60 90 120
~o
I ~ I I 150 180 210 2 4 0
would allow. Next, the angles on either side of the minimum value at which the amplitude of the out- put attained some arbitrary value, preferably half the maximum, were measured and recorded. The average of these latter two readings was compared with the angle giving minimum output as a check. The two measurements were usually in close agree- ment, but scatter was appreciably less with the method of averaging the symmetrical values. Sensitivity could be further improved by increasing amplifier gain to a higher level and observing the difference between system output and some conven- ient reference voltage. This was found to be un- necessary in the present studies, but the principles are the same as those outlined above.
Brown and Hickson, in the paper previously mentioned, 3 describe a similar procedure to reduce the effects of instability in the photometric circuit which they used with the Tardy compensation method. They concluded, however, tha t maxi- mum improvement resulted if the analyzer angle at which the intensity was minimum was bracketed by changes in analyzer readings of only • 5 deg. The described procedure should also improve measure- ments made with auxiliary compensating devices such as those used by Frocht and his associates. 4
Resultant Improvement of Accuracy The improvement in results which may be ex-
pected to result directly from the described modifi- cation of procedure may be estimated by a simple calculation. For a signal-to-noise ratio of 100, the indeterminacy in the minimum-intensi ty angle amounts to about • deg. But, if measure- ments are made where the intensity is one-half the maximum, the lack of precision in each of the two
required readings is about • deg. Although the errors in the two readings may be expected to cancel one another partly, they might conceivably add in certain cases, so tha t • deg may be taken as the maximum error. The simple im- provement in procedure thus reduces lack of con- fidence in the measurement of fractional fringe order by a factor of 5 times for the given, rather high noise level. The equations indicate tha t the improvement in results is greater as the noise level is reduced. For example, at a signal-to-noise ratio of 1000, the improvement factor is 16. Of course, skilled operation of the measurement system will re- duce all errors below the maximums considered here. But experience in the author ' s laboratory in- dicates tha t these estimates of improvement are of the right order. The described technique should aid in the continued and expanded employment of photometric devices for photoelastic measurements.
References 1. Mindlin, R. D., "'Analysis of Doubly Refracting Materials with
Circularly and EUiptically Polarized Light," Jnl. Opt. Soc. Am., 27, 285 (1937).
2. Jessop, H. T., "On the Tardy and Sdnarmont Methods of Measuring Fractional Relative Retardations," Brit. Jnl. Appl. Phys., 4, 138 (1953).
3. Brown, A. F . C., and Hickson, V. M., "'Improvements in Photo- elastic Technique Obtained by the Use of a Photometric Method," Ibid., 1, (2), 39 (1950).
4. Frocht, M. M., Pih, H., and Landsberg, D., "'The Use of Photometric Devices in the Solution of the General Three-Dimensional Photoelastic Problem," Proc. Soc. Exp. Stress Anal., 12 (1), 181 (1954).
5. Schwieger, H., "Spannungsoptische Methoden zur Untersuchung der dynamischer Spannungszusti~nde," Experimentelle Technik der Physik, 4 (2) 70-80 (1956).
6. Pindera, J . T., and Cloud, G. L., "'Extension of Photoelasticity into Longwave Region (abstract)," Proceedings 5th U. S. National Congress of Applied Mechanics, The American Society of Mechanical Engineers, New York, 317 (1966).
7. Cloud, G. L., Infrared Photoelasticity; Principles, Methods and Applications, Doctoral Dissertation, Michigan State University, East Lansing, Mich. (1966).
8. Cloud, G. L., and Pindera, J . T., "'Techniques in Infrared Photo- elasticity," presented at 1967 Spring Meeting of Society for Experimental Stress Analysis, Ottawa, Can.; to be published.
Experimental Mechanics J 141


