
IMPLEMENTATION OF LEAN MANUFACTURING
By
Juan C. Tinoco
A Research Paper
Submitted in Partial Fulfillment of the Requirements for the
Master in Science Degree in Management Technology
Approved for Completion of 4 Semester Credits
INMGT-735 Field Problems
_________________________
Jim Keyes
Research Advisor
The Graduate College
University of Wisconsin-Stout
May, 2004

ii
The Graduate School University of Wisconsin-Stout
Menomonie, WI 54751
ABSTRACT
Tinoco Juan C._____________________ (Writer) (Last Name) (First) (Initial) Implementation of Lean Manufacturing _________________ (Title) Management Technology Jim Keyes May, 2004 65 (Graduate Major) (Research Advisor) (Month/Year) (No. of Pages)
Publication Manual of the American Psychological Association (Name of Style Manual Used in this Study)
Lean manufacturing refers to a manufacturing improvement process based on the
fundamental goal of Toyota production system (TPS) in order to minimize or eliminate waste
while maximizing production flow (Tapping, 2002). Many manufacturing organizations realize
the importance of practicing lean techniques. However, few organizations apply lean techniques
with the necessary knowledge and proven tools to achieve it.
A value stream includes all the operations and processes to transform raw materials into
finished goods or services, including non-value adding activities. Value stream management is a
management tool for planning a production process involving lean initiatives through systematic
data capture and analysis (Tapping, 2002). It is a proven process for planning the improvements
that will allow companies to develop lean practices.
The purpose of this study is to develop a value stream map for a manufacturing company
in Minnesota. This particular tool allows the company to document current lead time, inventory
iii
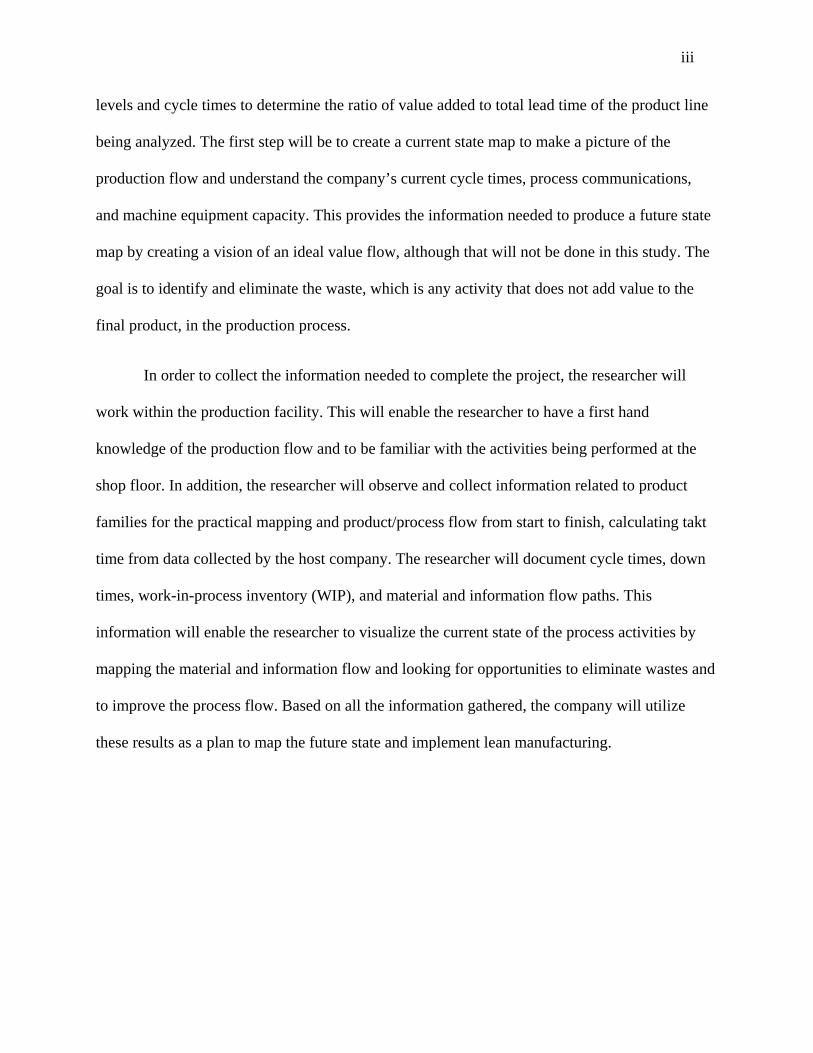
levels and cycle times to determine the ratio of value added to total lead time of the product line
being analyzed. The first step will be to create a current state map to make a picture of the
production flow and understand the company’s current cycle times, process communications,
and machine equipment capacity. This provides the information needed to produce a future state
map by creating a vision of an ideal value flow, although that will not be done in this study. The
goal is to identify and eliminate the waste, which is any activity that does not add value to the
final product, in the production process.
In order to collect the information needed to complete the project, the researcher will
work within the production facility. This will enable the researcher to have a first hand
knowledge of the production flow and to be familiar with the activities being performed at the
shop floor. In addition, the researcher will observe and collect information related to product
families for the practical mapping and product/process flow from start to finish, calculating takt
time from data collected by the host company. The researcher will document cycle times, down
times, work-in-process inventory (WIP), and material and information flow paths. This
information will enable the researcher to visualize the current state of the process activities by
mapping the material and information flow and looking for opportunities to eliminate wastes and
to improve the process flow. Based on all the information gathered, the company will utilize
these results as a plan to map the future state and implement lean manufacturing.

iv
ACKNOWLEDGEMENTS
Thanks a lot to the following people who provided
immeasurable help during this project:
Jim Keyes, my advisor;
Lloyd Peterson, at College of Technologies department at UW-Stout;
Mike Armbrust and Mark Karnick at XYZ Company at Minnesota
To my wife, for supporting and loving me,
To “Juan Pi”, for being my son and inspiration,
To Pedro and Mirian, for being my parents and believing in me,
To Mariana, for being my sister and cheering me up,
To Francisco and Dora, for being my parents in law and helping me at every moment.
To all of you and God, thanks for being there …

v
TABLE OF CONTENTS
…………………………………………………………………………………………………page
ABSTRACT.................................................................................................................................... ii
LIST OF TABLES....................................................................................................................... viii
LIST OF FIGURES ....................................................................................................................... ix
CHAPTER I .................................................................................................................................... 1
Statement of the Problem............................................................................................................ 2
Research Objectives.................................................................................................................... 2
Importance of the Study.............................................................................................................. 2
Limitations of the Study.............................................................................................................. 3
Assumptions of the Study ........................................................................................................... 3
Definition of Terms..................................................................................................................... 3
CHAPTER II................................................................................................................................... 6
Definition of Lean Manufacturing .............................................................................................. 6
Lean Manufacturing Origins....................................................................................................... 7
Value-Added versus Non-Value-Added Activities .................................................................... 8
Five Primary Elements for Lean Manufacturing ........................................................................ 9
Issues in Lean Manufacturing..................................................................................................... 9
Types of Wastes........................................................................................................................ 10
Stages of Lean Application....................................................................................................... 11
Demand Stage ....................................................................................................................... 11
Flow Stage ............................................................................................................................ 11
Leveling Stage ....................................................................................................................... 12

vi
Lean Manufacturing Tools and Techniques ............................................................................. 12
Just-in-Time .......................................................................................................................... 12
Kanban Systems .................................................................................................................... 13
Production Smoothing Method ............................................................................................. 16
Standardization of Operations .............................................................................................. 16
Autonomation ........................................................................................................................ 17
Work Cells............................................................................................................................. 19
Kaizen ................................................................................................................................... 20
Definition of Value Stream....................................................................................................... 21
Value Stream Management....................................................................................................... 22
Value Stream Mapping ............................................................................................................. 23
Summary ................................................................................................................................... 25
CHAPTER III ............................................................................................................................... 26
CHAPTER IV ............................................................................................................................... 30
Material Flow............................................................................................................................ 30
Information Flow ...................................................................................................................... 31
Process Attributes ..................................................................................................................... 32
Daily Customer Requirements .............................................................................................. 32
Takt Time .............................................................................................................................. 32
Availability ............................................................................................................................ 32
Individual Metrics..................................................................................................................... 33
Number of Operators ............................................................................................................ 33
Cycle Time ............................................................................................................................ 34

vii
Changeover Time .................................................................................................................. 34
Available Uptime .................................................................................................................. 35
Work-in-Process (WIP) Inventory ........................................................................................ 35
Metrics for the Entire Value Stream ......................................................................................... 38
Cumulative Available Uptime ............................................................................................... 38
Total Value Stream WIP Inventory ....................................................................................... 38
Total Value Stream Days of WIP .......................................................................................... 38
Total Product Cycle Time ..................................................................................................... 38
Lead Time.............................................................................................................................. 38
Conclusion ................................................................................................................................ 39
CHAPTER V ................................................................................................................................ 41
Observations ............................................................................................................................. 41
Recommendations................................................................................................................. 42
References..................................................................................................................................... 46
Appendix A: Details of a Resonator ............................................................................................. 47
Appendix B: Quantity of Parts per Resonator……………………………………… .................. 48
Appendix C: Sequence of Operations and Work center per Part.................................................. 50
Appendix D: Data Collected Day 1 .............................................................................................. 51
Appendix E: Data Collected Day 2............................................................................................... 54
Appendix F: Data Collected Day 3............................................................................................... 57
Appendix G: Data Collected Day 4 .............................................................................................. 60
Appendix H: Individual Metrics Collected................................................................................... 63
Appendix I: Lead Time................................................................................................................. 65

viii
LIST OF TABLES
Table 1: Family of ATV Resonators Selected to Develop a Value Stream Map………………27
Table 2: Metrics for Each Process……………………………………………………………...34
Table 3: WIP Inventory Between the Processes (in terms of Resonators)……………………..36
Table 4: WIP Inventory Between the Processes (in terms of Parts)……………………………37
ix
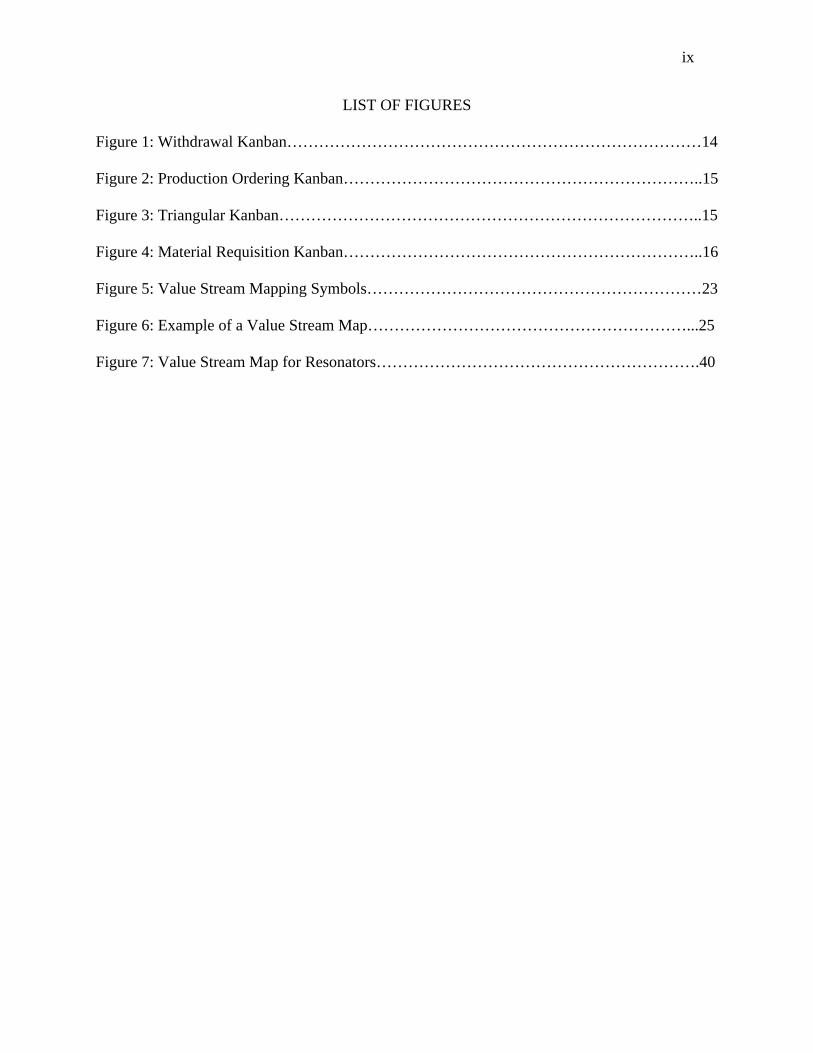
LIST OF FIGURES
Figure 1: Withdrawal Kanban……………………………………………………………………14
Figure 2: Production Ordering Kanban…………………………………………………………..15
Figure 3: Triangular Kanban……………………………………………………………………..15
Figure 4: Material Requisition Kanban…………………………………………………………..16
Figure 5: Value Stream Mapping Symbols………………………………………………………23
Figure 6: Example of a Value Stream Map……………………………………………………...25
Figure 7: Value Stream Map for Resonators…………………………………………………….40

CHAPTER I
INTRODUCTION
Manufacturing operations are continually striving to increase productivity and output of
their operations. Their goal is to satisfy the customer with the exact product, quality, quantity,
and price in the shortest amount of time.
Lean manufacturing is more than a cost reduction program or a problem solving approach
(Tapping, 2002). The main idea is that an efficient production can be achieved by a
comprehensive approach to minimize wastes. This means eliminating excess production and
inventory, redundant movement of material, waiting and delays, over processing, excess worker
motion, and the need for rework and corrections.
Part of lean manufacturing is reviewing operations for those components, processes or
products that add cost rather than value (Tapping, 2002). Each step of the manufacturing process
is monitored to determine if it adds value to the product. If it does not add value, the process
could be delegated to a subcontractor or outsourcing company in order to focus the staff on
value-added operations of its core business.
A value stream is the set of processes required to transform raw materials into finished
goods that customers value (Womack & Jones, 1996). In this study, a value stream map will be
developed for a manufacturing company in Minnesota. Creating a value stream map will allow
the company to document current production lead time, inventory levels, and cycle times in order
to determine the ratio of value-added to total lead time of the product family being analyzed,
creating a vision of an ideal value flow. The goal is to identify and eliminate the wastes in the
production process. The company will use these results in order to map the future state and
implement lean manufacturing.

2
Statement of the Problem
The purpose of this study is to develop a value stream map for XYZ manufacturing
company in Minnesota and identify wastes and make recommendations for improvement. It is
hoped that the company uses the value stream map for the future implementation of lean
manufacturing, in order to increase productivity and improve the quality of goods produced by
the company, while at the same time reducing costs, total lead time, human effort, and inventory
levels.
Research Objectives
1. Work within the production facility to have a first hand knowledge of the production
flow and to be familiar with the activities being performed in the shop floor.
2. Select which value stream to target for the practical mapping.
3. Observe and collect information related to product/process flow from raw material to
finished goods for the value stream selected.
4. Determine the current state of the process activities by mapping the material and the
information flow.
5. Calculate lean metrics from the value stream map.
6. Look at the current state map for opportunities to eliminate wastes and improve the process flow.
Importance of the Study
The value stream map that will result from this study could reduce costs, improve lead
time, increase productivity, and improve quality of the products produced by XYZ company in
Minnesota. The impact of not doing the study could be inefficiency and working with an excess

3
amount of work-in-process inventory which will result in delays on delivery orders, higher
operating cost, loss of customers, and less sales revenue.
Limitations of the Study
The limitations of the project were that
1. The results of this study are limited to XYZ manufacturing company. 2. The company defined the value stream to be targeted for improvements. 3. The results will be based on data collected from the production activities performed
along the value stream selected.
4. The study includes only the development of the current state map for a value stream
selected and recommends ways to improve the process.
5. The development of the future state map will not be included in this study. 6. The study does not explain how to implement lean manufacturing.
Assumptions of the Study
It is assumed that by designing a map of the present state of the value stream selected
with the necessary technical information and references to develop a future state map, XYZ
manufacturing company in Minnesota will have the capacity to develop a future map in an
effective way to implement lean manufacturing, in order to increase the productivity and output,
as well as to reduce costs, inventory, and time. It is also assumed that all of the work centers
involved in the study were working only with the selected value stream.
Definition of Terms
Available Production Time: Determined by taking the shift time and subtracting regular planned
downtime events such as breaks.

4
Available Operating Time: Determined by taking the available production time and subtracting
changeover time.
Batch Size: A technique used to run a determined quantity of parts at one operation prior to
moving them to the next operations.
Changeover Time: The time that an operator spends at a work center switching the production
tools in order to change from one product type to another.
Downtimes: Those are considered break times. Downtimes are regular planned times and usually
involve unpaid lunch and paid breaks. During a downtime the production does not run.
Electronic Data Interchangeable: It is a tool that allows companies to process the purchasing
order electronically.
Finished Goods: Refers to parts that already have been manufactured and are in the completed
stage waiting to be shipped to the customer.
Kaizen: Continual improvement involving everyone within an organization (Ohno, 1998)
Kanban: A tool to achieve just-in-time which consists of a card containing all the information
required to be done on a product at each stage along its path to completion and which parts are
needed at subsequent processes (Monden, 1993)
Lead Time: The time that parts take to be transformed from raw material to finished goods.
Lean Metrics: A list of measurements that will help for tracking progress toward the targets
selected for improvements.
Material Requirement Planning: It is a tool that helps manage the production process. Basically,
it is a plan for the production of the components and purchase of materials needed to make an
item.

5
Operating cost: It is all the money that the company spends in order to turn inventory into
finished goods.
Operators: Involves those individuals that provide the work hand to perform an operation.
Product Family: Refers to all the parts that are produced within the same value stream. All the
parts for the product family group have common production processes and same pattern
development.
Raw Material: Material that has been purchased but not changed in any way.
Value Stream: The set of processes, including value-added and non-value-added activities
required to transform raw materials into finished goods that customers value (Womack & Jones,
1996).
Work-in-Process: Any product in the production process than began as raw material, but is not a
finished good yet.

CHAPTER II
REVIEW OF LITERATURE
This chapter compiles and organizes information about value streams and lean
manufacturing that will aid the reader in understanding the specifics of the study.
Definition of Lean Manufacturing
According to Womack, Jones, and Roos (1990), the term “lean” represents a system that
utilizes fewer inputs in order to create the same outputs than those created by a traditional mass
production system, while increasing the range of different finished goods for the end customer.
The term lean manufacturing is synonymous with different names, such as agile manufacturing,
just-in-time manufacturing, synchronous manufacturing, world class manufacturing, and
continuous flow.
Lean manufacturing is an operational strategy oriented toward achieving the shortest
possible cycle time by eliminating waste (Liker, 1997). It is derived from the Toyota production
system and its objective is to increase the value-added work by eliminating wastes and reducing
unnecessary work. The technique often decreases the time between a customer order and
shipment, and it is designed to improve profitability, customer satisfaction, throughput time, and
employee motivation.
The benefits of lean manufacturing generally are lower costs, higher quality, and shorter
lead times (Liker, 1997). The term lean manufacturing is created to represent less human effort
in the company, less manufacturing space, less investment in tools, less inventory in progress,
and less engineering hours to develop a new product in less time.

7
Lean Manufacturing Origins
After World War II, Japanese manufacturers were facing the dilemma of insufficiency of
materials, financial problems, and human resources (Ohno, 1988). The problems that the
Japanese faced differed from those in America. For many decades America had cut costs by
using the mass production system while producing fewer types of end items while for the
Japanese the problem was how to cut costs while producing small numbers of many types of end
items.
According to Ohno (1988),
Imitating America is not always bad. We have learned a lot from the U. S. automobile
empire. America has generated wonderful production management techniques, business
management techniques such as quality control (QC) total quality control (TQC) and
industrial engineering (IE) methods. (p. 3)
In the 1940s a German worker could produce three times as much as a Japanese worker,
and an American worker could produce three times as much as a German worker (Ohno, 1988).
Therefore, the ratio of production between American and Japanese work forces was nine to one.
In order to make a move toward improvement, the Japanese leader Toyoda Kiichiro proposed to
reduce the gap with America in three years, resulting in the birth of the lean manufacturing
practices.
The term lean manufacturing was first used to describe the implementation of what is
now considered to be part of lean manufacturing such as a Kanban or just-in-time (JIT). It began
as a description of procedures used by the Toyota Motor Corporation from 1950 through the
1980s (Ohno, 1988). Now lean means much more. The Toyota production system started as part
of a strategy to survive developed by Taiichi Ohno, presently vice president of the Toyota, in an

8
effort to conserve capital, eliminate waste, reduce inventory, and reduce production times and
operating expenses while increasing quality and production flexibility at the same time. The
Toyota production system was proved to be successful and implemented throughout the entire
company.
Toyota opened its first major operation in the United States in 1984 through a joint
venture with General Motors in Fremont, CA (Ohno, 1988). Since then, Toyota has made
continuous progress adapting its production system to a diverse workforce and a geographically
spread supplier base. The reputation of the company has grown across the world. While most
companies have suffered with enormous losses in business cycle decline, Toyota has not lost
money since 1960. The major contributor to their success has been Toyota production system.
The Toyota production system has been created on the practice and evolution of one very
useful technique that reduces cost and time while challenges every activity in the value stream
(Ohno, 1988). It is applying a methodology known as the “Five whys.” By asking why an
activity is performed and then asking why after each response, it is frequently possible to get to
the origin of the problem. Understanding the root cause assists in successful redesign.
Value-Added versus Non-Value-Added Activities
The process of transforming raw material into finished goods is the objective of any
manufacturing company (Tapping, 2002). The processes that make that transformation possible
are the result of two different activities: those that add value and those that do not. Value-added
activities are considered the actions and the process elements that accomplish those
transformations and add value to the product from the perspective of the customer (e. g., tubing,
stamping, welding, painting, etc.). Non-value-added activities are the process elements that do

9
not add value to the product from the perspective of the customer such as setting up, waiting for
materials, and moving materials.
In the past companies have been focused on the value-added steps (Corner, 2001). The
goal was to reduce the value-added component of lead time and not pay too much attention to the
non-value-added activities. Today, lean manufacturing strives to improve as much as possible the
value-added component of lead time, but focus first on reducing the non-value-added component
of lead time.
Five Primary Elements for Lean Manufacturing
The five primary elements to consider when implementing lean manufacturing are
manufacturing flow, organization, process control, metrics, and logistics (Feld, 2000). These
elements represent the variety of aspects needed to sustain a successful lean manufacturing
implementation program. Manufacturing flow addresses physical changes and design standards.
Organization identifies people’s roles/functions, training in new ways of working, and
communication. Process control is directed at monitoring, controlling, stabilizing, and pursuing
ways to improve the process. Metrics addresses visible results-based performance measures,
targeted improvement, and team rewards/recognition. Logistics provide the definition for
operating rules and mechanisms for planning and controlling the flow of material.
Issues in Lean Manufacturing
Lean manufacturing is in direct opposition with traditional manufacturing approaches
characterized by use of economic order quantities, high capacity utilization, and high inventory
(Feld, 2000). In changing from a traditional environment to one of lean production, cultural
issues will emerge quickly, as well as resistance to change. Implementing lean manufacturing
techniques will change the organizational culture because everyone needs to be more involved

10
and accountable and people may be laid off. A fast managing change program is needed to
accompany the effort. A slow approach generally does not work or achieve significant results.
Lean manufacturing is not a magical solution (Feld, 2000). It involves a change in
leadership that requires considerable communication, coordination, and organization which
results in a change in the company’s culture. Just implementing one lean technique such as a
Kanban system will not result in lean implementation. Positive employee reaction to lean
manufacturing is essential to success, but does not always occur since becoming lean improves
productivity and can reduce the number of workers needed. Laying people off and asking the
remaining employees to become more involved may not work.
Feld (2000) stated that in order to create a lean manufacturing environment, the
organization needs to be aware of where it is at that point. They must know why they need to
change and why change is important. It is necessary to provide the answers to these questions to
employees so they become more engaged in the process. “Motivation, tenacity, leadership, and
direction all play roles in the successful deployment of a lean program” (p. 7). Feld also stated
that roles within the team and the way in which team members interact with one another are
important. All members must understand their roles and why they were selected for their
assignment.
Types of Wastes
According to Tapping (2002) “the ultimate lean target is the total elimination of waste.
Waste, or muda, is anything that adds cost to the product without adding value” (p. 41).
Wastes can be classified into seven categories (Tapping, 2002):
1. Waste of overproducing: Producing components that are neither intended for stock
nor planned for sale immediately.

11
2. Waste of waiting: Refers to the idle time between operations. 3. Waste of transport: Moving material more than necessary. 4. Waste of processing: Doing more to the product than necessary and the customer is
willing to pay.
5. Waste of inventory: Excess of stock from raw materials to finished goods.
6. Waste of motion: Any motion that is not necessary to the completion of an operation.
7. Waste of defects and spoilage: Defective parts that are produced and need to be
reworked.
Stages of Lean Application
Demand Stage
This stage refers to understanding the customer demand and incorporating it into the lean
process (Tapping, 2002). It involves knowing exactly the number of parts or products that the
company needs to produce each day. There is an important concept called Takt time that can be
used to define the customer demand. The word “Takt” comes from the German word “rhythm,”
therefore Takt time determines the rhythm necessary to maintain customer demand. Takt time is
calculated based in the following formula:
Takt Time (TT) = Available production time Total daily quantity required Flow Stage
In order to meet customer demand the company needs to implement a flow
manufacturing of production to ensure that the customer will receive the right products on time
and the right amount (Tapping, 2002).

12
Leveling Stage
The leveling stage refers to leveling production; it means to spread the work required to
achieve customer demand over a shift or a day (Tapping, 2002).
Lean Manufacturing Tools and Techniques
Once the companies find the main sources of wastes, tools such as just-in-time, Kanban
systems, production smoothing method, work cells, autonomation, Kaizen, and others will help
companies to take corrective actions to eliminate or reduce these wastes (Monden, 1993).
Following is a compilation of information regarding to those tools.
Just-in-Time
Just-in-time means that each process receives the right parts needed at the time they are
needed and in the amount they are needed to produce an order from a customer with the highest
quality (Ohno, 1988). Just-in-time is an important concept in the Toyota production system.
Just-in-time allows companies to eliminate wastes such as work-in-process inventory,
defects, and poor delivery of parts (Nahmias, 1997). It is a critical tool to manage activities such
as distribution and purchasing, and can be classified into three categories: just-in-time
production, just-in-time distribution and just-in-time purchasing.
Henry Ford (1922) found that it was only worth while to buy materials for immediate use,
taking into account the state of transportation at the time. If there were never any problems with
transportation and an even flow of materials could be depended upon, it would not be necessary
to carry any stock because raw materials could go immediately into production, decreasing the
amount of money tied up in materials. When transportation can not be depended upon, a larger
stock is necessary.

13
Kanban Systems
A Kanban is a tool to achieve just-in-time (Monden, 1993). It consists of a card
containing all the information that is required to be done on a product at each stage along its path
to completion and which parts are needed at subsequent processes. This card is usually put in a
rectangular vinyl envelope and is used to control work-in-process, production, and inventory
flow. A Kanban system consists of a set of these cards, with one being allocated for each part
being manufactured and the travel between preceding and subsequent processes. The Kanban
system was developed by Toyota to achieve objectives such as reducing costs by eliminating
wastes; creating work places that can respond to changes quickly; facilitating the methods of
achieving and assuring quality control; designing a work environment that takes into account
human dignity, mutual trust, and support; and allowing workers to reach their maximum
potential. A Kanban system allows a company to achieve just-in-time production and ordering
systems, which allow them to minimize their inventories while still satisfying customer demands.
Lower production times and work-in-process have lead to the idea of incorporating
Kanban systems in manufacturing industries (Monden, 1993). These systems are most
commonly used to implement the pull type control in production systems which mean reducing
costs by minimizing the work-in-process inventory, allowing an organization the ability to adapt
to changes in demand, and therefore develop faster production. A pull type production line is a
sequence of production stages performing various process steps on parts where each stage
consists of several workstations in cycle. Parts are pulled between the production stages in
accordance with the rate at which parts are being consumed by the down stream stages.
Descriptions of the types of Kanbans most often used today follow.
14
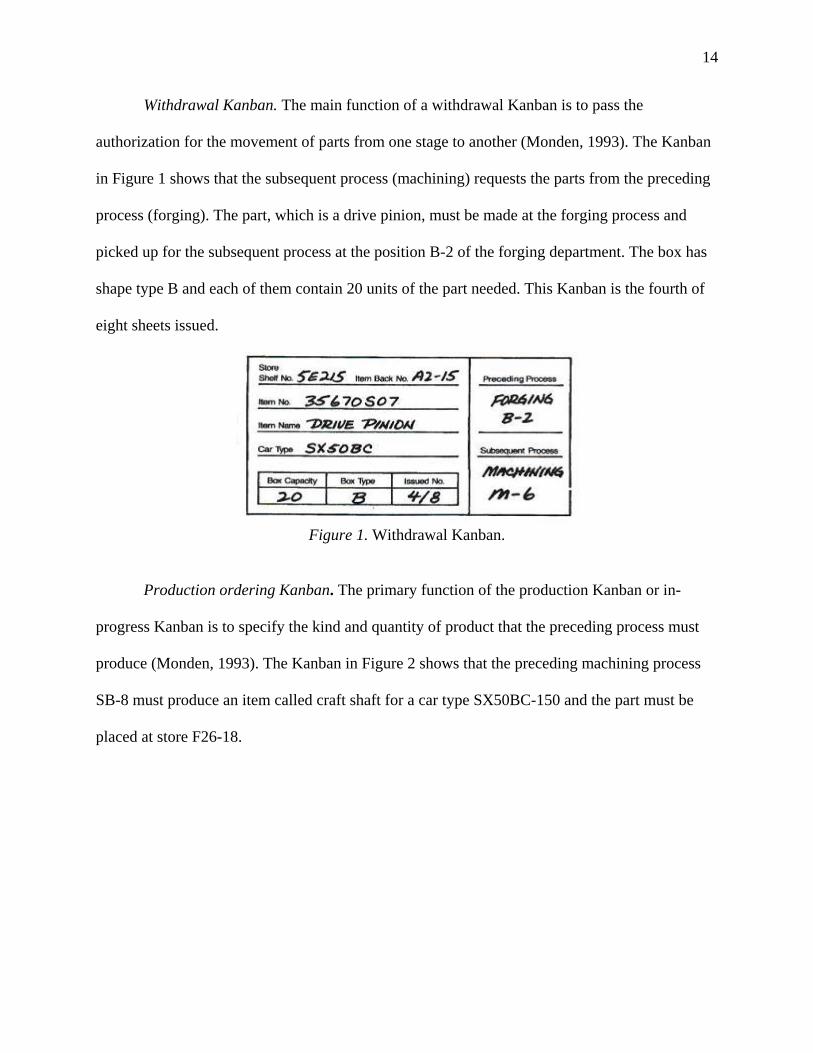
Withdrawal Kanban. The main function of a withdrawal Kanban is to pass the
authorization for the movement of parts from one stage to another (Monden, 1993). The Kanban
in Figure 1 shows that the subsequent process (machining) requests the parts from the preceding
process (forging). The part, which is a drive pinion, must be made at the forging process and
picked up for the subsequent process at the position B-2 of the forging department. The box has
shape type B and each of them contain 20 units of the part needed. This Kanban is the fourth of
eight sheets issued.
Figure 1. Withdrawal Kanban.
Production ordering Kanban. The primary function of the production Kanban or in-
progress Kanban is to specify the kind and quantity of product that the preceding process must
produce (Monden, 1993). The Kanban in Figure 2 shows that the preceding machining process
SB-8 must produce an item called craft shaft for a car type SX50BC-150 and the part must be
placed at store F26-18.

15
Figure 2. Production ordering Kanban.
Signal Kanban. A signal Kanban is tagged into a box within the production lot (or batch)
and is used to specify lot production in the stamping processes. Two types of signal Kanbans are
used (Monden, 1993):
1. Triangular Kanban: The triangular shaped Kanban in Figure 3 shows that an order
from punch press process # 10 is required when the lot size is down to 200. It is
placed on pallet 2 of 5.
Figure 3. Triangular Kanban.

16
2. Material requisition Kanban: The rectangular shaped Kanban in Figure 4 shows that
the press process # 10 must go to the store 25 to withdraw 500 units of steel board,
when the left doors are withdrawn down by two boxes.
Figure 4. Material requisition Kanban.
Production Smoothing Method
“Heijunka” is the Japanese word for production smoothing (Tapping, 2002). It is a
method for planning and leveling customer demand by volume and variety, while keeping the
level of production as constant as possible over a specific time period.
Production smoothing is very important state when implementing a Kanban system and
reducing idle time regarding labor, equipment, and work-in-process inventory (Monden, 1993).
It is the basis of the Toyota production system.
Standardization of Operations
Standardization of worker actions is an important principle in eliminating wastes (Ohno,
1988). It refers to organizing the job and performing it in the most effective way. In a
standardized workplace every worker follows the same steps within the production process. The
Toyota production system includes in its standard operations three elements:

17
1. Cycle time: The time necessary to produce one piece or unit. 2. Standard operation routine: The order of operations in which workers process a
product.
3. Standard inventory: The minimum amount of work-in-process inventory necessary to
process a product.
Autonomation
Autonomation is known as “Jidoka” or “automation with a human touch” (Levinson &
Rerick, 2002). It is another aspect of the Toyota production system and was developed by
Sakichi Toyoda, the founder of Toyota Motor Company, in an effort for create a machine that
stopped automatically if any problem occurred. It exists in a machine automated with an
automatic stopping device attached, which makes it possible for machines to prevent problems,
such as smalls abnormalities, by itself over simple automation. The goal of autonomation is zero
defects, in order to eliminate the risk of a defective product that could be received by a customer.
An autonomated machine can then distinguish between a normal and abnormal operation, and
also does not need continuous operator consideration.
Using autonomation, Toyota factories can detects the mass production of defects and
check and correct machine breakdowns automatically (Monden, 1993). One mechanism used by
Toyota to prevent defective work is called “foolproof,” “Baka-Yoke,” or “Poka-Yoke.” It works
by putting various checking devices on the implements or instruments in the process.
Poka-Yoke was developed by Shigeo Shingo after World War II (Feld, 2000). It was
designed to focus on the pursuit of quality at the source and to capture a response on defects in
order to determine a possible root cause. The tools to implement Poka-Yoke could be physical,

18
mechanical, or electrical. They could also be as simple as a checklist for an operator to ensure
that all the activities in a determined process are covered.
An autonomated workstation can announce problems using a visual or auditory signal
which cues the operator to fix and restart it (Levinson & Rerick, 2002). Also, the operator must
check if this problem is a persistent problem that people must continue to correct.
The five types of visual control systems that are frequently used are call lights and an
Andon board; standard operations sheets; Kanban tickets; digital display panels; and store and
stock indicator plates (Monden, 1993).
Call lights are used to call for a supervisor or general workers for different types of
assistance (Monden, 1993). There are different colors of lights, each of which have a different
meaning and give a different instruction. Andon boards are used to show when an operator
stopped the production line. The Andon board has five colors with the following meanings: red
(machine trouble), white (end of production), green (short of materials), blue (defective unit),
and yellow (machine setup).
As previously mentioned, standard operations are used to eliminate unnecessary
inventory and workers and to eliminate accidents and defective production (Monden, 1993).
Standard operations sheets consist of three elements: cycle time, a standard operation routine,
and a standard amount of work-in-process. They are used with other kinds of visual control.
Kanban tickets serve as a visual signal to control abnormalities in production (Monden,
1993). The absence of a Kanban ticket on a container can work as a signal that a problem exists.
Also, a Kanban ticket can determine whether working overtime is necessary or not.
Digital display panels show the pace of production, the day of production, and the
number of units that has been produced during the day (Monden, 1993).

19
When a product is in storage an address is indicated both over the storage location and on
the Kanban in an effort to deliver parts to the correct location. The stock plate indicates the
quantity on stock, making inventory control easier.
Work Cells
Cellular operations are a new way to organize a plant that arranges machines in order of
production operations (Levinson & Rerick, 2002). Production in these cells is performed in the
order in which operations must be completed to produce the end item. When a work cell
operation completes the shop order then it is moved to the next operation for additional
processing by hand, forklift, or cart.
There are four primary characteristics of the modern work cell organization (Najarian,
2000):
1. Product/process family focus: Production is organized by product rather than by
function with equipment dedicated or partially dedicated to a family of products.
2. One at a time production: Operations move creating a batch of one piece. In order to
achieve it, one operation must start just after the part comes out from the previous
operation.
3. Flexible output levels: The work cells must be flexible and coordinated with regards
to customer demand.
4. Operator multi-tasking: In a work cell workers are performing operations on one part
and operating numerous similar machines simultaneously.
Henry Ford (1922) stated that the Ford Motor Company started assembling one car in one
factory, but as they began to make parts they departmentalized so that each department did only
one thing. The factory is now organized so each department makes only one part. The part

20
arrives as raw material and goes through the processes necessary to finish it when it will leave
the department.
There are a few benefits to using work cells (Najarian, 2000). One is lower total labor
cost since people are working closer and operating many machines simultaneously, improving
the efficiency of the work force. Another is reduced material handling which is due to using
batches of one good at a time. Improved quality is the third benefit of work cells because
producing one good at a time results in easier detections and corrections of defects through the
process. Last, work cells reduce work in process because when parts are produced in batches of
one good and operations are synchronized, work-in-process inventory is reduced dramatically.
Kaizen
Kaizen involves continual improvement involving everyone within an organization
(Ohno, 1988). Kaizen is a Japanese word meaning gradual and orderly continuous improvement.
The Kaizen business strategy involves everyone in an organization working together to make
improvements without large capital investments. Kaizen is a culture of sustained continuous
improvement focusing on eliminating waste in all systems and processes of an organization. This
strategy begins and ends with people, and involves leadership that guides people to continuously
improve their ability to meet expectations of high quality, low cost, and on-time delivery,
therefore transforming companies into superior global forces.
The most important tool for continuous improvement is the 5S Housekeeping, also
known as 5S-CANDO, which is a process that includes a set of techniques utilized for cleaning
and organizing the workplace (Levinson & Rerick, 2002). 5S reduces wastes by eliminating the
searching for tools because everything is in the right place. Preventive maintenance assures that
the tools are ready to use, reducing setup time, and the equipments and machines will be running

21
effectively, avoiding unplanned downtime or breakdowns. 5S CANDO comes from the Japanese
words Seiri (Clearing up), Seiton (Arranging), Seiso (Neatness), Shitsuke (Discipline), and
Seitketsu (Ongoing improvement).
Seiri refers to sorting the workplace and eliminating needless items (Feld, 2000). It
means “throw away” and separates the messes from those items that are needed to work easily
resulting in a better flow of materials, utilization of space, and organization for operators to
move.
Seiton refers to arranging everything within a specific area (Feld, 2000). All items and
equipment must be identified with a label and organized in a specific place resulting in an easier
way to recognize and find the proper tooling, resources, and materials quickly.
Seiso refers to cleaning everything and doing periodic maintenance (Feld, 2000).
Everything should be cleaned, organized, and well maintained at the end of every shift, including
the production area, tools, and materials.
Seitketsu deals with the management strategies for institutionalizing the standard
activities (Feld, 2000). Managers must establish policies and procedures to keep the area
organized, ordered, and clean.
Shitsuke refers to the leadership strategy to implement housekeeping involving training,
communications, and motivation as fundamentals leadership practices in order to ensure that
everyone follows the 5S standards (Feld, 2000).
Definition of Value Stream
A value stream is the set of processes, including value-added and non-value-added
activities, required to transform raw materials into finished goods that the customers value
(Womack & Jones, 1996). Value streams bring a specific good or service through three critical
22
management tasks: problem solving (figuring out what needs to be changed), information
management (improving information flow), and physical transformation (implementing
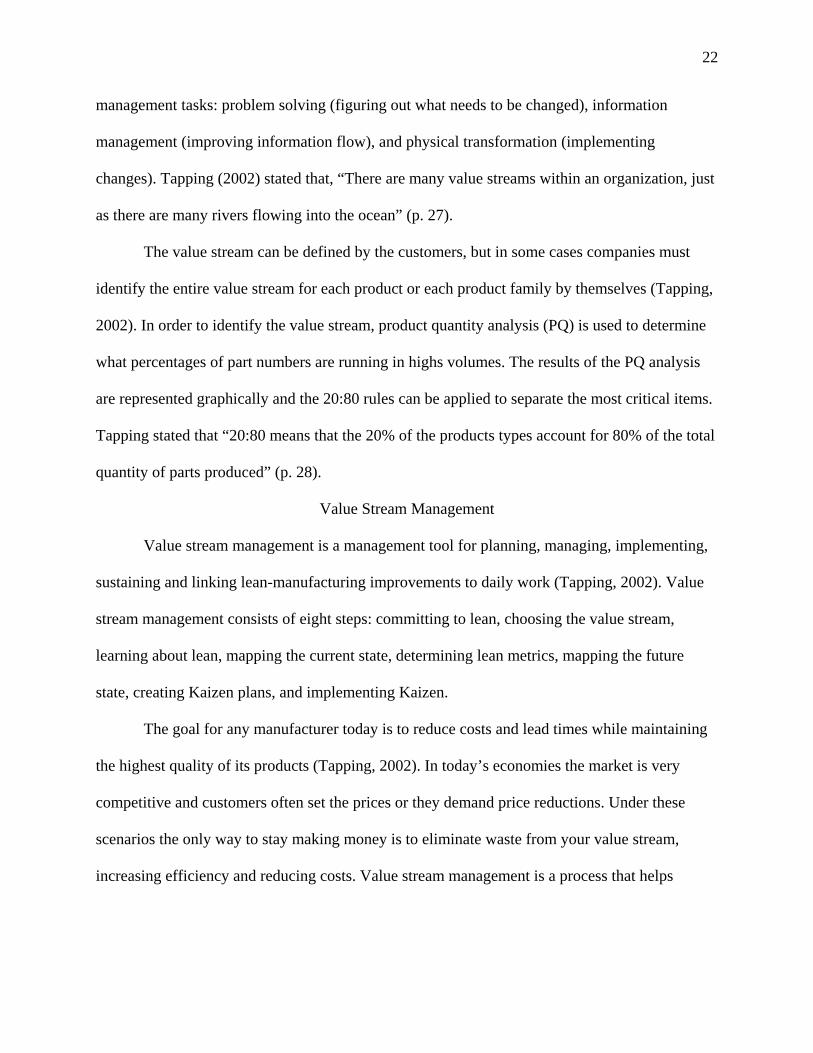
changes). Tapping (2002) stated that, “There are many value streams within an organization, just
as there are many rivers flowing into the ocean” (p. 27).
The value stream can be defined by the customers, but in some cases companies must
identify the entire value stream for each product or each product family by themselves (Tapping,
2002). In order to identify the value stream, product quantity analysis (PQ) is used to determine
what percentages of part numbers are running in highs volumes. The results of the PQ analysis
are represented graphically and the 20:80 rules can be applied to separate the most critical items.
Tapping stated that “20:80 means that the 20% of the products types account for 80% of the total
quantity of parts produced” (p. 28).
Value Stream Management
Value stream management is a management tool for planning, managing, implementing,
sustaining and linking lean-manufacturing improvements to daily work (Tapping, 2002). Value
stream management consists of eight steps: committing to lean, choosing the value stream,
learning about lean, mapping the current state, determining lean metrics, mapping the future
state, creating Kaizen plans, and implementing Kaizen.
The goal for any manufacturer today is to reduce costs and lead times while maintaining
the highest quality of its products (Tapping, 2002). In today’s economies the market is very
competitive and customers often set the prices or they demand price reductions. Under these
scenarios the only way to stay making money is to eliminate waste from your value stream,
increasing efficiency and reducing costs. Value stream management is a process that helps

23
organizations systematically identify and eliminate the non-value-added elements from the value
stream and generate a design and a plan to implement lean manufacturing.
Value Stream Mapping
Value stream mapping is a visual representation of all the specific activities, including the
flow of material and information, which occurs along the value stream selected for a product or
family (Tapping, 2002). The value stream mapping process will likely reveal that a significant
amount of non-value-added activities are present in your current processes. These activities
consume financial and human resources and make longer lead-time without adding value.
However, some of these activities are really necessary in the process; therefore the idea is to
minimize their impact. Figure 5 below shows the value stream symbols used to describe each
process of manufacturing or assembly.
Figure 5. Value stream mapping symbols.

24
Tapping (2002) stated the following:
Mapping material and information flow will allow you to visualize the entire
manufacturing material flow, instead of a single, isolated operation (such as fabrication,
welding, or assembly), visualize how operations currently communicate with production
control and with each other, see problem areas and source of waste, locate bottlenecks
and WIP, spot potential safety and equipment concerns, provide a common language for
all manufacturing personnel, and gain insight into how the operation truly is running that
day. (p. 80)
There are four steps to value stream mapping (Corner, 2001):
1. Product development: In this step the company must identify customer requirements,
quantity required daily, method of transportation, etc.
2. Process design: In this step all the possible information for each process of the value
stream selected including cycle time, changeovers times, number of operators,
inventory in process, available time, etc. must be collected
3. Preparation: Record as much information as possible and draw the current state map. 4. Planning: Develop the future state map.
Figure 6 shows an example of a value stream map.

25
Figure 6. Example of a value stream map.
Summary
This chapter identified some concepts regarding lean manufacturing such as its
background, application, tools, and techniques as well as value streams that are important for
understanding later parts of this paper

CHAPTER III
METHODOLOGY
The procedures for this study have been chosen to meet each of the project objectives. To
have a first-hand knowledge of the production flow and to be familiar with the activities being
performed at the floor shop, the researcher went through the facility and identified each
operation process involved from raw materials to finished goods, identified all the places where
inventory is stored between the processes, and observed how the material flowed from one
operation to another.
To select which value stream to target for the practical mapping, the company selected a
product family group for improvements. All of the parts for the product family group had
common production processes and the same pattern development. In order to perform this
activity, the company needed a list of all parts numbers, the quantity ordered over the last year,
and all of the processes steps they go through. By identifying the part numbers and the processes
involved, the company used a Paretto diagram to see what products they made the most. Table 1
shows a family group of nine resonators for ATVs which was selected by the company as a
model to develop a value stream map. Also, refer to Appendix A to see a figure of the resonator.

27
Table 1
Family of ATV Resonators Selected to Develop a Value Stream Map
Processes Description
1260968 Weld-silencer, Trail Boss
1260989 Weld-silencer
1261006 Weld-silencer
1261042 Weld-exhaust silencer
1261082 Weld-silencer
1261182
1261215
1261233
1261270
Weld-silencer, Trail Boss
Weld-silencer
Weld-exhaust silencer
Weld-exhaust silencer
Once the value stream was selected, the researcher observed and collected data related to
the flow of information and material from raw material to finished goods. Beginning with the
information flow, the researcher used the support of the planner to collect information
concerning the communication with customers and suppliers, the production controls orders and
forecast from customers, the production controls orders and forecast to suppliers, the frequency

28
of orders released to the production supervisor, and the frequency of orders released to each
operation within the value stream.
In order to map the current state, the researcher decided to go to the floor to perform a
four-day experiment in order to collect data, which began with the receiving area and worked
toward the shipping area. The researcher collected information about material flow, inventory
between processes, and process attributes including: a) quantity of parts required per month, b)
quantity of parts shipped per day and per month, c) number of shipping days per month, d)
supplier delivery schedule, e) regular planned down time, f) available production time, g)
number of operators per process, h) number of shifts per process,. Also, the researcher collected
the following individual metrics at each process involved: a) cycle time, b) changeover time per
shift, and c) available uptime.
Once the data was collected and ordered the researcher calculated daily requirements and
Takt time, and began to map the current state of the value stream selected. The first step was to
become familiar with the value streams symbols and then start drawing the map following the
steps mentioned in Chapter II.
After the current state map was developed, the researcher selected the appropriate metrics
based on their ability to provide specific measures for a specific operation, as well as a whole
calculation for the value stream selected. The researcher also determined how to calculate each
of the metrics selected for the entire value stream. Following is a list of the metrics selected:
1. Total value stream work-in-process inventory: The researcher calculated work-in-
process inventory between each process and added up the amounts.

29
2. Number of days of work-in-process inventory: This metric was calculated dividing
the total value stream work-in-process inventory by the daily amount of parts required
by the customer.
3. Total production cycle time: In order to determine the total cycle time the researcher
computed the cycle time for each process and then added up the amounts.
4. Total lead time within the value stream selected: To calculate total lead time, the
researcher turned to the floor shop and tracked a part from the moment which the
order was released to the time the part was delivered to the customer.
5. Cumulative available uptime: In order to determine the cumulative available uptime,
the researcher observed the available uptime for each process and then multiplied the
amounts. Available uptime for each process is determined by dividing actual
operating time by available production time. Actual operation time for each process is
determined by subtracting available production time minus changeover time.
The last step was to look at the current state map for opportunities to eliminate waste and
improve the process flow. The researcher identified as much waste as he could in the value
stream and made suggestions and recommendations to the company.

CHAPTER IV
RESULTS
The purpose of this study was to develop a value stream map for a family of resonators,
for the ATVs in a manufacturing company. This particular tool allows a company to document
current lead time, inventory levels, and cycle times to determine the ratio of value added to total
lead time of the family group selected.
In order to map the current state, the researcher observed and collected information about
material and information flow paths, process attributes, and work-in-process inventory which
helped determine metrics for each process and for the entire value stream. Data was collected
twice a week for one month on January 14th, 19th, 23rd, and 26th, 2004. This information enabled
the researcher to develop the value stream map of the process activities and helped to understand
the movement of materials and information along the value stream selected. The resulting
information could be used to identify and eliminate waste in the production process and to
produce a future state map by creating a vision of an ideal value flow.
Material Flow
The material flow begins at the receiving area as raw material and travels through the
plant until it reaches the shipping area as finished goods. The operations involved in the
production process are, in sequential order: a) receiving, b) tubing, c) stamping, d) welding, e)
painting, and f) shipping. As soon as the raw material arrives, it is moved from the receiving area
to the first operation, tubing (tube cutoff / bend) or stamping depending if the raw materials are
tubes or coils of steel respectively. After the first operation is completed, the parts are moved to
the warehouse stock area where they will be stored until needed. Then the parts will be
31
transported to the weld shop where they are assembled (welded) together to create a resonator. In
lots of 100 to 120, the resonators are then moved to the painting area. Once the resonators are
received in the painting area, they are inventoried and placed on a stockpile waiting to be
processed. The batch size for the painting process is 150 resonators. Once painted, the resonators
are moved in lots of 50 to the shipping area where they are inventoried and prepared for transit.
In order to monitor the material flow, the researcher obtained the assistance of the
company plant engineer in order to a) identify the nine resonators in the product family which a
value stream was to be created for (see table 1, chapter 3), b) determine what parts are used to
produce each of these resonators (see Appendix B), c) identify the operations involved in the
process (see Appendix C), (d) identify the work centers where the different parts are made (see
Appendix C), and (e) group and classify all the work centers in the tubing and stamping
processes since they have more than one work center whereas welding and painting only have
one work center each (see Appendix C). The criteria necessary to be considered a work center
include the use of similar machines, being located in the same physical location within the plant,
and utilizing of the same type of raw material and pattern development.
Information Flow
In order to determine the flow of information between suppliers and customers, the
researcher obtained the assistance of the company planner. The process begins when production
control receives a 12 month forecast and weekly orders via material requirement planning (MRP)
systems from customers. Then production control transmits the 12 month forecast and daily
orders to suppliers. After that, the production control transmits weekly orders to production
supervisor. The last step in the flow of information is when the production supervisor releases
daily orders to each operation within the value stream.

32
Process Attributes
The company plant engineer assisted the researcher to collect the following process
attributes which are important because they are used to calculate metrics for the entire process of
creating a resonator: daily customer requirements, Takt time, and available production time at
each process.
• Three supplier delivery shipments per day
• 20 shipping days per month
• 16,000 resonators produced per month
• Three to five raw material shipments per day
• Regular planned down time is one 15 minute lunch per shift and two 15 minute breaks
per shift
• Three eight hour shifts for all processes other than painting, which operates only one
shift.
Daily Customer Requirements
The daily requirements were determined dividing the quantity of resonators produced per
month (16,000) by the number of shipping days per month (20), resulting in 800 resonators per
day.
Takt Time
The Takt time was determined by dividing the available production time per day (1305
minutes) by the total daily quantity of resonators produced (800), resulting in 1.63 minutes.
Availability
The available production time per shift was determined by taking the total available
production time per shift, which is equal to eight hours (480 minutes), and subtracting regular

33
planned downtimes events per shift (two 15 minute breaks and 15 minute lunch); therefore the
available production time is 435 minutes per shift.
The available production time at each work center is determined by multiplying 435
minutes by the number of shifts that the work center usually operates. The total available
production time within a process was determined by adding together the available production
time at each work center involved. The tubing process is comprised of five work centers. Each of
these work centers run for three shifts (1,305 minutes), which results in 6,525 minutes available
for the entire tubing process. The stamping process is comprised of eight work centers. All these
work centers run for three shifts (1,305 minutes), which results in 10,440 minutes available for
the entire stamping process. The welding process is divided into two different robotic cells. One
robotic cell runs for three shifts (1,305 minutes) and the other for one shift (435 minutes), which
results in 2,175 minutes available for the entire welding process. As mentioned before, the
painting process is available for only one shift (435 minutes).
Individual Metrics
The following processes were used to determine individual metrics at each work center from
tubing to painting. Appendix I shows all the individual metrics collected and also includes work
centers, part numbers, and tools used.
Number of Operators
In order to determine the number of operators at each work center, the researcher asked the
production supervisor and also checked it visually. The operators were counted at each of the
work centers and those numbers were added together for each process. See Table 2 for details.

34
Cycle Time
The researcher determined cycle time by measuring the time needed to make each of the
parts involved in the production of the resonators. The instrument used to gather it was a manual
timer. The total cycle time within a process was determined by adding together each of the
individual cycle times involved (see Table 2).
Changeover Time
The total changeover time for each process was calculated by adding together each of the
individual changeover times involved. The changeover time was determined by manually timing
how long it takes the operator to setup the work center in order to make a different part. Because
the setup process includes change of tools, the researcher obtained the assistance of the company
plant engineer to collect information regarding to each of the tool used at each work center. See
Table 2 for results.
Table 2
Metrics for Each Process Process Operators Cycle Time Changeover time
Tubing 5 1.43 240
Stamping 8 5.17 2,400
Welding 10 25 30
Painting 8 145 20
Note: time is expressed in minutes

35
Available Uptime
The available uptime within a process is calculated by subtracting the changeover time
from the total availability and then dividing by the total availability. The results were a) tubing—
96%, b) stamping—77%, c) welding—99%, and d) painting—95%.
Work-in-Process (WIP) Inventory
The researcher observed that the numbers of parts varied daily due to the demand and the
availability of the work centers. From receiving to painting, the researcher collected information
at each of the work centers and between each of the processes involved for the production of the
resonators.
The researcher identified and studied all the parts used to produce each of the nine
resonators selected for improvements. It is important to note that the researcher collected data
from receiving to welding in parts and from welding to painting in resonators because that is the
form in which it was possible to collect the data. A resonator is in parts until they are welded
together to actually form one complete unit that can be considered a resonator.
In order to compare the amounts of WIP inventory throughout the entire value stream
(from receiving to painting), the researcher needed a way to translate parts into resonators and
resonators into parts. This was determined by averaging the number of parts per resonator. The
researcher determined that there was an average of 19.44 parts per resonator, with the numbers
of parts per resonator varying from 18-20. Appendix B provide specific information on the parts
required to make each of the nine resonators and Appendices E-G give detailed information on
the parts/resonators observed between the processes on each day that data was collected. Table 3
summarizes WIP in terms of resonators although from receiving to welding the units observed

36
were parts. Table 4 summarizes WIP in terms of parts even though after welding the unit
observed by the researcher was in the form of a resonator. An average of the WIP for each
process over all four days is also provided.
Table 3
WIP Inventory Between the Processes (In terms of Resonators)
Processes Day 1 Day 2 Day 3 Day 4 Average
Between Receiving and Tubing 143 0 0 154 149
Between Receiving and Stamping 67 856 642 779 759
Between Tubing and Stamping 103 0 0 114 217
Between Stamping and Welding 11,012 12,033 11,740 12,240 11,756
Between Welding and Painting 497 334 893 523 562
Between Painting and Shipping 2,493 2,499 2,066 2,986 2,511

37
Table 4
WIP Inventory Between the Processes (In terms of Parts)
Processes Day 1 Day 2 Day 3 Day 4 Average
Between Receiving and Tubing 2,788 0 0 2,987 2,888
Between Receiving and Stamping 1,300 16,647 12,477 15,136 14,753
Between Tubing and Stamping 2,000 0 0 2,213 2,107
Between Stamping and Welding 214,070 233,926 228,235 237,944 228,543
Between Welding and Painting 9,662 6,493 17,360 10,167 10,920
Between Painting and Shipping 48,464 48,581 40,163 58,047 48,814
There was no WIP inventory between receiving and tubing and between tubing and
stamping on days two and three because the work centers at the tubing process were making
parts that are not included in the value stream selected. Therefore, only the data gathered on the
first and fourth days were used in the average.
The amount of WIP inventory on day one between the receiving and stamping process
was low compared to the other days because on day one the plant ran just two shifts and the
work centers involved at the stamping process were making parts that were not included in the
value stream selected. Therefore, the average between these processes was determined based just
on the data obtained on the second through the fourth days.

38
Metrics for the Entire Value Stream
Once the data was collected, organized, and analyzed the researcher calculated the
following metrics for the entire value stream: cumulative available uptime, total WIP inventory,
total product cycle time, and total lead time.
Cumulative Available Uptime
The cumulative available uptime, which is the total available uptime for the entire value
stream, was determined by multiplying the available uptimes for each of the processes (96% *
77% * 99% * 95%) which results in a cumulative uptime of 70%.
Total Value Stream WIP Inventory
The total WIP inventory was determined from table 3, by adding up WIP inventory
between each process resulting in a total of 15,954 resonators within the entire value stream.
Total Value Stream Days of WIP
The total days of WIP within the value stream was determined by dividing the number
total value stream WIP (15,954) by the daily amount of parts required by the customer (800
parts), resulting in 20 days.
Total Product Cycle Time
The total production cycle time was calculated by adding up the cycle time determined
previously (table 2) for each of the processes, resulting in 177 minutes.
Lead Time
To estimate the lead time (the transformation from a finished product from raw material)
within the value stream selected, the researcher turned to the shop floor and tracked one part

39
from the moment it was released to the production floor until the end items were delivered to the
customer. The part selected randomly for this purpose was the part number 5243516 (Cap-
Exhaust End). The order was released to the supplier on January 20th and the end items were
delivered to the customer on February 8th. The result was 461 hours or 19 days, which means it
takes at least this long to complete a customer order (see Appendix I).
Conclusion
The preceding information all led to the result of this project, the value stream map for
XYZ manufacturing company, which follows in Figure 7. From the map, the researcher
evaluated where waste occurs in the process and will be making observations and
recommendations on how to make processes leaner in chapter 5.

3 shift/day 8 hours 30 minutes breaks/shift15 minutes lunch break/shift Net avail. Time/shift=435 min
16,000 parts/month800 parts/day
Daily DailyDaily Daily
759
C/T= 1.43 min C/T= 5.17 min C/T= 25 min C/T= 145 minC/O= 240 min C/O= 2,400 min C/O= 30 min C/O= 20 minAVAIL= 6,525 min AVAIL= 10,440 min AVAIL= 2,175 min AVAIL= 435 minUPTIME= UPTIME= UPTIME= UPTIME=
1 days 0 days 15 days 1 days 3 daysmin min min min
Takt Time= 1.63 min LT = 20 days98 s TCT = 177 min
Weekly Orders
Production ControlF/C 12 Months
Weekly Weekly Orders
F/C 12 Months
Production Supervisor
149 2,511
TUBING STAMPING WELDING PAINTING
5 8 10 8
217 11,756 562
96% 77% 99% 95%
1.43 5.17 25 145
RECEIVING SHIPPING
Figure 7. Value Stream map for resonators.
40

CHAPTER V
DISCUSSION
The purpose of this study was to develop a value stream map for a family of resonators
for the ATVs in a manufacturing company. This particular tool allows a company to document
current lead time, inventory levels, and cycle times to determine the ratio of value added to total
lead time of the family group selected. To identify wastes in the process and evaluate areas for
improvement, the researcher examined the current state map that was produced as a result of the
study.
Observations
It was found that the time it takes to make one part, or the total product cycle time for the
value stream, was 177 minutes. However, the total lead time, which is the time to make a raw
material into a finished product, was 20 days. The lead time (20 days) minus the cycle time (177
minutes) is the non-value-added activities such as setting up machines, moving materials, and
waiting for materials. This indicates that there is much opportunity for improvement.
The result obtained from the cumulative available uptime reflects that the company is
spending an enormous amount of time in setting up the machines. Uptime issues at the stamping
process are affecting the results of the total value stream and could be the cause for delays on
delivery of orders, and also the reason high inventories are kept between the stamping and
welding process. The researcher observed that each operator runs the work center in different
ways and that the operators change the tools in different ways, spending between one to two
hours to set up the work center. The speed of the process depends of the skills of each operator.

42
The total number of days of work-in-process inventory is approximately close to the
production lead time, which means that the company keeps on hand a safety inventory that is
enough to satisfy customer demand during the lead time. If the company had a shorter lead time,
that would result in less safety inventory and less funds tied up in inventory.
Some of the parts that were initiated on January 23rd were still incomplete and remained
at the stamping process for three days. This event occurred because the work center did not have
an operator available to run the press. Also, many of the work centers were not running for the
reason that they had mechanical problems due to poor maintenance.
Once the parts were made, they spent too much waiting time before they were moved to
the next operation. The researcher observed poor communication either between the machine
operators and production supervisor or between the machine operators and forklift operators.
A lot of defective parts were placed anywhere around the stamping and welding
processes; there was no specific place to put defective materials. Overall, the place seemed to be
fairly dirty and disorganized.
Recommendations
In order to improve the entire production process for the value stream selected, the
researcher made the following recommendations.
In order to reduce the changeover time at the stamping process the researcher suggested
the application of quick changeover/setup reduction techniques. This setup reduction technique is
based on the principles of the single minute exchange dies (SMED) system to dramatically
reduce or eliminate changeover time. The systematic process includes analyzing a changeover,
43
then applying quick changeover techniques and strategies to reduce the machine and/or line
downtime. Some examples that could be utilized in this situation include
• Utilizing a multi-die function reducing the number of setups per part.
• Setting tools close to the work center, reducing the time that the operator spends looking
for the tools.
• Standardization of the setup operations, so each operator must perform the setup in the
same way and must run the work center similarly.
• Establishing a standard time to perform a setup. By this approach every operator must
perform the setup of the work center in the same period of time.
• Because some tools can produce different parts, the company should take advantage of
that and produce all the parts the tool can produce at once.
In order to improve communications, the researcher suggested the utilization of a visual
control system, as mentioned in chapter 2. Some of the techniques that could be applied include
call lights and Andon board lights, standard operations sheets, digital display panels, and a
monitor screen and clock at each work center. Call lights and Andon board lights could be used
to call immediately for a supervisor or general workers for different types of assistance (e.g.
move material, problem in the line, etc). Standard operations sheets could be used for the first
line supervisors to eliminate unnecessary inventory and workers and to eliminate accidents and
defective production. These sheets measure all three elements (cycle time, a standard operation
routine, and a standard amount of work-in-process) every certain period of time. Digital display
panels are another recommendation which would normally be used to show the pace of
44
production (Takt time), the day of production and the number of units that has been produced
during the day. This would inform every person at the plant about exactly at what rate they must
be working in order to satisfy customer demand. Another recommendation is to implement a
monitor screen at each work center showing the parts’ specifications, a drawing, steps to
assemble, etc. Last, setting clocks at each work center in order to determine how much time an
operator is spending to set it up would be beneficial.
In order to reduce waiting time between each operation, the researcher suggested the
utilization of Kanban systems. As mentioned, a Kanban is a tool to achieve just-in-time. It
consists of a card containing all the information that is required to be done on a product at each
stage along its path to completion and which parts are needed at subsequent processes. By the
utilization of this tool the parts can be moved quickly from one work center to another,
improving the material flow and reducing the work-in-process between processes.
In order to increase the capacity of the plant without capital investments and also to avoid
unplanned equipment downtime, the researcher suggested the implementation of total productive
maintenance (TPM), which is a process to increase the efficiency as well the useful life of the
equipment involved. One of the key elements of this technique is employee involvement, so each
operator must take care of the work center he or she operates, maintain it, and report any damage
as it occurs.
In order to improve the housekeeping the researcher suggested the implementation of 5S
techniques for the workplace standardization and organization, especially at the stamping and
welding processes. As mentioned, this technique includes the implementation of five steps:

45
remove all unneeded items, create locations for the needed items, keep everything clean after
utilization, set standards and procedures, and employee involvement.
The goal of this study was to collect necessary information and develop a value stream
map for a family of resonators for ATVs in a manufacturing company. The value stream map
served as a tool for the researcher to make observations and recommendations to improve
processes at the company. It is hoped that the company implements these recommendations and
improves operations as a result.

46
References
Corner, G. (2001). Lean manufacturing for the small shop. Dearborn, MI: Society of
Manufacturing Engineers.
Feld, W. (2000). Lean manufacturing: Tools, techniques, and how to use them. Boca Raton, FL:
St. Lucie Press
Ford, H., & Samuel, C. (1922). My life and work. New York, NY: Doubleday, Page and
Company.
Levinson, W., & Rerick, R. (2002). Lean enterprise: A synergistic approach to minimizing
waste. Milwaukee, WI: ASQ Quality Press.
Liker, J. (1997). Becoming lean: Inside stories of U. S. manufacturers. Portland, OR:
Productivity Press.
Monden, Y. (1993). Toyota production system: An integrated approach to just-in-time. Norcross,
GA: Industrial Engineering and Management Press.
Nahmias, S. (1997). Production and operation analysis. Chicago, IL: Irwin.
Najarian, G. (2000). Just in time: Organizing in product work cells. Retrieved January 8, 2004,
from http://www.remgrp.com/jitarticle.htm
Ohno, T. (1988). Toyota production system: Beyond large-scale production. Cambridge, MA:
Productivity Press.
Tapping, D., Luyster, T., & Shuker, T. (2002). Value stream management: Eight steps to
planning, mapping, and sustaining lean improvements. New York, NY: Productivity
Press.
Womack, J., & Jones, D. (1996). Lean thinking: Banish waste and create wealth in your
corporation. New York, NY: Simon & Schuster.

47
Appendix A
Details of a Resonator

Appendix B
Quantity of Parts per Resonator
Resonator number Part number Part name
1260968 1260989 1261006 1261042 1261082 1261182 1261215 1261223 12612701260555 Weld-cone arrestor 1 1 - 1 1 1 1 1 -1260556 Weld-end cap. Rear 1 1 - 1 1 1 1 1 -1260793 Asm-small cleanout 1 1 1 1 1 1 1 1 15211408 Tab-swirl chamber 2 2 2 2 2 2 2 2 25220609 Baffle-w/center 1 1 1 1 1 1 1 1 15220623 Tube-swirl chamber 1 1 1 1 1 1 1 1 15220760 Arrestor-spark - - 1 - - - - - 15222491 Cone-percussion - - - - - - - - -5222492 Tube-baffle 1 1 - 1 1 1 1 1 -5222493 Baffle-11 hole 1 1 - 1 1 1 1 1 -5222494 Baffle-9 hole 1 1 1 1 1 1 1 1 15222496 Cap-end rear - - 1 - - - - - 15224543 Outlet-muffler 1 1 - 1 1 1 1 1 -5224850 Outlet-muffler - - 1 - - - - - 15241201 Shell-perforated 1 1 1 1 1 1 1 1 15241203 Can-spark arrestor 1 1 1 1 1 1 1 1 15241522 Bracket-muffler top - - - 2 - - - 2 25241742 Hook-spring 2 2 2 2 2 2 2 2 25242001 Bracket-silencer - 2 2 - 2 - - - -5243516 Cap-exhaust end 1 - - - - 1 1 - -5243519 Cap-silencer inlet - 1 1 - 1 - - - -5243644 Bracket-silencer 1 - - - - 1 - - -5244005 Bracket- silencer - - - - - 1 - - -
48

Appendix B (Continued)
Quantity of Parts per Resonator
Resonator number Part number Part name
1260968 1260989 1261006 1261042 1261082 1261182 1261215 1261223 12612705244188 Cap-exhaust end - - - 1 - - - - -5244780 Cap-exhaust end - - - - - - - 1 15246241 Bracket-can front - - - - - - 1 - -5246242 Bracket-can rear - - - - - - 1 - -5333057 Tube-muffler center 1 1 1 1 1 1 1 1 15811143 Packing-glass 1 1 1 1 1 1 1 1 1
Total parts 19 20 18 20 20 20 20 20 18
Note. Dashes indicate that the part is not contained by the resonator.
49

50
Appendix C
Sequence of Operations and Work center per Part
Number Part name Operation Description of operation WC Process5211408 Tab-swirl chamber 0020 Progressive complete PL104 Stamping5220609 Baffle-w/center Hole 0020 Progressive complete PL112 Stamping5220623 Tube-swirl chamber 0020 Progressive complete PL130 Stamping5220760 Arrestor-spark 0020 Progressive complete PL112 Stamping5222491 Cone-percussion 0020 Progressive complete PL104 Stamping5222492 Tube-baffle 0020 Progressive complete PL110 Stamping5222493 Baffle-11 hole 0020 Progressive complete PL112 Stamping5222494 Baffle-9 hole 0020 Progressive complete PL112 Stamping5222496 Cap-end rear 0020 Progressive complete PL126 Stamping
0020 Bend PL261 Tubing5224543 Outlet-muffler 0040 Pierce PL250 Stamping0020 Bend PL231 Tubing0040 Saw cut and deburr PL239 Tubing5224850 Outlet-muffler 0060 Vibratory deburr PL602 Tubing
5241201 Shell-perforated 0020 Blank and pierce PL110 Stamping5241203 Can-spark arrestor 0020 Blank and pierce PL110 Stamping5241522 Bracket-muffler top 0020 Progressive complete PL130 Stamping5242001 Bracket-silencer hanger 0020 Progressive complete PL104 Stamping
0020 Pierce, blank and form PL112 Stamping5243516 Cap-exhaust end 0040 Form outer flange PL104 Stamping0020 Pierce, blank and form PL112 Stamping5243519 Cap-silencer inlet 0040 Form outer edge PL104 Stamping0020 Progressive complete PL112 Stamping5243644 Bracket-silencer bottom 0040 Secondary cutoff PL155 Stamping
5244005 Bracket- silencer 0020 Progressive complete PL130 Stamping0020 Pierce, blank and form PL112 Stamping5244188 Cap-exhaust end 0040 Form complete PL104 Stamping0020 Pierce, blank and form PL112 Stamping5244780 Cap-exhaust end 0040 Form complete PL104 Stamping
5246241 Bracket-can front 0020 Progressive complete PL126 Stamping5246242 Bracket-can rear 0020 Progressive complete PL126 Stamping
0020 3L cutoff PL244 Tubing5333057 Tube-muffler center 0040 Flare PL249 Stamping
Note. WC = Workcenter; PL = product line; 0020 = first operation; 0040 = second operation; 0060 = third
0peration.

51
Appendix D
Data Collected Day 1
Table D1
WIP Inventory Between Receiving and Tubing Processes for Day 1
Part number Description WIP
5224543 Outlet-muffler 2,788 Total 2,788
Table D2
WIP Inventory Between Receiving and Stamping Processes for Day 1
Part number Description WIP
5243519 Cap-silencer inlet 1,300 Total 1,300
Table D3
WIP Inventory Between Tubing and Stamping Processes for Day 1
Part number Description WIP
5224543 Outlet-muffler 2,000 Total 2,000

52
Table D4
WIP Inventory Between Stamping and Welding Processes for Day 1
Part number Description WIP 1260793 Asm-small cleanout 176 5211253 Baffle 10,801 5211408 Tab-swirl chamber 76,233 5220609 Baffle-w/center hole 15,112 5220623 Tube-swirl chamber 6,490 5220760 Arrestor-spark 11,880 5222491 Cone-percussion 8,429 5222492 Tube-baffle 4,414 5222493 Baffle-11 hole 3,468 5222494 Baffle-9 hole 6,714 5222496 Cap-end, rear 10,478 5224543 Outlet-muffler 319 5224850 Outlet-muffler 1,198 5241201 Shell-perforated 6,399 5241203 Can-spark arrestor 5,585 5241391 Bracket-silencer 0 5241522 Bracket-muffler, top 12,145 5241742 Hook-spring 1,072 5242001 Bracket-silencer hanger 1,727 5243516 Cap-exhaust end 1,451 5243519 Cap-silencer inlet 218 5243644 Bracket-silencer,bottom,trailboss 1,835 5244005 Bracket-silencer 1,297 5244188 Cap-Exhaust,End.486od X 1.77id 2,889 5244780 Cap-Exhaust,End,4.86odx1.93id 2,421 5246241 Bracket-can, front 320 5246242 Bracket-can, rear 5,258 5333057 Tube-muffler, center 12,678 5811143 Packing-glass 3,063
Total 214,070

53
Table D5
WIP Inventory Between Welding and Painting Processes for Day 1
Part number Description WIP 1260968 Weld-silencer, Trail Boss 0 1260989 Weld-silencer 0 1261006 Weld-silencer 283 1261042 Weld-exhaust silencer 147 1261082 Weld-silencer 25 1261182 Weld-silencer, Trail Boss 3 1261215 Weld-silencer 0 1261223 Weld-exhaust silencer, 700 0 1261270 Weld-exhaust silencer 39
Total 497
Table D6
WIP Inventory Between Painting and Shipping Processes for Day 1
Part number Description WIP 1260968 Weld-silencer, Trail Boss 9 1260989 Weld-silencer 8 1261006 Weld-silencer 133 1261042 Weld-exhaust silencer 265 1261082 Weld-silencer 318 1261182 Weld-silencer, Trail Boss 1 1261215 Weld-silencer 4 1261223 Weld-exhaust silencer, 700 1,755 1261270 Weld-exhaust silencer 0
Total 2,493

54
Appendix E
Data Collected Day 2
Table E1
WIP Inventory Between Receiving and Stamping Processes for Day 2
Part number Description WIP
5241201 Shell-perforated 10,647 5222496 Cap-end rear 6,000
Total 16,647
Table E2
WIP Inventory Between Stamping and Welding Processes for Day 2
Part Number Description WIP 1260793 Asm-small cleanout 0 5211253 Baffle 8,686 5211408 Tab-swirl chamber 70,993 5220609 Baffle-w/center hole 12,342 5220623 Tube-swirl chamber 9,387 5220760 Arrestor-spark 9,110 5222491 Cone-percussion 6,314 5222492 Tube-baffle 21,392 5222493 Baffle-11 hole 7,273 5222494 Baffle-9 hole 10,019 5222496 Cap-end, rear 7,858 5224543 Outlet-muffler 2,850 5224850 Outlet-muffler 673 5241201 Shell-perforated 3,779 5241203 Can-spark arrestor 9,845 5241391 Bracket-silencer 0 5241522 Bracket-muffler, top 7,778 5241742 Hook-spring 0 5242001 Bracket-silencer hanger 8,548

55
Table E2 (Continued)
WIP Inventory Between Stamping and Welding Processes for Day 2
Part number Description WIP 5243516 Cap-exhaust end 2,041 5243519 Cap-silencer inlet 2,644 5243644 Bracket-silencer,bottom,trailboss 1,218 5244005 Bracket-silencer 680 5244188 Cap-Exhaust,End.486od X 1.77id 1,392 5244780 Cap-Exhaust,End,4.86odx1.93id 3,510 5246241 Bracket-can,front 2,020 5246242 Bracket-can,rear 5,258 5333057 Tube-muffler, center 14,573 5811143 Packing-glass 3,743 Total 233,926
Table E3
WIP Inventory Between Welding and Painting Processes for Day 2
Part number Description WIP 1260968 Weld-silencer, Trail Boss 0 1260989 Weld-silencer 0 1261006 Weld-silencer 0 1261042 Weld-exhaust silencer 263 1261082 Weld-silencer 1 1261182 Weld-silencer, Trail Boss 68 1261215 Weld-silencer 1 1261223 Weld-exhaust silencer, 700 0 1261270 Weld-exhaust silencer 1
Total 334

56
Table E4
WIP Inventory Between Painting and Shipping Processes for Day 2
Part number Description WIP 1260968 Weld-silencer, Trail Boss 9 1260989 Weld-silencer 8 1261006 Weld-silencer 21 1261042 Weld-exhaust silencer 1,209 1261082 Weld-silencer 174 1261182 Weld-silencer, Trail Boss 165 1261215 Weld-silencer 4 1261223 Weld-exhaust silencer, 700 880 1261270 Weld-exhaust silencer 29
Total 2,499

57
Appendix F
Data Collected Day 3
Table F1
WIP Inventory Between Receiving and Stamping Processes for Day 3
Part number Description WIP
5244188 Cap-exhaust end 4,464 5243516 Cap-exhaust end 2,180 5222493 Baffle-11 hole 850 5220760 Arrestor-spark 5,000
Total 12,477
Table F2
WIP Inventory Between Stamping and Welding Processes for Day 3
Part Number Description WIP 1260793 Asm-small cleanout 0 5211253 Baffle 5,892 5211408 Tab-swirl chamber 64,709 5220609 Baffle-w/center hole 14,950 5220623 Tube-swirl chamber 6,095 5220760 Arrestor-spark 5,818 5222491 Cone-percussion 20,209 5222492 Tube-baffle 18,598 5222493 Baffle-11 hole 4,479 5222494 Baffle-9 hole 6,877 5222496 Cap-end, rear 10,829 5224543 Outlet-muffler 56 5224850 Outlet-muffler 1,545 5241201 Shell-perforated 7,693 5241203 Can-spark arrestor 6,695 5241391 Bracket-silencer 0 5241522 Bracket-muffler, top 12,751

58
Table F2 (Continued)
WIP Inventory Between Stamping and Welding Processes for Day 3
Part number Description WIP 5241742 Hook-spring 0 5242001 Bracket-silencer hanger 7,604 5243516 Cap-exhaust end 1,645 5243519 Cap-silencer inlet 2,167 5243644 Bracket-silencer,bottom,trailboss 822 5244005 Bracket-silencer 3,063 5244188 Cap-Exhaust,End.486od X 1.77id 709 5244780 Cap-Exhaust,End,4.86odx1.93id 1,919 5246241 Bracket-can,front 2,020 5246242 Bracket-can,rear 5,258 5333057 Tube-muffler, center 11,431 5811143 Packing-glass 3,743 Total 228,235
Table F3
WIP Inventory Between Welding and Painting Processes for Day 3
Part number Description WIP 1260968 Weld-silencer, Trail Boss 0 1260989 Weld-silencer 0 1261006 Weld-silencer 0 1261042 Weld-exhaust silencer 114 1261082 Weld-silencer 153 1261182 Weld-silencer, Trail Boss 16 1261215 Weld-silencer 1 1261223 Weld-exhaust silencer, 700 460 1261270 Weld-exhaust silencer 149
Total 893

59
Table F4
WIP Inventory Between Painting and Shipping Processes for Day 3
Part number Description WIP 1260968 Weld-silencer, Trail Boss 9 1260989 Weld-silencer 8 1261006 Weld-silencer 21 1261042 Weld-exhaust silencer 222 1261082 Weld-silencer 206 1261182 Weld-silencer, Trail Boss 305 1261215 Weld-silencer 4 1261223 Weld-exhaust silencer, 700 1,062 1261270 Weld-exhaust silencer 229
Total 2,066

60
Appendix G
Data Collected Day 4
Table G1
WIP Inventory Between Receiving and Tubing Processes for Day 4
Part number Description WIP
5224543 Outlet-muffler 2,987 Total 2,987
Table G2
WIP Inventory Between Receiving and Stamping Processes for Day 4
Part number Description WIP
5220623 Tube-swirl chamber 9,523 5241203 Can-spark arrestor 942 5222493 Baffle-11 hole 2,007 5244188 Cap-exhaust end 2,664
Total 15,136
Table G3
WIP Inventory Between Tubing and Stamping Processes for Day 4
Part number Description WIP
5224543 Outlet-muffler 2,213 Total 2,213

61
Table G4
WIP Inventory Between Stamping and Welding Processes for Day 4
Part Number Description WIP 1260793 Asm-small cleanout 212 5211253 Baffle 5,236 5211408 Tab-swirl chamber 63,179 5220609 Baffle-w/center hole 14,183 5220623 Tube-swirl chamber 9,328 5220760 Arrestor-spark 10,310 5222491 Cone-percussion 19,553 5222492 Tube-baffle 17,942 5222494 Baffle-9 hole 6,112 5222496 Cap-end, rear 10,064 5224543 Outlet-muffler 23 5224850 Outlet-muffler 1,436 5241201 Shell-perforated 6,928 5241203 Can-spark arrestor 8,310 5241391 Bracket-silencer 0 5241522 Bracket-muffler, top 12,533 5241742 Hook-spring 1,152 5242001 Bracket-silencer hanger 7,240 5243516 Cap-exhaust end 3,352 5243519 Cap-silencer inlet 1,985 5243644 Bracket-silencer,bottom,trailboss 665 5244005 Bracket-silencer 2,906 5244780 Cap-Exhaust,End,4.86odx1.93id 1,810 5246241 Bracket-can,front 1,703 5246242 Bracket-can,rear 4,941 5333057 Tube-muffler, center 10,666 5811143 Packing-glass 4,236 Total 237,944

62
Table G5
WIP Inventory Between Welding and Painting Processes for Day 4
Part number Description WIP 1260968 Weld-silencer, Trail Boss 0 1260989 Weld-silencer 0 1261006 Weld-silencer 134 1261042 Weld-exhaust silencer 114 1261082 Weld-silencer 20 1261182 Weld-silencer, Trail Boss 136 1261215 Weld-silencer 118 1261223 Weld-exhaust silencer, 700 0 1261270 Weld-exhaust silencer 1
Total 523
Table G6
WIP Inventory Between Painting and Shipping Processes for Day 4
Part number Description WIP 1260968 Weld-silencer, Trail Boss 9 1260989 Weld-silencer 209 1261006 Weld-silencer 21 1261042 Weld-exhaust silencer 126 1261082 Weld-silencer 267 1261182 Weld-silencer, Trail Boss 342 1261215 Weld-silencer 204 1261223 Weld-exhaust silencer, 700 1,322 1261270 Weld-exhaust silencer 486
Total 2,986

63
Appendix H
Individual Metrics Collected
Process Part number Operators WC C/T (min) Tool C/O (min)5224543 1 PL-261 0.21 9280678 60 5224850 1 PL-231 0.24 9121682 60 5224850 1 PL-239 0.75 - 30 5224850 1 PL-602 0.12 - 30
Tubing
5333057 1 PL-244 0.11 - 60 5211408 0.08 9121424 90 5222491 0.08 9113225 90 5242001 0.08 9121517 90 5243516 0.08 9121193 5243519 0.08 9121193 90
5244188 0.08 9122194 90 5244780
1 PL-104
0.08 9122349 90 5222492 0.21 9121474 1205241201 0.21 9121786 1205241203
1 PL-110 0.21 9121782 120
5220609 0.21 9122361 1205220760 0.21 9120849 1205222493 0.21 9121902 5222494 0.21 9121902 120
5243516 0.21 9121901 5243519 0.21 9121901 5244780 0.21 9121901
120
5243644 0.21 9121952 5244188
1 PL-112
0.21 9121952 120
5222496 0.05 9122284 1205246241 0.05 9122562 1205246242
1 PL-126 0.05 9122563 120
5220623 0.21 9122467 1205241522 0.21 9121196 1205244005
1 PL-130 0.21 9122135 120
5243644 1 PL-155 0.13 9122035 90 5333057 1 PL-249 0.14 9120499 30
Stamping
5224543 1 PL-250 1.00 9415008 60
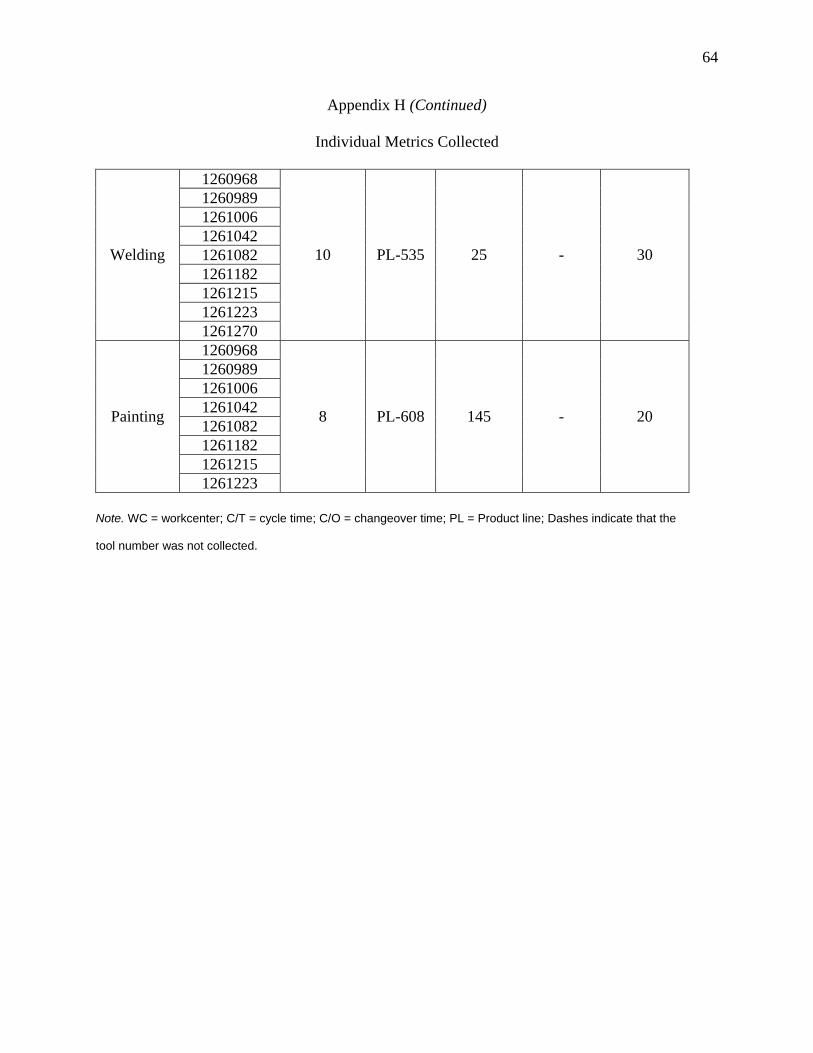
64
Appendix H (Continued)
Individual Metrics Collected
1260968 1260989 1261006 1261042 1261082 1261182 1261215 1261223
Welding
1261270
10 PL-535 25 - 30
1260968 1260989 1261006 1261042 1261082 1261182 1261215
Painting
1261223
8 PL-608 145 -
20
Note. WC = workcenter; C/T = cycle time; C/O = changeover time; PL = Product line; Dashes indicate that the
tool number was not collected.
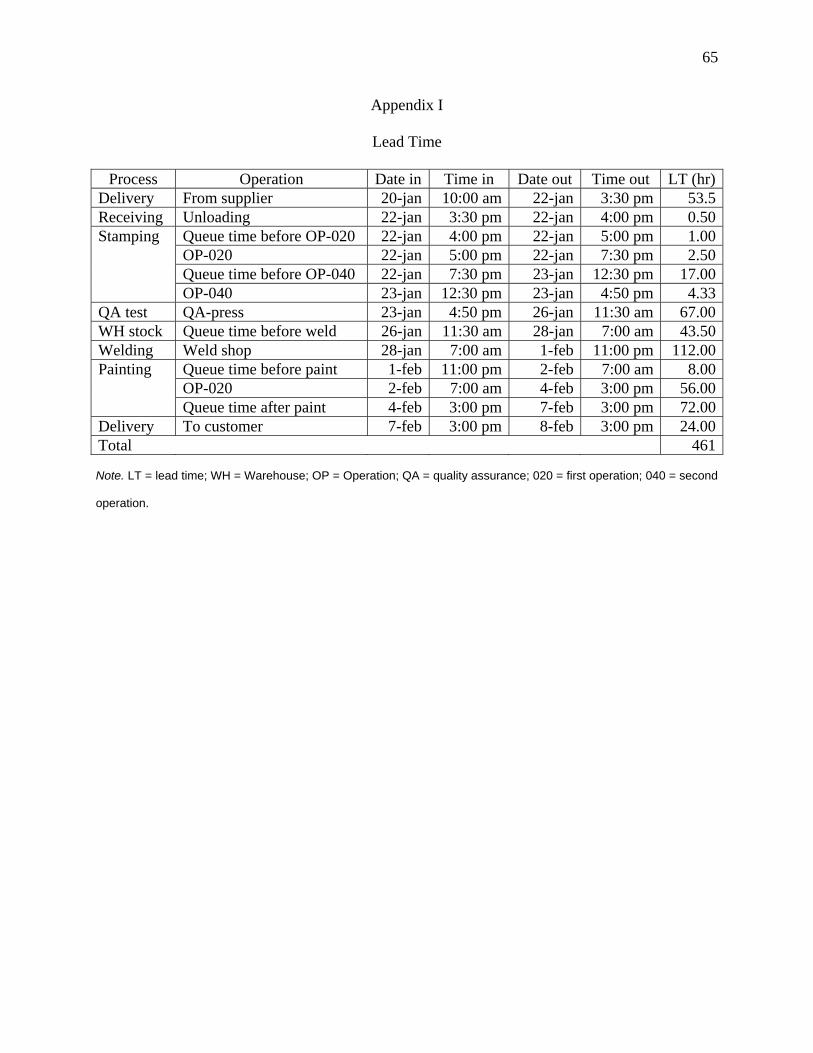
65
Appendix I
Lead Time
Process Operation Date in Time in Date out Time out LT (hr)Delivery From supplier 20-jan 10:00 am 22-jan 3:30 pm 53.5Receiving Unloading 22-jan 3:30 pm 22-jan 4:00 pm 0.50
Queue time before OP-020 22-jan 4:00 pm 22-jan 5:00 pm 1.00OP-020 22-jan 5:00 pm 22-jan 7:30 pm 2.50Queue time before OP-040 22-jan 7:30 pm 23-jan 12:30 pm 17.00
Stamping
OP-040 23-jan 12:30 pm 23-jan 4:50 pm 4.33QA test QA-press 23-jan 4:50 pm 26-jan 11:30 am 67.00WH stock Queue time before weld 26-jan 11:30 am 28-jan 7:00 am 43.50Welding Weld shop 28-jan 7:00 am 1-feb 11:00 pm 112.00
Queue time before paint 1-feb 11:00 pm 2-feb 7:00 am 8.00OP-020 2-feb 7:00 am 4-feb 3:00 pm 56.00
Painting
Queue time after paint 4-feb 3:00 pm 7-feb 3:00 pm 72.00Delivery To customer 7-feb 3:00 pm 8-feb 3:00 pm 24.00Total 461
Note. LT = lead time; WH = Warehouse; OP = Operation; QA = quality assurance; 020 = first operation; 040 = second
operation.


