Download - Image Processing Fundamentals

Institute of Medical Engineering | Image Processing
Image ProcessingFundamentals
Lecturer: Mandy Ahlborg
Institute of Medical EngineeringUniversity of Lübeck
Director: Prof. Dr. T. M. Buzug

Institute of Medical Engineering | Image Processing
2
Image Representation – Continuous Model
𝑥1
𝑥2
𝜔 ❑12
❑❑
𝝏 𝜴
𝜴
𝜔 ❑11
❑❑𝜔 ❑2
1❑❑
𝜔 ❑22
❑❑
𝑥1
𝑥2
𝜔 ❑12
❑❑𝜔 ❑1
1❑❑𝜔 ❑2
1❑❑
𝜔 ❑22
❑❑

Institute of Medical Engineering | Image Processing
3
Image Representation - Color Spaces

Institute of Medical Engineering | Image Processing
4
Image Representation - Color Spaces
- Additive color model - Subtractive color model- For printing (with K)
- Cylindrical model

Institute of Medical Engineering | Image Processing
5
Image Representation - RGB
Red Green Blue

Institute of Medical Engineering | Image Processing
6
Image Representation - HSV
Hue Saturation Value

Institute of Medical Engineering | Image Processing
7
Image Representation - Sampling
Continuous Discrete

Institute of Medical Engineering | Image Processing
8
Image Representation - Sampling
512 x 512pixel
256 x 256pixel
128 x 128pixel
52 x 52pixel

Institute of Medical Engineering | Image Processing
9
Image Representation - Quantization
256grey level
100grey level
10grey level
2grey level

Institute of Medical Engineering | Image Processing
10
Image Representation - Discrete Model
𝑦 (𝑥)
𝑥
𝑦 (𝑥)
𝑥
𝑦 (𝑥)
𝑥
𝑦 (𝑥)
𝑥
continuous data
discrete data
sampled data
sampled and quantized data

Institute of Medical Engineering | Image Processing
11
Image Representation - Sampling & Quantization
512 x 512 pixel256 grey level
256 x 256 pixel100 grey level
128 x 128 pixel10 grey level
52 x 52 pixel2 grey level

Institute of Medical Engineering | Image Processing
12
Image Representation - Grid Types
𝑥1
𝑥2
𝜔 ❑12
❑❑
𝜴
𝜔 ❑11
❑❑𝜔 ❑2
1❑❑
𝜔 ❑22
❑❑
𝑥1
𝑥2
𝜔 ❑12
❑❑
𝜴
𝜔 ❑11
❑❑𝜔 ❑2
1❑❑
𝜔 ❑22
❑❑
Cell-centered grid Nodal grid

Institute of Medical Engineering | Image Processing
13
Image Representation - Nyquist-Shannon-Theorem
𝑥1
𝑥2
𝑥1
𝑥2
Nyquist-Shannon-Theorem fulfilled Nyquist-Shannon-Theorem not fulfilled
Institute of Medical Engineering | Image Processing
14
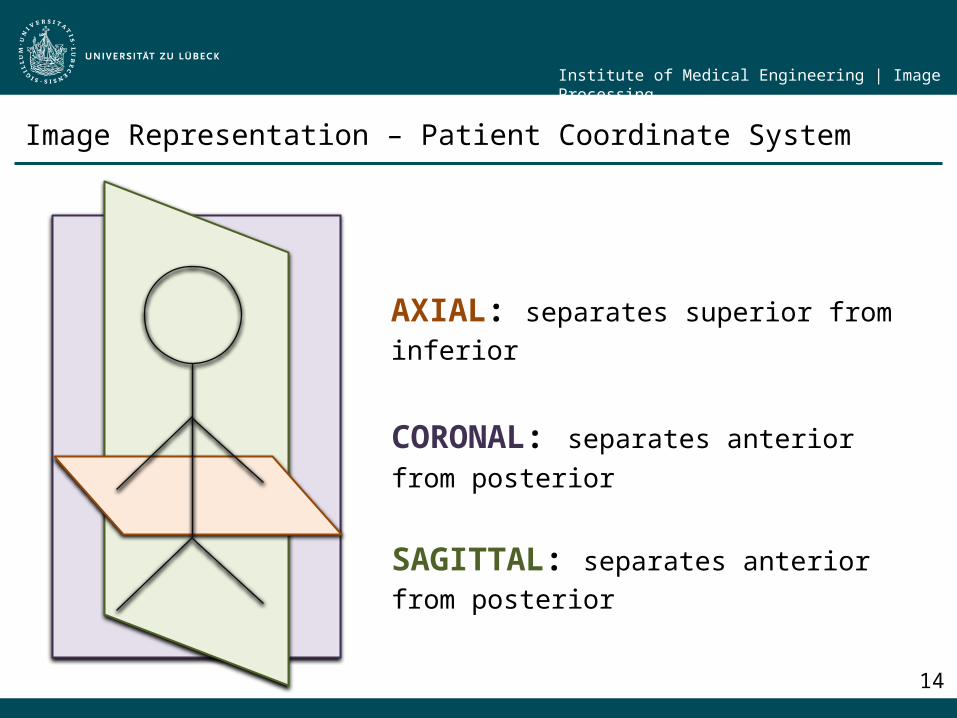
Image Representation – Patient Coordinate System
AXIAL: separates superior from inferior
CORONAL: separates anterior from posterior
SAGITTAL: separates anterior from posterior

Institute of Medical Engineering | Image Processing
15
Relationships of Pixels - Neighbors
neighbor of
4-neighbors Diagonal neighbors 8-neighbors

Institute of Medical Engineering | Image Processing
16
Relationships of Pixels - Adjacency
Let and pixels and be given. Which adjacencies hold in the following examples?
4
9 5
1
�⃗� �⃗�
4-adjecent8-adjecentm-adjacent
8-adjecentm-adjacent
(with not adjacent
8
9
1
1
8-adjecent
8
9
9
4

Institute of Medical Engineering | Image Processing
17
Relationships of Pixels - Path
1
0 10 1 0
0 01 1 1
0 0
0 00 1
0 00 0 0
0
00
no 4-path
1
0 10 1 0
0 01 1 1
0 0
0 00 1
0 00 0 0
0
00
8-path
1
0 10 1 0
0 01 1 1
0 0
0 00 1
0 00 0 0
0
00
8-path
1
0 10 1 0
0 01 1 1
0 0
0 00 1
0 00 0 0
0
00
m-path

Institute of Medical Engineering | Image Processing
18
Relationships of Pixels - Distance Metrics
Euclidean distanceManhatten distanceChebychev distance

Institute of Medical Engineering | Image Processing
19
Relationships of Pixels - Distance Metrics
𝑥1
𝑥2
𝑥1
𝑥2
𝑥1
𝑥2
Eucledean distance Manhatten distance Chebychev distance

Institute of Medical Engineering | Image Processing
20
Relationships of Pixels - Distance Maps
3 2 1 1
2 1 1
1 11
1 21 1
31 2
3 12 1
1 41 2 3
1
1
2
3
4
2
5
4
3
2
2
1
4
2
2 1 1 1
1 1 1
1 11
1 11 1
21 2
2 12 1
1 31 1 2
1
1
1
2
2
1
3
2
2
2
1
1
3
1
Manhatten distance Chebyshev distance


