
Ideologically Motivated Reasoning in Response to Information about Genetics and Race
Alexandre Morrin-Chassé (Department of Political Science, University of Montreal)
Elizabeth Suhay (Department of Government and Law, Lafayette College)
Toby Jayaratne (School of Public Health, University of Michigan)
Draft date: September 17, 2013
ABSTRACT
Previous researchers have established that political conservatives are more likely than liberals to say that perceived differences between blacks and whites may be rooted in genetics. This empirical relationship likely stems in part from the fact that genetic causes justify conservative, small government policy and environmental causes justify liberal, interventionist policy. While this is well-understood, few scholars have sought to understand whether conservatism follows from a tendency to locate the causes of socioeconomic problems “in the person” (and liberalism from a tendency to locate such causes “in the situation”) or whether, due to motivated reasoning, a tendency to identify causes as in the person or situation follows from a person’s preexisting ideological stance. In this paper, we seek to understand whether the latter phenomenon occurs with respect to genetic explanations for perceived race differences. We uncover several patterns suggestive of motivated reasoning. Drawing on survey evidence, we find that liberal-conservative differences are greater among those who pay close attention to news about genetics. Drawing on survey-experimental evidence, we find that exposure to information about genetic or environmental causes of racial difference, particularly ambiguous information, polarizes political ideologues. These findings shed light on how media communications about the causes of racial difference and political ideology can interact to polarize ideologues on beliefs about racial difference.

1
Our fundamental traits have a firm biological basis….And the more we discover how firmly ingrained our abilities, attitudes, and behaviors tend to be, the less plausible leftist social-intervention programs become.
— Jason Richwine, The American Conservative (October 2009)
[Poverty] is created anew in each generation. But not by heredity...by circumstances. Today, millions of American families are caught in circumstances beyond their control. Their children will be compelled to live lives of poverty, unless the cycle is broken. President Johnson’s War on Poverty has this one goal. To provide everyone a chance to grow and make his own way.
—“Poverty” ad created by the Lyndon Johnson presidential campaign (1964)
Throughout America’s history, there have been many instances of politics and genetic explanations
for perceived racial differences intertwining. In the nineteenth century, the institution of slavery
was justified by arguments that African Americans were well-suited to servitude because of various
innate differences from whites (Gould [1981] 1996; Kinder and Sanders 1996). The eugenics
movement, embraced by conservatives and progressives alike, was based on the belief that a wide
range of people “of color” were biologically inferior (Black 2003; Paul 1998).
While the most egregious politicized arguments about the origins of race differences (some
real and many only perceived) are many decades removed from today, such arguments have not
altogether disappeared from academic, or public, discourse. For example, The Bell Curve, written by
Richard Herrnstein and Charles Murray and published in 1994, argues that intelligence largely
determines one’s success in life, and that intelligence is largely genetic in origin. The authors go on
to discuss the fact that black and poor Americans’ IQs are lower on average than others’, also
suggesting that this gap is permanent. One implication, although not explicitly stated, seems to be
that differences in life chances between blacks and whites are driven by genes, with intelligence as

2
the mediating factor. The authors make explicit political recommendations, including the
recommendation that welfare and reproductive policies be changed in order to decrease the
number of children born to lower class (i.e., lower IQ) women (548-9).
If this book seems political in nature, the swift public reaction was even more so (see Jacoby
and Glauberman 1995). President Bill Clinton was “outraged by the thrust of the book” (Swanson
1995). The New Republic and the National Review devoted entire issues to commentary on The Bell
Curve, with commentary in the former, liberal-leaning magazine almost uniformly negative and in
the latter, conservative-leaning magazine mainly defensive of Herrnstein and Murray.
Commentators on both sides recognized the political implications of Herrnstein and Murray’s work,
and many accused the other side of political bias. For example, in the National Review, Daniel
Seligman argued that liberal critics were a “howling mob” and wanted The Bell Curve’s ideas
suppressed because they were “too threatening to their own egalitarian ideologies, which typically
depend on arguments for human malleability” (1994, 60-1). In The New Republic, Henry Louis
Gates, Jr. argued that the timing of The Bell Curve was no coincidence—it was meant to justify
cooling enthusiasm for public investment in black achievement. “If differences of intelligence…are
natural, are genetic, are ordained by God, then why bother?” (1994, 10).1
In recent decades, the politicization of arguments regarding the causes of political, social,
and economic inequality has been referred to as the “nature vs. nurture” debate (Segerstråle 2000).
Particularly when it comes to socioeconomic inequality, common wisdom suggests that political
conservatives are more likely than liberals to argue that inequality is due to innate differences
between persons and that political liberals are more likely than conservatives to argue that 1 While trends emerged, responses were not uniform according to ideological leanings of publications, e.g., The New York Times Book Review published a largely favorable review.

3
inequality stems from structural barriers or discrimination. The intense debate over The Bell Curve
offers anecdotal support for that common wisdom, and we discuss additional empirical support for
it below. The Bell Curve debate also suggests that one of the more contentious areas of the nature
vs. nurture debate is in the arena of race, the subject of this paper.
We join others in arguing that the configuration of the political debate over the causes of
racial inequality—with conservatives more likely than liberals to argue that the causes of inequality
rest “in the person”—is not accidental. Attribution theory suggests there is a logical link between
policy preferences and beliefs about the causes of social problems (Heider 1958; Weiner, Osborne,
and Rudolph 2011). We describe those specific linkages in detail below. However, attribution theory
stops short of being able to answer an important causal question underlying the link between
political ideology and causal beliefs: Which causes the other? An interpretation grounded in
expectations for rational thinking would suggest that persuasive factual evidence for either genetic
or environmental influences on perceived racial differences would influence a person’s policy
preferences. However, as the Bell Curve debate participants suspected—although, only of their
opponents!—motivated reasoning may also be at work, and may even drive the relationship.
The purpose of this paper is to explore whether politically motivated reasoning about
genetic explanations for perceived racial differences occurs among ordinary citizens today. Drawing
on work by Taber and Lodge (e.g., 2006), among others, we argue that what the public believes
about the causes of racial differences depends not only on information flows to which a person is
exposed but also on the interaction of those flows with a person’s preexisting views. People are
likely to accept information that bolsters their values and corresponds with preexisting beliefs; on
the other hand, people are likely to reject information that undermines their values or conflicts with
preexisting beliefs. In addition, exposure to contradictory information can cause boomerang effects,
4
an outcome of individuals’ efforts to shore up threatened views. Finally, motivated reasoning is
most common among knowledgeable individuals because they are more likely to (a) be exposed to
relevant information and (b) discern the political cues embedded in that information.
We expect that these basic theoretical premises operate with respect to explanations for
racial differences as they would in any other politicized domain, and we test our expectations with
two nationally representative datasets. We begin with survey data, examining whether left-right
political ideology is more predictive of a person’s beliefs about the causes of racial difference
among those who pay close attention to information on genetics in the media. We indeed find such
a pattern. However, while the pattern is strongly suggestive of motivated reasoning, the
associational nature of the data casts some doubt on our causal inferences. Therefore, we next turn
to data from a survey experiment to test our causal hypotheses more carefully. In these data, we
again find evidence of motivated reasoning, with ideologues polarizing in response to information
related to the causes of racial differences, particularly when that information is somewhat
ambiguous, leaving more room for (politically biased) interpretation.
Theoretical Framework
Group Differences, Attributions, and Politics
A great deal of racial inequality exists in the contemporary United States. For example, average
income and wealth are considerably lower, and unemployment rates higher, among African
Americans as compared to whites; black Americans do not graduate from high school and attend
college at the same rate (Massey 2008); and black Americans are more likely to be involved with the
criminal justice system (Alexander 2010). Most would agree that black inequality represents a
compelling social problem in the U.S. Attribution theorists argue that, when faced with problems

5
like this one, people often search for a solution. However, the solution perceived as best from a
pragmatic as well as a moral perspective depends in large part on what one understands the cause
of the problem to be (Heider 1958; Weiner, Osborne, and Rudolph 2011).
Weiner et al. (2011) argue that causes of social problems, such as poverty, fall into three
categories, and each category has implications for what a person might consider to be an
acceptable solution to the problem in question. The first category is “locus of control,” i.e., whether
a cause is internal (“personal”) or external (“situational”) to an actor. If individuals are to blame for
a problem, then they are perceived as having the capability and moral responsibility to change their
lives. The second category of causal attribution type is controllability. An important caveat to the
above is that specific types of internal, or personal, causes are perceived as removing individual
control. For example, if a person’s genes are thought to be the reason for a problematic
characteristic or behavior, then others are actually less likely to hold that person responsible (Dar-
Nimrod and Heine 2010) and more likely to feel pity and provide help (Weiner, Perry, and
Magnusson 1988). The third, final category is stability, and it is related to the previous category. A
lack of control at the individual or societal level is perceived as resulting in stability, i.e., an inability
for change to occur (Weiner et al. 1988). Although there are many reasons why a problem may be
beyond an individual or society’s control, most relevant to this article is the perception that genes
control behavior. Problems driven by biological causes are particularly likely to be perceived as
being uncontrollable and, therefore, immutable (Dar-Nimrod and Heine 2010; Weiner et al. 1988).
Based on attribution theory, what empirical relationships should we expect between
political ideology and explanations for racial inequality? We might begin by summarizing key
differences between political conservatism and liberalism in the United States. Political
conservatism is associated with a desire for small government and a lack of government

6
intervention in the lives of the nation’s citizenry, whereas political liberalism is associated with a
desire for government intervention to address societal problems. This general difference is most
apparent with respect to political, social, and economic inequality. Liberals tend to be more
interested than conservatives in government initiatives aimed at helping the disadvantaged and
have been particularly interested in using government to promote equality for racial and ethnic
minorities (Brewer and Stonecash 2007; Campbell, Converse, Miller, and Stokes 1960).
Given these ideological differences, there would seem to be good reason to expect
conservatives to embrace personal explanations for inequality and for liberals to embrace
situational ones. If the cause of a problem is located “in the person,” then government is not
responsible morally and, from a pragmatic perspective, is less able to correct the problem.
However, whether or not conservatives should embrace the specific “in the person” causal
explanation of genes (or, more generally, biology) is less clear. On the one hand, genetic causes are
believed by many to result in immutable characteristics (Dar-Nimrod and Heine 2011; Jayaratne et
al. 2009).2 This suggests that change is impossible and, thus, government intervention to address
inequality is likely to end in failure (Lewontin, Rose, and Kamin 1984; see Hofstadter [1944] 1992 for
a historical perspective). As Gates suggests in the introduction, if those who are lower on the
socioeconomic ladder are so because they are perceived to be inherently lower in IQ, for example,
then there would seem to be less reason to spend tax payers’ dollars on education and job
2 This is considered to be a fallacy by most experts in genomics for a variety of reasons, ranging from the existence of complicated interactions between DNA and other entities, including the environment, to the fact that many scientific claims about genetic causes are actually claims about the causes of population-level variance rather than mean levels of a characteristic.

7
training.3 On the other hand, genetic causes also imply a possible exemption from personal
responsibility, generating sympathy and suggesting help-giving may be the appropriate response.
The empirical relationship between political ideology and genetic explanations for
socioeconomic inequality—and, more specifically, racial inequality—has been the subject of
considerable inquiry. First, those with conservative policy preferences tend to locate the causes of
problems generally “in the person” and those with liberal policy preferences tend to locate the
causes of problems generally “in society” (see Morgan, Mullen, and Skitka 2010 and Weiner et al.
2011 for reviews). More specific to the subject of our inquiry, proponents of conservative policy are
more likely than others to blame blacks and the poor—as opposed to structural inequalities or
discrimination—for the fact that they experience more negative life outcomes relative to others on
average (Hunt 2007; Kinder and Sanders 1996; Kluegel and Smith 1986). Finally, with respect to
genetic (and biological) explanations more narrowly, historical research indicates that political
conservatives have “essentialized” race and class—arguing that on-average group differences are
both considerable and innate—more often than liberals (Gould [1981] 1996; Hofstadter [1944]
1992; Kevles 1985; Lewontin, Rose, and Kamin 1984; Segerstråle 2000). While there is a surprising
dearth of empirical evidence on contemporary attitudes, Suhay and Jayaratne (2013) find that
political conservatives in the U.S. are indeed at least somewhat more likely than liberals to argue
that perceived race and class differences are caused by genetic differences.
3 A related perceived implication of genetic causes is the idea is that differences due to nature are necessarily good—because they reflect the “wisdom of nature” or stem from God’s will. Thus, they should be allowed to continue (Dar-Nimrod and Heine 2011; Lewontin et al. 1984).

8
Motivated Reasoning
A variety of literature clearly indicates that there likely exists a correlation between political
ideology and the belief (or rejection of the belief) that genes and perhaps other biological causes
contribute to racial inequality. What is less clear is why that association exists. While it is reasonable
to expect that laypeople’s exposure to information about the causes of inequality subsequently
shapes their policy preferences, academics who have analyzed the nature-nurture debate have
instead tended to view its participants through the lens of “motivated reasoning” (e.g., Hofstadter
[1944] 1992; Lewontin et al. 1984). Generally speaking, the motivated reasoning framework
suggests that preexisting values often color our interpretation of the facts (Lodge and Taber 2000;
Skitka, Mullen, Griffin, Hutchinson, and Chamberlin 2002; Taber and Lodge 2006). Lodge and Taber
(2005) write: “Those holding strong attitudes actively counterargue contrary facts, figures, and
interpretations while uncritically accepting attitudinally congruent information” (476).
Somewhat counterintuitively, this tendency is particularly strong among more
knowledgeable individuals, who are (a) more exposed to relevant information (and, thus, more
likely to have the opportunity to practice motivated reasoning) and (b) able to discern the political
and other value cues embedded in information that may be missed by a less sophisticated person.
More intuitively, the tendency to engage in motivated reasoning is also likely stronger when the
meaning of the information to which one is exposed is ambiguous (see LaMarre, Landreville, and
Beam 2009), giving a person more leeway than usual in interpreting what is being argued.
While the evidence for motivated reasoning across many domains—political and
otherwise—is strong, clear evidence of motivated reasoning in the domain of genetic explanations
for inequality, and genetic explanations for racial inequality in particular, is hard to find. Most

9
relevant is a study by Ramsey, Achter, and Condit (2001). They examined experimental evidence
that demonstrated that racially prejudiced and nonprejudiced individuals selectively incorporated
into their belief systems evidence on genetic and environmental causes of racial inequality from The
Bell Curve that would bolster their priors. More generally, Morgan, Mullen, and Skitka (2010) show
that people indeed search hard for causal attributions that will bolster their political values.
Hypotheses
Based on the above literature, we offer and test four hypotheses:
1. Liberals will be less likely than conservatives to say that they believe that perceived race
differences are due to genetics (or, more generally, are innate).
2. These liberal-conservative differences will be greater among those who pay close attention to
news about genetics.
3. Generally speaking, exposure to information about genetic or environmental causes of racial
difference will polarize political ideologues.
4. Relatively ambiguous information on genes and race (i.e., information which can be interpreted
as arguing for, or against, fundamental genetic differences between races) will be most likely to
polarize political ideologues.
To test these hypotheses, we examine data from two nationally representative studies.

10
Study 1
Methods
The first study is a large, nationally representative survey of black and white Americans conducted
in 2001 by researchers at the University of Michigan (N = 1200).4 Note that all variables included in
the analyses and discussed below have been re-coded to range from 0 to 1. The independent
variable we use is a standard five-point political ideology scale, with liberalism coded at the high
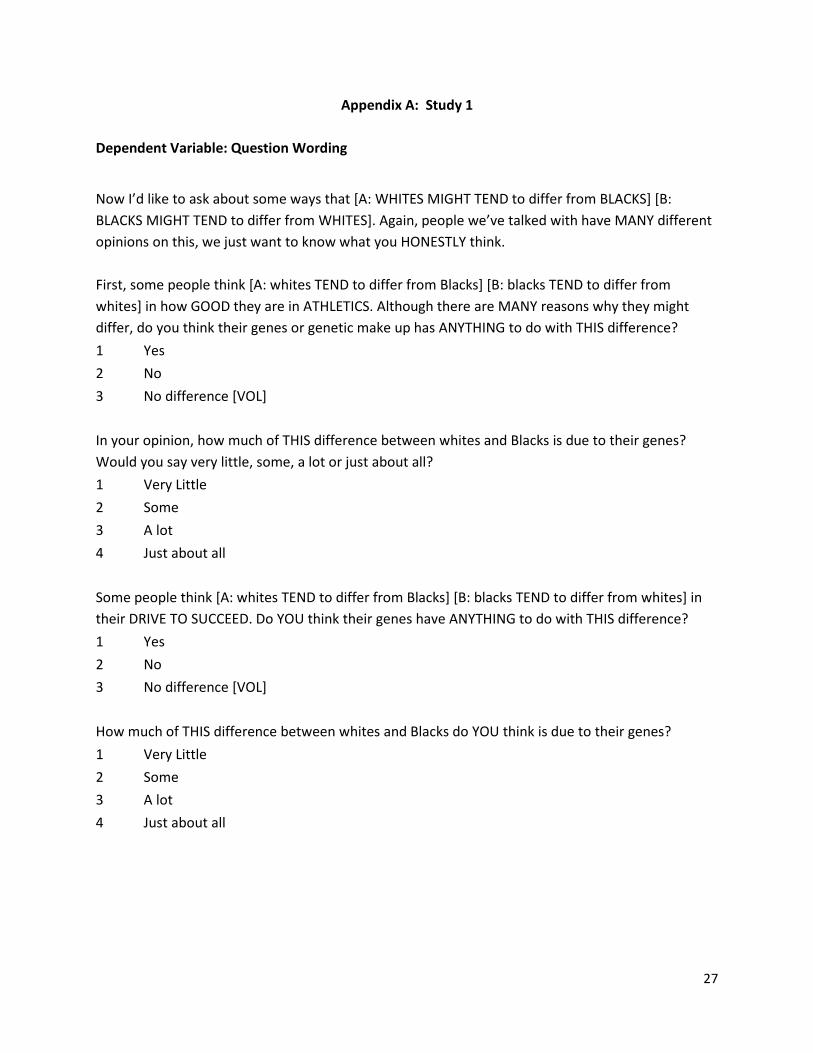
end. The dependent variable asks respondents to estimate the role of genetics in explaining
perceived racial differences on five characteristics: intelligence, mathematical ability, drive, a
tendency toward violence, and athletics.5 The resulting Genetic Attribution for Race Differences
(GARD) scale (Cronbach’s alpha = .824) is coded 0 if the respondent believes that genes play
absolutely no role in any of the five perceived differences and 1 if the respondent believes that
genes account for “just about all” of the perceived racial differences in these five traits. (See
Appendix A for exact wording of questions.) Finally, we expect that exposure to information about
4 Respondents were selected using two separate sampling methods. A main sample was obtained utilizing random-digit-dialing (RDD) methods, drawing from the continental United States (whites N = 600, blacks N = 58; AAPOR Adjusted Response Rate 3 = 31.89). In addition, an oversample of black respondents (N = 542; AAPOR Adjusted Response Rate 3 = 32.94) was obtained using RDD methods within targeted population areas of higher black density from across the United States. Although the response rate was lower than ideal, surveys with similar response rates have been shown to be representative (Pew Research Center for the People & the Press 2004). Respondents were interviewed over the phone by professionally trained interviewers. Interviews averaged 40 minutes in length. Each respondent received $15 compensation (or $20 for refusal conversions). Within each household, adult respondents were randomly selected. See Suhay and Jayaratne 2013 for additional sample details. 5 These traits were examined for two reasons. First, many Americans believe them to vary by race and class (Herrnstein and Murray 1994; Hunt 2007; Kinder and Kam 2009). Second, generally speaking, these traits have been frequently attributed to genetics in public discourse (Alper et al. 2002; Parens, Chapman, and Press 2006).

11
genetics in the media will moderate the effect of ideology on the dependent variable. This
moderating variable is as follows: “Over the past few months, how often have you read or heard
news stories about genetics in newspapers, magazines, or on TV?” Those who answered “often”
(approximately one-third) were coded into the “high exposure” category (1), and those who
answered “sometimes,” “rarely,” or “never” were coded into the “low exposure” category (0). The
statistical models also include standard controls (religiosity, household annual income, educational
attainment, age, gender, and whether the respondent self-identifies as primarily black or white)
and are weighted for race, education, and age. (The sample is already representative for gender.)
Results
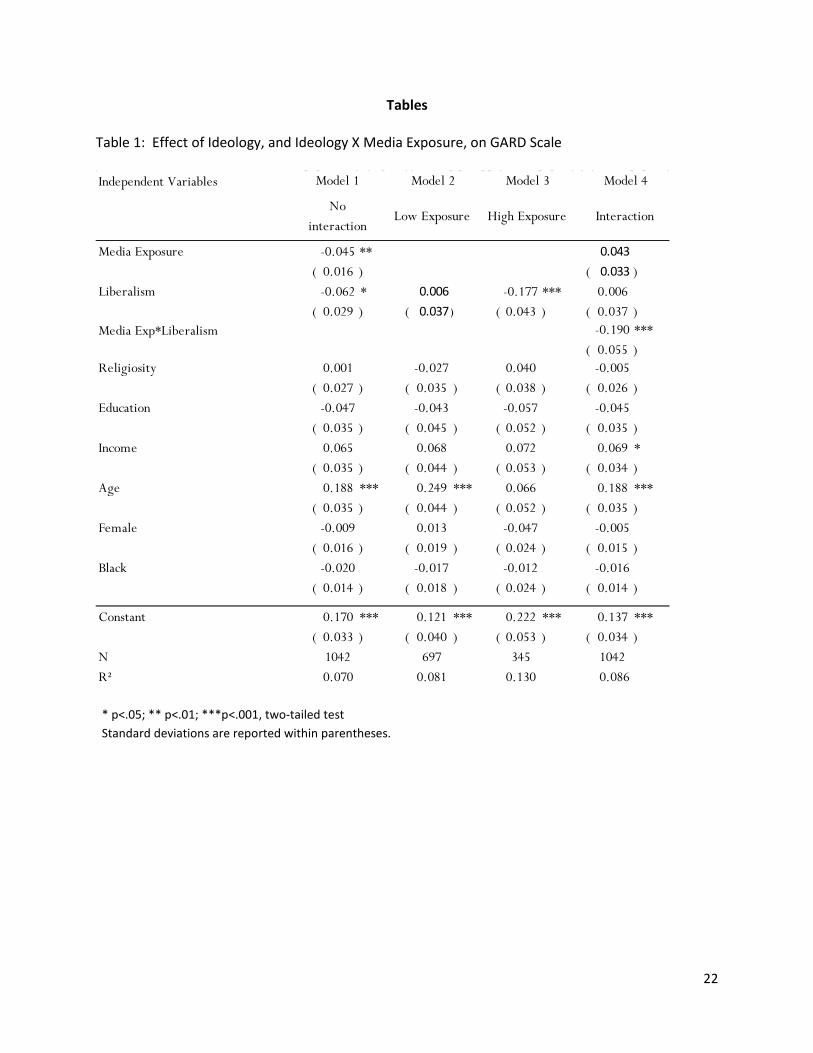
Using OLS regression, Table 1 includes four subtly different models. In the first column, we regress
the GARD scale on ideology (liberalism), exposure to genetics news, and the control variables. As
our first hypothesis predicts, liberalism is negatively associated with the GARD scale. However, if we
estimate this model separately for low and high media exposure individuals (see Models 2 and 3), it
is apparent that the negative association between liberalism and the dependent variable is
concentrated among those in the high exposure group. The coefficient on liberalism is substantively
large and statistically significant (b = -.18, p < .001, two-tailed), while the coefficient on liberalism is
nearly zero in the low exposure model (b = .006) with a standard error roughly six times its size.
[Table 1 here]
In the fourth model we formally test whether the coefficients on liberalism in the low exposure and
high exposure models are significantly different from one another. Thus, we regress the GARD scale

12
onto ideology (liberalism), exposure to genetics news, their interaction, and the control variables.6
Here, the negative and significant coefficient value associated with the interaction term (b = -0.19, p
< .001, two-tailed) confirms that the effect of ideology among respondents with high exposure to
genetics news is significantly greater (in the expected direction) than among respondents with low
exposure.7 In short, liberalism is more negatively associated with the dependent variable among
high media exposure than low media exposure individuals.
We can use these model estimates to compute the predictive margins in order to better
understand the nature of this interaction effect. Figure 1A presents the predictions resulting from
Model 4 in Table 1. The figure makes clear that high exposure conservatives are little different from
low exposure individuals; rather, it is high exposure moderates and liberals who are considerably
less likely to express genetic racial beliefs than their low exposure counterparts. This suggests that
moderates and liberals who were paying attention to media messages regarding genetics at this
time moved away from genetic explanations for perceived racial differences in response. Follow-up
analysis with ideology coded as a series of dummy variables (see Figure 1B) indicates that this effect
is approximately linear, with high-exposure respondents increasingly less likely to endorse genetic
explanations for perceived racial differences at each point on the ideology (liberalism) variable.
[Figure 1 here]
6 Note that, because of the interaction term, the media exposure and liberalism “main effects” are each evaluated when the other variable is 0 (among those with low exposure to genetics or those who are “very conservative”). 7 Note that every cell of the ideology X media exposure interaction variable contains a sufficient number of observations for reliable estimation. See the cross-tabulation in Appendix A.

13
Discussion
Results from Study 1 generally reflect our expectations. First, liberals were less likely than
conservatives to say that genes contributed to perceived racial differences. Second, this ideological
difference was only apparent among those who said they paid close attention to information about
genetics available in the media. This said, the liberal-conservative difference that emerged among
the high media exposure group was somewhat lopsided, in that moderates and liberals were
significantly lower on the GARD scale than their low exposure counterparts, whereas conservatives
in the two groups were nearly identical in their responses.
It is possible that the reason for this difference is that the particular character of
information flows at the time of the study (in 2001) created this unequal pattern (Zaller 1992). The
debate over the Bell Curve had wound down by this point. Arguably the most salient media
message at the time on genes and race was the discovery that most human genes are shared across
races and that there is much more variation within racial populations than between them. The
pattern we observe in the data may reflect (a) high exposure political liberals readily accepting this
racially progressive media message, and (b) high exposure political conservatives readily rejecting it
but not polarizing further due to the lack of a strong countervailing message.
We turn next to experimental evidence. These additional data offer several advantages.
First, relative to the associational data in Study 1, data from a controlled experiment allow us to
make more certain causal inferences regarding the interactive effect of political ideology and
information about the causes of racial difference. Second, Study 1 relies on self-reported exposure
to news related to genetics, whereas Study 2 tests the effects of actual exposure. Third, the new
data allow us to test whether the former pattern of results is maintained in a more contemporary

14
dataset. Fourth, and finally, the experimental data in Study 2 allow us to further explore the extent
to which polarization effects can vary depending on the unique character of information flows.
Study 2
Methods
The second study was included in the American National Election Survey (ANES) Web Panel of 2008-
9. In Wave 16, 733 respondents were randomly selected to participate in a framing experiment in
which they were randomly assigned to read one of four news articles (or no news article in the case
of the control group) and respond to a series of questions.8 The articles all reported on research
purportedly conducted by Bruce Firman of Columbia University and published in Nature Genetics.
The first article (Race as Genetic Reality) argues that differences in skin color and facial morphology
commonly associated with race are in fact correlated with important genetic differences between
races. The second article (Race as Social Construction) argues that there is more genetic variation
within than between races and that therefore DNA is not responsible for racial differences in
behavioral traits, such as intelligence. The third article (Racial Ancestry Test) is more ambiguous in
its racial implications. It indicates that people can trace their racial heritage through their DNA, but
that those who do so frequently find that they are of mixed racial ancestry. The fourth article (Racial
Differences in Heart Disease) reports on research suggesting that the reason why African Americans
are more prone to heart attacks than whites is because of genetic differences. The full text of these
articles is available in Appendix B. Each of the treatment groups is represented in the analyses
below by a dummy variable (1 = received treatment, 0 = did not receive treatment).
8 Phelan, Link, and Feldman (2013) recently published a prominent article on these data. We differ from these authors in our attention to different dependent variables and to the moderating role of political ideology.

15
Note that all variables included in the analyses and discussed below have been re-coded to
range from 0 to 1. In this study, ideology is measured with a seven-point scale, and the variable is
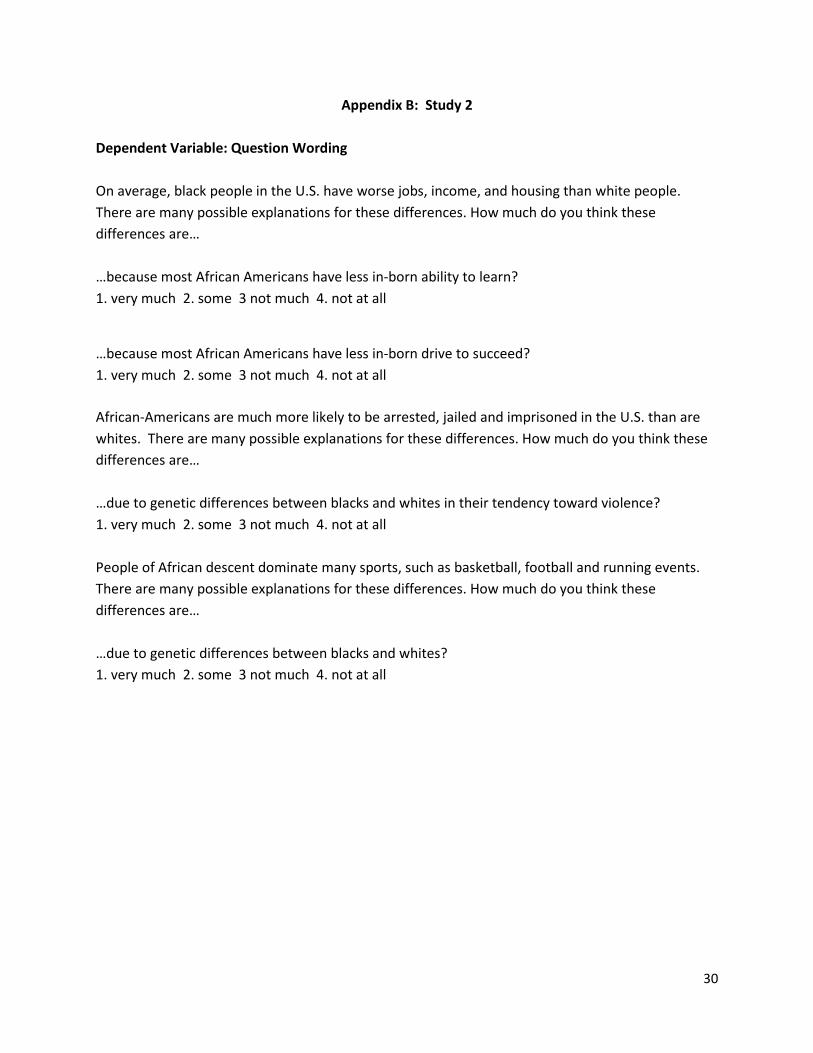
coded with liberalism at the high end.9 The dependent variable is a scale made up of averaged
responses to four questions similar to those asked as a part of Study 1: Whether respondents
believe that economic inequality associated with race is due to (1) “less in-born ability to learn” and
(2) “less in-born drive to succeed” among African Americans; (3) whether African Americans’
greater involvement with the judicial system is “due to genetic differences between blacks and
whites in their tendency toward violence”; (4) whether African Americans’ dominance in many
sports is due to “genetic differences between blacks and whites” (alpha = .747). Again, 0 represents
the belief that none of these differences are innate, and 1 represents the belief that all are innate.
Complete question wording is available in Appendix B.
Results
We begin by regressing the GARD scale on liberalism and a group of standard control variables
(religious activity, education, income, age, gender, and race/ethnicity) for each experimental group
separately. See Table 2. These simple analyses demonstrate clearly that liberalism is (a) more
negatively associated with the dependent variable when participants are exposed to information
related to genes and racial differences (compare Model 1 to the other four models), and (b) most
negatively associated with the dependent variable when participants are exposed to ambiguous
genetic information (compare Models 2 and 3 to Models 4 and 5). 9 Respondents’ ideology was collected in Waves 1, 2, 6, 10 and 11. For each participant in the experiment, we collected every valid answer he or she gave to the ideological identification question across these five waves. Our ideology variable includes the respondent’s answer in the wave that was closest to Wave 16. Out of the 717 participants in the experiment, 687 values for the ideology variable came from Wave 11 (November 5 to December 15 2008), 22 came from Wave 10 (October 2 to November 3 2008), and 8 came from Wave 6 (June 5 to August 11 2008).

16
[Table 2 here]
As in the previous analysis, it is important to assess whether the differences in the ideology
coefficients across the different experimental groups are statistically significant. To do so, we
analyze the pooled data. See Table 3. First, we regress the GARD scale on the treatment group
dummy variables (the control group is the excluded group) without interaction terms included so
that we can assess the true main effects of the treatments (see Model 1). Somewhat surprisingly,
the treatments in and of themselves do not have direct effects on the dependent variable. Second,
we add interactions between the four treatment groups and liberalism to the model (see Model
2).10 This model makes it clear that any treatment effects are in fact indirect effects—the
treatments change the relationship between ideology and the dependent variable. Relative to the
control group, three of the four treatments (all but the “Race is Real” article) appeared to polarize
participants by political ideology (at least p < .05 in the three treatment groups). As expected, the
coefficients on the interaction terms containing the two ambiguous articles are the largest.11
[Table 3 here]
If we graph the predictive margins in the same manner as we did in Study 1 (see Figure 2),
we observe two types of patterns. First, if we compare Figure 2A (Control) to Figure 2C (Race as
Social Construction), we see that moderates and liberals appear to be responding to the treatment
by changing their beliefs, but conservatives are not (they are more likely to resemble control group
conservatives). However, a different pattern emerges in Figures 2D and 2E, depicting estimates
10 While article exposure is randomized in the experimental design, the moderator ideology is an observed variable. This is why control variables are included in the analyses of experimental data. 11 The differences in coefficients across the two sets of interactive variables (unambiguous vs. ambiguous information) may not be statistically significant. We will formally test this in the next iteration of this paper.

17
from the ambiguous conditions (Ancestry Test and Heart Disease). Here we finally observe a classic
polarization pattern: relative to the control group, treated liberals are less likely to say race
differences are due to genetics and conservatives are somewhat more likely to say so.
[Figure 2 here]
Discussion
Generally speaking, the findings from this experimental study support the relevant hypotheses. In
three of four cases, exposure to information about genetic (or environmental) causes of racial
differences tended to increase differences between liberals and conservatives on the GARD scale
(Hypothesis 3). In addition, information with more ambiguous implications led to greater
polarization (Hypothesis 4). Turning to the Figures: As we noted when discussing the results, a
“true” polarization pattern emerged in response to ambiguous information, with both liberals and
conservatives moving toward the poles, suggesting that both ideological groups were able to find
information that could be interpreted in a biased way. This pattern handsomely supports our fourth
hypothesis. Interestingly, the pattern of results in response to the Race as Social Construction
treatment—with liberals, but not conservatives, responding to the stimulus—repeats the same
pattern from Study 1. In both studies, in response to one-sided political information flows, the
ideological opposition does not “boomerang” but simply appears to dismiss the evidence.
General Discussion & Conclusion
The findings generally support our contention that ideologically motivated reasoning influences the
reception of information about the causes of perceived race differences. The survey provides
evidence that this process appears to have been operating across the general population in the late
1990s and early 2000s. The main weakness of this approach, however, is clear: causal hypotheses

18
cannot be carefully tested with cross-sectional survey data, leaving us with circumstantial but not
truly persuasive evidence. The experiment provides that evidence, showing that the effects of
exposure to information about the causes of racial differences are moderated by ideology.
One somewhat unexpected pattern observed in both studies was that moderates and
liberals appeared to be persuaded by progressive information on genes and race while
conservatives’ beliefs did not change one way or the other. The lack of a boomerang effect among
conservatives, predicted by motivated reasoning theory, deserves additional attention. Future
iterations of this paper will address this issue as well as important counterarguments to our
conclusions. For example, given the well-known correlation between political ideology and racial
prejudice, one might ask whether “liberalism” and “conservatism” in our studies have the effects
they do because they are serving as proxies for prejudice. Thus, future drafts of this paper will
include prejudice and its interactions with the relevant variables in the models.
Although our work is not yet done, we have thus far found good evidence for the role of
motivated reasoning with respect to beliefs about racial differences. While this does not break new
ground with respect to motivated reasoning theory, to our knowledge this is the first study to apply
this theory in a rigorous way to thinking about the causes of racial difference. Furthermore,
incorporating this psychological model into the literature on race and politics is likely to yield
further fruit. It is a short leap from genetic explanations for racial differences to racism, and some
would argue there is no leap at all. Thus, our study sheds light on how media communications and
political ideology can interact to polarize ideologues on some of the most contentious beliefs and
issues in American politics today.

19
Works Cited
Alexander, Michelle. 2010. The New Jim Crow: Mass Incarceration in the Age of Colorblindness. New York: The New Press.
Alper, Joseph S., Ard, Catherine, Asch, Adrienne, Beckwith, Jon, Conrad, Peter, and Lisa N. Geller, eds. 2002. The Double-Edged Helix. Baltimore, MD: Johns Hopkins University Press.
Black, Edwin. 2003. War Against the Weak: Eugenics and America’s Campaign to Create a Master Race. New York: Four Walls Eight Windows.
Brewer, Mark D. and Jeffrey M. Stonecash. 2007. Split: Class and Cultural Divides in American Politics. Washington, D.C.: CQ Press.
Campbell, Angus, Philip E. Converse, Warren E. Miller, and Donald E. Stokes. 1960. The American Voter. Chicago, IL: Chicago University Press.
Dar-Nimrod, Ilan, and Steven J. Heine. 2011. “Genetic Essentialism: On the Deceptive Determinism of DNA.” Psychological Bulletin 137 (5): 800-818.
Gates, Jr., Henry Louis. 1994. “Why Now?” The New Republic, October 31.
Gould, Stephen Jay. [1981] 1996. The Mismeasure of Man. New York: W.W. Norton.
Heider, Fritz. 1958. The Psychology of Interpersonal Relations. Hillsdale, NJ: Lawrence Erlbaum.
Herrnstein, Richard J., and Charles Murray. 1994. The Bell Curve: Intelligence and Class Structure in American Life. New York: Free Press.
Hofstadter, Richard. [1944] 1992. Social Darwinism in American Thought. Introduction by Eric Foner. Boston: Beacon Press.
Hunt, Matthew O. 2007. “African American, Hispanic, and White Beliefs about Black/White Inequality, 1977-2004.” American Sociological Review 72 (3): 390-415.
Jayaratne, Toby Epstein, Susan A. Gelman, Merle Feldbaum, Jane P. Sheldon, Elizabeth M. Petty, and Sharon L. R. Kardia. 2009. “The Perennial Debate: Nature, Nurture, or Choice? Black and White Americans’ Explanations for Individual Differences.” Review of General Psychology 13: 24-33.
Kevles, Daniel J. 1985. In the Name of Eugenics: Genetics and the Uses of Human Heredity. Berkeley, CA: University of California Press.

20
Kinder, Donald R., and Cindy D. Kam. 2009. Us Against Them: Ethnocentric Foundations of American Opinion. Chicago: University of Chicago Press.
Kinder, Donald R., and Lynn M. Sanders. 1996. Divided by Color: Racial Politics and Democratic Ideals. Chicago: University of Chicago Press.
Kluegel, James R., and Eliot R. Smith. 1986. Beliefs About Inequality: Americans’ Views of What Is and What Ought to Be. New York: Aldine de Gruyter.
LaMarre, Heather L., Kristen D. Landreville, and Michael A. Beam. 2009. “The Irony of Satire: Political Ideology and the Motivation to See What You Want to See in The Colbert Report.” The International Journal of Press/Politics 14: 212-231.
Lewontin, R.C., Steven Rose, and Leon Kamin. 1984. Not In Our Genes: Biology, Ideology, and Human Nature. New York: Pantheon Books.
Lodge, Milton and Charles Taber. 2000. “Three Steps toward a Theory of Motivated Political Reasoning.” In Elements of Reason: Cognition, Choice, and the Bounds of Rationality, eds. Arthur Lupia, Mathew D. McCubbins, and Samuel L. Popkin. New York, NY: Cambridge.
Lodge, Milton, and Charles Taber. 2005. “The Automaticity of Affect for Political Leaders, Groups, and Issues: An Experimental Test of the Hot Cognition Hypothesis.” Political Psychology 26 (3): 455-482.
Massey, Douglas S. 2008. Categorically Unequal: The American Stratification System. New York: Russell Sage Foundation.
Morgan, G. Scott, Elizabeth Mullen, and Linda J. Skitka. 2010. “When Values and Attributions Collide : Liberals’ and Conservatives’ Values Motivate Attributions for Alleged Misdeeds.” Personality and Social Psychology Bulletin 36: 1241-1254.
Parens, Erik, Chapman, Audrey R., and Nancy Press, eds. 2006. Wrestling with Behavioral Genetics: Science, Ethnics, and Public Conversation. Baltimore, MD: The Johns Hopkins University Press.
Paul, Diane. 1998. The Politics of Heredity: Essays on Eugenics, Biomedicine, and the Nature-Nurture Debate. Albany, NY: State University of New York Press.
Pew Research Center for the People & the Press. 2004. “Polls Face Growing Resistance, but Still Representative.” News Release. April 20.
Phelan, Jo C., Bruce G. Link, and Naumi M. Feldman. 2013. American Sociological Review 78: 167-191.
Ramsey, Achter, and Condit. 2001. “Genetics, Race, and Crime: An Audience Study Exploring The Bell Curve and Book Reviews.” Critical Studies in Media Communication 18(1): 1-22.

21
Segerstråle, Ullica. 2000. Defenders of the Truth: The Sociobiology Debate. New York: Oxford University Press.
Seligman, Daniel. 1994. “Trashing The Bell Curve.” National Review, December 5.
Skitka, Linda J., Elizabeth Mullen, Thomas Griffin, Susan Hutchinson, and Brian Chamberlin. 2002. “Dispositions, Scripts, or Motivated Correction? Understanding Ideological Differences in Explanations for Social Problems.” Journal of Personality and Social Psychology 83: 470-487.
Suhay, Elizabeth, and Toby Epstein Jayaratne. 2013. “Does Biology Justify Ideology? The Politics of Genetic Attribution.” Public Opinion Quarterly 77(2): 497-521.
Swanson, Michael. 1995. “The Bell Curve and Eugenics.” Progressive News & Views List. http://www.hartford-hwp.com/archives/45/026.html.
Taber, Charles S., and Milton Lodge. 2006. “Motivated Skepticism in the Evaluation of Political Beliefs.” American Journal of Political Science 50(3): 755-769.
Weiner, Bernard, Danny Osborne, and Udo Rudolph. 2011. “An Attributional Analysis of Reactions to Poverty: The Political Ideology of the Giver and the Perceived Morality of the Receiver.” Personality and Social Psychology Review 15(2): 199-213.
Weiner, Bernard, Raymond Perry, and Jamie Magnusson. 1988. “An Attributional Analysis of Reactions to Stigmas.” Journal of Personality and Social Psychology 55(5): 738-748.
Zaller, John R. 1992. The Nature and Origins of Mass Opinion. Cambridge: Cambridge University Press.
22
Tables
Table 1: Effect of Ideology, and Ideology X Media Exposure, on GARD Scale
* p<.05; ** p<.01; ***p<.001, two-tailed test Standard deviations are reported within parentheses.
Independent Variables
Media Exposure -0.045 ** 0.043 ( 0.016 ) ( 0.033 )
Liberalism -0.062 * 0.006 -0.177 *** 0.006 ( 0.029 ) ( 0.037) ( 0.043 ) ( 0.037 )
Media Exp*Liberalism -0.190 *** ( 0.055 )
Religiosity 0.001 -0.027 0.040 -0.005 ( 0.027 ) ( 0.035 ) ( 0.038 ) ( 0.026 )
Education -0.047 -0.043 -0.057 -0.045 ( 0.035 ) ( 0.045 ) ( 0.052 ) ( 0.035 )
Income 0.065 0.068 0.072 0.069 * ( 0.035 ) ( 0.044 ) ( 0.053 ) ( 0.034 )
Age 0.188 *** 0.249 *** 0.066 0.188 *** ( 0.035 ) ( 0.044 ) ( 0.052 ) ( 0.035 )
Female -0.009 0.013 -0.047 -0.005 ( 0.016 ) ( 0.019 ) ( 0.024 ) ( 0.015 )
Black -0.020 -0.017 -0.012 -0.016 ( 0.014 ) ( 0.018 ) ( 0.024 ) ( 0.014 )
Constant 0.170 *** 0.121 *** 0.222 *** 0.137 *** ( 0.033 ) ( 0.040 ) ( 0.053 ) ( 0.034 )
N 1042 697 345 1042R² 0.070 0.081 0.130 0.086
Model 1 Model 2 Model 3 Model 4
No interaction
Low Exposure High Exposure Interaction

23
Table 2: Relationship between Ideology and GARD Scale across Five Treatment Groups
Standard deviations are reported within parentheses.
Independent Variables
Liberalism 0.066 -0.061 -0.144 * -0.207 ** -0.200 ***( 0.081 ) ( 0.064 ) ( 0.062 ) ( 0.071 ) ( 0.048 )
Religiosity 0.035 -0.09 0.059 0.025 0.037( 0.068 ) ( 0.062 ) ( 0.062 ) ( 0.076 ) ( 0.056 )
Education -0.169 -0.15 -0.154 * -0.109 -0.073( 0.089 ) ( 0.108 ) ( 0.07 ) ( 0.087 ) ( 0.072 )
Income -0.045 -0.084 -0.034 -0.207 * -0.134( 0.086 ) ( 0.131 ) ( 0.119 ) ( 0.094 ) ( 0.085 )
Age 0.002 0.000 0.001 0.003 * 0.000( 0.002 ) ( 0.001 ) ( 0.001 ) ( 0.001 ) ( 0.001 )
Female -0.141 ** -0.052 0.032 0.010 -0.019( 0.047 ) ( 0.042 ) ( 0.038 ) ( 0.041 ) ( 0.038 )
Black -0.423 -0.084 -0.127 -0.027 -0.157 *( 0.239 ) ( 0.132 ) ( 0.114 ) ( 0.094 ) ( 0.080 )
Hispanic -0.094 0.017 0.026 0.006 -0.054( 0.106 ) ( 0.065 ) ( 0.081 ) ( 0.087 ) ( 0.080 )
Other 0.324 0.038 0.069 -0.038 0.048( 0.234 ) ( 0.133 ) ( 0.102 ) ( 0.076 ) ( 0.063 )
Born in US 0.114 0.053 0.028 -0.155 -0.102( 0.076 ) ( 0.092 ) ( 0.082 ) ( 0.082 ) ( 0.089 )
Constant 0.274 0.552 *** 0.314 * 0.583 *** 0.623 *** ( 0.145 ) ( 0.157 ) ( 0.144 ) ( 0.127 ) ( 0.154 )
N 91 145 139 151 145R² 0.238 0.079 0.136 0.220 0.207
Racial Differences in
Hearth Disease
Model 1 Model 2 Model 3 Model 4 Model 5
* p<.05, ** p<.01, *** p<.001, two-tailed test
Control GroupRace as Genetic Reality
Race as Social Construct
Racial Ancestry Test

24
Table 3: Effects of Treatments, and Treatments X Ideology, on GARD Scale
* p<.05; ** p<.01; ***p<.001 Standard deviations are reported within parentheses.
Independent Variables
Liberalism -0.124 *** 0.051 ( 0.028 ) ( 0.072 )
Vignettes (control gr. as reference) Race as Genetic Reallity 0.023 0.055
( 0.029 ) ( 0.047 ) Race as Social Construct -0.048 0.029
( 0.029 ) ( 0.052 ) Racial Ancestry Test 0.008 0.112 *
( 0.028 ) ( 0.047 ) Racial Diff. in Hearth Disease -0.025 0.073
( 0.028 ) ( 0.046 ) Genetic Reallity*Liberalism -0.081
( 0.089 ) Social Construct*Liberalism -0.19 *
( 0.093 ) Ancestry Tests*Liberalism -0.256 **
( 0.089 ) Hearth Disease*Liberalism -0.240 **
( 0.081 ) Religiosity 0.006 0.01
( 0.027 ) ( 0.028 ) Education -0.14 *** -0.136 ***
( 0.037 ) ( 0.036 ) Income -0.09 -0.096 *
( 0.045 ) ( 0.045 ) Age 0.088 * 0.081
( 0.045 ) ( 0.045 ) Female -0.02 -0.023
( 0.017 ) ( 0.017 ) Black -0.12 * -0.121 *
( 0.048 ) ( 0.048 ) Hispanic -0.01 -0.016
( 0.040 ) ( 0.039 ) Other 0.053 0.05
( 0.044 ) ( 0.044 ) Born in US -0.03 -0.04
( 0.041 ) ( 0.040 )
Constant 0.501 *** 0.464 *** ( 0.069 ) ( 0.066 )
N 671 671R² 0.121 0.137
Model 1
No interaction
Model 2
With Interactions

25
Figures
Figure 1: Interaction Effect between Ideology and News Exposure
Note: Predicted margins extracted using margins and marginsplot commands in Stata. In Figure 1A,
ideology is coded as a continuous variable; in Figure 1B, it is coded with dummies.

26
Figure 2: Interaction Effect between Treatments and Ideology
Note: Predicted margins extracted using margins and marginsplot commands in Stata.
27
Appendix A: Study 1 Dependent Variable: Question Wording
Now I’d like to ask about some ways that [A: WHITES MIGHT TEND to differ from BLACKS] [B: BLACKS MIGHT TEND to differ from WHITES]. Again, people we’ve talked with have MANY different opinions on this, we just want to know what you HONESTLY think. First, some people think [A: whites TEND to differ from Blacks] [B: blacks TEND to differ from whites] in how GOOD they are in ATHLETICS. Although there are MANY reasons why they might differ, do you think their genes or genetic make up has ANYTHING to do with THIS difference? 1 Yes 2 No 3 No difference [VOL] In your opinion, how much of THIS difference between whites and Blacks is due to their genes? Would you say very little, some, a lot or just about all? 1 Very Little 2 Some 3 A lot 4 Just about all Some people think [A: whites TEND to differ from Blacks] [B: blacks TEND to differ from whites] in their DRIVE TO SUCCEED. Do YOU think their genes have ANYTHING to do with THIS difference? 1 Yes 2 No 3 No difference [VOL] How much of THIS difference between whites and Blacks do YOU think is due to their genes? 1 Very Little 2 Some 3 A lot 4 Just about all

28
Some people think [A: whites TEND to differ from Blacks] [B: blacks TEND to differ from whites] in how good they are in MATH. Do YOU think their genes have ANYTHING to do with THIS difference? 1 Yes 2 No 3 No difference [VOL] How much of THIS difference do YOU think is due to their genes? 1 Very Little 2 Some 3 A lot 4 Just about all Some people think [A: whites differ from Blacks] [B: blacks differ from whites] in their TENDENCY TO ACT VIOLENTLY. Do YOU think their genes have ANYTHING to do with THIS difference? 1 Yes 2 No 3 No difference [VOL] How much of THIS difference do YOU think is due to their genes? 1 Very Little 2 Some 3 A lot 4 Just about all Some people think [A: whites TEND to differ from Blacks] [B: blacks TEND to differ from whites] in INTELLIGENCE. Do YOU think their genes have ANYTHING to do with THIS difference? 1 Yes 2 No 3 No difference How much of THIS difference do YOU think is due to their genes? 1 Very Little 2 Some 3 A lot 4 Just about all

29
Cross-tabulation of Ideology and Exposure to News about Genetics
Total 731 361 1,092
Strong Conservative 104 51 155
Conservative 192 90 282
Moderate 218 98 316
Liberal 148 77 225
Strong Liberal 69 45 114
ideo5 Low Expos High Expo Total
highexposure
. tab ideo5 highexposure if predicted!=.
30
Appendix B: Study 2 Dependent Variable: Question Wording On average, black people in the U.S. have worse jobs, income, and housing than white people. There are many possible explanations for these differences. How much do you think these differences are… …because most African Americans have less in-born ability to learn? 1. very much 2. some 3 not much 4. not at all
…because most African Americans have less in-born drive to succeed? 1. very much 2. some 3 not much 4. not at all African-Americans are much more likely to be arrested, jailed and imprisoned in the U.S. than are whites. There are many possible explanations for these differences. How much do you think these differences are… …due to genetic differences between blacks and whites in their tendency toward violence? 1. very much 2. some 3 not much 4. not at all People of African descent dominate many sports, such as basketball, football and running events. There are many possible explanations for these differences. How much do you think these differences are… …due to genetic differences between blacks and whites? 1. very much 2. some 3 not much 4. not at all

31
Independent Variable: Article Content Race as Genetic Reality Article Is Race Real? Genes Say ‘Yes’ Most people would agree it is easy to tell at a glance if a person is Caucasian, African or Asian. A recent study suggests that the same racial groups we can identify do in fact correspond with broad genetic differences between groups. Results of the study were published yesterday in the journal Nature Genetics. The study was conducted by Dr. Bruce Firman and other geneticists at Columbia University. Dr. Firman says that racial differences exist because early humans in Africa spread throughout the world 40,000 years ago, resulting in geographical barriers that prevented interbreeding. On each continent, natural selection and the random change between generations known as genetic drift, caused peoples to diverge away from their ancestors, creating the major races. The effects of this natural selection and genetic drift that have followed different pathways on each continent can be seen by looking at people from different racial groups as traditionally defined. Certain skin colors tend to go with certain kinds of eyes, noses, skulls and bodies. When we glance at a stranger’s face we use those associations to guess what continent, or even what country, he or his ancestors come from – and we usually get it right. What Dr. Firman and his colleagues showed was that genetic variations that aren’t written on our faces –that can be seen only in our genes – show similar patterns. The researchers sorted by computer a sample of people from around the world into five groups on the basis of genetic similarity. The groups that emerged were native to Europe, East Asia, Africa, America and Australasia – the major races of traditional anthropology. Hence, Dr. Firman says, “race matches the branches on the human family tree as described by geneticists.”

32
Race as Social Construction Article Is Race Real? Genes Say ‘No’ Most people would agree it is easy to tell at a glance if a person is Caucasian, African or Asian. But a recent study suggests that it is not so easy to make these distinctions when one probes beneath surface characteristics and looks for DNA markers of “race.” Results of the study were published yesterday in the journal Nature Genetics. The study was conducted by Dr. Bruce Firman and other geneticists at Columbia University. Analyzing the genes of people from around the world, the researchers found that the people in the sample were about 99.9 percent the same at the DNA level. “That means that the percentage of genes that vary among humans is around .01 percent, or one in ten thousand. This is a tiny fraction of our genetic make-up as humans,” noted Dr. Firman. The researchers also found that there is more genetic variation within each racial or ethnic group than there is between the average genomes of different racial or ethnic groups. Why the discrepancy between the ease of distinguishing “racial” groups visually and the difficulty of distinguishing them at a genetic level? Traits like skin and eye color, or nose width are controlled by a small number of genes. Thus, these traits have been able to change quickly in response to extreme environmental pressures during the short course of human history. But the genes that control our external appearance are only a small fraction of all the genes that make up the human genome. Traits like intelligence, artistic talent and social skills are likely to be shaped by thousands, if not tens of thousands of genes, all working together in complex ways. For this reason, these traits cannot respond quickly to different environmental pressures in different parts of the world. This is why the differences that we see in skin color do not translate into widespread biological differences that are unique to groups and why Dr. Firman says “the standard labels used to distinguish people by ‘race’ have little or no biological meaning.”

33
Racial Ancestry Test Article Is it All Black and White? Genes Say ‘No’ Most people think they know what race they belong to, and people tend to think of themselves as “100 percent” white or black or something else. A recent study challenges that way of thinking. Dr. Bruce Firman and other geneticists at Columbia University have developed a DNA test that measures a person’s racial ancestry. Results of the study were published yesterday in the journal Nature Genetics. The test shows what continent a person’s ancestors came from. These continents correspond to the major human population groups or races, those of “Native American, East Asian, South Asian, European, and sub-Saharan African” according to Dr. Firman. If a person is of mixed race, the test shows the percentage of each race in a person’s genetic background. It turns out that mixed ancestry is very common, said Dr. Firman. About 10 percent of European-Americans have some African ancestry, and African-Americans, on average, have about 17 percent European ancestry. When people are told the results of their DNA test, they are usually quite surprised. Most learn that they share genetic markers with people of different skin colors. Some “black” subjects in the study found that as much as half of their genetic material came from Europe and some from Asia. One “white” subject learned that 14 percent of his DNA came from Africa and 6 percent from East Asia. Very few were 100 percent anything. “The main outcome is that we are breaking down an either-or classification,” Dr. Firman said. Instead of people being considered either black or white, the test shows a continuous spectrum of ancestry among African-Americans and others.
34
Racial Differences in Heart Disease Article Genes May Cause Racial Difference in Heart Attacks Doctors have long known that African Americans are prone to heart attacks. In fact, not only are African Americans more likely to suffer from heart attacks, their heart attacks are more likely to be fatal, compared to Caucasians. A recent study suggests that genetics may help explain this racial difference. Dr. Bruce Firman and other geneticists at Columbia University detected a version of a gene that raises the risk of heart attack in African-Americans by more than 250 percent. That means the gene more than doubles the risk of heart attack in African-Americans. Results of the study were published yesterday in the journal Nature Genetics. The gene identified by the researchers is called leukotriene A4 hydrolase. The gene is involved in inflammation. Inflammation, which we commonly see as swelling, redness and pain, is the process by which the body responds to injury or infection. Inflammation is usually beneficial to health. But new evidence shows that inflammation plays a key role in causing heart attacks. Too much inflammation seems to damage the lining of artery walls and contribute to the buildup of fatty deposits (called plaque) inside the artery. Plaques block the flow of blood through the arteries, leading to heart attacks. Inflammation can also cause plaques to burst, which scientists think is a cause of heart attacks. Dr. Firman said that the gene they identified is much more strongly associated with heart attack in African-Americans than in Caucasians. “These findings,” said Dr. Firman, “offer strong evidence that genetic factors are important in explaining the higher rates of heart attack in African Americans.”


