Download - ICT in secondary schools a study of factors”

“The role of ICT in the teaching of English as a Foreign
Language in Norwegian lower secondary schools – a study of
ICT use and patterns of associated factors”
Thomas Arnesen
Spring 2010
Masterspesialisering Engelsk, ILS, UiO

CHAPTER 1: INTRODUCTION .................................................................................................................................. 3 CHAPTER 2: PREVIOUS RESEARCH AND THEORETICAL PERSPECTIVES ............................................................... 10
PREVIOUS RESEARCH .............................................................................................................................................. 10 The Norwegian context 1: English proficiency and associated variables .................................................... 11 The Norwegian context 2: EFL teachers’ appropriation of ICTs ................................................................... 14 The methodological context: Classroom integration of ICTs and associated predictors ............................. 16 The exploratory context: Acknowledging and adapting to existing structures for successful ICT projects . 19 The CALL context: Moving towards normalisation? .................................................................................... 22
THEORETICAL PERSPECTIVES .................................................................................................................................... 24 Section 1: Classifying EFL teachers’ ICT use ................................................................................................. 25 Section 2: Theory of practice as ecological model for the study of ICT use ................................................. 29
CHAPTER 3: RESEARCH DESIGN AND METHOD ................................................................................................... 34 SECTION 1: RESEARCH DESIGN ................................................................................................................................. 34 SECTION 2: PARTICIPANTS....................................................................................................................................... 38 SECTION 3: STATISTICAL ANALYSES............................................................................................................................ 39 SECTION 4: MATERIALS AND PROCEDURE ................................................................................................................... 42
Subject specific scale 1: Self‐perceived competence (SPC) .......................................................................... 44 Subject specific scale 2: Content and activities............................................................................................ 46 Subject specific scale 3: Organising teaching .............................................................................................. 48 ICT intensity ................................................................................................................................................. 51 Two main types of ICT use ........................................................................................................................... 52 ICT tools ....................................................................................................................................................... 54 ICT general positive belief............................................................................................................................ 55 ICT positive effects ....................................................................................................................................... 56
SECTION 5: TRUSTWORTHINESS AND GENERALISABILITY ................................................................................................ 56 CHAPTER 4: RESULTS ............................................................................................................................................ 59
SECTION 1: STATE OF ICT USE, ICT COMPETENCE AND ATTITUDES AMONG EFL TEACHERS................................................... 59 Descriptive findings – general overview of teachers’ ICT use ...................................................................... 61 Factor analysis – identifying patterns of ICT use ......................................................................................... 64 EFL teachers’ ICT competence and attitudes ............................................................................................... 69
SECTION 2: ICT USE AND THE SYSTEM OF ASSOCIATIONS ............................................................................................... 72 Step1: Identifying associations comparing mean values ............................................................................. 73 ANOVA results ............................................................................................................................................. 75 Determining bivariate correlations and identifying the ‘cloud of correlations’........................................... 88 Determining the predictive strength of the identified system of ICT‐related variables ............................... 92
CHAPTER 5: DISCUSSION ...................................................................................................................................... 96 RECAPITULATION OF MAIN FINDINGS ......................................................................................................................... 96
Findings related to research question one................................................................................................... 96 Findings related to research question two .................................................................................................. 98
EFL TEACHERS WITH HIGH ICT INTENSITY – COMMON ELEMENTS IN THEIR THEORY OF PRACTICE ......................................... 100 CHAPTER 6: CONCLUSIONS AND IMPLICATIONS ............................................................................................... 104 APPENDIX ........................................................................................................................................................... 106 REFERENCES........................................................................................................................................................ 123 LIST OF DIAGRAMS ............................................................................................................................................. 127
2

Chapter 1: Introduction
ICTs have become an essential part of everyday life of most people in the Western world.1
From the smooth running of societies’ vital functions, such as banking and finance, to social
networking and recreational activities, new technologies rapidly transform important
aspects of our lives. ICTs empower us to perform tasks that were inconceivable only a few
decades ago. From our personal computers we buy and sell all kinds of products, keep in
touch with friends and find new ones, participate in chat rooms and discussion groups, work
and play. The number of tasks we perform via new technologies is continuously rising.
New technologies’ massive impact on society has various consequences also for the
Norwegian educational system. For one thing, most pupils are high frequency users of new
technologies. They are familiar with browsing the Internet, playing games and participating
in social networks. More importantly, they have access to a wealth of information regarding
all curriculum subjects, and thus might feel less inclined to respect the authority of teachers
and traditional textbooks. Furthermore, pupils and teachers are expected to be using ICTs in
class on a regular basis as reflected in national plans and official documents. In the latest
national curriculum (LK06) “the ability to use digital tools” is defined as a basic skill along
with numeracy, the ability to express oneself orally, to read and write (KD
(Kunnskapsdepartementet), 2006).
There are mixed experiences with the introduction of ICTs in the Norwegian school system,
despite ambitious political plans and strategies, substantial economic investements, and a
widespread faith in the educational power of digital technologies. One of the main policy
objectives in “Program for digital kompetanse 2004‐2008” was to become among the best in
the world in the pedagogic application of digital tools in teaching and learning (UFD
(Utdannings‐ og Forskningsdepartementet), 2004). Still, the latest report (ITU Monitor 2009)
from the National Network for IT‐Research and Competence in Education (ITU) on the state
1 In what follows, the concepts ‘digital technologies’, ’ICTs’, and ’new technologies’ will be used interchangeably to maintain a varied language. When called for, more precise concepts are used to explicate important issues.
3

of the integration of ICTs in teaching and learning shows a decrease in the use of ICTs in
lower secondary schools (ITU (Forsknings‐ og kompetansenettverk for IT i utdanning), 2009).
The faith in ICTs’ positive effects on pupils’ learning was expressed by the so‐called
“kvalitetsutvalget” in the following way: “Det er også viktig å understreke at IKT ikke bare
kan bidra til hvordan elever kan lære bedre eller mer, den bidrar også til at elever kan lære
eller arbeide med et kvalitativt bedre innhold” (KD (Kunnskapsdepartementet), 2003).
Similarly, the reported decrease in the use of ICTs in lower secondary schools, spurred ITU to
state that:”Den norske grunnskolen er akterutseilt og klarer ikke å integrere data i
undervisningen. Det går utover elevenes ferdigheter i alle fag”.2 Yet, recent international
research into the effects of ICTs on learning shows few indications of massive learning gains.
On the contrary, John Hattie reports only medium effects of ICTs on learning, and Fuchs &
Wössmann’s reanalysis of the PISA‐data showed significant negative correlations between
frequent use of new technologies and Internet at school and learning outcomes (Hattie,
2009) (Fuchs & Wössmann, 2004). Similarly, based on finding in the international TIMMS‐
study (Trends in International Mathematics and Science Study), the Norwegian project group
noted; ”det er for oss et stort tankekors at arbeidsmåter som anbefales sterkt for tiden
(prosjektarbeid, gruppearbeid og bruk av datamaskin) ser ut til å henge sammen med svake
resultater i matematikk” (Lie, Kjærnsli, & Brekke, 1997): 203. Futhermore, a study of the
views and experiences of headmasters at lower secondary schools participating in the
international SITES study, revealed that there was a strong negative correlation between the
number of years the school had used ICTs actively, and the faith in the positive effects of
new technologies (Mason, Law, Pelgrum, & Plomp, 2008): 266. So, it would seem that the
more experience headmasters’ had had with the use of digital technologies, the less faith
they had in ICTs’ positive impact on pupils’ learning. Finally, it is striking that Norway, which
is the OECD country with the highest ICT use among pupils and the best school level ICT
infrastructure, has the largest relative decline in skills and knowledge from 2003 to 2009 as
measured in the PISA study.3 Unsurprisingly, both teachers, researchers and politicians are
interested in identifying the causes for the state of affairs.
2 http://www.itu.no/Datakompetansen+for+svak+i+norsk+grunnskole.9UFRDGZV.ips, 13.05.2010. 3 Lars Vavik, conference presentation at “FOU i praksis”, Trondheim, 10.05.2010.
4

In the wake of the release of ITU Monitor 2009 and the reported decrease in ICT use at lower
secondary schools, the project manager blamed the teachers for failing to integrate ICT in
their teaching; they were the ”bottlenecks” in the efforts of digitalising Norwegian
classrooms.4 In a similar vein, the directorate for education (Utdanningsdirektoratet) has
insinuated that teachers who do not use ICT frequently in class are less conscious about their
’theory of practice’ than their ICT using colleagues: ”Liten bevissthet om egen praksisteori
kan fort bli en bremsekloss for forandringsvilje, og dermed også en bremsekloss for viljen til
å ta i bruk ny teknologi i opplæringa”.5 In a response to the directorate, Lektorlaget pointed
out that: " (...) liten forandringsvilje hos lærerne kan på enkelte område springe ut av meget
velbegrunnet praksisteori og meget bevisst refleksjon om egen praksis", and provided an
alternative way of thinking about the current state of affairs "(...) når sentrale myndigheters
kraftige satsning på å innføre IKT i skolen ikke har gitt de resultater man hadde håpet på, kan
årsaken ligge i en mangelfull analyse av situasjonen i skolen".6
The analysis of the situation in Norwegian schools is founded on certain ideas about ICTs’
role and function expressed in educational policies. An evaluation of the value of ICTs in
education must be based on some underlying assumptions about what constitutes quality
and what is ICTs’ ideal role and function in education. Arguably, official policy has for the last
two decades been based on two main ideas about ICT in education. The first main idea is
that schools must be digitalised in order to keep up with the rest of the world, and thus
avoid what ITU refers to as being ”akterutseilt”. From this perspective all integration is good,
and it makes sense to use frequency of ICT use as a measure for quality. Consequently, a
registered decrease in the use of ICTs is by definition bad. From this perspective it is not
particularly important to see ICT use in relation to the characteristics of the individual
curriculum subject. This is what Gabriel Salomon refers to as a technocentric view of ICT in
education (Salomon, 2000).
4 ”det er lærernes kompetanse og arbeidsmønster, i tillegg til usystematisk skoleledelse, som er de store flaskehalsene som hindrer it‐basert undervisning” http://www.nrk.no/nyheter/1.6736536, 11.11.2009. 5 http://www.regjeringen.no/upload/kilde/ufd/hdk/2005/0019/ddd/pdfv/233915‐strategi‐u.dir..pdf, p.14, 6.12.2009. ‘Theory of practice’ is defined by (Lauvås & Handal, 1990) as “a person’s private, interconnected, continuously changing system of knowledge, experiences, and values which influences a person’s teaching practice at a given point in time”. 6 http://www.norsklektorlag.no/getfile.php/Filer/NLL%20mener‐%20filmappe/Strategi%20for%20digitale%20l%C3%A6ringsressurser%2025%2002%2005.doc, 14.05.2010.
5

The second main idea is that schools must adopt a radical progressive pedagogy in order to
make full use of ICTs’ affordances. From this perspective ICTs are valuable since they seem
ideal for promoting so‐called pupil centered teaching and learning through the access they
provide to sources of information and arenas for interaction. From this perspective it is not
particularly important to look closely at the use of ICTs in relation to the characteristics of
individual curriculum subjects, since the traditional understanding of curriculum subjects will
not be the basis for a pedagogically transformed educational context. “This potential [for
innovative pratices] simply cannot be fully realized within the single subject and single
session model. We need to develop learning situations where complex problems are
approached from a cross‐curricular position and across flexible timescales” (Lund, 2004):
276. The new educational context is instead emphasising the development of pupils’ so‐
called ’21st century skills’, such as their ability to access and process information, and their
ability to identify problems and choose strategies for solving them (Vavik et al., 2010):18.
The emphasis is on tasks requiring that pupils work across traditional curriculum subject
boundaries. From this perspective, teachers sticking to a traditional understanding of
curriculum subjects and thus object to an ICT induced pedagogic transformation, might be
seen as reactionary and old‐fashioned. Their lack of enthusiasm might be seen to stem from
a general opposition to change per se, and might thus be accused of lacking consciousness
about their own ’theory of practice’.
The view adopted in this study is that the value of ICTs must primarily be assessed according
to the degree to which it promotes the attainment of central subject specific objectives. This
view is based on international research findings and trends. The trends in the literature show
that researchers increasingly turn their attention to characteristics of teachers and
curriculum subjects to understand the proper role and function of ICTs in complex
educational contexts. One obvious reason is that teachers play a crucial role in relation to
the quality of pupils’ learning (Hattie, 2009), and are the ones who decide what actually
takes place in the individual classroom. Moreover, teachers experience the obstacles to
successful integration of ICTs in their teaching on a daily basis. A steadily growing emphasis
in the literature on the individual differences between teachers in relation to their beliefs,
attitudes, and competence, reflects the understanding of teachers as key players in the
educational context (Mueller, Wood, Willoughby, Ross, & Specht, 2008). Simultaneously,
6

there is a tendency in the literature to draw attention to the unique subject specific context
new technologies are part of. Previous research suggest that teachers require positive
experiences with ICTs which are specific for the subject they teach in order to make use of
ICTs (Mueller et al., 2008). Also, some researchers have found that successful integration of
ICTs are more likely to happen if the teacher’s general pedagogical approach corresponds in
some way to the characteristics of the technology (Zhao, Pugh, Sheldon, & Byers, 2002).
Similarly, a common characteristic of successful projects is when the teacher sees a close
connection between the technology and the curriculum, and has an educational rather than
technocentric understanding of the role of technology, i.a. uses the technology as a means
for reaching a subject specific objective, rather than seeing the integration of technology as
an end in itself (Zhao et al., 2002). The findings suggest that research should be directed
towards the teacher’s role in the integration of new technologies in the individual school
subject.
The focus in this thesis is on teachers of English as a Foreign Language (EFL) in Norwegian
lower secondary schools. The overarching rationale is to develop and refine the current
understanding of the forces which shape teachers’ actions in relation to the use of new
technologies in their everyday practice. By providing empirically based evidence of
associations between various salient elements in the educational context, this thesis will
hopefully contribute to a reduction of unfounded, derisive accounts of teachers’ motives and
agendas.
There is only a meagre body of previous national research upon which to build this study. As
Andreas Lund points out, ”(…) det [er] forbausende å se hvor lite som er skrevet i Norge om
IKT i engelskfaget, iallfall innenfor vitenskapelige rammer som mastergrads‐ og
doktoravhandlingar” (Lund, 2009). There are a couple of exceptions. Elisabeth Ibsen has
written the Norwegian contribution to a European comparative study of 10.graders’ English
competence (Ibsen, 2004). Her quantitative analysis shows among other things the
correlation coefficients between various classroom variables and pupils’ results on
predesigned language tests, thus trying to identify the most salient factors for pupils’
learning. She shows that the use of ICT does not seem to be one of them. A more detailed
description of Ibsen’s study is provided in the chapter on previous research.
7

For the purposes of this study, only Lund’s PhD thesis (Lund, 2004) is directly relevant.
Although Lund’s study is based mainly on qualitative methods and is placed within a
sociocultural theoretical framework, both studies share a systemic rather than an analytic
approach (Salomon, 1991) to a common research object; EFL teachers’ encounters with ICT.
However, where Lund provides a thick description of the practice of a limited number of
teachers, the current study seeks to provide a less detailed description of the reported
practice of many teachers. So, where Lund provides a close‐up image of a number of
intricate processes, the current study seeks to provide a general overview revealing common
patterns and systems of associations. Also, Lund directs his attention to teachers
participating in a course designed to try out school environments with high ICT density and
collaborative pedagogical practices, whereas the current study seeks to capture the voices of
teachers working in their regular environment. So, where Lund is concerned with capturing
innovative practices that can serve as models for other schools to follow, the current study is
more concerned with capturing actual practices that might help explain the state of ICT
integration in the teaching of EFL in Norwegian lower secondary schools.
There are many unchartered areas related to the use of ICTs in the teaching of EFL, and
more research is clearly required. The overarching research objective in this study is to
determine EFL teachers’ actual use of ICTs, and identify the system of associated variables
that can help explain what is characteristic about EFL teachers with high ICT‐intensity. In
order to reach this research objective, the study seeks to provide answers to the following
research questions:
1. What characterises the use of ICTs in EFL classrooms, and what attitudes and
knowledge do the teachers have regarding new technologies?
2. How is EFL teachers’ reported ICT use associated with;
a. their knowledge about ICT and their thoughts relating to the usefulness of
and experiences with technology; and
b. their background, subject specific priorities and qualifications?
8

The thesis consists of six chapters. In the next chapter (chapter 2) previous research and the
study’s theoretical framework are accounted for. Chapter 3 provides insight into the
methods used to obtain data and an evaluation of the generalisability and trustworthiness of
the findings. The results of the different statistical analyses are presented in chapter 4, while
a theoretically oriented discussion, conclusions and implications are provided in the last
chapter.
9

Chapter 2: Previous research and theoretical perspectives
In this chapter, findings from previous research are presented according to the degree to
which they are vital for an understanding of this study’s general research approach and
findings. Next, two theoretical frameworks are accounted for. One suited for the
classification and categorisation of new technologies, and one needed for the elaboration on
ICT use and the system of associated variables.
Previous research In a masters thesis about EFL teachers’ use of ICT for lower secondary school pupils, many
angles from which to approach previous research are open. Ideally, the state of the art both
nationally and internationally within each field constituting this composite area of research
should have been comprehensively accounted for. Yet, for pragmatic reasons linked to time,
resources and level of academic sophistication, this is beyond the scope of the present
presentation. Instead, a principled selection of a few exemplary studies has been carried out.
First, by using a spatial principle of selection, I have separated national from international
literature. Arguably, there is a need to place this study in context of other relevant studies of
the Norwegian situation, and at the same time present findings that communicate important
background information. There are few studies to choose from, so no studies are excluded.
The studies included based on this principle are (Ibsen, 2004) and (Lund, 2004).
The second principle of selection can be said to be of a methodological nature. So, even
though there are numerous studies concerning the integration of technology in education, I
have primarily focussed on those with similar methodological underpinnings. Hence, the
current study can be placed within the larger picture of quantitative studies dedicated to the
identification of variables associated with ICT use. There are a number of international
studies sharing these properties, and I have consciously excluded some of them, most
notably (Becker, 1994). The second principle led to the inclusion of (Mueller et al., 2008) for
a closer inspection.
10
Thirdly, studies with similar exploratory and empirical outlooks are included. This principle of
selection excludes e.g. theoretically grounded, confirmatory studies occupied with the
testing of the robustness of scales and items, and studies with an expressed or implied
desire to influence the object of study in a particular predefined direction on the basis of
theoretical convictions. There probably are a number of studies sharing these properties, but
I have solely focussed on (Zhao et al., 2002), which is presented in more detail in this
chapter.
Finally, studies on Computer Assisted Language Learning (hereafter simply referred to as
CALL) are included, since this is the field that most comprehensibly covers the composite
reality facing EFL teachers trying to integrate ICTs in their classrooms. (Chapelle, 2005) is
included in this presentation of previous research on the basis of the fourth principle of
selection.
The Norwegian context 1: English proficiency and associated variables
“De norske elevene framstår som dyktige og dessutan godt motiverte både når det
gjelder aktiviteter på skolen og det å lære engelsk” (Ibsen, 2004): 76.
In “Engelsk i Europa – 2002: Norsk rapport fra en europeisk engelskundersøkelse om
holdninger til og ferdigheter i engelsk ved utgangen av den obligatoriske grunnskolen”
(Ibsen, 2004) Elisabeth Ibsen presents the findings from the Norwegian part of a European
study dedicated to the comparison of European 10.grade pupils’ English proficiency.7 The
relevance of this report for the current study lies primarily in its presentation of findings
related to Norwegian lower secondary school pupils’ English proficiency. It is obviously
important to know something about the level of proficiency in a study concerning EFL
content, activities and methods. Even more important, perhaps, are the identification of
variables associated with high levels of proficiency.
7 The study was coordinated by The European Netweork of Policy Makers for the Evaluation of Education Systems and involved eight countries: Norway, Sweden, Denmark, Finland, France, Spain, Germany, the Netherlands.
11

The overall results showed that Norwegian 16‐year‐olds had a comparatively high level of
English proficiency.8 They achieved the highest test score on both listening comprehension
and text production, and performed well on reading comprehension and linguistic
competence as illustrated by diagram 1 below.
Diagram 1: Norwegian lower secondary school pupils’ English proficiency expressed in scores on tests of listening comprehension, linguistic competence, reading comprehension, and written production (Ibsen, 2004): 19
The Norwegian mean score was 65 per cent correct answers, but high standard deviations
showed variations in their performance (fluctuating between 4 to 97 per cent correct
answers). The pupils were on the whole highly motivated for learning English and saw the
relevance of the school subject.
The report also presented findings related to variables associated with high test scores.
Diagram 2 shows that “teacher using English as the language of instruction” was the school
factor with the strongest positive correlation with test scores, whereas the use of ICTs
showed the strongest negative correlation. Internet use at home, on the other hand,
correlated positively with test scores.
8 The test was relatively short (90 minutes) and the format was designed to measure pupils’ listening and reading comprehension, linguistic competence, and written production.
12

Diagram 2: Significant correlations between school factors and test results (Ibsen, 2004): 56.
The relationship between different school activities on pupils’ test scores, self‐assessment
and grades are presented in diagram 3 below. Again the variable linked most closely with
pupils’ good results is the teachers’ use of English as the language of instruction. Moreover,
textbook based activities in a classroom environment emphasising the importance of hard
and diligent work seem to pay off in higher test scores, better grades and stronger beliefs in
own competence. More open‐ended tasks and activities such as project work show
significant negative correlations with test score, but less so on pupils’ grades and self‐
assessment.
Diagram 3: Correlation between test scores, grades, self‐evaluation and classroom activities (Ibsen, 2004): 57.
13

Based on the findings that pupils’ use of Internet and other media at home correlates
positively with test scores, while their use at school correlates negatively, Ibsen concludes
that it is important to consider how the few lessons of EFL per week can supplement and
structure the language input pupils’ receive at home. Furthermore, schools and teachers
must develop their didactic competence in order to make use of media and other resources
in accordance with principles for quality EFL teaching and learning. Overall, Ibsen maintains
that the findings confirm the appropriateness of three fundamental principles for EFL
teaching and learning: communication, authenticity and autonomy. She stresses that not
only texts, but also activities and relations, must be seen in light of the concept of
authenticity:
“Internett åpner for en verden av autentiske tekster og autentiske møter og relasjoner,
og lærerens oppgave blir å hjelpe elever til å analysere, vurdere og kommunisere tanker
og informasjon i ulike sjangre med ulike mottakere” (Ibsen, 2004): 81.
The Norwegian context 2: EFL teachers’ appropriation of ICTs
“(…) life in ICT‐infused learning environments is indeed complex, multivoiced and
polytextual. If teaching is a complex endeavour, it becomes even more so when artifacts
become digitized and – along with their users – increasingly networked and distributed”
(Lund, 2004): 265.
“The teacher as interface – teachers of EFL in ICT‐rich environments: beliefs, practices and
appropriation” is the title of Andreas Lund’s Ph.D. dissertation, in which he presents the
findings from a focussed exploration of the processes involved in EFL teachers’ appropriation
of digitized artifacts. He uses a sociocultural theoretical perspective in his mainly qualitative
study of EFL teachers practicing in ICT‐rich environments.
He defines his research field as EFL teachers’ encounters with technology, and poses one
overarching research question to guide his study: “In what ways are ICTs appropriated in the
EFL classroom?” Incorporated in this overall approach are questions related to the beliefs
and attitudes of EFL teachers who encounter ICTs in their profession, the kinds of
14

educational practices that emerge when ICTs are integrated in EFL classrooms, and the
identification of conditions conducive for innovative practices. A main line of conflict
presented in the study is how teachers (should) approach the task of fully embracing the
inherent (genotypical) properties of ICTs (appropriation) while at the same time looking after
traditional aspects of enculturation, i.e. between innovation and tradition.
“At the interface of the two we see a dialectic relationship of traditional (thesis) and
transformational (antithesis) practices and with a third space as the potential synthesis.
For those spaces to prosper, however, impediments in the traditional system will have
to be conquered. As schools are socially and culturally constructed institutions, the way
they arrange conditions for teaching and learning are manifestations of how they think
about (or ignore) urgent educational issues” (Lund, 2004): 276.
He finds answers to the overarching research question through an examination of the
transformation of the underlying activity system of ‘teaching’ (Lund, 2004): 276. He
identifies three dimensions of transformation related to the teaching of EFL that he
considers to be closely linked to teachers’ appropriation of ICTs:
• The school subject of EFL itself is undergoing change. Lund maintains that the new
participatory social spaces and associated genres of communicational forms provided
by networked ICTs should be regarded as ‘acceptable’ functional practices. “The
result is that ICT‐rich environments afford opportunities for authentic, diverse,
mature practices to a greater extent than in non‐ICT classrooms” (Lund, 2004): 277.
Moreover, a consequence of the the rapidly changing standards for ‘correct’ English
should in Lund’s view be a realignment of the ontological position of EFL. “Instead of
locating the discipline within a linguistic system to be acquired, it is located in
practices that are constantly being shaped and reshaped through a constantly
increasing number of people who engage in global and online Englishes” (Lund,
2004): 277.
• The social spaces (both in terms of time and place) for EFL practices are extended.
Lund sees the emergence of new social spaces for EFL practice which extend beyond
the classroom (online communities etc.) as opportunities that must be exploited by
15

teachers through the use of designs for learning that bridge the gap between off and
online environments.
• Teachers must teach in ways they were not taught to do. Lund maintains to see in
ICT‐rich environments the outline of communicative practices that should prepare
learners for the future. Teachers must continuously keep up with new conventions
and practices through ongoing professional development, according to Lund.
Lund’s study provides an in‐depth analysis of the intricacies involved in the process of
integrating ICTs in EFL classrooms, and can be said to be the present study’s qualitative
counterpart. His theoretically informed investigation of the “messy” reality of ICT integration
provides ”thick” descriptions of individual appropriation‐processes based on a deep
understanding of the multilayered ecology of influencing factors in EFL teachers’ wider social
and cultural context. His fine‐grained presentation of individual processes needs to be
complemented by a study of recurring patterns among larger groups, which is exactly what
this study tries to accommodate for.
Lund has taken advantage of the relative strengths of quantitative methods himself in order
to capture “several refractions of a phenomenon” (Lund, 2004): 12. While the
methodological approach is mainly qualitative, he uses quantitative methods to capture the
beliefs of a sample of teachers in order to create a backdrop for the concerns teachers have
when integrating ICTs. He claims that “complementary approaches may carry a lot of
potential when analyzing dynamic phenomena that appear at individual as well as collective
and institutional levels” (Lund, 2004): 12. The present study sticks to a quantitative
approach, but the findings should be considered in conjunction with results from Lund’s
investigation as they complement, inform and relate to each other.
The methodological context: Classroom integration of ICTs and associated predictors
“Although environmental barriers remain important considerations, it is the individual
differences in beliefs, attitudes, and skills among teachers that is the key area of interest
for researchers today. Educators are the focus of interest because it is educators that
have the primary contact with students and it is educators that experience the barriers
16

and supports to integration of technology first‐hand. Given the critical role of educators,
it is important to understand the contributions that teachers make in supporting or
inhibiting the integration of computer technology in the classroom” (Mueller et al.,
2008): 1524.
The title of the article – “Identifying discriminating variables between teachers who fully
integrate computers and teachers with limited integration” – captures the purpose of Julie
Mueller et al’s recent survey study involving a sample of Canadian primary and secondary
school teachers. They deem it critical to understand teachers’ perspectives regarding
computer integration, given the prevalence of computers in education today, and go on to
provide a comprehensive summary of teacher characteristics and variables that best
discriminate between high and low users of ICTs.
They point out that both “access to ICTs” variables and individual characteristics of teachers
have been identified by previous research as potential barriers to ICT integration in
classrooms. However, recent years’ rapid developments of digital infrastructure and
equipment have weakened the saliency of access variables in explaining differences in ICT
intensity. They maintain that: “[t}he diminished emphasis on costs lends support for the idea
that barriers to computer integration are lessening and research should focus on a teacher’s
attitudes and perceptions as important influences” (Mueller et al., 2008): 1526. The
perceived lack of research into the complexities of the development of a skilled, reflective
technology‐using teacher, was used as a stepping stone for their quantitative study which
included a variety of teacher attributes, both technology and non‐technology specific.
The findings most relevant for the current study include:
1. “The high and low integration groups did not differ in terms of gender, years of
experience, technical problems they had experienced, or the enjoyment and outward
motivation for their work” (Mueller et al., 2008): 1532.
2. “Our results clearly implicate both experience with computer technology and
attitudes toward technology in the classroom as important variables that predict
differences between teachers who successfully integrated computer technology from
those who did not” (Mueller et al., 2008): 1532.
17

3. “Attitudes towards computer technology also proved to be a critical contributor that
distinguished successful and less successful integrators (…). (…). This scale measures
the degree to which a teacher sees computer technology as a viable, productive,
cognitive tool that is appropriate for use within their teaching context” (Mueller et
al., 2008): 1533.
4. “The predictive strength of attitudes toward computer technology as an instructional
tool is consistent with recent research (…). (…) a teacher’s attitude toward
technology, specifically the value of the innovation, along with expected success, was
one of the chief indicators of implementation” (Mueller et al., 2008): 1533.
5. “(…) consistent with previous research, computer experience variables such as
comfort with technology and higher frequency of use of computers were significant
contributors to the function that separated successful (…) secondary integrating
teachers from their non‐integrating peers.(…). Our results, however, suggest that
“general” exposure and use is less critical than very specific, task‐relevant, and
classroom‐applicable experience. Specifically, the positive outcomes measure
contributed the most to the discriminating function for (…) secondary teachers”
(Mueller et al., 2008): 1532.
Many of the items included in Mueller et al’s study, were also included in the current
exploration of teachers ICT use. Some items were adapted to meet the needs of a subject
specific context, others to better capture elements deemed salient in Norwegian lower
secondary schools. However, the similarity of research design and underlying rationales
made the study a particularly important stepping stone for the current study. One of the
conclusions reached in Mueller et al was that further research was needed, especially
concerning the use of ICTs in subject specific contexts. They stated:
“Although the sample size for particular subject areas in the current study was too small
to analyse the data as a function of the subject taught, teachers are likely to need
experiences specific to their topic of instruction. Personal experience with technology
success could be necessary for any change in attitudes and increase in computer
efficacy” (Mueller et al., 2008): 1534.
18

The exploratory context: Acknowledging and adapting to existing structures for successful ICT projects
(Zhao et al., 2002) carried out a particularly relevant study where factors which facilitated or
hindered teachers’ use of technology in their classrooms were identified. It is necessary to
have a closer look at what they found, due to the impact on the current study in terms of
their thinking, approach, and results. They constructed a model to illustrate the relationships
discovered. As illustrated, they placed each factor identified in one of three interactive
domains, the innovator (the teacher), the innovation, and the context.
The innovator (Teacher)• Knowledge of the technology
and its enabling conditions • Pedagogy‐technology
compatibility • Knowledge of the
organizational and social culture of the school
The Innovation (Project) The Context (School)• Distance from school culture • Technological infrastructure
(facility, network, equipment) • Distance from available resources • Human infrastructure (support
staff, policies and procedures) • Distance from innovator’s current practices • Organizational Culture
Successful Implementation of Technology Projects in the classroom
Diagram 4: (Zhao et al., 2002)’s model of factors which facilitated or hindered teachers’ use of technology in classroom contexts
19

Three factors associated with the teacher were found to contribute significantly to the
success of classroom technology innovations: technology proficiency, pedagogical
compatibility, and social awareness. With regard to technology proficiency they found that
teachers’ ability to operate a piece of equipment or use a software application was not
sufficient. Their observations suggested that an additional dimension of technology
proficiency played an equally important part: “knowledge of the enabling conditions for a
technology – (…) knowing what else is necessary to use a specific technology in teaching.
Modern computers and computer‐related technologies are dependent on many contextual
factors to function” (Zhao et al., 2002): 489. They saw that knowledge beyond the actual
application, a broader understanding of technology, played a critical role for success.
Interestingly, they discovered that most teachers reported to be proficient in basic
computing applications (especially those that do not involve the understanding of the
broader computing system), but that there were “significant differences on measures of
more advanced applications that require operations of more than one component” (Zhao et
al., 2002): 491.
With regard to pedagogical compatibility they found that successful integration of ICTs is
‘more likely when teachers are highly reflective about their own teaching practice and goals,
in the sense that they consciously use technology in a manner consistent with their
pedagogical beliefs.’ In contrast, when teachers’ pedagogical beliefs were in conflict with the
technology they attempted to integrate, they struggled to accomplish their objectives.
‘Projects were postponed, severely modified, or simply cancelled.’ Furthermore, positive
results were more likely to materialise when teachers viewed technology as the means to an
end, rather than an end itself, and when they saw ‘an intimate connection between
technology and the curriculum.’ When the value of ICTs was linked to more peripheral
functions, the chance of success was severely reduced.
The social awareness dimension was identified as a crucial element for successful integration
of ICTs. The analyses suggested that socially competent teachers were more likely to
succeed in their efforts, since they ‘knew the social dynamics of the school, were aware of
where to go for what kind of support, and were attentive to their peers.’ In other words,
20

these teachers understood which innovations the social context would constrain and which
ones it would afford.
Having presented the teacher related findings, the study turned to the nature of the
innovation itself. They found that ‘[A] prime determinant of whether a project succeeded or
not was the nature of the innovation itself. Put simply, some innovations appeared much
more difficult to implement than others.’ The study showed that innovations varied along
two dimensions, distance and dependence, and that success was related to these two
dimensions. Distance related to the degree to which the innovation deviated from status
quo, and was found to be of importance in three areas: distance from the existing school
culture, distance from existing practice, and distance from available technological resources.
Dependence referred to the extent to which an innovation relies on other people or
resources – particularly people and resources beyond the teacher’s immediate control.
Distance from school culture was perceived as the degree that an innovation differs from the
dominant set of values, pedagogical beliefs, and practices of the teachers and administrators
in a school. When the innovation converged with the existing school ecology, distance from
the school culture was not a salient issue. In the cases where the innovations were very
distant from the school culture, however, the result was often quite negative. ‘Distance from
the school culture leads to significant, sometimes insurmountable, roadblocks to a project’s
success.’
Distance from existing practice referred to the degree to which an innovation differs from
the prior educational practices of the teacher, i.e. the teacher’s particular practical
experiences. ‘The most successful projects generally involved an innovation that was a
variation of a project previously completed by the teacher.’ Projects which deviated
significantly from previous practices, on the other hand, had to be seriously remodelled or
were abandoned.
Distance from available technological resources refers to the amount of new technologies
(hardware, software, accessories, connectivity, etc.) needed for successful completion of the
innovation. Again, the most successful projects were not very distant – they either required
21

no new technology or minimal purchases or installations. Innovations requiring a lot of new
technological equipment, i.e. were distant, often had to abandon some of the technology
aspects.
The study also identified dependence on others as a salient factor of successful integration of
ICTs. It referred to the degree that the innovation required the cooperation, participation, or
support of people not under the teacher’s authority. The innovations with a low level of
dependence, i.e. that were largely self‐contained in that they only involved the teacher’s
own classrooms and pupils, were most successful. The level of success dropped as
innovations became more dependent on others.
The CALL context: Moving towards normalisation?
Carol A. Chapelle’s contribution to this overview of relevant literature and findings is slightly
different from the rest. In her contribution to the “Handbook of research in second language
teaching and learning”, she presents an outline of the reasons for maintaining that
technology is central to the concerns of second language research and teaching, and
discusses issues of CALL pedagogy. So, (Chapelle, 2005) is in itself a recapitulation of the
current state of the CALL field.
Her point of departure is the major shift in emphasis that has occurred in the course of only
25 years in relation to the importance of technology issues in L2 teaching; “since (…) 1983
(…), technology issues in L2 teaching have spread from the margins, and in the minds of
some, are central to current theory and practice in L2 teaching. Even those who do not see
technology as a central concern would probably agree that applied linguists need to
recognize the ways in which technology affects their work” (Chapelle, 2005): 743. She notes
that the acronym CALL agreed upon in 1983 is now used by journals and language
professionals to denote a wide variety of activities related with technology and language
learning.
Chapelle presents the basic assumption underlying all CALL efforts that ICTs shape and
transform our societies, and points to examples of visions of the technology infused world of
22

language teaching and learning in the future. A common theme is a world in which the
technology is an invisible but integral aspect of language use, “and therefore knowledge of
technology is assumed of anyone who wishes to participate” (Bruce and Hogan, 1998) cited
in (Chapelle, 2005): 743. Chapelle claims that their point is that language professionals need
to recognize how technology is deployed strategically by the competent language user if
they are to teach the language learner about and through technology. “[W]e should
acknowledge the fundamental changes that IT is bringing to our societies and seek ways to
use its power for transformative purposes” (Cummins, 2000) cited in (Chapelle, 2005): 743.
Chapelle suggests that the language required in the technology‐shaped registers of English
use is different from what it was before these new semiotic situations were created through
the introduction of e‐mail, discussion lists, and the like. She stresses that different registers
for language use directly implies that the communicative language ability for the 21st century
is systematically changing, and points to Warchauer who suggests that rather than skill in
reading and writing, language learners need to acquire competence in reading/research and
writing/authorship (Warschauer, 2000): 521 cited in (Chapelle, 2005).
Still, Chapelle draws attention to the fact that only one third (28%) of the “new research”
had to do with measuring learning gains. She states that despite the variety of areas taken
up in the CALL journals and books, most applied linguists would probably agree that among
the critical areas of study for CALL should be empirical evaluation of the extent to which
students learn language from working on CALL (Chapelle, 2005): 750.
Also teachers may be more interested in assessing the quality of writing, rather than the
negotiation of meaning in working with CALL, Chapelle points out, and wants to see more
attempts to examine the language gains made through working on CALL. The issue of quality
needs to be explored, she maintains, perhaps through existing methods developed for the
study of fluency, accuracy, and complexity. “In examining online conversation, Lamy and
Goodfellow (1999) look for evidence of “reflective conversation” in which learners explicitly
refer to the language and their learning, in contrast to “social conversation” in which no
evidence of attention to language and learning appears” (Chapelle, 2005): 753.
23

Theoretical perspectives
“(…) the quality of a theory is determined by the state of development of the particular
discipline. The early stages of a science must be dominated by empirical work, that is,
the accumulation and classification of data. That is why (…) much of educational
research is descriptive. Only as a discipline matures can an adequate body of theory be
developed” (Cohen & Manion, 1994): 16.
This chapter deals with the theoretical underpinnings of the current study. These range from
simple concepts used for the purpose of classification, to more elaborate theories emanating
from a particular view on the fundamental nature of teacher practice. Still, it is imperative to
draw attention to the mainly exploratory and empirical character of this study. One of the
hallmarks of exploratory studies is the lack of specific theories pertaining to the existence of
relationships to be confirmed and tested, and the presence of empirical data from which
new relationships might be discovered providing seeds for new hypotheses and theories. In
short, this is primarily an empirical, not a theoretical study. Hence the research questions
deal with the identification of current ICT use and the ecology of associations of which high
ICT intensity is an integral part.
Since referring to a theoretical framework raises images of one overarching perspective à la
the sociocultural which infuses the entire research approach, it is in the context of the
present study more appropriate to talk about a conceptual framework defined in a wide
sense, as ‘the system of concepts, assumptions, expectations, beliefs, and theories that
supports and informs (…) research Maxwell, 1996, p.25 cited in (Robson, 2002): 63.
Moreover, the composite nature of the problem area suggests the use of conceptual
frameworks in the plural. The areas thus conceptualised are educational ICT use and
teachers’ practice in specific contexts.
The problem area under scrutiny is EFL teachers’ usage of ICTs. The composite and
associated fields are primarily ICT in education, didactics and EFL. Teachers integrating ICTs
in their classroom practice find themselves at the interface of these overlapping fields (Zhao
et al., 2002), (Lund, 2004). Diagram 5 illustrates the intersection of school subject,
24

technologies and didactics in which the ICT‐teacher must operate (adapted version of figure
1.1. in (Lund, 2004): 2).
EFL ICT
Teacher
Didactics
Diagram 5: Illustration of the position of the teacher at the interface between three overlapping fields of enquiry
Furthermore, the diagram shows the interactive relationship between the contextual
factors. The developing nature of educational ICTs, EFL and (subject) didactics are constantly
and mutually influencing each other, and thereby making an impact on the practice of the
EFL teacher. Thus, the view adopted in this study is one which recognises the contributions
from both ICTs and their affordances, and EFL and (subject) didactics.
Section 1: Classifying EFL teachers’ ICT use
The first research question elicits information about the nature of ICT use in EFL classrooms.
In order to highlight some characteristic properties of different uses of ICT, two different,
but complementary, perspectives are employed to categorise the findings. First, by using the
jargon of the field, a basic categorisation of the ICT tools and related usages is presented.
Then, a very general and rather crude classification highlights elements in the main
pedagogical direction expressed through the use of particular ICT tools and activities. All in
all, the objective of the conceptualisation is to improve the overall understanding of the role
ICTs play in the everyday teaching of EFL in Norwegian lower secondary schools, based on;
• an awareness of the characteristics of the main types of ICT tools and related usages;
and
25

• an awareness of the general pedagogical direction expressed through different ICT
use.
The first main objective is to map the nature of EFL teachers’ ICT use. Apart from the fact
that the tools are digital, it is striking how different they are from each other. They are so
different, in fact, that putting them all under the heading ‘digital tools’ is not very helpful in
explaining what these tools can do. Arguably, the most important aspect of e.g. Word
processors, Web‐based drill‐and‐practice and Integrated learning systems is not that they
are digital, but that they can enhance the skill of writing, help rote‐learning and help
organise and assess achievement respectively. In order to clarify the role and character of
the digital tools and activities encountered in this study, a structured overview and
classification is called for. The present classification is a composite of two different, but
overlapping categorisations ((Hinostroza, Labbé, López, & Iost, 2008) and (Mueller et al.,
2008)) adapted to fit the purposes of this study.
Type of application Examples Educational use 1. General tools, tool‐based software and general Internet use
Word processing, presentation, spreadsheet, and online research (general Internet use)
Becoming more and more important; require innovative and creative thinking from the teacher; quality is in the application, not the tool itself, since such tools are not dependent on particular content
2. Communication E‐mail, and web‐based communication in general
Require a view of education as reaching beyond school, for which they offer huge potential; familiar in the out‐of‐school context
3. Subject specific and ready‐to‐use, software/web applications, including Computer‐assisted instruction (CAI)
Specifically educational, drill‐and‐practice, related to a certain kind of content and relatively unsophisticated
Resource‐based, skills‐oriented learning. Offers individual learning opportunities without expensive development; appears to fit well with transmission models of teaching and learning
4. Assessment and organisation Learning Management Systems (LMS), digital portfolios
Mainly organising pupils’ work, feedback, process‐orientation and assessment
Diagram 6: Classification of ICT applications and their educational use
This classification presents a more detailed and differentiated picture of the various digital
tools, and presents terms which are common within the field. The present thesis will use
26

these descriptions as points of departure for the presentation of the nature of EFL teachers’
ICT use.
The activities pupils and teachers engage in using ICTs in EFL classrooms reflect a
pedagogical orientation or direction. By using three main theories of learning as theoretical
lampposts, it is possible to illuminate some of the embedded pedagogical traits in EFL
teachers’ ICT use (Dede, 2008). The three schools of thought used in this study include;
• behaviourism;
• cognitivism; and
• constructivism.
Each school of thought is not a single unified theory, but rather a collection of theories
distinct from each other, but loosely related by a common set of fundamental assumptions
(Dede, 2008). Similarly, the uses of educational ICTs do not neatly cluster into discrete
categories, but rather incorporate perspectives from more than one of these intellectual
positions. For the purposes of the present study a complete presentation of the three
positions is not called for. Instead, a simplified version, more attuned to the relative
importance of Dede’s perspectives in this study, is presented. The following three
paragraphs are based on (Dede, 2008): 46‐53.
Behaviourist theories of learning look at the relationship between stimuli and response, and
measure learning according to the degree to which correct responses follow the
presentation of stimulus. Behaviourist instruction uses immediate consequences to reinforce
behaviours to be learned and to repress incorrect responses to a pedagogical stimulus, i.e.
student motivation to learn is mainly extrinsic. The purpose of education, according to this
school of thought, is for students to “acquire skills of discrimination (recalling facts),
generalization (defining and illustrating concepts), association (applying explanations), and
chaining (automatically performing a specified procedure). (…) Knowledge and skills are
transferred as learned behaviors” (Dede, 2008): 46‐47. Behaviouristic instructional
technologies emphasise “factual knowledge and recipe‐like procedures: materials with a few
correct ways to accomplishing tasks” (Dede, 2008): 46‐47.
27

Within the field of educational ICT, behaviourist learning theories are mainly associated with
drill‐and‐practice applications (web‐based or subject specific software), with their focus on
developing isolated, discrete competences often out‐of‐context. It has been argued that 85%
of the pedagogical software used in schools draw on behaviouristic principles, and have
harmful effects on learning (Jonassen, 2000).
Cognitivist theories of learning look at the symbolic mental constructs which mediate the
objective reality, and measure learning according to the extent to which students master
building blocks of knowledge based on pre‐existing relationships among content and skills.
The role of an instructor is to organise and sequence the building blocks of knowledge to
facilitate optimal mental processing. “Successful learning is dependent not only on what the
teacher or pedagogical medium presents, but also on what the student does to process this
input, storing and retrieving information organized in memory” (Dede, 2008): 48‐50. The
purpose of instruction, according to this school of thought, is to
• provide a deep foundation of factual knowledge and procedural skills;
• link facts, skills, and ideas via conceptual frameworks – organising domain knowledge
as experts in that field do, in ways that facilitate retrieval and application; and
• help students develop skills that involve improving their own thinking processes, such
as setting their own learning goals and monitoring progress in reaching these (Dede,
2008): 48‐50.
Within the field of educational ICT, cognitivist learning theories are mainly associated with
applications used to organise, sequence, and structure pupils’ work and that help them
assess their own progress. LMS and digital portfolios can be said to share properties of a
cognitive nature.
Constructivist theories of learning look at how meaning is created by the individual and
imposed on the world, rather than existing independently of the individual. “People
construct new knowledge and understandings based on what they already know and
believe, which is shaped by their developmental level, their prior experiences, and their
sociocultural background and context” (Dede, 2008): 50‐53. The role of instruction is to
foster learning by organising rich, loosely structured experiences and guidance that
28

stimulate meaning‐making without imposing a fixed set of knowledge and skills. According
to this school of thought, goals for instruction include:
• Instruction is a process of supporting knowledge construction rather than
communicating knowledge.
• The role of the teacher is a guide, rather than an expert ‘transferring’ knowledge.
• Learning activities are authentic and center on learners’ puzzlement as their faulty or
incomplete knowledge and skills fail to predict what they are experiencing.
• Teachers encourage students in reflecting on experiences, seeking alternative
viewpoints, and testing viability of ideas (Dede, 2008): 50‐53.
ICTs are by many seen as particularly conducive for constructivist learning activities, due to
the accessibility of authentic material and applications suited for pupils’ own exploratory
uses in problem solving activities (Lund, 2004), (Salomon, 2000). “The computer is seen in
the literature as a cognitive tool that has great potential to support a constructivist form of
teaching and leaning” (Mueller et al., 2008): 1533. It is primarily the use of general tools and
exploratory uses of Internet that can be said to have clear links to constructivist ideas about
learning and teaching.
Later in this thesis, the identified ICT use among EFL teachers will be classified according to
the conceptual framework presented above, and be analysed in terms of the main
pedagogical direction of the activities involving the use of ICT using the simplified model of
the three schools of thought.
Section 2: Theory of practice as ecological model for the study of ICT use
In chapter 1, I referred to the debate linked to the perceived lack of ICT use among lower
secondary school teachers. One main point of disagreement concerned the role of teachers’
so‐called theory of practice. The directorate for education (Utdanningsdirektoratet)
suggested that teachers’ lack of reflection about their theory of practice could explain their
resistance against integrating ICTs. Spokesmen for teachers’ unions, by contrast, pointed out
that their resistance might just as well emanate from high levels of reflection. Theory of
practice refers to an individual teacher’s values and rationales which have a bearing on his or
29

her actions in a particular context. Theory of practice is used as a theoretical point of
reference in this study, partly because of the topical currency of the term, but primarily due
to its relevance for the study of contextual factors influencing teacher practices.
In the introduction, I mentioned the debate in the wake of the release of the report from ITU
Monitor 2009. The use of ICTs in lower secondary schools had dropped from 2008 to 2009,
and this was regarded by the project manager as troubling. She blamed teachers’
competence and their way of teaching. Her way of framing the situation, is in opposition to
the approach adopted in this study, in that too much emphasis is placed on properties of
teachers, with only the most rudimentary conception and characterisation of the
environment in which teachers find themselves. Instead, this study rests on an ecological
understanding of the educational context teachers are part of.
“In ecological research, the properties of the person and of the environment, the
structure of environmental settings, and the processes taking place within and between
them must be viewed as interdependent and analyzed in systemic terms”
(Bronfenbrenner, 1979): 41.
In keeping with the ecological approach, identified differences in ICT use between groups of
EFL teachers should reflect “major ecological differences between the settings, as revealed
by contrasting patterns of activities, roles, and relations” (Bronfenbrenner, 1979): 183. By
adopting theory of practice as a theoretical point of reference, I bring the ecological
perspective into the assessment of teachers’ practice.
The second research question is posed to extract information about the ecology of factors in
the school context of EFL teachers which are associated with and can account for ICT usage.
Theory of practice depicts the particular relationship between teachers’ theory and practice
as an intimately linked entity which is most fully expressed through teachers’ actions. This
perspective goes hand in hand with this study’s focus on teachers’ actions with ICT, through
which the underlying and complex patterns of associated factors emerge.
30

In addition to fitting nicely with an ecological conception of teachers’ practice, theory of
practice is associated with a reflective‐practitioner approach to the promotion of educational
knowledge. In order to place the reflective‐practitioner approach in context, two other main
approaches to the attainment of educational knowledge beg presentation: the common
sense approach and the science‐of‐education approach (Oxford et al., 1998): 45.
The common sense approach holds that teachers “cannot draw readily upon either a clear
set of theoretical principles or an accepted corpus of scientific research with which to solve
concrete problems in their vocation; teachers need only a sound knowledge of their chosen
subject and practical experience in the classroom” (Oxford et al., 1998):45. In contrast, the
science‐of‐education orientation claims that “such ‘folk’ theories of the child’s mind and
uncritical ideas about the social role of education must be replaced by scientific knowledge
derived from the work of expert authorities” (Oxford et al., 1998): 45.
The reflective‐practitioner approach maintains that the former two orientations fragment
the true relationship between knowledge and action. Instead, “teachers (…) should be
reflective‐practitioners, questioning beliefs and methods in their own experimental
approach to schooling – psychology and sociology being tools or resources for the
construction of new educational hypothesis to be tested against experience” (Oxford et al.,
1998): 45. Similarly, reflective thought is a part of all problem‐solving activity; problem‐
solving has to channel the creative impulses of imagination into precise ideas which can be
tested in practice (Dewey (1933) cited in (Oxford et al., 1998): 46. That is, while practice
provides insight, science must check illusion.
Theory of practice builds upon the kind of understanding found in this reflective‐practitioner
orientation. Theory and practice are understood as complementary in a system of reflection
and action. Teachers’ everyday practice is thus seen as an expression of the intricate entirety
of a teacher’s implicit and explicit knowledge, and is enveloped by the definition of theory of
practice as “a person’s private, interconnected, continuously changing system of knowledge,
experiences, and values which influences a person’s teaching practice at a given point in
time” (Lauvås & Handal, 1990). Accordingly, classroom actions are understood as
expressions of;
31

• an individual’s values; and
• an individual’s rationales for action.
Diagram 7 illustrates the relationship between a teacher’s actions and his theory of practice
(involving both values and rationales).
Diagram 7: Løvlie’s ‘practice triangle’ illustrating the relationship between actions and ‘theory of practice’ (Lauvås & Handal, 1990)
The values serve as justification for actions, and are often unarticulated, e.g. notions about
human dignity, democracy, equality. The individual can have a sense of what is the right and
wrong, and act accordingly in a particular educational context, regardless of questions like
effectiveness or rationale for action. So, even if these values are ‘silent’, they have a
fundamental impact on classroom action. Background variables such as a teacher’s age or
gender might function as triggers for particular sets of values that can influence e.g. ICT use
in EFL classrooms. Values and rationales for action overlap and complement each other
along a continuum.
Justification valuesP3
Theory of practice
Practice Rationale: Practice experience, vicarious experiences Theory theoretical knowledge
P2
ActionsP1
32

The rationales for action consist mainly of two types; (a) experiences, both personal and
vicarious, and; (b) theories. The rationales for action in the case of ICT in EFL teaching might
include considerations related to e.g.;
• the content in EFL lessons;
• the organisation of EFL lessons;
• strengths and weaknesses as a EFL teacher;
• the national curriculum;
• personal and vicarious experiences;
• ICT access and affordance;
• the effects on pupils’ motivation and learning; and
• formal qualifications EFL and ICT.
By using theory of practice as a theoretical point of reference, one highlights the ecology or
system of associations of which EFL teachers’ use of ICTs is a part. ICT use is thus seen as a
component of a larger and more complex system of factors where teachers’ actions, values
and rationales are acknowledged. The conceptual framework is chosen to throw light on and
inform the enquiry into the second research objective relating to the identification of
variables associated with EFL teachers ICT use. It is deemed open‐ended enough to be
appropriate for an exploratory investigation of a range of variables, and still focussed
enough to be appropriate for putting the findings into an overarching theoretical framework
which will make the findings meaningful, interesting and relevant.
33

Chapter 3: Research design and method
“It is obvious that one can no more set out to experimentally identify (…) the causes of the
French revolution than one can contemplate interviewing a gene.” (Bhaskar (1979) cited in
(Robson, 2002): 35).
In this chapter I will present the procedures used for obtaining the data required for
answering the research questions, and conduct an evaluation of the overall quality of the
adopted approach. The chapter starts with a presentation of the research design, followed
by an account of participant characteristics, including a description of the population and
sampling procedures. Then, a brief description of questions used to explore the constructs
with potential links to teachers’ ICT use is given, before an account of the data collection
process is provided. The chapter ends with a discussion about the overall trustworthiness of
the study and generalisability of the findings based on an evaluation of reliability and
validity.
Section 1: Research design A common point of departure for choosing a research design is the nature of the research
questions sought answered. In short, the research strategy and the methods employed must
be appropriate for the questions to be answered (Robson, 2002): 80. The strategy must also
take into consideration the practical constraints of location, time, and resources. And finally,
design is very much about style; the researcher’s own ideals, preferences and ideas will
ultimately influence the overall research design (Robson, 2002): 80.
In the current study, the starting point is the ambition to say something about the nature of
ICT use among Norwegian EFL teachers’ in lower secondary schools, and the system of
elements associated with ICT intensity. From there, the overall research strategy developed.
In order to explicate the essence of this overall research design, I will in the following
elaborate on some key concepts. Those concepts are; ‘quantitative’, ‘relational’,
‘exploratory’, and ‘pragmatic’.
34

First and foremost, the research objectives pointed clearly towards so‐called fixed or
quantitative designs. The survey method was seen as a fairly obvious choice due to the
constraints of location, time and resources linked to a one‐year Master’s project. So, the
current research design is fixed in the sense that a substantial amount of pre‐specification,
especially concerning the development of the self‐completion questionnaire, took place
before the main part of the research study. It is also quantitative in the sense that the
gathered data is primarily in quantitative form, and statistical techniques are used to find
answers to the research questions.
By choosing this research design, I could gather data from many teachers across the country.
A qualitative design would severely limit the number and location of teachers. Also, the
quantitative nature of the data opened up for using statistical analyses that were helpful in
describing single variables, in showing correlations between variables, and in identifying
underlying patterns of interactions in and between variables. Qualitative approaches could
definitely provide “thicker and deeper” descriptions of a limited number of teachers’
practice, since quantitative approaches necessarily have to simplify. However, qualitative
designs could not accommodate for the identification of communalities between large
numbers of teachers required in the current study. One might say that the strong internal
validity of qualitative designs is paid for by a corresponding lack of external validity, whereas
weaker internal validity is compensated by a corresponding presence of external validity in
quantitative designs.
The fixed design in the current study is also relational in the sense that it measures the
relationship between two or more variables. It does it without manipulating or changing the
phenomena studied, i.e. it is non‐experimental. Hence the relational design is suitable in
situations where aspects of interest are not amenable to modification. Relational designs are
particularly useful for descriptive purposes and in enhancing the understanding of a
phenomenon, through identifying particular patterns of interactions (Robson, 2002): 155.
These characteristics fit nicely with the focus of the current study which is to describe the
nature of EFL teachers’ ICT use, and to investigate the system of variables related to high ICT
intensity.
35

A precondition for applying a relational design, however, is to have a quite clear idea (e.g.
from previous research or other sources) of likely mechanisms and the contexts in which
they will operate, in order to identify important variables and possible relationships to be
studied (Robson, 2002): 156. This precondition for the use of a relational design is met, first
and foremost, through recent teaching experience at a lower secondary school emphasising
the use of ICTs (a so‐called PILOT school), secondly, through the use of feed back on the
items included in the questionnaire from 20 teacher trainees and 10 experienced teachers,
and thirdly, through previous research and literature.
The design is also relational in a wider, ecological sense. By focussing on the system of
variables related to high ICT intensity, I show that a particular practice must be understood
in light of the interaction and mutuality with its environment. It follows that a change in one
variable changes the entire set of variables. In the current study this perspective manifests
itself through the large number of variables checked for their relation to ICT intensity, and
through the choice of some of the statistical analyses performed on the data set.
This is also an explorative study. Primarily, it is exploratory by necessity. Few quantitative
studies of teachers’ subject specific ICT use in Norway have been carried out, with a
corresponding lack of established hypotheses and theories required for confirmatory
studies. So, the study is to some extent charting unknown waters, and consequently,
anticipated outcomes of the study include the formulation of new hypotheses and the
instigation of new studies. Secondarily, the design is exploratory by attitude. This is reflected
in an ingrained curiosity on the behalf of the researcher, with concrete manifestations in the
exploratory use of statistical techniques such as factor analyses and optimal scaling.
Finally, the design is pragmatic both in a concrete and in a more philosophical sense. On a
concrete level, the pragmatic element relates to the practical constraints of time, resources,
and one’s own level of academic sophistication. Needless to say, each has a profound impact
on the issue of design. This study is the basis for a Master’s thesis and involves one year of
work from start to finish, and the questions asked and the methods employed reflect that
fact. On a more philosophical or methodological level, the pragmatic aspect refers to a
general eclectic research approach. This involves choosing theories and methods on the
36

basis of ‘what works’ and makes sense, not on the basis of deep analyses of whether they
are commensurable or not. The approach is deemed feasible, because of some fundamental
beliefs shared by most researchers, including; the value‐ladenness of enquiry; the theory‐
ladenness of facts; that reality is multiple, complex, constructed and stratified; and the
underdetermination of theory by fact (i.e. that any particular set of data is explicable by
more than a single theory)” (Robson, 2002): 43.
The four concepts, each in its own way, infuse the entire research process from underlying
purposes and theories, via the expressed research questions, to the methods and sampling
strategies settled on. They also accommodate for and help maintain the balance between
the five interrelated aspects presented in diagram 8. Ideally, there should be some
directionality in the process, in that purposes and theory feed into, and help specify, the
research questions, which again determine the methods to be used and the strategy to be
used in sampling. However, this should not to be taken to imply a once‐and‐for‐all
consideration of all aspects; the interactive nature of what goes on in this kind of project
needs to be emphasised (Robson, 2002): 81‐82.
purpose(s) theory
Research questions
method(s) Sampling strategy
Diagram 8: Framework for research design (Robson, 2002): 82
37

Section 2: Participants The final sample included 124 EFL teachers representing 66 lower secondary schools from 18
of 19 Norwegian counties (“fylke”).9 The majority of participants were female (86 female
and 38 male). The age distribution of the sample was fairly even between the five age grou
apart from slightly fewer teachers among the youngest (20‐29) and oldest (>60).
ps
10 In terms
of teaching experience, the distribution was slightly skewed with relatively more participants
with 7 years experience or less, and 15 years or more.11 More than 60 per cent of the
participants had 60 credits or less formal qualifications in the subject.12
The population in the current study is EFL teachers in Norwegian lower secondary schools,
since the aim of the study is to say something about national trends of ICT use among EFL
teachers in lower secondary schools. It is not possible to gather data from the entire
population of EFL teachers, so a sample will have to do. Ideally, I would like to randomly
select a sample of EFL teachers from a known population. In reality, the exact size of the
population is not known, due to the fact that teachers teach more than one subject. So, an
alternative approach was used.
First, a sample of schools, geographically stratified according to the total number of teachers
in each region (“fylke”), was randomly selected. From a total number of 1161 lower
secondary schools nationally (found in the national school data base), a sample of 172
schools from across the country was randomly selected. This meant that from a total
number of 17049 lower secondary school teachers, the sample consisted of 2212 randomly
selected teachers. The exact number of EFL teachers in the sample is impossible to
determine from the information provided in the national data base. The response rate is
therefore also impossible to calculate. What is certain is that approximately 5.6 per cent or
124 of the total sample of teachers answered the questionnaire, and provided the data upon
9 See Appendix, diagram 38: Regional distribution of EFL teachers in the sample 10 See Appendix, diagram 39: Age distribution in sample 11 See Appendix, diagram 40: Teaching experience distribution in sample 12 See Appendix, diagram 41: Formal English qualifications in sample
38
which the current study rests. The participants were the ones who regarded themselves, first
and foremost, as EFL teachers.13
Section 3: Statistical analyses The current study relies on quantitative data collected using an online survey. The data is
analysed using a number of different statistical analyses. A general overview of these
analyses is presented in this section, so that main functions of each statistical technique are
understood before the commencement of actual analyses.
First, using descriptive or univariate (only involving one variable) statistical analysis, means
(M) and standard deviations (SD) on individual items are found. The mean coefficient tells us
something about the combined value of all the individual respondents’ answers, and can
thus be interpreted as a value signifying a central tendency. The standard deviation
coefficient, however, tells us something about the degree to which the individual
respondents’ answers are spread out along the value axis, and can thus be interpreted as a
value signifying degree of consensus (low value signifying high degree of consensus).
Second, by using bivariate (involving two continuous variables) correlation analysis it is
possible to determine the degree to which two variables are associated or covary. If the two
are negatively correlated, they are associated in the sense that an increase in one variable is
associated with a decrease in the other. If they are positively correlated, an increase in one is
associated with an increase in the other variable. It is important not to think in terms of
causal relationships when we are dealing with correlation analysis, since an identified
positive correlation between two variables does not necessarily mean that there is a causal
link between the two.
Third, by using ANOVA (one‐way between‐groups ANOVA) it is possible to determine
whether there are significant differences in mean scores between three or more groups (a
categorical independent variable with three or more groups) in relation to a continuous
variable. An example of a typical research question where ANOVA is useful could be: Is there 13 See Appendix, diagram 42: Regional distribution of schools (total and sample), teachers (total and sample), and EFL teachers.
39

a difference in scores on beliefs in ICT‐effects between low, medium and high ICT integrating
EFL teachers? After establishing that there are significant differences, it is possible to run
post‐hoc tests to find out where these differences lie.
Fourth, by using standard multippel regression it is possible to determine how well a set of
variables is able to predict a particular outcome, and determine the relative contribution of
each of the variables that make up the model. Examples of typical research questions where
multippel regression is useful could be:
• how well a set of variables is able to predict a particular outcome;
• which variable in a set of variables is the best predictor of an outcome; and
• whether a particular predictor variable is still able to predict an outcome when the
effects of another variable are controlled for (Pallant, 2007):147.
Julie Pellant points out that multippel regression is based on correlation, but “allows a more
sophisticated exploration of the interrelationships among a set of variables. This makes it
ideal for the investigation of more complex real‐life, rather than laboratory‐based, research
questions” (Pallant, 2007): 146.
Fifth, using exploratory factor analysis (Principal Component Analysis) makes it possible to
identify underlying groups, patterns or dimensions (hereafter referred to as factors) in
respondents’ answers to a scale of items in the data set. Factor analysis is a ‘data reduction’
technique in the sense that it determines “the smallest number of factors that can be used
to best represent the intercorrelations among a set of variables” (Pallant, 2007): 181.
“It [Principal Component Analysis] takes a large set of variables and looks for a
way the data may be ‘reduced’ or summarised using a smaller set of factors or
components. It does this by looking for ‘clumps’ or groups among the
intercorrelations of a set of variables. This is an almost impossible task to do ‘by
eye’ with anything more than a small number of variables” (Pallant, 2007): 179
This technique is particularly useful for the creation of additive indices based on scales
consisting of many variables connected thematically, rather than theoretically (which would
40

require the scale to be reliable). A case on point could be a scale consisting of variables
linked to content in the national curriculum. By using exploratory factor analysis it is possible
to identify underlying patterns in the teachers’ answers, which in turn can be used to create
additive indices, i.a. they become constructs made on the basis of empirical evidence rather
than theoretical assumptions. However, factor analysis does not provide an interpretation or
a label for each pattern or factor; it just shows which variables ‘group together’. It is then up
to the researcher to propose possible interpretations based on an understanding of the
content of the variables, underlying theory and past research.
There are two main approaches to factor analysis, exploratory and confirmatory. Exploratory
factor analysis is normally used in the beginning of research to “gather information about
(explore) the interrelationships among a set of variables”(Pallant, 2007):179. Confirmatory
factor analysis is used to “test (confirm) specific hypotheses or theories concerning the
structure underlying a set of variables” (Pallant, 2007):179. In the present study an
exploratory approach to factor analysis is most suited, due to the lack of previous research
and a corresponding lack of specific hypotheses or theories pertaining to the different scales
involved.
Due to the limitations of the Master’s thesis format, I will not present in detail all the various
assumptions met and statistical techniques used for the creation of the additive indices
based on factor analysis. It will therefore not be possible to provide the reader with the
opportunity to completely control the quality of the indices. Instead, I have included the
relevant tables and figures in the Appendix (KMO, Bartlett’s Test, Kaiser’s Criterion, Scree
Plot and Pattern Matrix). Furthermore, in cases where the results from the analysis did not
make sense theoretically or logically, I have included comments as to how I solved the
problem. All the additive indices included in the statistical analyses used to answer the
reseach questions passed the standard quality controls imposed when conducting factor
analysis (Pallant, 2007): 179‐200.
41

Section 4: Materials and procedure Each participant was asked to complete an online survey consisting of 248 items in all. The
survey was developed based on existing literature, the guidelines in the national curriculum,
personal experience and the responses from a focus group consisting of 20 teacher trainees
and 10 experienced teachers. Each member of the focus group had completed the draft
questionnaire by August/September 2008, and provided feedback regarding the items used
and the absence of items they deemed important. On that basis existing items were altered
or removed, and new items were included. There was no time to run a complete pilot test,
which might have uncovered more weaknesses in the questionnaire. More details on the
development of the individual items in the questionnaire are provided later in this section.
The main phase of data collection was conducted from November 2008 till March 2009, by
which time 153 teachers had completed the questionnaire. The questionnaire was made
available online, and the import of data to SPSS was catered for by the ICT department. Each
headmaster of sample schools was contacted via e‐mail informing them about the study and
encouraging participation. A list of randomly selected stand‐by schools from each region was
used in cases where non‐participation was declared. A minimum of two follow‐up mails
were sent to each headmaster. Still, it turned out to be exceedingly hard to get enough
answers. In the course of the five months of data collection, I called up headmasters of
sample schools and the ICT responsible in numerous counties in an effort to try and increase
the response rate. When the total number of teachers had reached 153 in March 2009, the
data collection process was terminated. Only 124 were retained after cleaning the data set
for duplicates, obviously silly answers, and non‐sample answers.
The survey included a comprehensive set of measures addressing both subject specific and
ICT related constructs. The subject specific scales of items were related to self‐perceived
competence, content and activities, and organising teaching. Single‐item questions were
used to assess formal qualifications, experience, as well as to gain information about the
participants’ age and gender. The ICT related constructs included ICT intensity, ICT general
positive belief, and ICT positive effects. Single‐item questions were used to assess formal
and informal ICT competence. Extracts of the scales of items used to measure each construct
are included below.
42

A particularly important feature of this study is the way underlying patterns, dimensions or
groups in teachers’ answers form the basis for the development of new constructs. The lack
of previous research on subject specific influences on ICT use and the corresponding lack of
established theories or hypotheses meant that there were few ready‐to‐use, available
theoretical constructs. Therefore an important part of the analyses involved identifying
underlying patterns, groups or dimensions in the answers of EFL teachers on three subject
specific subscales (self‐perceived competence, content and priorities, and organising
teaching). These underlying dimensions, groups or patterns in the data set formed the basis
for the creation of additive indices or constructs that in turn could be measured for their
association with ICT. For example; on the basis of teachers’ answers to 21 items on the self‐
perceived competence scale, four underlying dimensions, groups or patterns were identified.
Some items tended to group together, e.g. the self‐perceived ability to organise project work
‘grouped’ together with the self‐perceived ability to organise group work. The variables
constituting the four underlying dimension were then computed into additive indices, which
in turn were used as single constructs in subsequent analyses regarding their association
with ICT use. The three scales of items on which this explorative approach was used, include
items 2.3.1‐22 (self‐perceived competence), items 4.1.1‐27 (content and activities), and
items 4.3.1‐16 (organising teaching).
Some of the subscales of questions needed only be computed into indices after establishing
their reliability. In these cases the Cronbach’s alpha (α) coefficient is provided. A case in
point might be the ICT general positive belief subscale. Here all the individual items are
picked out because previous research suggests that positive beliefs in ICT influence the use
of ICT, hence all individual items are expressions of positive beliefs. A high Cronbach’s alpha
coefficient (α>.6) indicates that the individual items measure the same underlying
theoretical construct, and therefore they can be computed into a single additive index
measuring ICT general positive belief. However, as mentioned, some subscales consist of
items that do not have a predefined relationship with the use of ICT. The subscale Content
and activities, for example, consists of 27 different items related to standard content and
activities in the teaching of EFL. The main purpose of this subscale is to provide information
about how differences in teachers’ priorities regarding content and activities translate into
43

differences in ICT use. It is therefore necessary to identify underlying patterns, dimension or
groups in the teachers’ answers, on the basis of which the additive indices are computed. In
order to find these underlying dimension, patterns or groups in the data set, the statistical
‘data reduction’ technique called factor analysis is used.
There are two reasons for using factor analysis in this study. First, by reducing a large
number of variables to a more manageable number, it is possible to perform statistical
analyses on a much wider set of data. This opens up for paths of investigation otherwise
closed if faced with the complexity of numerous individual variables. Second, the results of
the analysis are interesting findings in their own right by revealing ‘groups’ or patterns
among the intercorrelations of a set of variables. This is particularly important when an
exploratory approach to factor analysis is used.
Subject specific scale 1: Self‐perceived competence (SPC)
The 21 items constituting the Self‐perceived competence (SPC) scale included elements
connected with the preparation and organisation of different kinds of activities, and the
carrying out of central EFL teachers’ duties such as correcting and assessing pupils’ work.14
The questions asked the teachers to rate the extent to which they found these different
tasks challenging, using a 6‐point, Likert‐type scale (1 – Can’t do it, to 6 – no problem). Since
the scale was undergoing further analyses after the collection of the data set to identify
constructs, the issue of reliability is not relevant and the Cronbach’s alpha value is therefore
not included. A small part of the questionnaire is shown below to illustrate the types of
items included and the anchors used in the 6‐point Likert‐type scale.
14 See Appendix, diagram 43: Self‐perceived Competence – descriptive findings
44
Previous research identified teachers’ SPC or their so‐called self‐efficacy as a factor that
could explain the degree to which ICTs were integrated in their teaching. By revealing
patterns in the teachers’ answers, main types of SPC can be identified and used as additive
indices in analyses related to EFL teachers’ use of ICT. Factor analysis showed that the SPC
scale of 21 items could be summarised or reduced to four additive indices:15
• SPC Basic language skills (M=5.63; SD=0.45)
• SPC Language and assessment (M=5.33; SD=0.51)
• SPC Innovative planning (M=5.22; SD=0.65)
• SPC Facilitative teaching (M=5.00; SD=0.70)
The additive index SPC Facilitative teaching was created by computing items 2.3.8; 12; 13;
14; 15. SPC Innovative planning was made on the basis of items 2.3.1; 16; 19. SPC Language
and assessment was the result of combining items 2.3.6; 7; 9; 10; 17; 18; 20; 22. SPC Basic
language skills was created by computing items 2.3.2; 3; 4; 5.
It is important to note, that when interpreting the factor analysis, I found that most variables
loaded strongly on only one factor, but there were a couple of exceptions. In most cases
where variables loaded on several factors, they were computed on the factor it showed the
strongest loading. There is one notable exception, however. Item 2.3.3 refers to teachers’
self‐perceived competence in planning and carrying out listening activities. It loaded on
factor two (SPC Innovative planning) and factor three (SPC Basic language skills). Despite of a
slightly stronger loading on SPC Innovative planning, it was computed along with the
variables loading on SPC Basic language skills. The theoretical inspection suggested that
listening activities had more in common with reading, writing and communication, than with
the ability to integrate ICTs in EFL teaching.16
The belief that one can plan and carry out activities such as projects and cross‐curricula tasks
loaded on the factor that was the basis for the additive index SPC Facilitative teaching. The
label is the same as the one Hattie uses in his massive meta‐meta‐analysis for activities
15 See Appendix, diagram 44, 45, and 46: KMO and Bartlett’s test, Kaiser’s criterion, Scree test 16 See Appendix, diagram 47: SPC – Pattern Matrix
45

involving high degrees of pupil freedom for exploration (Hattie, 2009). The mean value
(M=5.00) for this additive index indicates that teachers feel quite confident planning and
carrying out these kinds of activities, but when compared with the other underlying
dimensions, it is the one they are least confident about. Similarly, the fairly low standard
deviation coefficient (SD=0.70) points to a fairly homogeneous set of answers. However,
compared with the other main types of activities, it is the one where teachers show the least
degree of consensus. A second main dimension uncovered is labelled SPC Innovative
planning, and are based on items such as “learn new ICTs for teaching EFL”, and “integrate
new material”. The high mean value (M=5.22) and relatively low standard deviation
(SD=0.65) indicate that teachers are generally confident in their ability to integrate new
material and use ICTs in their teaching, and that most teachers share that view. The next
main pattern is called SPC Language and assessment, and refers to the degree of confidence
teachers have when it comes to tasks such as correcting pupils’ language, being a language
model, and teach grammar. Overall, there is a general consensus among teachers that they
can plan and carry out these kinds of tasks in their classes (M=5.33; SD=0.51). The teaching
of writing, reading, communication and listening is labelled SPC Basic language skills, and are
the types of tasks teachers feel most confident about planning and teaching (M=5.63). This
view is shared by a large proportion of the teachers (SD=0.45). Overall, the process has
shown the relative distribution of self‐perceived competence related to important elements
in the teaching of EFL. Moreover, the underlying dimensions discovered in the data set imply
that some types of self‐perceived competence tend to group together.
Subject specific scale 2: Content and activities
The 27 items constituting the Content and activities scale were created on the basis of the
competence aims to be reached after grade 10, as defined in the national curriculum.17
Consequently, the items were linked to the three main areas; Language learning,
Communication and Culture, society and literature. The main area Language learning
concerns knowledge about the language, language usage and insight into processes of
language learning. The main area Communication focuses on how to use the English
language for communication, through the use of basic language skills and appropriate
17 See Appendix, diagram 48: Content and activities – descriptive findings
46
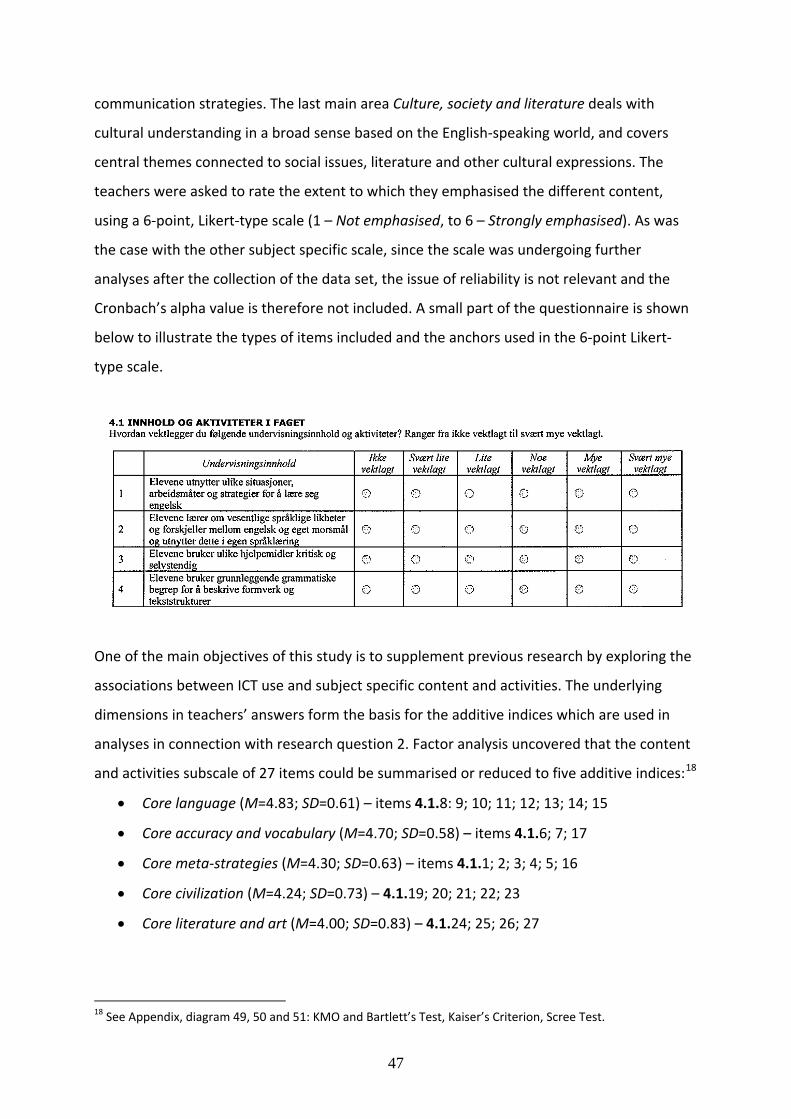
communication strategies. The last main area Culture, society and literature deals with
cultural understanding in a broad sense based on the English‐speaking world, and covers
central themes connected to social issues, literature and other cultural expressions. The
teachers were asked to rate the extent to which they emphasised the different content,
using a 6‐point, Likert‐type scale (1 – Not emphasised, to 6 – Strongly emphasised). As was
the case with the other subject specific scale, since the scale was undergoing further
analyses after the collection of the data set, the issue of reliability is not relevant and the
Cronbach’s alpha value is therefore not included. A small part of the questionnaire is shown
below to illustrate the types of items included and the anchors used in the 6‐point Likert‐
type scale.
One of the main objectives of this study is to supplement previous research by exploring the
associations between ICT use and subject specific content and activities. The underlying
dimensions in teachers’ answers form the basis for the additive indices which are used in
analyses in connection with research question 2. Factor analysis uncovered that the content
and activities subscale of 27 items could be summarised or reduced to five additive indices:18
• Core language (M=4.83; SD=0.61) – items 4.1.8: 9; 10; 11; 12; 13; 14; 15
• Core accuracy and vocabulary (M=4.70; SD=0.58) – items 4.1.6; 7; 17
• Core meta‐strategies (M=4.30; SD=0.63) – items 4.1.1; 2; 3; 4; 5; 16
• Core civilization (M=4.24; SD=0.73) – 4.1.19; 20; 21; 22; 23
• Core literature and art (M=4.00; SD=0.83) – 4.1.24; 25; 26; 27
18 See Appendix, diagram 49, 50 and 51: KMO and Bartlett’s Test, Kaiser’s Criterion, Scree Test.
47

Most variables loaded strongly on only one factor in the analysis.19 However, there were two
anomalies in the pattern which had to be addressed. First, factor five was constructed on the
basis of a few variables, but only one that loaded strongest on that factor (item 4.1.18:
communicate using digital media). Obviously, that factor could not be retained. The variable
“communicate using digital media” was consequently not represented in the final set of
factors and subsequent additive indices. Second, factor six (Core literature and art) consisted
mainly of variables concerning the use of literature and art in language teaching. Yet, item
4.1.16 concerning the critical use of different sources loaded more than .3 only on that
factor (since all measures below .3 are not presented). On the basis of a theoretical
inspection, the item in question was computed along with the variables constituting factor
three (Core meta‐strategies) instead.
The descriptive findings show that teachers put most emphasis on content and activities
dealing with the four basic skills of reading, writing, listening and speaking. This conclusion is
supported by the high mean score on the additive index Core language (M=4.83; SD=0.61).
Also helping pupils express themselves as accurately and precisely as possible is an
important objective for most teachers. This is indicated by a high mean score on the index
Core accuracy and vocabulary (M=4.70; SD=0.58). There is a step down to the next three
indices – Core meta‐strategies (M=4.30; SD=0.63), Core civilization (M=4.24; SD=0.73), and
Core literature and art (M=4.00; SD=0.83) – on the list of most emphasised content and
activities in the teaching of EFL. Overall, the process leading up to the creation of five
additive indices has revealed the relative distribution of teachers’ emphasis on central
content and activities. In addition, the underlying dimensions imply that some types of
content and activities tend to group together.
Subject specific scale 3: Organising teaching
The 16 items constituting the Organising teaching scale included elements intimately
connected with the organisation of EFL teaching.20 Some of the items are identified by
previous research as particularly effective for pupils’ learning (Ibsen, 2004) and (Hattie,
2009); some had been recommended by proponents as particularly helpful for so‐called 19 See Appendix, diagram 52: Content and activities – Pattern Matrix 20 See Appendix, diagram 53: Organising teaching – descriptive findings
48
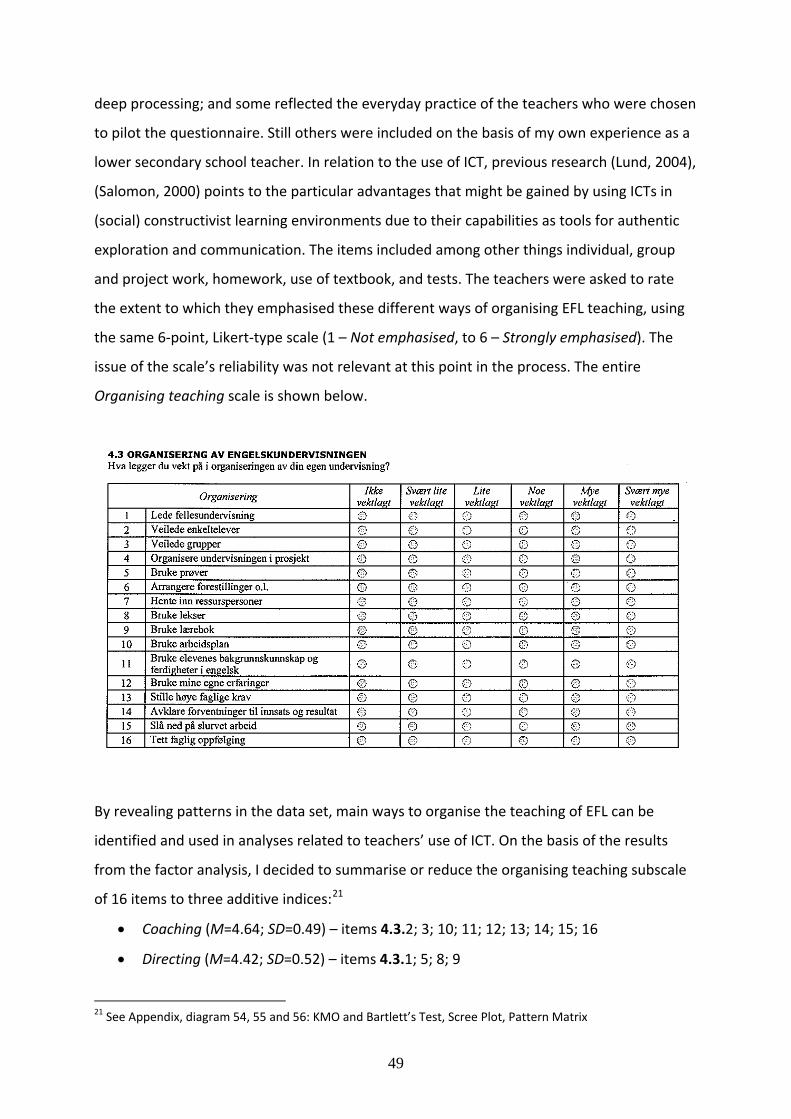
deep processing; and some reflected the everyday practice of the teachers who were chosen
to pilot the questionnaire. Still others were included on the basis of my own experience as a
lower secondary school teacher. In relation to the use of ICT, previous research (Lund, 2004),
(Salomon, 2000) points to the particular advantages that might be gained by using ICTs in
(social) constructivist learning environments due to their capabilities as tools for authentic
exploration and communication. The items included among other things individual, group
and project work, homework, use of textbook, and tests. The teachers were asked to rate
the extent to which they emphasised these different ways of organising EFL teaching, using
the same 6‐point, Likert‐type scale (1 – Not emphasised, to 6 – Strongly emphasised). The
issue of the scale’s reliability was not relevant at this point in the process. The entire
Organising teaching scale is shown below.
By revealing patterns in the data set, main ways to organise the teaching of EFL can be
identified and used in analyses related to teachers’ use of ICT. On the basis of the results
from the factor analysis, I decided to summarise or reduce the organising teaching subscale
of 16 items to three additive indices:21
• Coaching (M=4.64; SD=0.49) – items 4.3.2; 3; 10; 11; 12; 13; 14; 15; 16
• Directing (M=4.42; SD=0.52) – items 4.3.1; 5; 8; 9
21 See Appendix, diagram 54, 55 and 56: KMO and Bartlett’s Test, Scree Plot, Pattern Matrix
49

• Facilitating (M=3.08; SD=0.76) – items 4.3.4; 6; 7
The information gained from the full administration of factor analysis suggested a five‐factor
solution, not three‐factor as I ended up with. However, a five‐factor solution did not make
sense theoretically; the variables loading on each factor did not have anything in common.
Thus, I had to explore the data set further to try and identify the presence of logical
patterns. This approach is condoned in the literature. “Tabachnick and Fidell (2007)
recommend that researchers adopt an exploratory approach, experimenting with different
numbers of factors until a satisfactory solution is found” (Pallant, 2007): p.182. I did this by
setting the number of factors I wanted, before running the principal component analysis
(thus disregarding Kaiser’s criterion). I tried with different numbers of factors, and the only
pattern that made theoretically sense was a three‐factor solution explaining almost 50 per
cent of the variance in the data set.22
Items related to keeping a close eye on pupils’ work to give feedback, expecting good
results, clarifying expectations to effort and results, and being hard on sloppy work loaded
on the factor that was the basis for the additive index Coaching. The label is from (Oxford et
al., 1998): p.34, where it refers to the language teacher as a coach who “reminds,
encourages and prods the learner to perform well, that is, to “win” at the game of learning
or at least play the best game possible”. Of the ways to organise teaching presented in this
study, coaching is most strongly emphasised (M=4.64). The teachers also generally share this
approach to the teaching of EFL (SD=0.49). A second main dimension uncovered is labelled
Directing, and is based on the use of tests, homework, class teaching, and the textbook in
organising EFL classes. A fairly high mean value (M=4.42) and low standard deviation
(SD=0.52) indicate that EFL teachers generally depend on these elements in their teaching.
Facilitative teaching is much less emphasised by most teachers (M=3.08), and the opinions
are more divided (SD=0.76). Checking the most common activity on this subscale, project
work, still reveals low levels of emphasis (M=3.22) and the opinions are even more divided
(SD=0.98). Overall, we have discovered the relative distribution of some main ways to
organise EFL teaching. Moreover, the underlying dimensions discovered in the data set, even
22 See Appendix, diagram 57: Organising teaching – Kaiser’s Criterion
50

though the findings are not clear cut, imply that some types of organisation tend to cluster
together.
ICT intensity
ICT intensity is a composite of the 14 items (α=.90) constituting the ICT activities scale (items
5.1.2‐15),23 and serves as the mechanism for the exploration of other variables’ association
with ICT use. The items relates to different types of ICT activities performed by pupils in the
EFL classroom, from the use of learning platforms or Learning Management Systems
(hereafter referred to as LMS) to producing digital text using word processors. The items
were primarily selected on the basis of the computer related items included in (Mueller et
al., 2008): 1527‐28, but were adapted to meet the special context of Norwegian EFL
classrooms. Five main types of ICT activities are covered by the items: on‐line research,
general tool use, subject‐specific web or software use, communication, and assessment. The
teachers had to rate the frequency of use, using a 6‐point Likert‐type scale (1 – Never, to 6 –
Very often). The better part of the scale is shown below to illustrate the types of items
included.
23 See Appendix, diagram 58: ICT activities – descriptive findings
51

The additive index ICT intensity (M=3.47; SD=0.78) measures EFL teachers’ overall use of ICT.
The 14 items constituting the index are duly classified, categorised and analysed in chapter 4
since they show the frequency of different ICT activities, and thus provide answers to the
first research question related to the nature of EFL teachers’ ICT use. Here, however, the
descriptive findings are not commented on. The high Cronbach’s alpha coefficient (α=.90)
suggested that the 14‐item subscale was reliable, i.e. that the individual items measured the
same underlying construct. I found it therefore appropriate to compute them into a new
single index.
Two main types of ICT use
The 14 items constituting the ICT activities scale are also the basis for the creation of two
additive indices measuring different main types of ICT use. These are ICT for production and
information management (hereafter referred to as IPIM) (M=3.42; SD=0.88) and ICT for drill
52

and practice (hereafter referred to as IDAP) (M=3.54; SD=0.82). These indices are not made
purely on the basis of theoretical assumptions, but are patterns that emerge from the data
itself. Put more precisely, they are constructs made on the basis of empirical evidence found
in the current study. They are in other words legitimate findings in their own right. I will
provide a more thorough presentation of the characteristics of the two patterns of ICT use in
chapter 4, when dealing with the findings related to the nature of teachers’ ICT use. Here, on
the other hand, the focus is on the procedures used to create the additive indices.
The additive index ICT intensity is created simply by computing the 14 items related to
teachers’ use of different ICT activities, after making sure that the subscale is reliable as
expressed by a high Cronbach’s alpha coefficient. Similarly, the indices for main types of ICT
use are created by computing two different sets of items from the same ICT activities
subscale. IPIM is a composite of items 5.1.2; 5; 6; 9; 10; 11; 12; 15, and IDAP is a composite
of items 5.1.3; 4; 7; 8; 13; 14. However, IPIM and IDAP are not well‐established categories
based on previous research or theory. They emerge as patterns only through the exploratory
use of factor analysis on the collected data in the current study.
Factor analysis was used to try and identify different main types of ICT use among the
sample of teachers, by exploring the underlying factor structure of the data from the 14
items in the ICT activities subscale. The factor analysis suggested two factors that could be
used to best represent the intercorrelations among the 14 items. Before additive indices
were made on the basis of the factor analysis, I checked to see if the result made sense in
light of previous research and a general understanding of the content. In this case the
variables connected with the use of general tools, i.e. tools which to not contain any content
of its own, all loaded substantially on factor one. The variables linked to the use of subject
specific software, i.e. tools that contain language material for the pupils to work with, all
loaded strongly on factor two. Since the proposed factors passed the theoretical inspection,
the variables loading on the respective factors were computed into the two additive indices
labelled ICT for Production and Information Management (IPIM) and ICT for Drill and Practice
(IDAP).
53

I have tried to make labels that ‘capture the essence’ of the variables loading on each factor.
They are meant to communicate some vital information about the nature of the variables
underlying the additive indices. The first factor included variables related to digital text
production, the use of LMS, and other general tools without content of their own, hence its
label ICT for Production and Information Management (IPIM). Nearly all the variables
loading strongly on factor two were subject specific software used for practicing language
skills and knowledge, so it was called ICT for Drill and Practice (IDAP). These indices are basic
tools used in further analyses required to answer the research questions.
ICT tools
The questionnaire also contained 16 items used to measure the use of specific ICT tools by
both teachers and pupils. These items were not computed into composite constructs, but
were kept as single variables. ICT tools covered by these items include mainly general tools,
such as word processors, presentation tools, sound players and recorders, image and video
editors, and Internet use in general. The use of Internet can naturally also take subject‐
specific forms through the use of e.g. drill and practice programmes. The teachers
responded using the same 6‐point, Likert‐type scale as for ICT activities. All the items are
presented below.
54

ICT general positive belief
The additive index ICT general positive belief (M=4.49; SD=0.87) measures teachers’ beliefs
in the positive contribution of central ICT affordances.24 The index was created by
computing the original subscale of four items on the General ICT beliefs scale (questionnaire
no. 6.1.1.1‐6.1.1.4), after having established that the scale was reliable (α=0.85). The items
were in the form of predefined statements which were supposed to explain the relationshi
between ICT use and good results in the subject. A corresponding scale of statements
regarding the relationship between ICT use and poor results was also included in the
questionnaire, but is not used in this study. The teachers rated the degree to which the
agreed with these predefined explanations on a 6‐point, Likert‐type scale (1 – Strongly
disagree, to 6 – Strongly agree). The content of the statements can be seen
p
y
in the table
elow.
b
24 See Appendix, diagram 59: General ICT beliefs – descriptive findings
55

ICT positive effects
The additive index ICT positive effects (M=3.80; SD=0.81) is a composite of six items (items
7.1.12; 13; 17; 20; 21; 22) from the Fundamental beliefs scale.25 The six items were
computed into one additive index after the Cronbach’s alpha coefficient (α=.88) showed that
the scale was reliable. The items were in the form of predefined statements. The construct is
meant to measure EFL teachers’ attitudes concerning the effectiveness of ICT for obtaining
good results, the extent to which ICT supports their pedagogical approaches, and whether
ICT supports the attainment of traditional and new subject specific objectives. The teachers
rated the extent to which they agreed with the six statements using a 6‐point, Likert‐type
scale (1 – Strongly disagree, to 6 – Strongly agree).
Section 5: Trustworthiness and generalisability The conclusions reached in this thesis must naturally be seen in light of the potential
weaknesses in the data collection process itself and in the possibility of a non‐representative
dataset. Three main sources of errors can be identified when it comes to the issue of
representativity: (a) the online launch, (b) the voluntary aspect, and (c) the ICT aspect.
25 See Appendix, diagram 60: ICT positive effects – descriptive findings
56

First, the survey was launched online. This may have kept older teachers from answering,
and may have spurred more ICT competent teachers into answering. An alternative, paper‐
based survey to complement the online launch would have met this challenge to
representativity and was in fact considered, but rejected on the grounds of lack of time and
resources.
Secondly, even though headmasters and the ICT responsible at the selected schools were
encouraged to go through the survey with the teachers, the most common approach was for
the headmaster to inform the teachers about the survey and encourage them to answer.
This might pose a challenge to representativity due to the possibility that the survey was
answered by a disproportionately high number of ICT enthusiasts and highly motivated
teachers in general. Teachers with below average English competence and motivation in
general might therefore be under‐represented. This challenge to representativity was
reduced by the fact that the teachers of some individual schools actually did the survey
together in the official meeting time with the help of an ICT responsible. However, due to
the high number of questions (248 items) it took roughly 35‐40 minutes to complete the
survey, thereby accentuating the problem of reaching only the most motivated teachers.
Perhaps the increase in information “richness” gained by the high number of items was paid
for by a decrease in representativity.
And finally, the mere fact that the survey was designed to capture teachers’ ICT priorities
might have put off more traditionally oriented and perhaps older teachers and once again
encouraged ICT enthusiasts and perhaps younger teachers. An opposite trend that might
reduce the impact of this challenge to representativity is that some ICT sceptics might use
the opportunity to let their voices be heard. Considering the three potential challenges to
representativity together the survey might have reached a disproportionally high number of
(a) highly motivated and competent English teachers, and (2) ICT enthusiasts and teachers
below the age of 50.
The relative impact or relevance of the main findings in this study depends on their validity.
The ambitious aim was to say something about the ICT priorities of Norwegian EFL teachers
in lower secondary schools. This could be achieved by randomly selecting a representative
57

sample of EFL teachers from across the country, and from which it would be possible to
statistically infer the relevance for the entire population of EFL teachers. In the current
study, however, it is not possible to establish whether this aim is reached, since the exact
response rate is not possible to establish due to the simple fact that the total population of
EFL teachers is not known. It is also doubtful that 124 answers are adequate. However, a
fairly balanced distribution of teachers in terms of geography, age and gender, educational
depth and experience might be seen to strengthen the claim of validity of the findings.
Low participation does not necessarily imply poor data, though. If lack of participation is
linked to the topic of a study, e.g. if teachers who don’t use ICTs, don’t bother answering the
questionnaire, there is a problem of generalising findings to the population of EFL teachers.
If lack of participation is random, on the other hand, the assumptions underlying the use of
statistical inference are met.
There are also significant challenges related to self‐reporting in general. There is some
question as to how closely reported‐philosophy matches actual behaviour. There might not
be a close connection between espoused views and attitudes as expressed in a
questionnaire, and teachers’ actual practice. There may actually be little correlation
between stated beliefs and actual practice. However, this threat to the validity of the
findings finds its counterpart in the challenges involved in directly observing teachers’
practice. The fact that the questionnaire consisted of 248 items related to a whole range of
issues, might counteract to some extent the problem with espoused theories. When
establishing entire ‘clouds of correlations’ based on the answers to all the 248 items, main
tendencies rather than clear‐cut answers are found and these might be considered less
vulnerable to the possible effects of self‐reporting. Still, in the future it would be useful to
separate views and attitudes, that the teachers have, but which do not necessarily have an
effect on their practice, from strongly held convictions that might have a more direct effect
on practice. Despite the various threats to the validity of the findings, the main trends
identified in this study are fairly well documented and can hopefully be used as points of
departure in future research efforts.
58
Chapter 4: Results
The two research questions posed in this study are: “What characterises the use of ICTs in
EFL classrooms, and what attitudes and knowledge do the teachers have regarding new
technologies?” and “How is EFL teachers’ reported ICT use associated with; a) their
knowledge about ICT and their thoughts relating to the usefulness of and experiences with
technology; and b) their background, subject specific priorities and qualifications?” In this
chapter the findings related to EFL teachers’ use of ICTs are presented first, before the
account of the findings related to the system of associated variables which can help explain
what is characteristic about EFL teachers with a high level of ICT‐integration.
Section 1: State of ICT use, ICT competence and attitudes among EFL teachers ICT use is center stage in this study. It is the single most important factor, as it is the point of
departure for our journey of discovery. As outlined in chapter 3, a number of items in the
questionnaire were constructed specifically for the purpose of illuminating ICT use. The
individual questions were grouped in two scales: ICT activities and ICT tools, of which the
former, ICT activities, is the most important one in this study. This is due to the more fine‐
tuned and fine‐grained character of the questions asked. The ICT tools scale plays a
supporting role, strengthening the findings reached using the main scale. Concerning EFL
teachers’ attitudes to ICT, the scales relating to the belief in positive effects of ICT on pupils’
learning and general ICT positive belief, are used. Formal ICT competence relates to the
number of credits of formal higher education, whereas informal ICT competence is
measured via the respondents’ need for ICT access in their spare time and whether they
deem their total ICT competence as solid. Single variables used in the Self‐perceived
competence (SPC) additive index will also be used to strengthen the understanding of EFL
teachers’ view of their own ICT competence.
There are two main categories of results presented in this section. First, using descriptive,
univariate statistical analysis, means (M) and standard deviations (SD) on individual items
are found. These measures tell us something about the general frequency of use of a
particular ICT activity or tool, and the degree to which there is consensus among the
59

teachers about that particular use.26 Moreover, having the descriptive results from each
variable lets us present a rank order of the ICT activities and tools based on their mean
values, thereby, providing a general overview of the nature of EFL teachers’ ICT use. The
second set of results presented in this section tries to accommodate for the fact that there
are patterns of ICT use, i.e. some types of ICT use tend to go together as described in chapter
3. By identifying these patterns we get access to a more differentiated picture of EFL
teachers’ ICT use. EFL teachers’ ICT competence and attitudes are only analysed using
descriptive statistics in this section. In the next section these will be viewed in light of the
role they play in the total system of factors that are associated with the ICT intensity of EFL
teachers.
In chapter 2 I elaborated on the three conceptual frameworks used in this study to briefly
classify, categorise and analyse the nature of EFL teachers’ ICT use. The first simply
introduced and defined the common concepts used in the field to denote types of ICT tools
and activities, and suggested some major challenges and affordances to each. The concepts
needed in this particular study were devoted particular attention. These included;
• general tools, such as word processing, presentation tools, spreadsheets, and general
web‐resources;
• subject‐specific software or web‐resources, such as grammar practice programmes;
• teacher tools, such as LMS, and digital portfolios; and
• communication tools, such as e‐mail.
The second perspective provides a slightly different angle by shifting the attention to the
purpose of ICT use. The five main types of ICT use suggested from this perspective were;
• online research;
• tool‐based software use;
• subject‐specific software use;
• communication; and
• assessment. 26 It is important to note, however, that the frequency of ICT use is not deemed to be a measure of quality, in and of itself, in the current study. The relative distribution of frequencies is primarily useful as basis for the correlation analyses used to determine the system of associations related to ICT use presented later in this chapter.
60

The first two conceptual frameworks have so much in common that it would be artificial to
try and keep them separate. Instead, the two perspectives will be used simultaneously in the
effort of classifying and categorising the identified ICT use among EFL teachers.
The last theoretical framework consisted of an extremely simplified version of some central
characteristics of three highly complex learning theories – behaviourism, cognitivism, and
constructivism. These characteristics are used in this study to throw light on some main
pedagogical implications of the identified ICT use, and are not intended as a launch pad for
thorough analyses.
Descriptive findings – general overview of teachers’ ICT use
In this section I will first present the descriptive findings related to the ICT tools scale, before
I elaborate on the results from the univariate analysis on the data from the ICT activities
scale. The ICT tools scale consists of items used to obtain data about both pupils’ and
teachers’ use of various ICT tools in class, whereas the items on the ICT activities scale are
only related to pupils’ use.
First, let us concentrate on the results from the univariate analysis conducted on the ICT
tools subscale. What tools dominate in EFL teachers’ practice? And what is the relative
frequency of use of the different ICT tools among pupils and teachers?
61

Descriptive findings ICT tools pupils and teachers
1,0 2,0 3,0 4,0 5,0 6,0
Spreadsheets e.g. excel
Sound recorder/editor e.g. Audacity
Video editor
Image editor
Sound player
Presentation e.g. Power Point
Internet
Texteditor e.g. Word
ICT
tool
s
M
Teachers (M)Pupils (M)
Diagram 9: Descriptive findings on the use of different ICT tools in the teaching of EFL
Diagram 9 clearly shows that there are three main types of ICT tools that are totally
dominant in Norwegian EFL classrooms; digital word processors, Internet use, and digital
presentation tools. These three tools are fairly often used by both pupils and teachers. The
mean coefficients for the use of digital word processors are slightly higher for teachers
(M=5.1; SD=1.1) than for pupils (M=4.8; SD=0.9), and the fairly low standard deviations
suggest a fairly high degree of consensus regarding the use of digital word processors in EFL
classrooms. Similarly, Internet use is a common activity for both teachers (M=4.9; SD=1.0)
and pupils (M=4.7; SD=1.1), even though teachers’ opinions are slightly more split than for
the use of word processing. Digital presentation tools are slightly less used than word
processors and Internet. The mean coefficients are much lower for teachers (M=3.5; SD=1.4)
than for pupils (M=4.1; SD=1.1), and the opinions are markedly more split regarding
teachers’ use than pupils’ use of presentation tools.
Diagram 9 shows that the other ICT tools included in this study are rarely used. Digital sound
players (such as Windows Media Player) are used to some extent (teachers: M=3.1; SD=1.7.
62

Pupils: M=2.9; SD=1.5), but very high standard deviations suggest a high number of extreme
values on both sides of the mean, indicating that many teachers use it fairly often, or hardly
ever. Next on the list we find the use of image editors. Again, these are rarely used by
teachers (M=2.6; SD=1.6) and pupils alike (M=2.6; SD=1.4), and a lack of consensus regarding
their use is expressed through high standard deviations. Still, they are more often used than
spreadsheets, video editors and digital sound recorders, which are very rarely used in EFL
classrooms. It is worth noting, though, that EFL teachers use spreadsheets (M=2.2; SD=1.4)
more often (or less rarely) than digital sound recorders (M=1.8; SD=1.2).
What about the distribution of frequencies between main ICT uses found in the analysis of
the variables included in the ICT activities scale? Will the results complement and strengthen
the findings emanating from the analysis of the ICT tools scale?
Descriptive findings ICT activities
2,6
2,6
2,7
3,0
3,1
3,3
3,4
3,5
3,5
3,7
3,8
3,8
4,1
4,4
2,0 2,5 3,0 3,5 4,0 4,5 5,0
Digital portfolios for assessment
Software for sound recording
Digital communication
Software/websites for practicing Br./Am.Civilization
Digital information exchange
Software/websites for grammar practice
Game-like pedagogic software
Downloaded English texts
Independent pedagogic net-resources
Pedagogic web-resources to textbook
Learning platform
Online research
Digital presentation tools
Digital text production
ICT
activ
ities
M
Diagram 10: Descriptive findings related to teachers' use of different ICT activities in the teaching of EFL
63

The findings presented in diagram 10 clearly complement the previous ICT tools findings.
Most teachers regularly let the pupils write texts using digital word processors (M=4.4;
SD=1.0) and use digital presentation tools such as Power Point (M=4.1; SD=1.1). The
operationalization of Internet use is comparably refined and differentiated in this scale; one
item in the ICT tools scale is turned into nine here. Three of these Internet‐related activities
are sometimes used. The first is the use of online research (M=3.8; SD=1.1), which simply
means that pupils collect, use and present material found on the web. The next is the use of
an LMS (Learning Management Systems) (M=3.8; SD=1.5) in connection with EFL lessons.
The third is the use of pedagogic web‐resources which are provided by publishers and linked
to the content of the text book (M=3.7; SD=1.1).
Furthermore, diagram 10 tells us that other uses of Internet are found less often in EFL
classrooms, e.g. pupils working on independent pedagogic web‐resources (M=3.5; SD=1.0);
pupils working on English texts found on the web (M=3.5; SD=1.1); pupils exchanging
information and experiences using digital tools (M=3.1; SD=1.2); and pupils using digital tools
to communicate with each other and pupils in other countries (M=2.7; SD=1.4). Rather
surprisingly, digital portfolios are rarely used (M=2.6; SD=1.5) in connection with EFL classes.
The findings from the two scales – ICT tools and ICT activities – show that EFL teachers first
and foremost make use of ICTs for text production and presentations. Internet is also used in
a variety of ways, the most common ones being online research, the use of LMS, and
pedagogic web‐resources connected with the text book. Other activities are only rarely used
in Norwegian EFL classrooms.
Factor analysis – identifying patterns of ICT use
The general overview helps us see the relative frequency of use of various individual
variables expressed through mean values. The standard deviation coefficients add a measure
of the degree of consensus regarding the use of a particular ICT tool or activity. However, by
only looking at data emanating from one variable at the time (univariate analysis), the
relationship between the different variables is not explored. Even though a measure of
64

variability is included for each variable through the standard deviation, systematic variability
existing between the variables remains in the dark. This might create the impression that
there is only one main way that teachers of EFL use ICTs in their teaching, while it is probably
safe to assume that there are as many ways as there are teachers in this study. One way to
reach a more refined understanding of this messy reality is to perform a qualitative study
providing “thick” descriptions based on established theoretical frameworks. In the current
study, however, we deal with aggregates based on quantitative data, so we must rely on the
identification of underlying dimensions or patterns in the data set to determine main types
of ICT use.
In chapter 3 we showed the two underlying dimensions, groups or patterns in the data set
emanating from the items included in the ICT activities subscale. These two main patterns
are gateways to a deeper understanding of the different ways ICTs are used by EFL teachers,
and so need to be presented in more detail.
The variables constituting each of the two underlying dimensions were computed into two
additive indices reflecting main types of ICT use: ICT for production and information
management (IPIM) and ICT for drill and practice (IDAP). The similar mean and standard
deviation coefficients for IPIM (M=3.4; SD=0.9) and IDAP (M=3.5; SD=0.8) show that they are
equally often used and there is a similar degree of consensus regarding their use.
As mentioned in chapter 3, these indices are not made purely on the basis of theoretical
assumptions, but are patterns that emerge from the data itself. Put more precisely, they are
constructs made on the basis of empirical evidence found in the current study. So let us have
a closer look at the variables constituting IPIM and IDAP respectively.
The variables constituting the additive index IPIM include digital word processing,
presentation tools, LMS and digital portfolios. The label stems from the nature of these
variables. The variables constituting the additive index IDAP include applications which
contain relevant content and are ready‐to‐use for the practice of e.g. grammar or civilization
topics, hence the label ICT for drill and practice. These applications are normally web‐based
and are often linked to the text book.
65

What is the association between the two main types of ICT use? Do teachers using one main
type of ICT use rarely use the other, or do they tend to use both types?
Diagram 11: Associations between IPIM and IDAP
Diagram 11 shows that the two main types are not mutually exclusive. In fact, the overlap
between the two is substantial. There is a significant and strong positive correlation (r=.66)
between the two, which means that teachers using IPIM a lot tend to use IDAP a lot as well.
In fact, by squaring the correlation coefficient (0.66x0.66=0.44) and multiplying this
‘coefficient of determination’ with 100, you get a measure of shared variance expressed in
per cent, which in this case is 44. So, one might say that IDAP accounts for nearly 44 per cent
of the variance in respondents’ scores on the IPIM index and vice versa.
We have seen the distribution of variables constituting the two main additive indices,
providing the basis for the claim of having identified two main types of ICT use among EFL
teachers. However, we have also seen that there is a high degree of overlap between IPIM
and IDAP, thus weakening the claim of having uncovered two different types of use. So, in
order to get a clearer picture of the situation, the two additive indices are correlated with
the variables on the ICT tools subscale.
66

Bivariate correlations IPIM/IDAP and ICT tools
ICT for production and information management
ICT for drill and practice
Pearson Correlation 1.000 .656**
Sig. (2‐tailed) .000
ICT for production and information management
N 115.000 114
Pearson Correlation .656** 1.000
Sig. (2‐tailed) .000
ICT for drill and practice
N 114 119.000
Pearson Correlation .491** .389**
Sig. (2‐tailed) .000 .000
5.2.1teacher: ICT‐tools text editor e.g. Word
N 115 119
Pearson Correlation .637** .482**
Sig. (2‐tailed) .000 .000
5.2.1pupils: ICT‐tools text editor e.g. Word
N 115 119
Pearson Correlation .287** .238**
Sig. (2‐tailed) .002 .009
5.2.2teacher: ICT‐tools spreadsheets e.g. excel
N 115 119
Pearson Correlation .473** .398**
Sig. (2‐tailed) .000 .000
5.2.2pupils: ICT‐tools spreadsheets e.g. excel
N 115 119
Pearson Correlation .604** .423**
Sig. (2‐tailed) .000 .000
5.2.3teacher: ICT‐tools presentation e.g. PowerPoint
N 115 119
Pearson Correlation .578** .373**
Sig. (2‐tailed) .000 .000
5.2.3pupils: ICT‐tools presentation e.g. PowerPoint
N 114 118
Pearson Correlation .474** .537**
Sig. (2‐tailed) .000 .000
5.2.4teacher: ICT‐tools Internet
N 114 118
Pearson Correlation .555** .510**
Sig. (2‐tailed) .000 .000
5.2.4pupils: ICT‐tools Internet
N 115 119
Pearson Correlation .409** .303**
Sig. (2‐tailed) .000 .001
5.2.5teacher: ICT‐tools image editor
N 115 119
Pearson Correlation .424** .326**
Sig. (2‐tailed) .000 .000
5.2.5pupils: ICT‐tools image editor
N 115 119
Pearson Correlation .377** .224*
Sig. (2‐tailed) .000 .014
5.2.6teacher: ICT‐tools videoeditor
N 115 119
5.2.6pupils: ICT‐tools video Pearson Correlation .355** .205*
67

Sig. (2‐tailed) .000 .025
N 115 119
Pearson Correlation .324** .257**
Sig. (2‐tailed) .000 .005
5.2.7teacher: ICT‐tools sound player, e.g. Windows Media Player
N 113 117
Pearson Correlation .326** .288**
Sig. (2‐tailed) .000 .002
5.2.7pupils: ICT‐tools sound player, e.g. Windows Media Player
N 112 116
Pearson Correlation .400** .361**
Sig. (2‐tailed) .000 .000
5.2.8teacher: ICT‐tools sound recorder/editor e.g. Audacity
N 112 116
Pearson Correlation .415** .328**
Sig. (2‐tailed) .000 .000
5.2.8pupils: ICT‐tools sound recorder/editor e.g. Audacity
N 112 116
**. Correlation is significant at the 0.01 level (2‐tailed).
*. Correlation is significant at the 0.05 level (2‐tailed). Diagram 12: Correlation IPIM/IDAP and ICT Tools
Diagram 12 makes it possible to compare the two sets of correlations, and thus discern some
main differences between IPIM and IDAP. The first striking difference concerns the use of
word processors. Even though both types of ICT use are positively correlated with the use of
word processors, the correlations are much stronger in relation to IPIM (teachers: r=.491;
pupils: r=.637) than IDAP (teachers: r=.389; pupils: r=.482). Another interesting difference
relates to the use of digital presentation tools. Again both IPIM (teachers: r=.604; pupils:
r=.578) and IDAP (teachers: r=.423; pupils: r=.373) show significant positive correlations, but
they are much stronger in the case of IPIM. So, the associations existing between the use of
both word processors and presentation tools on the one hand, and IPIM on the other, are
much stronger than the associations found between these tools and IDAP.
When it comes to the use of Internet, the tendencies are slightly different. IPIM shows
stronger positive correlations to pupils’ use, than to teachers’ use (teachers: r=.474; pupils:
r=.555), whereas IDAP displays the opposite with stronger correlations to teachers’ than
pupils’ use of the Internet (teachers: r=.537; pupils: r=.510). All in all, IPIM shows a stronger
correlation than IDAP in relation to pupils’ use of the Internet, and IDAP shows a stronger
relationship than IPIM regarding teachers’ use. IPIM shows on the whole stronger
correlations than IDAP in relation to the rest of the ICT tools included in this study.
68

EFL teachers’ ICT competence and attitudes
Previous research has identified formal ICT competence as a variable with bearing on the use
of ICT in teaching (Mueller et al., 2008). Some critics have questioned the ICT competence of
Norwegian teachers, and blamed the modest use of new technologies in education on lack
of skills. It is therefore important to look more closely at EFL teachers’ formal and informal
ICT competence.
EFL teachers in general have little or no formal qualifications in ICT. More than 70 percent
have no formal qualifications, whereas 20 percent have 30 credits or less. Still, a majority of
EFL teachers are very confident when it comes to their ICT competence. Almost 70 percent
agree with the statement that their total ICT competence is solid. The impression of fairly ICT
competent teachers is strengthened by the fact that more than 90 percent report that they
need access to ICTs in their spare time. The EFL teachers’ answers to individual variables
from the self‐perceived competence scale corroborate the findings. Here, nearly 80 percent
claim they have few or no difficulties when it comes to learning how to use new digital tools,
and almost 70 percent feel confident that they can make the most of digital tools’ potential
in the teaching of EFL. High mean values and low SD values show that most EFL teachers
share this view.
Another highly salient variable identified by previous research as having impact on teachers’
integration of digital technologies, is teachers’ beliefs in the positive effects of ICT on pupils’
learning and positive attitudes to ICTs more on a general basis (Mueller et al., 2008). First,
what are the EFL teachers’ general attitudes?
69

General explanations ICT and good results
3,9
4,3
4,9
4,9
2,0 2,5 3,0 3,5 4,0 4,5 5,0 5,5
6.1.1.4: ICT good results: help and cooperatemore using the net
6.1.1.3: ICT good results: pupils workindependently and present it (e.g. portfolios)
6.1.1.2: ICT good results: net access to morevaried material
6.1.1.1: ICT good results: subject matter moreinteresting
mean
Diagram 13: General ICT positive – descriptive findings
General explanations ICT and bad results
2,9
2,9
3,4
3,5
4,1
4,3
2,0 2,5 3,0 3,5 4,0 4,5
6.2.1.3: ICT bad results: digital tools too timeconsuming
6.2.1.5: ICT bad results: ICT-use leads toknowledge about ICT-use not subject matter
6.2.1.4: ICT bad results: ICTs beneficial forsubject matter other than defined in curriculum
6.2.1.2: ICT bad results: ICTs real importance notmeasured in tests
6.2.1.1: ICT bad results: Internet distract pupilsfrom their work
6.2.1.6: ICT bad results: many other factors arefar more important than ICT
mean
Diagram 14: General ICT negative – descriptive findings
Diagram 13 shows clearly that EFL teachers in general believe in positive effects of ICT due to
the availability of more varied material and the opportunity to make subject matter more
interesting. Also ICTs’ contribution to the development of pupils’ autonomous work and
presentations is appreciated. However, diagram 14 shows that a majority of EFL teachers
deem many other factors than ICT to be far more relevant for pupils’ achievements. They
70

also see problems connected with pupils’ use of the Internet since it can distract pupils’ from
their work. Are these results corroborated by the findings relating to the more direct effects
of ICTs on different aspects of pupils’ learning?
Beliefs ICT effects
2,4
2,7
3,3
3,3
3,6
3,7
3,7
3,8
3,8
4,2
2,0 2,5 3,0 3,5 4,0 4,5
7.1.15: grade importance: use of ICT worse resultstheoretically strong
7.1.14: grade importance: use of ICT worse resultstheoretically weak
7.1.7: grade importance: time spent on ICTs couldbe used more productively
7.1.16: grade importance: use of ICT no change inresults
7.1.13: grade importance: use of ICT better resultsgirls
7.1.17: grade importance: ICT support my didacticpriorities and methods
7.1.12: grade importance: use of ICT better resultsboys
7.1.21: grade importance: ICT more efficient waysof acheiving trad. aims
7.1.20: grade importance: ICT leads to increasedpupil autonomy
7.1.22: grade importance: ICT reach new aimswhich are positive for Eng. subject
mean
Diagram 15: Beliefs ICT effects – descriptive findings
Diagram 15 shows clearly that EFL teachers see more positive than negative effects of ICT.
The variables with low mean values are related to negative or no effects of ICT, while
variables with fairly high mean values are all related to the expectation of positive effects of
ICT on pupils’ learning. EFL teachers are particularly satisfied with the way ICTs make it
possible to reach new aims which are positive for the English subject. Moreover, they also
see ICT as a contributing factor to more efficient ways to reach traditional objectives, and
are content with the way ICTs help develop pupils’ autonomy.
71

Section 2: ICT use and the system of associations The second main research question raised in this thesis was: “How is EFL teachers’ reported
ICT use associated with; a) their knowledge about ICT and their thoughts relating to the
usefulness of and experiences with technology; and b) their background, subject specific
priorities and qualifications?” The rationale for identifying this system of ICT associated
variables was to get a clearer picture of observable characteristics of EFL teachers with a
high level of ICT‐integration. In chapter 5 the theoretical framework relating to ‘theory of
practice’ is used to cast light on what this system of associations can tell us about ICT related
differences between EFL teachers. This section is in other words dedicated to the
identification of variables which are associated with and can account for EFL teachers’ ICT
use.
The three steps undertaken in this section to identify and understand the system of ICT
associated variables include:
1. Identifying associations by comparing mean values;
2. Checking strength and direction of the identified relationships and identifying the
‘cloud of correlations’; and
3. Determining the predictive strength of the identified system of ICT‐related variables,
and the relative contribution of particularly salient variables.
The first step involves using the statistical technique ANOVA in order to find significant
differences in group values on a continuous variable. The additive index ICT intensity is
transformed from a continuous to a categorical variable consisting of four groups in order to
accommodate for ANOVA. Each of the four ICT intensity groups consist of 25 percent of the
respondents according to their degree of ICT intensity, so that the first group consists of the
25 percent of the respondents using ICT the least, and the fourth group consists of the 25
percent using ICT the most. The differences between the four groups in relation to many
variables, e.g. their belief in positive effects of ICT, are then analysed comparing mean
values. Variables on which there are significant differences in mean values between the four
groups are retained as part of the system of ICT associated variables.
72

The second step involves using the statistical technique bivariate correlation and
multidimensional scaling (PROXSCAL). Bivariate correlation is used to check the strength of
the relationships identified in the ANOVA analysis. The additive index ICT intensity is here in
its original continuous form. Since this study is based on an ecological understanding of the
educational context as elaborated on in chapter 3, it is necessary to not only identify the
association between to variables at the time (bivariate), but to identify the associations
existing between all the variables constituting the system as a whole. This is important
because the statistical techniques used in this study must pick up on the idea that a change
in one factor in an educational context influences the entire ecology of factors.
Multidimensional scaling (PROXSCAL) is used to visually represent this ‘cloud of correlations’.
The third step involves using the statistical technique multippel regression in order to
determine the predictive strength of the identified system of ICT‐related variables, and the
relative contribution of particularly salient variables. This is important because it makes it
possible to evaluate the saliency of the empirical evidence used when trying to characterise
EFL teachers with high ICT‐integration.
Step1: Identifying associations comparing mean values
The additive index ICT intensity is used in this study as a measure of the overall use of ICTs by
EFL teachers. It is thus the key variable that all the other variables are tested against in the
effort of identifying salient relationships. By comparing the mean coefficients of each of the
four ICT intensity groups on e.g. the index ICT general positive belief, it is possible to
determine whether there are significant differences between the four groups. If there is a
significant difference, it is possible to reach a deeper understanding by comparing the mean
scores.
In the following the focus is solely on variables producing significant differences in mean
scores between the four ICT intensity groups. This entails that analyses showing insignificant
results are not presented in detail. Analyses showing significant results, on the other hand,
are elaborated on. For each group of indices checked for associations with ICT intensity, I will
first present the ANOVA table showing the F‐values and levels of significance, and then
73

present diagrams showing the important differences in mean scores. The F‐value is an
expression of the magnitude of difference between the four ICT groups’ mean values, and
thus an expression of the strength of association existing between the two variables (e.g.
between ICT general positive belief and ICT intensity).
Before we move on to the analyses, a brief overview of the variables involved is required. In
step one, background variables relating to the respondents’ age, gender, experience, and
level of education in English are checked. These are factors that might have an indirect
impact on teachers’ actions by influencing their general values.
In step two, the index formal ICT competence and variables need access to ICTs on spare
times and my total ICT competence is solid are investigated for their relationship with ICT
intensity. These variables are assumed to have a more direct impact on teachers’ ICT use.
In step three, variables linked to the national curriculum are explored. These include the five
basic skills and the three main areas in the national curriculum for English. These are
variables that have a bearing on teachers’ rationale for different actions, but are extraneous
elements that do not necessarily reflect teachers’ attitudes or beliefs.
In step four, indices expressing positive beliefs in ICTs in various ways are investigated. Here
we find the two indices ICT general positive belief and ICT positive effects. These are
assumed to be intrinsic elements of teachers’ attitudes and beliefs, and thus have a direct
influence on EFL teachers’ rationale for using ICTs in class.
In step five, the indices created on the basis of the three subject specific subscales self‐
perceived competence, content and activities and organising teaching are investigated for
their associations with ICT intensity. These are also assumed to be intrinsic elements of
teachers’ attitudes and beliefs and thus have a direct influence on EFL teachers’ rationale for
action.
74

ANOVA results
The first step involves checking background variables for significant associations with EFL
teachers’ ICT intensity. The ANOVA analysis showed that there were no significant
differences in mean scores between the four ICT intensity groups in relation to the variables
age, gender, experience and education. Based on this result, we can exclude the background
variables from further analyses, and conclude that they do not play central roles in the
system of ICT associated variables.
The second step involves checking the index formal ICT competence (M=1,7; SD=1,4) and the
single variables need access to ICTs in spare time (M=5,1; SD=1,1) and my total ICT
competence is solid (M=4,0; SD=1,4) for significant associations with EFL teachers’ ICT
intensity.
ANOVA
df Mean Square F Sig.
Between Groups 3 8.210 4.682 .004
Within Groups 113 1.754
ICT ed. level
Total 116
Between Groups 3 6.100 5.635 .001
Within Groups 115 1.083
2.6.1: Need access to ICTs in my spare time
Total 118
Between Groups 3 14.601 9.175 .000
Within Groups 117 1.591
2.6.2: My total ICT competence is solid
Total 120 Diagram 16: ANOVA – ICT intensity (binned) and formal and informal ICT competence
Diagram 16 shows that there are significant differences between the four ICT intensity
groups in relation to all three variables in this group. The main thing to notice is the column
marked Sig. If the sig. value is less than or equal to .05 (e.g. .004, or .001), there is a
significant difference somewhere among the mean scores on the dependent variable for the
four groups of ICT intensity. The most significant differences in mean values between the
four ICT intensity groups are in relation to the single variable my total ICT competence is
solid, followed by need access to ICTs in my spare time and formal ICT qualifications.
The results presented above do not tell us which ICT intensity group is different from which
other group in relation to the three variables tested. So, in order to get a clearer picture of
75

the difference between the four groups, it is important to check and compare the mean
scores. First, let us look at the mean scores in relation to formal ICT qualifications.
Low to high ICT intensity cross tabulated with formal ICT qualifications
1,3 1,4
2,4
2,0
1,0
1,5
2,0
2,5
3,0
25% lowest ICTintensity
50% lowest ICTintensity
75% lowest ICTintensity
100% lowest ICTintensity
low to high ICT intensity
M IC
T qu
alifi
catio
ns
Diagram 17: Low to high ICT intensity cross tabulated with formal ICT qualifications
Diagram 17 shows the distribution of formal ICT competence between the four ICT intensity
groups. The most striking feature is that the group with the second highest ICT intensity has
the highest formal ICT competence. So, what can the mean scores relating to need access to
ICT in sparetime tell us about the difference between the four groups?
Low to high ICT intensity cross tabulated with need access to ICT in sparetime
4,5
5,35,1
5,5
4,0
4,5
5,0
5,5
6,0
25% lowest ICTintensity
50% lowest ICTintensity
75% lowest ICTintensity
100% lowest ICTintensity
low to high ICT intensity
M n
eed
ICT
acce
ss
spar
etim
e
Diagram 18: Low to high ICT intensity cross tabulated with need access to ICT in sparetime
Diagram 18 shows the distribution of “need for ICT access in spare time” between the four
ICT intensity groups. It is noteworthy that the group with the second lowest ICT intensity has
the second highest need for spare time ICT access. Finally, what can the distribution of mean
score on self‐perceived solid ICT competence tell us about the group differences?
76

Low to high ICT use crosstabulated with self-perceived solid ICT competence
3,33,6
4,2
4,9
3,0
3,5
4,0
4,5
5,0
25% lowest ICTintensity
50% lowest ICTintensity
75% lowest ICTintensity
100% lowest ICTintensity
low to high ICT intensity
M s
elf-p
erce
ived
sol
id
ICT
com
pete
nce
Diagram 19: Low to high ICT intensity cross tabulated with self‐perceived solid ICT competence
Diagram 19 visualises the distribution of self‐perceived solid ICT competence between the
four ICT intensity groups. It clearly shows how self‐perceived ICT competence corresponds
closely with ICT intensity.
Based on the results from step two, we can conclude that both formal ICT competence, need
for ICT access in spare time, and self‐perceived ICT competence account for variance in EFL
teachers’ ICT intensity, and are therefore kept on for further analyses.
The third step involves checking the variables linked to the national curriculum for
significant associations with EFL teachers’ ICT intensity. The variables in question are the five
basic skills (plus listening);
• listening (M=5,4; SD=0,6);
• speaking (M=5,4; SD=0,5);
• writing (M=5,2; SD=0,6);
• reading (M=5,2; SD=0,6);
• calculation (M=3,2; SD=0,9); and
• digital competence (M=4,2; SD=1,0).
Moreover, the three main areas in the national curriculum for English will be checked. These
are;
• language (M=5,1; SD=0,6);
• communication (M=5,3; SD=0,6); and
77

• culture, society and literature (M=4,6; SD=0,8).
First, let us see whether some of the basic skills can account for significant differences
between the four ICT intensity groups.
ANOVA
df Mean Square F Sig.
Between Groups 3 .768 2.184 .094
Within Groups 110 .352
4.6.1: Basic skills: understanding oral Eng.
Total 113
Between Groups 3 1.265 4.969 .003
Within Groups 110 .255
4.6.2: Basic skills: speaking Eng.
Total 113
Between Groups 3 1.657 5.136 .002
Within Groups 110 .323
4.6.3: Basic skills: writing Eng.
Total 113
Between Groups 3 .478 1.310 .275
Within Groups 110 .364
4.6.4: Basic skills: reading Eng.
Total 113
Between Groups 3 .967 1.043 .377
Within Groups 110 .928
4.6.5: Basic skills: using calculation in Eng.
Total 113
Between Groups 3 12.622 20.044 .000
Within Groups 110 .630
4.6.6: Basic skills: using digital tools in Eng.
Total 113 Diagram 20: ICT intensity (binned) and basic skills ‐ ANOVA
Diagram 20 shows that there are significant differences between the four ICT intensity
groups in relation to three of the basic skills, namely speaking, writing and digital
competence. The most significant differences in mean values between the four ICT intensity
groups are in relation to the basic skill digital competence, followed by writing and speaking.
Having established that there are significant differences in mean values between the four ICT
intensity groups, it is interesting to have a closer look at the actual differences in mean
scores.
78
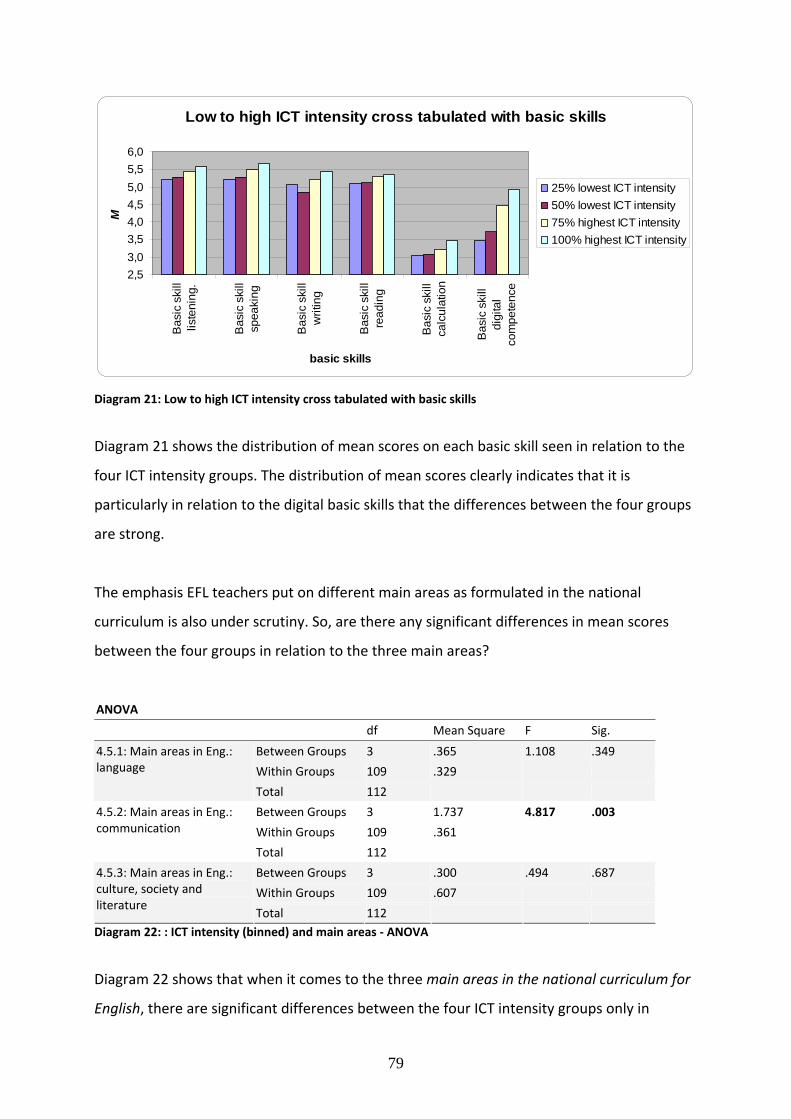
Low to high ICT intensity cross tabulated with basic skills
2,53,03,54,04,55,05,56,0
Bas
ic s
kill
liste
ning
.
Bas
ic s
kill
spea
king
Bas
ic s
kill
writ
ing
Bas
ic s
kill
read
ing
Bas
ic s
kill
calc
ulat
ion
Bas
ic s
kill
digi
tal
com
pete
nce
basic skills
M
25% lowest ICT intensity50% lowest ICT intensity75% highest ICT intensity100% highest ICT intensity
Diagram 21: Low to high ICT intensity cross tabulated with basic skills
Diagram 21 shows the distribution of mean scores on each basic skill seen in relation to the
four ICT intensity groups. The distribution of mean scores clearly indicates that it is
particularly in relation to the digital basic skills that the differences between the four groups
are strong.
The emphasis EFL teachers put on different main areas as formulated in the national
curriculum is also under scrutiny. So, are there any significant differences in mean scores
between the four groups in relation to the three main areas?
ANOVA
df Mean Square F Sig.
Between Groups 3 .365 1.108 .349
Within Groups 109 .329
4.5.1: Main areas in Eng.: language
Total 112
Between Groups 3 1.737 4.817 .003
Within Groups 109 .361
4.5.2: Main areas in Eng.: communication
Total 112
Between Groups 3 .300 .494 .687
Within Groups 109 .607
4.5.3: Main areas in Eng.: culture, society and literature
Total 112 Diagram 22: : ICT intensity (binned) and main areas ‐ ANOVA
Diagram 22 shows that when it comes to the three main areas in the national curriculum for
English, there are significant differences between the four ICT intensity groups only in
79

relation to the main area communication. So, what can the mean scores tell us about the
relationship between ICT intensity and the three main areas?
Low to high ICT intensity cross tabulated with main areas
4,6
4,8
5,0
5,2
5,4
5,6
Main area language Main areacommunication
Main area culture,society and
literature
main areas
M
25% lowest ICT intensity50% lowest ICT intensity75% lowest ICT intensity100% lowest ICT intensity
Diagram 23: Low to high ICT intensity cross tabulated with main areas
Diagram 23 shows the distribution of mean scores on each main area seen in relation to the
four ICT intensity groups. It illustrates differences in mean scores on all the main areas, and
only slightly more pronounced differences in relation to the main area communication. So,
even if a difference of 0.5 points between the lowest and highest ICT intensity group I
ssignificant, it does not seem to be very important in the system of ICT associated variables.
Based on the results from step three, we can conclude that the three basic skills speaking,
writing and digital competence, and the main area communication account for variance in
EFL teachers’ ICT intensity, and are therefore kept on for further analyses.
The fourth step involves checking the indices expressing positive beliefs in ICTs in various
ways for significant associations with EFL teachers’ ICT intensity. The indices in question are
ICT general positive belief (M=4,5; SD=0,9) and ICT positive effects (M=3,8; SD=0,8).
ANOVA
df Mean Square F Sig.
Between Groups 3 6.841 13.787 .000
Within Groups 116 .496
ICT Positive Effect
Total 119
80

Between Groups 3 10.128 19.881 .000
Within Groups 116 .509
ICT General Positive Belief
Total 119 Diagram 24: ICT intensity (binned) and ICT beliefs ‐ ANOVA
The ANOVA analysis shown in diagram 24 reveals significant differences between the four
ICT intensity groups in relation to both positive ICT belief indices. The most significant
differences are in relation to ICT general positive belief. It is important to check the
distribution of mean scores on each of these indices to reach deeper understanding of the
identified associations. First, let us have a closer look at the ICT positive effects index.
Low to high ICT intensity cross tabulated with ICT positive effects
3,33,5
4,14,3
3,0
3,5
4,0
4,5
5,0
25% lowest ICTintensity
50% lowest ICTintensity
75% lowest ICTintensity
100% lowest ICTintensity
low to high ICT intensity
M IC
T po
sitiv
e ef
fect
s
Diagram 25: Low to high ICT intensity cross tabulated with ICT positive effects
Diagram 25 clearly illustrates the positive relationship between ICT intensity and ICT positive
effects. A mean value difference of 1.0 between the lowest and highest ICT intensity group
tells us that the relationship is quite strong. Now, let us turn to the index ICT general positive
belief.
Low to high ICT intensity cross tabulated with ICT general positive belief
3,94,1
4,95,1
3,5
4,0
4,5
5,0
5,5
25% lowest ICTintensity
50% lowest ICTintensity
75% lowest ICTintensity
100% lowest ICTintensity
low to high ICT intensity
M IC
T ge
nera
l pos
itive
belie
f
Diagram 26: Low to high ICT intensity cross tabulated with ICT general positive belief
81

Diagram 26 shows that the positive relationship between ICT general positive belief and ICT
intensity is even stronger than for ICT positive effects. A mean difference of 1.2 implies the
existence of a strong relationship between the two factors.
Based on the results from step four, we can conclude that the two indices ICT general
positive belief and ICT positive effects account for variance in EFL teachers’ ICT intensity, and
are therefore kept on for further analyses.
The fifth step involves checking the scales linked to the subject specific elements of self‐
perceived competence (SPC), content and activities and organising teaching for significant
associations with EFL teachers’ ICT intensity.
The four indices created on the basis of the self‐perceived competence (SPC) scale are;
• SPC Basic language skills (M=5.63; SD=0.45)
• SPC Language and assessment (M=5.33; SD=0.51)
• SPC Innovative planning (M=5.22; SD=0.65)
• SPC Facilitative teaching (M=5.00; SD=0.70)
Let us first have a look at the ANOVA results for the four ICT intensity groups’ relation to self‐
perceived competence (SPC).
ANOVA ICT intensity (binned) versus self‐perceived competence indices
df Mean Square F Sig.
Between Groups 3 1.080 2.656 .052
Within Groups 110 .407
SPC Facilitative Teaching
Total 113
Between Groups 3 .048 .175 .913
Within Groups 110 .275
SPC Language and Assessment
Total 113
Between Groups 3 2.718 5.955 .001
Within Groups 110 .456
SPC Innovative Planning
Total 113
Between Groups 3 .159 .695 .557
Within Groups 110 .229
SPC Basic Language Skills
Total 113 Diagram 27: ICT intensity (binned) and Self‐perceived competence (SPC) ‐ ANOVA
82

Diagram 27 shows that there are significant differences between the four ICT intensity
groups in relation to SPC Innovative planning and almost in relation to SPC Facilitative
teaching. The most significant differences in mean values between the four ICT intensity
groups are in relation to SPC Innovative planning. SPC Language and assessment and SPC
Basic language skills do not account for variance in EFL teachers’ ICT intensity. Access to the
distribution of mean values adds to our understanding of the identified relationships, and is
presented here.
Low to high ICT intensity cross tabulated with self-perceived competence indices
4,6
5,1
5,6
SPC Facilitativeteaching
SPC Language andassessment
SPC Innovativeplanning
SPC Basiclanguage skills
self-perceived competence indices
M
25% lowest ICT intensity50% lowest ICT intensity75% highest ICT intensity100% highest ICT intensity
Diagram 28: Low to high ICT intensity cross tabulated with self‐perceived competence
Diagram 28 visualises the relationships found between each SPC index and the four ICT
groups. It shows clearly that the differences in mean scores are most pronounced in relation
to innovative planning. It is also worth noting the consensus regarding the language and
assessment and basic language skills indices between the four ICT intensity groups.
In chapter 3, five indices were computed on the basis of the underlying dimensions found in
the content and activities scale. These were:
• Core language (M=4.83; SD=0.61)
• Core accuracy and vocabulary (M=4.70; SD=0.58)
• Core meta‐strategies (M=4.30; SD=0.63)
• Core civilization (M=4.24; SD=0.73)
83

• Core literature and art (M=4.00; SD=0.83)
Are there any significant differences between the four ICT intensity groups in relation to any
of these five content and activities indices?
ANOVA ICT intensity (binned) versus content and activities indices Sum of
Squares df Mean
Square F Sig.
Between Groups
5,463 3 1,821 5,505 ,001
Within Groups
38,373 116 ,331
Core Language Content and Activities Total 43,835 119
Between Groups
4,565 3 1,522 3,091 ,030
Within Groups
57,108 116 ,492
Core Civilization Content and Activities Total 61,673 119
Between Groups
8,657 3 2,886 7,361 ,000
Within Groups
45,471 116 ,392
Core Meta‐Strategies Content and Activities Total 54,128 119
Between Groups
,766 3 ,255 ,761 ,518
Within Groups
38,915 116 ,335
Core Accuracy and Vocabulary Content and Activities
Total 39,681 119
Between Groups
7,020 3 2,340 4,429 ,005
Within Groups
61,278 116 ,528
Core Literature and Art Content and Activities
Total 68,298 119
Diagram 29: ICT intensity (binned) and content and activities ‐ ANOVA
Diagram 29 shows that there are significant differences between the four ICT intensity
groups in relation to Core language, Core civilization, Core meta‐strategies, and Core
literature and art. This means that only Core accuracy and vocabulary is not associated with
the ICT intensity of EFL teachers. The most significant differences in mean values between
the four ICT intensity groups are in relation to Core meta‐strategies. So, let us turn to the
actual differences in mean values.
84

Low to high ICT intensity cross tabulated with content and activities indices
3,5
3,9
4,3
4,7
5,1
Core lan
guag
e
Core civ
ilizati
on
Core meta
strate
gy
Core ac
curac
y and
voca
bulary
Core lite
rature
and a
rt
content and activities indices
M
25% lowest ICT intensity50% lowest ICT intensity75% highest ICT intensity100% highest ICT intensity
Diagram 30: Low to high ICT intensity cross tabulated with content and activities
Diagram 30 provides a clear picture of the way ICT intensity is associated with the four
indices Core language, Core civilization, Core meta‐strategy, and Core literature and art. It is
also interesting to note the distribution of mean values in relation to Core accuracy and
vocabulary, since the EFL teachers with the lowest ICT intensity clearly prioritise the kind of
content and activities expressed in that index.
In chapter 3, the creation of three additive indices based on the underlying patterns
identified in teachers’ answers on the organising teaching scale, were accounted for. These
are:
• Coaching (M=4.64; SD=0.49)
• Directing (M=4.42; SD=0.52)
• Facilitating (M=3.08; SD=0.76)
85

Let us turn to how these three indices are associated with EFL teachers’ ICT intensity, by
looking closer at the results from the ANOVA analysis.
ANOVA ICT intensity (binned) versus organising teaching indices Sum of
Squares df Mean
Square F Sig.
Between Groups
3,291 3 1,097 4,904 ,003
Within Groups
24,605 110 ,224
Organising Teaching Coaching
Total 27,896 113 Between Groups
12,607 3 4,202 9,189 ,000
Within Groups
51,679 113 ,457
Organising Teaching Facilitating
Total 64,286 116 Between Groups
,667 3 ,222 ,799 ,497
Within Groups
30,901 111 ,278
Organising Teaching Directing
Total 31,568 114 Diagram 31: ICT intensity (binned) and organising teaching ‐ ANOVA
The ANOVA analysis shows that there are significant differences between the four ICT
intensity groups in relation to both Coaching and Facilitating, but not in relation to the index
Directing. This index is thus not associated with the ICT intensity of EFL teachers. The most
significant differences in mean values between the four ICT intensity groups are in relation
to Facilitating. Having established that there are significant differences, let us have a look at
the actual mean values.
Low to high ICT intensity cross tabulated with organising teaching indices
2,2
2,7
3,2
3,7
4,2
4,7
5,2
Coaching Facilitating Directing
organising teaching indices
M
25% lowest ICT intensity50% lowest ICT intensity75% highest ICT intensity100% highest ICT intensity
86

Diagram 32: Low to high ICT intensity cross tabulated with organising teaching
Diagram 32 clearly illustrates the the fairly strong positive relationship between ICT intensity
and organising teaching facilitating, with a difference in mean score of 0.9. It also reveals
that organising teaching coaching is fairly modestly associated with ICT intensity, even
though the differences in mean values are deemed significant.
Based on the results from step five, we can conclude that the self‐perceived competence
indices SPC Innovative planning and SPC Facilitative teaching, the content and activities
indices Core language, Core civilization, Core meta‐strategies, and Core literature and art,
and the organising teaching indices Coaching and Facilitating all account for variance in EFL
teachers’ ICT intensity, and are therefore kept on for further analyses.
The outcome of the five steps of ANOVA analyses is that we have separated the variables
which are associated with ICT intensity from the ones that are not. In other words, we are
closer to identifying the system of associations that can provide information about ICT
related differences between EFL teachers. Here is the list of variables kept on for further
analyses:
• Formal ICT competence
• Need for ICT access in spare time (informal ICT competence)
• Self‐perceived solid ICT competence (informal ICT competence)
• Basic skill speaking
• Basic skill writing
• Basic skills digital competence
• Main area communication
• ICT general positive belief
• ICT positive effects
• SPC Innovative planning
• SPC Facilitative teaching
• Content and activities Core language
• Content and activities Core civilization
• Content and activities Core meta‐strategies
87

• Content and activities Core literature and art
• Organising teaching Coaching
• Organising teaching Facilitating
Determining bivariate correlations and identifying the ‘cloud of correlations’
The ANOVA results provided a list of variables associated with ICT intensity. Even though the
diagrams provided a general picture of the nature of the identified relationships, the
strength of association was not elaborated on in detail. So, in the following I will try to fine‐
tune and refine the general image of the identified associations.
In order to use the statistical analysis technique ANOVA, the continuous variable ICT
intensity was transformed into a categorical variable consisting of four groups. ANOVA could
then be used to investigate whether there were significant differences in mean values
between these four groups in relation to different independent variables. Bivariate
correlation analysis, on the other hand, is used to describe the strength and direction of the
relationship between two continuous variables. So, when using correlation analysis, the
variable ICT intensity is in its original, continuous state.
In order to obtain a measure of the strength and direction of the relationship, each variable
on the list from the ANOVA analyses is correlated with ICT intensity.
Correlations
ICT Intensity
Pearson Correlation 1.000
Sig. (2‐tailed)
ICT Intensity
N 121
Pearson Correlation .677**
Sig. (2‐tailed) .000
4.6.6: Basic skills: using digital tools in Eng.
N 121
Pearson Correlation .574**
Sig. (2‐tailed) .000
ICT General Positive Belief
N 120
Pearson Correlation .535**
Sig. (2‐tailed) .000
ICT Positive Effects
N 120
Core Meta‐Strategies Pearson Correlation .493**
88

Sig. (2‐tailed) .000
N 120
Pearson Correlation .471**
Sig. (2‐tailed) .000
Organising Teaching Facilitating
N 117
Pearson Correlation .443**
Sig. (2‐tailed) .000
2.6.2: My total ICT competence is solid
N 121
Pearson Correlation .436**
Sig. (2‐tailed) .000
SPC Innovative Planning
N 121
Pearson Correlation .420**
Sig. (2‐tailed) .000
4.5.2: Main areas in Eng.: communication
N 120
Pearson Correlation .396**
Sig. (2‐tailed) .000
Core Literature and Art Content and Activities
N 120
Pearson Correlation .378**
Sig. (2‐tailed) .000
2.6.1: Need access to ICTs in my spare time
N 119
Pearson Correlation .350**
Sig. (2‐tailed) .000
4.6.2: Basic skills: speaking Eng.
N 121
Pearson Correlation .349**
Sig. (2‐tailed) .000
Core Language Content and Activities
N 120
Pearson Correlation .340**
Sig. (2‐tailed) .000
SPC Facilitative Teaching
N 121
Pearson Correlation .330**
Sig. (2‐tailed) .000
Core Civilization Content and Activities
N 120
Pearson Correlation .306**
Sig. (2‐tailed) .001
Organising Teaching Coaching
N 114
Pearson Correlation .285**
Sig. (2‐tailed) .002
ICT ed. level
N 117
Pearson Correlation .232*
Sig. (2‐tailed) .010
4.6.3: Basic skills: writing Eng.
N 121
**. Correlation is significant at the 0.01 level (2‐tailed).
*. Correlation is significant at the 0.05 level (2‐tailed). Diagram 33: ICT intensity correlated with identified ICT associated variables
89

Diagram 33 shows a rank order of the significant positive correlations, and corroborates
thereby the results obtained from the ANOVA analyses. A correlation coefficient of r=>.3 is
deemed strong in educational research, so there are several very strong associations
between individual variables in the system of ICT associated variables and ICT intensity. A
case in point is the very strong association existing between emphasising the development
of pupils’ digital skills as defined in the national curriculum and ICT intensity. A correlation
coefficient of r=.68 equals a shared variance between ICT intensity and digital basic skills of
more than 46 percent. Also two ICT attitude‐related variables show very strong associations
with ICT intensity. Remarkably, as many as ten of the identified factors in the system of
associated variables showing correlation coefficients of at least r=.3, are intimately
connected with the teaching of EFL. In other words, there are as many as ten EFL subject
specific variables that are closely associated with ICT intensity.
A weakness with bivariate correlation analysis, however, is that isolated pairs of variables
are analysed separately from other variables. Urie Bronfenbrenner is famous for his
resistance to this kind of splitting up of reality for research purposes. His view was that in
messy, real world situations, such as teaching EFL with ICT for lower secondary pupils, each
variable is affected by every other variable. “[T]he explanations for what we do are to be
found in interactions between characteristics of people and their environments, past and
present (…).” (Bronfenbrenner, 1979). In other words, he believed that the main effects are
to be found in the interactions between all the variables in a particular context; they are
properties of systems. Following the logic of Bronfenbrenner, we need to acknowledge the
existence of ecologies of variables in order to ask the good questions, gather the appropriate
data, conduct the right analyses, and reach sensible conclusions.
Here, I will try to show the interrelationships (or relative distances) between the variables by
using a statistical technique called multidimensional scaling (PROXSCAL). On the basis of the
intercorrelations identified between all the variables, this technique creates an image
depicting the complex relationships. So, variables that are close together have more in
common than variables far apart.
90

Diagram 34: Multidimensional scaling (PROXSCAL) – all variables in system of ICT associations
Diagram 34 shows that most variables cluster around the center of the image, signifying that
they are closely associated with one another. The variable formal ICT competence
(ed_level_ICT), however, does not join the cluster of variables, and thus does not seem to
have much in common with the other variables. The variable is shown to be peripheral to
the system of variables explored in relation to ICT intensity, and the bivariate correlation
analysis displays only a weak, but significant positive correlation of .285. Combined, these
results suggest that formal ICT qualifications do not influence the use of ICTs in EFL classes to
91

any great extent. The variable is therefore excluded from further analyses, and we can
conclude that it does not play a central role in the system of ICT associated variables. The
basic skill writing does have a central position in the system of variables, but shows such a
weak correlation (r=.232*) with ICT intensity that it is also excluded from new analyses. All
the other variables show positive correlations with ICT intensity of r=.3 or stronger, and are
central variables in the ‘cloud of correlated events’ as shown in diagram 34 above.
Determining the predictive strength of the identified system of ICT‐related variables
Using both analyses of variance (ANOVA) and analyses of relationships between variables
(bivariate correlation), as well as the multivariate analysis multidimensional scaling, a set of
variables are retained for their close relationship with the variable ICT intensity. This set of
variables can be understood as a model for the prediction of ICT intensity among EFL
teachers, i.e. together they can account for much of the variance in EFL teachers’ use of ICT.
In practical terms this means that by knowing the scores of EFL teachers on the variables
constituting the model, one should be able to predict their ICT intensity with some degree of
accuracy. However, the strength of the model, i.e. how much of the variance in ICT intensity
it can account for, is not yet analysed. In order to do that, one needs to conduct a standard
multiple regression.
While bivariate correlation shows the relationship between two variables, standard multiple
regression is used to explore the relationship between one continuous dependent variable
(e.g. ICT intensity) and a number of independent variables or predictors (e.g. the variables
constituting the system of ICT associated variables). Multiple regression is based on
correlation, but opens for more advanced investigation of the interrelationship among a set
of variables. As mentioned, this “makes it ideal for the investigation of more complex real‐
life, rather than laboratory‐based, research questions” (Pallant, 2007):146. At this particular
juncture, the purpose of using standard multiple regression is to explore:
‐ how well the identified set of variables is able to predict ICT intensity; and
‐ whether particular predictor variables are still able to predict an outcome when the
effects of the other variables are controlled for.
92

In standard multiple regression all the independent (or predictor) variables are entered into
the equation at the same time, and each is evaluated in terms of its predictive power, over
and above that offered by all the others.
“You would use this approach if you had a set of variables (…) and wanted to know how
much variance in a dependent variable (…) they were able to explain as a group (…). This
approach would also tell you how much unique variance in the dependent variable each
of the independent variables explained” (Pallant, 2007): 147.
When running a regression analysis one would like to know how much of the variance in the
dependent variable is explained by the independent variable, in other words one would like
to know how good the model is. Looking at the results, R squared provides information
about the amount of variance in the dependent variable (ICT intensity) which is accounted
for by the set of independent variables. By multiplying the R‐squared with 100, you get the
measure expressed in percentage. So, the R‐squared x 100 shows the per cent of variance of
the dependent variable (ICT‐intensity) predicted by the set of independent variables.
In other words, the higher the R‐squared, the better the model, i.e. the higher the R‐
squared, the more variations in the dependent variable (ICT‐intensity) are explained by the
independent variables. So, what does the multippel regression analysis tell us regarding the
model based on the system of ICT associated variables?
Model Summary
Model R R Square Adjusted R SquareStd. Error of the Estimate
1 .823a .677 .627 .47418
a. Predictors: (Constant), Organising Teaching Facilitating, 2.6.2: My total ICT competence is solid, Core Literature and Art Content and Activities, 4.6.2: Basic skills: speaking Eng., ICT General Positive Belief, 2.6.1: Need access to ICTs in my spare time, SPC Innovative Planning, Organising Teaching Coaching, Core Civilization Content and Activities, 4.5.2: Main areas in Eng.: communication, ICT Positive Effects, Core Language Content and Activities, 4.6.6: Basic skills: using digital tools in Eng., SPC Facilitative Teaching, Core Meta‐Strategies Content and Activities Diagram 35: Model summary standard multippel regression – system of ICT associated variables
The results show that, in this case, the set of independent variables accounts for nearly 68
per cent of the variance in the dependent variable (ICT intensity). This result suggests that
93

the model is very good indeed as compared to some of the results reported in the journals
(Pallant, 2007): 158. To assess the significance of the result, it is necessary to look at diagram
36 labelled ANOVA.
ANOVAb
Model Sum of Squares df Mean Square F Sig.
Regression 45.788 15 3.053 13.576 .000a
Residual 21.810 97 .225
1
Total 67.598 112
a. Predictors: (Constant), Organising Teaching Facilitating, 2.6.2: My total ICT competence is solid, Core Literature and Art Content and Activities, 4.6.2: Basic skills: speaking Eng., ICT General Positive Belief, 2.6.1: Need access to ICTs in my spare time, SPC Innovative Planning, Organising Teaching Coaching, Core Civilization Content and Activities, 4.5.2: Main areas in Eng.: communication, ICT Positive Effects, Core Language Content and Activities, 4.6.6: Basic skills: using digital tools in Eng., SPC Facilitative Teaching, Core Meta‐Strategies Content and Activities
b. Dependent Variable: ICT Intensity Diagram 36: Significance level multippel regression – system of ICT associated variables
The ANOVA shows that the result is strongly significant (sig.=.000 really means p<.0005, so
the odds that the finding is the result of chance are one to 50 000).
Let us also check whether particular predictor variables are still able to predict an outcome
when the effects of the other variables are controlled for. This means that all the variance of
ICT intensity explained by the combined intercorrelations of all the variables are cancelled
out, leaving only the unique contribution of each individual variable over and above that of
the others. In order to find out, the coefficients table needs to be analysed.
Coefficientsa
Unstandardized Coefficients Standardized Coefficients
Model B Std. Error Beta t Sig.
(Constant) ‐.688 .656 ‐1.050 .297
2.6.1: Need access to ICTs in my spare time
.055 .049 .077 1.121 .265
2.6.2: My total ICT competence is solid
.082 .043 .145 1.889 .062
4.5.2: Main areas in Eng.: communication
‐.041 .102 ‐.033 ‐.406 .686
4.6.2: Basic skills: speaking Eng.
.101 .112 .069 .904 .368
1
4.6.6: Basic skills: using digital tools in Eng.
.246 .068 .310 3.629 .000
94

SPC Facilitative Teaching ‐.107 .103 ‐.092 ‐1.038 .302
SPC Innovative Planning .125 .085 .117 1.471 .144
ICT General Positive Belief .151 .076 .168 1.991 .049
ICT Positive Effects .134 .079 .140 1.698 .093
Core Language Content and Activities
‐.036 .112 ‐.028 ‐.323 .747
Core Civilization Content and Activities
‐.031 .086 ‐.029 ‐.358 .721
Core Meta‐Strategies Content and Activities
.158 .107 .136 1.472 .144
Core Literature and Art Content and Activities
.181 .091 .176 2.002 .048
Organising Teaching Coaching
‐.167 .120 ‐.106 ‐1.386 .169
Organising Teaching Facilitating
.193 .072 .187 2.681 .009
a. Dependent Variable: ICT Intensity Diagram 37: Coefficients multippel regression – system of ICT associated variables
The variables with the highest standardised coefficients in diagram 37 (ignoring any negative
signs in front), are the ones that make the strongest unique contribution to explaining the
dependent variable, when the variance explained by all the others as controlled for (Pallant,
2007):159. If we include only the variables making a statistically unique (sig.=<.05)
contribution to explanining the dependent variable, we are left with four particularly salient
variables. These are (rank order):
1) Basic skills: using digital tools in EFL (t=3.629, sig.=.000)
2) Organising Teaching Facilitating (t=2.681, sig.=.009)
3) Core Literature and Art Content and Activities (t=2.002, sig.=.048)
4) ICT General Positive Belief (t=1.991, sig.=.049)
95

Chapter 5: Discussion
This chapter starts out with a brief and focussed recapitulation of the main findings related
to the two research questions posed in this study. On that basis, there is a theoretically
informed discussion about what the quantitative findings can and cannot tell us about EFL
teachers’ ‘theory of practice’, followed by an elaboration of possible methodological
consequences of the experience with the use of a qualitative concept like ‘theory of practice’
in a quantitative study.
Recapitulation of main findings In the introduction, the overarching research objective was presented as being “to
determine EFL teachers’ actual use of ICTs, and identify the system of associated variables
that can help explain what is characteristic about EFL teachers with high ICT‐intensity”. Two
research questions were posed:
1. What characterises the use of ICTs in EFL classrooms, and what attitudes and
knowledge do EFL teachers have regarding new technologies?
2. How is EFL teachers’ reported ICT use associated with;
a. their knowledge about ICT and their thoughts relating to the usefulness of
and experiences with technology; and
b. their background, subject specific priorities and qualifications?
Findings related to research question one
I will sum up the results relating to the first research question by looking at the descriptive
findings through the lens of the conceptual and theoretical frameworks presented in chapter
2. First, it is clear that the use of general tools or tool‐based software such as word
processors and presentation tools is characteristic for ICT use in EFL classrooms. Especially
teachers using ICT a lot for production and information management (IPIM‐teachers), tend
to let pupils use these tools to present their work for the teacher and the rest of the class.
Teachers more inclined to use ICT for drill and practice (IDAP‐teachers), on the other hand,
96

put less emphasis on the use of word processors and presentation tools. IDAP‐teachers are
more apt than IPIM teachers to use the presentation tools themselves, and less apt to let the
pupils use them in their work. Similarly, IPIM‐teachers let pupils use general web‐resources
for online research, whereas IDAP‐teachers lean towards the use of more subject specific
web‐resources and software for the practice of grammar and civilization. When it comes to
the use of teacher tools, the results show that IPIM‐teachers, but not IDAP‐teachers, use
LMS and digital portfolios fairly often. Communication tools are rarely used by EFL‐teachers
in general.
In terms of the broad learning theories – behaviourism, cognitivism and constructivism – the
overall tendencies suggest that IPIM‐teachers are influenced by (social) constructivist ideas
regarding the use of ICT in EFL classrooms. The open‐ended use of general Internet
resources, pupils’ use of presentation tools and word processors, and fairly frequent use of
LMS and digital portfolios all point in that direction. Still, it is important to keep in mind the
considerable overlap between IPIM and IDAP‐teachers. Yet, both the use of subject‐specific
software and web‐resources, and teacher‐led use of presentation tools, seem to suggest that
IDAP‐teachers lean more towards behaviourist and cognitivist models of learning and
teaching.
EFL teachers in general have little or no formal qualifications in ICT. More than 90 percent of
the respondents have 30 credits or less. However, this does not prevent them from
reporting high levels of confidence in their ability to make use of ICTs. Around 70 percent
regard their ICT competence as solid, and more than 90 percent say they need access to ICTs
in their spare time. Nearly 80 percent claim they have few or no difficulties when it comes to
learning how to use new digital tools, and almost 70 percent feel confident that they can
make the most of digital tools’ potential. High mean values and low SD values show that
most EFL teachers share this view.
The findings show that EFL teachers in general have more faith in positive than negative
effects of ICT. First and foremost, they appreciate the new opportunities that are available
on the web, and see them as an enrichment of their current practice. Similarly, a majority of
EFL teachers agree that ICTs make it possible for them to reach new objectives which are
97

positive for the teaching of EFL. The majority even deem that the use of ICTs is contributing
positively to the attainment of traditional goals. Still, there is a clear tendency among EFL
teachers to view ICTs as valuable, but not essential, for pupils’ achievement. The findings
suggest that most EFL teachers regard other factors in the educational context as far more
important than ICTs in relation to the enhancement of pupils’ skills and knowledge.
Findings related to research question two
In the effort to reach an answer to research question two, all variables – both ICT related
and general – were in chapter 4 analysed to determine their relationship with EFL teachers’
use of new technologies. All variables found to share a significant association with ICT
intensity were included in a model of the system of ICT associated variables. Among the ICT
related variables included in this model, were (rank order of significance):
• Basic skills digital competence
• ICT general positive belief
• ICT positive effects
• Self‐perceived solid ICT competence (informal ICT competence)
• Need for ICT access in spare time (informal ICT competence)
All of these variables are very strongly or strongly correlated with EFL teachers’ ICT intensity.
Surprisingly, formal ICT competence is not on the list. The variable shows only a weak,
though significant, correlation coefficient of r=.285 with ICT intensity. In other words, there
is not a strong connection between EFL teachers’ formal ICT qualifications and their ICT
intensity, indicating that formal schooling in ICT has so far not led to a significant increase in
the use of new technologies among EFL teachers. Informal ICT competence, on the other
hand, is significantly associated with EFL teachers’ frequency of ICT use.
The general variables showing significant associations with ICT intensity, were (rank order of
significance):
• Content and activities Core meta‐strategies
• Organising teaching Facilitating
• SPC Innovative planning
98

• Main area communication
• Content and activities Core literature and art
• Basic skill speaking
• Content and activities Core language
• SPC Facilitative teaching
• Content and activities Core civilization
• Organising teaching Coaching
All of these variables are strongly correlated with ICT intensity (r=>.3), and are thus part of
the model of the system of ICT associated variables. It is noteworthy that as many as ten
subject specific variables are on this list, suggesting that EFL teachers’ subject specific
priorities have major impact on their use of ICTs. General variables without significant
positive association with ICT use include EFL teachers’ age, gender, education (English) and
teaching experience. It is interesting to note that ICT intensity is not linked to EFL teachers’
formal qualifications in English, suggesting that EFL teachers with no formal qualifications
and teachers with master degrees have the same overall ICT intensity. One would expect
that EFL teachers with a master’s degree would have a deeper and better understanding of
the particularities of the subject, and were thus in a better position to make choices
regarding the appropriate use of ICT in EFL teaching. By focussing solely on ICT intensity, the
differences in the quality of the ICT use are not captured. Frequency of use should therefore
not be used as a measure of quality.
The predictive strength of the model consisting of all the variables with a positive correlation
with ICT intensity of at least r=.3 were tested using multippel regression analysis. The set of
independent variables accounted for nearly 68 per cent of the variance in the dependent
variable (ICT intensity). This finding suggests that the predictive strength of the model is very
strong indeed; only 32 percent of the variance in the respondents’ answers to the items
constituting the additive index ICT intensity, is not accounted for. The variables that make
the strongest unique and statistically significant contribution to explaining the dependent
variable (ICT intensity), when the variance explained by all the others is controlled for,
include; a) emphasis on the digital basic skill as formulated in the national curriculum; b)
99

enphasis on facilitative teaching; c) emphasis on literature and visual expressions; and d) a
general belief in the positive influence of ICT on learning.
EFL teachers with high ICT intensity – common elements in their theory of practice In chapter two, theory of practice was presented as the theoretical framework for the
elaboration of the findings to research question two. Theory of practice was defined as “a
person’s private, interconnected, continuously changing system of knowledge, experiences,
and values which influence a person’s teaching practice at a given point in time” (Lauvås &
Handal, 1990). Theory of practice has come up in the public debate regarding the use of ICT
in education, as mentioned in the introduction. The directorate of education pointed out
that teachers’ lack of awareness of their theory of practice might be the reason why some
teachers resisted the integration of new technologies in their teaching. Lektorlaget, on the
other hand, noted that resistance to ICTs might as well stem from a well‐developed
awareness of their theory of practice.
As mentioned in chaptertwo, by using theory of practice as a theoretical point of reference,
one highlights the ecology or system of associations of which EFL teachers’ use of ICTs is a
part. ICT use is thus seen as a component of a larger and more complex system of factors
where teachers’ actions, values and rationales are acknowledged. The conceptual
framework was deemed open‐ended enough to be appropriate for an exploratory
investigation of a range of variables, and still focussed enough to be appropriate for putting
the findings into an overarching theoretical framework which will make the findings
meaningful, interesting and relevant.
EFL teachers with high ICT intensity share many characteristics with other EFL teachers.
There is a general consensus among nearly all EFL teachers that the most important subject
specific objectives are the development of pupils’ language skills and their knowledge of
language. Nearly all EFL teachers also report that they have few problems organising
teaching for the purpose of developing pupils’ language skills and knowledge. There is also a
high degree of consensus regarding the most appropriate ways to organise EFL teaching. So,
100

it is mainly in connection with more peripheral aims and objectives that EFL teachers with
high ICT intensity differ from their colleagues. The common features of their theories of
practice are identified in the system of ICT associated variables and include, as mentioned
before, the following variables:
• Basic skills digital competence
• ICT general positive belief
• ICT positive effects
• Self‐perceived solid ICT competence (informal ICT competence)
• Need for ICT access in spare time (informal ICT competence)
• Content and activities Core meta‐strategies
• Organising teaching Facilitating
• SPC Innovative planning
• Main area communication
• Content and activities Core literature and art
• Basic skill speaking
• Content and activities Core language
• SPC Facilitative teaching
• Content and activities Core civilization
• Organising teaching Coaching
From these findings it is hard to determine whether they are more or less “aware” of their
theories of practice than other EFL teachers. It is probably more constructive to talk about
the existence of different sets of theories of practice relating to different ways to make use
of ICTs. One factor that might be a challenge for the high ICT intensity teachers, is the strong
emphasis they put on the national curriculum and the development of pupils’ ability to use
digital tools. If this is seen as an objective in and of itself, it might distract attention from the
attainment of central subject specific aims, particularly among EFL teachers without proper
formal qualifications in English. Also, there is a danger that the selection of classroom
activities is based on what is available in digital form, rather than on sound educational
rationale. The more frequent use of project work and other approaches to EFL teaching
which emphasise a facilitative teacher role, might also be less efficient in terms of reaching
101

measurable skills and knowledge (Hattie, 2009). However, as (Lund, 2004) points out, they
might reach new and equally valuable objectives.
Theory of practice is a concept used to understand individual teachers’ practice by looking at
their unique and sometimes contradictory values and rationales. In many ways it is a
qualitative concept in the sense that the focus is on understanding intricate individual
processes not easily captured via quantitative research approaches. Still, ‘theory of practice’
was deemed fit to serve as a conceptual framework for the current study, due to the way it
conceptualises the relationship between actions and principles for actions. The current study
highlights certain variables in the educational ecology which have a bearing on EFL teachers’
use of ICT. The individual EFL teacher’s practice cannot be seen as separate from the social,
historical and cultural context it is part of. So, even if theory of practice is a model intimately
linked to individual actions and characteristics ”er det gitt at den formes og utvikles i stadig
interaksjon med miljøet rundt oss. PYT [praktisk yrkesteori] er forankret i vårt kjønn, vår
sosial tilhørighet osv. slik dette har nedfelt seg i vår biografi. Arbeider vi sammen med de
samme menneskene over lengre tid, vil våre individuelle PYT’er påvirkes av dette. Vi er ikke
bare individualister, vi er også bærere av en felles kultur” (Lauvås & Handal, 1990): 115. The
characteristics of quantitative approaches can be said to support the identification of these
common traits.
It might be that quantitative explorations should aim at identifying patterns of practice; a
refinement or adaption of the original theory of practice as developed by (Lauvås & Handal,
1990). Patterns of practice might be a more suitable term, as it highlights the shared
properties of certain professional characteristics. A tentative definition of could be “the
development and convergence of certain shared professional principles which generate and
organise practices”.27
By using this adapted, aggregated version of theory of practice, the attention is directed
away from the teacher as an individual, autonomous social agent, towards his culturally and
socially shaped professional principles which help generate and organise practices among
communities of teachers. By placing too much emphasis on the individual teacher, the 27 The idea is based on Bourdieu’s concept of habitus. See (Lizardo, 2004).
102

salient systems of associations are not readily accessible or identifiable. By focussing on
group characteristics instead, it is possible to discern salient systems of associations within
an educational context. These systems of common features or ’patterns of practice’ might
be useful as an empirical basis for the formulation of educational policy.
103
Chapter 6: Conclusions and implications
In chapter three, the concepts ‘quantitative’, ‘relational’, ‘exploratory’, and ‘pragmatic’ were
used to describe the research design of the current study. They all seemed ideal for an
exploration of a research object that had not been thoroughly researched, and in relation to
which there were hardly any established or well‐documented models or theories. The
quantitative aspect provided the opportunity for identifying main patterns and trends in the
answers collected from many EFLteachers across the country. The relational element
opened up for the study of potential associations existing in an ecology of variables in a
complex educational context, thus enhancing the understanding of the research object
through identifying particular patterns of interactions. The exploratory approach was
reflected in the exploratory use of statistical techniques such as factor analysis and optimal
scaling, and opened up for the discovery of associations not previously documented or
identified. On the basis of “what works”, the pragmatic aspect legitimised using a mainly
qualitative theoretical framework in a quantitative study.
By charting these relatively unknown waters, a whole range of new opportunities for further
research has emerged. First, salient associations identified in the current study could be the
points of departure for new qualitative studies. Qualitative “thick descriptions” could serve
to deepen our understanding of identified patterns. Second, relational findings could serve
as a basis for conducting analytical studies, where the causal relationship between just a few
variables is under scrutiny, thus leaving the ecological or systemic approach behind. Thirdly,
the findings could spur the creation of new hypotheses, which in turn could be the basis for
confirmatory studies. Finally, the pragmatic aspect could be left behind, and a more robust
overarching theoretical framework could be applied in new efforts to reach scientific
knowledge. Keeping these general approaches in mind, I would have liked to embark on two
very different research undertakings. First, I would have liked to carry out a proper effect
study. I find the issue of quality of ICT use so important that trying to measure learning
outcomes seems to be one possible approach. Second, I would have liked to carry out a
comparative, qualitative study. I would identify some “extreme cases” when it comes to the
104
use of ICTs in the teaching of EFL, and use observation and interviews to gain access to a
fine‐grained understanding of their different practices.
In chapter one, I elaborated on two dominant perspectives regarding what constitutes
quality in ICT integration found in national plans and strategies for education. Each
perspective is grounded on views about ICTs’ ideal role and function in education. The first,
labelled the technocentric view, is characterised by a strong faith in the affordances offered
by new technologies. The process of integration into education is mainly based on
considerations of what is technologically possible, rather than on what is educational
desireable. Frequency of ICT use is thus a measure of progress and quality.
From the other main perspective, ICTs are seen as catalysts for pedagogic change. The
proponents of this view claim that it is necessary to abandon traditional concepts of the
teacher, the pupil and the curriculum subject to fully appropriate ICTs in education. The
main focus is on the development of pupils’ so‐called ‘21st century skills’, rather than the
content of individual curriculum subjects. Since ICTs are the tools required for reaching this
ideal state of affairs, frequency of use and pedagogic changes are seen as measures of
quality. These two perspectives on quality in ICT integration are reflected in national plans
and strategies.
Unfortunately, the massive political and economic investments in ICT in education have so
far not paid off. International comparisons demonstrate that Norwegian pupils are trailing
further and further behind their international counterparts in terms of acquired skills and
knowledge, and ICTs are only integrated to a limited extent. A new approach to ICT
integration in research and educational policy is required. This study is part of a larger trend
in which the content in individual curriculum subjects is again at the fore. Teachers are once
more acknowledged not for their adaptability, but for their mastery of a field of study. The
trend points to a renewed emphasis on subject specific didactics in research and in the
formulation of educational policy. Future ICT integration initiatives must be based on the
understanding that the use of ICT must be intimately linked to the achievement of central
subject specific objectives, or as one of the teachers in the sample put it: “IKT for faget, ikke
faget for IKT”.
105

Appendix
Frequency Percent
0 4 3.2
Akershus 20 16.1
Oslo 11 8.9
Hedmark 7 5.6
Oppland 2 1.6
Buskerud 5 4.0
Vestfold 6 4.8
Telemark 9 7.3
Aust Agder 3 2.4
Vest Agder 5 4.0
Rogaland 8 6.5
Hordaland 19 15.3
Sogn og Fjordane 1 .8
Møte og Romsdal 2 1.6
Sør‐Trøndelag 9 7.3
Nord‐Trøndelag 3 2.4
Nordland 1 .8
Troms 2 1.6
Finnmark 7 5.6
Valid
Total 124 100.0 Diagram 38: Regional distribution of EFL teachers in the sample
1.1.1: Age
Frequency Percent
20‐29 11 8.9
30‐39 41 33.1
40‐49 29 23.4
50‐59 29 23.4
>60 14 11.3
Valid
Total 124 100.0 Diagram 39: Age distribution in sample
2.2.1: Teaching exp. Eng
Frequency Valid Percent
1‐3 ys 25 20.7
4‐7 ys 20 16.5
8‐11 ys 19 15.7
12‐15 ys 9 7.4
>15 ys 48 39.7
Valid
Total 121 100.0
Missing System 3
106

2.2.1: Teaching exp. Eng
Frequency Valid Percent
1‐3 ys 25 20.7
4‐7 ys 20 16.5
8‐11 ys 19 15.7
12‐15 ys 9 7.4
>15 ys 48 39.7
Valid
Total 121 100.0
Missing System 3
Total 124 Diagram 40: Distribution of teaching experience in sample
Ed. level Eng
Frequency Percent
Cumulative Percent
no ed. 12 9.7 9.7
<15 credits 3 2.4 12.1
15 credits 2 1.6 13.7
30 credits 14 11.3 25.0
60 credits 46 37.1 62.1
90 credits 37 29.8 91.9
Master 2 1.6 93.5
Old master 8 6.5 100.0
Valid
Total 124 100.0 Diagram 41: Distribution of formal English qualification in sample
Counties Schools in total
Teachers in total
School sample
Teacher sample
Answers EFL teachers
Østfold 42 920 4 36 0 Akershus 81 1938 17 221 20 Oslo 56 1235 15 210 11 Hedmark 41 734 7 91 7 Oppland 42 783 8 104 2 Buskerud 51 875 8 117 5 Vestfold 40 841 10 142 6 Telemark 43 628 10 133 9 Aust‐Agder 29 369 4 48 3 Vest‐Agder 40 704 6 84 5 Rogaland 93 1595 15 195 8 Hordaland 99 1711 21 266 19 Sogn og Fjordane 50 452 3 39 1 Møre og Romsdal 74 936 17 136 2 Sør‐Trøndelag 67 970 7 84 9 Nord‐Trøndelag 47 526 4 56 3 Nordland 129 897 6 78 1 Troms 79 606 7 91 2 Finnmark 58 329 6 81 7 IN TOTAL 1161 17049 172 2212 124 Diagram 42: Regional distribution of schools (total and sample), teachers (total and sample) and EFL teachers
107

Self‐perceived competence subscale – rank order descriptive findings M SD
2.3.5: Self‐perceived competence: reading act.
5,71 ,553
2.3.4: Self‐perceived competence: writing act.
5,71 ,524
2.3.10: Self‐perceived competence: language model
5,70 ,542
2.3.20: Self‐perceived competence: correcting pupil language
5,68 ,517
2.3.6: Self‐perceived competence: grammar
5,63 ,645
2.3.3: Self‐perceived competence: listening act.
5,55 ,736
2.3.7: Self‐perceived competence: vocabulary
5,47 ,670
2.3.2: Self‐perceived competence: communication act.
5,46 ,617
2.3.1: Self‐perceived competence: integrate new material
5,42 ,736
2.3.12: Self‐perceived competence: group work
5,40 ,837
2.3.17: Self‐perceived competence: assessment
5,22 ,822
2.3.16: Self‐perceived competence: learn new ICTs for Eng
5,15 ,942
2.3.9: Self‐perceived competence: prepare theoretical material
5,14 ,769
2.3.22: Self‐perceived competence: good balance theory and practical usage
5,11 ,724
2.3.13: Self‐perceived competence: projects
5,10 ,953
2.3.14: Self‐perceived competence: creativity
5,07 ,831
2.3.8: Self‐perceived competence: intercultural comp.
5,06 ,820
2.3.15: Self‐perceived competence: cross‐curricula
4,84 1,055
2.3.19: Self‐perceived competence: use ICTs effectively
4,77 ,957
108
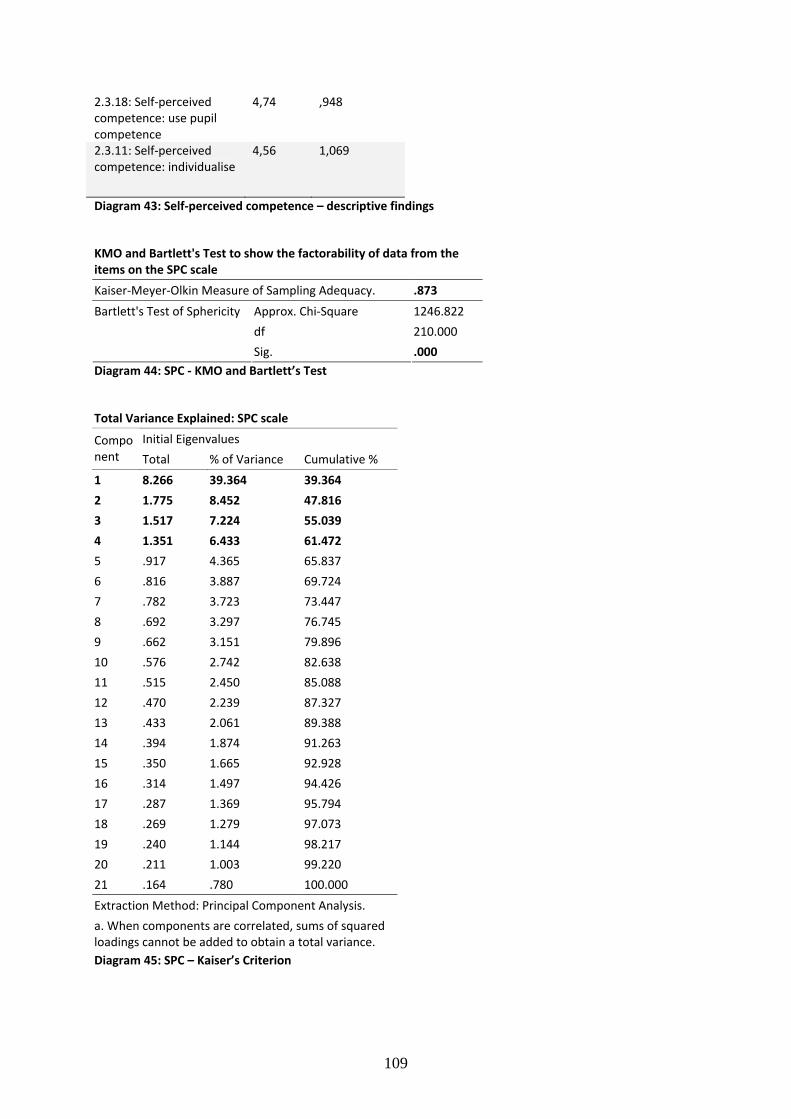
2.3.18: Self‐perceived competence: use pupil competence
4,74 ,948
2.3.11: Self‐perceived competence: individualise
4,56 1,069
Diagram 43: Self‐perceived competence – descriptive findings
KMO and Bartlett's Test to show the factorability of data from the items on the SPC scale
Kaiser‐Meyer‐Olkin Measure of Sampling Adequacy. .873
Approx. Chi‐Square 1246.822
df 210.000
Bartlett's Test of Sphericity
Sig. .000 Diagram 44: SPC ‐ KMO and Bartlett’s Test
Total Variance Explained: SPC scale
Initial Eigenvalues Component Total % of Variance Cumulative %
1 8.266 39.364 39.364
2 1.775 8.452 47.816
3 1.517 7.224 55.039
4 1.351 6.433 61.472
5 .917 4.365 65.837
6 .816 3.887 69.724
7 .782 3.723 73.447
8 .692 3.297 76.745
9 .662 3.151 79.896
10 .576 2.742 82.638
11 .515 2.450 85.088
12 .470 2.239 87.327
13 .433 2.061 89.388
14 .394 1.874 91.263
15 .350 1.665 92.928
16 .314 1.497 94.426
17 .287 1.369 95.794
18 .269 1.279 97.073
19 .240 1.144 98.217
20 .211 1.003 99.220
21 .164 .780 100.000
Extraction Method: Principal Component Analysis.
a. When components are correlated, sums of squared loadings cannot be added to obtain a total variance. Diagram 45: SPC – Kaiser’s Criterion
109

Diagram 46: SPC – Scree Plot
SPC ‐ Pattern Matrixa
Component
1 2 3 4
2.3.20: Self‐perceived competence: correcting pupil language
.800
2.3.17: Self‐perceived competence: assessment
.694 .412
2.3.10: Self‐perceived competence: language model
.690
2.3.22: Self‐perceived competence: good balance theory and practical usage
.628
2.3.6: Self‐perceived competence: grammar
.515 ‐.302 .418
2.3.9: Self‐perceived competence: prepare theoretical material
.497 .493
2.3.18: Self‐perceived competence: use pupil competence
.475 .333
2.3.7: Self‐perceived competence: vocabulary
.451
2.3.16: Self‐perceived competence: learn new ICTs for Eng
.840
2.3.1: Self‐perceived competence: integrate new material
.690
2.3.19: Self‐perceived competence: use ICTs effectivly
.633 .431
110

2.3.3: Self‐perceived competence: listening act.
.472 .420
2.3.5: Self‐perceived competence: reading act.
.743
2.3.4: Self‐perceived competence: writing act.
.718
2.3.2: Self‐perceived competence: communication act.
.307 .427 .336
2.3.12: Self‐perceived competence: group work
.783
2.3.15: Self‐perceived competence: cross‐curricula
.778
2.3.13: Self‐perceived competence: projects
.305 .735
2.3.14: Self‐perceived competence: creativity
.589
2.3.8: Self‐perceived competence: intercultural comp.
.527
2.3.11: Self‐perceived competence: individualise
.353 .404
Extraction Method: Principal Component Analysis. Rotation Method: Oblimin with Kaiser Normalization.
a. Rotation converged in 15 iterations. Diagram 47: SPC – Pattern Matrix
Content and activities scale – rank order descriptive findings M SD
4.1.8: Content and activities: read and listen to texts wide range of topics
5,25 ,731
4.1.9: Content and activities: write and speak with some precision, flow and coherence
5,12 ,709
4.1.13: Content and activities: read and understand texts different length and genres
5,03 ,715
4.1.6: Content and activities: develop vocabulary wide range of topics
5,02 ,636
4.1.15: Content and activities: write well‐structured texts of different types
4,89 ,783
111

4.1.10: Content and activities: adjust oral and written lang. to genre and situation
4,81 ,720
4.1.7: Content and activities: use language as accurately as possible
4,70 ,726
4.1.20: Content and activities: discuss young people's life‐styles, values etc. in USA, UK++ and Norway
4,66 ,906
4.1.21: Content and activities: history and geography UK and USA
4,64 ,818
4.1.1: Content and activities: situations, methods and strategies to learn
4,60 ,768
4.1.24: Content and activities: read + discuss literary texts poem, short story, novel or play
4,55 ,894
4.1.14: Content and activities: adjust learning strategies to purpose and situation
4,53 ,922
4.1.11: Content and activities: present current and cross‐curricular topics
4,50 ,920
4.1.16: Content and activities: use content from different sources independently and critically
4,47 ,786
4.1.12: Content and activities: oral interaction current and cross‐curricular topics
4,41 ,924
4.1.22: Content and activities: describe conditions indigenous peoples in English‐speaking countries
4,39 ,964
4.1.17: Content and activities: discriminate between positive and negative phrases ind. or groups
4,38 ,823
4.1.2: Content and activities: compare and contrast L1 and L2 to learn
4,30 ,840
112

4.1.3: Content and activities: critical and independent use of various tools
4,22 ,923
4.1.4: Content and activities: use basic grammatical concepts to describe lang.
4,11 1,022
4.1.5: Content and activities: pupils describe and self‐evaluate progress
4,09 ,891
4.1.23: Content and activities: recognise some regional accents from English‐speaking countries
4,07 ,890
4.1.26: Content and activities: describe theme and composition in texts
4,07 ,981
4.1.18: Content and activities: communicate using digital media
4,02 1,088
4.1.27: Content and activities: make and discuss own oral or written texts inspired by literature and art
3,87 1,086
4.1.25: Content and activities: describe theme and composition in visual representations
3,53 ,987
4.1.19: Content and activities: describe and interpret graphical representations of numbers and other data
3,49 ,896
Diagram 48: Content and activities – descriptive findings
KMO and Bartlett's Test to show the factorability of data from the items on the content and activities subscale
Kaiser‐Meyer‐Olkin Measure of Sampling Adequacy. .893
Approx. Chi‐Square 1711.310
df 351.000
Bartlett's Test of Sphericity
Sig. .000 Diagram 49: Content and activities – KMO and Bartlett’s Test
Total Variance Explained: Content and activities
Initial Eigenvalues Component Total % of Variance Cumulative %
1 10.567 39.138 39.138
2 2.216 8.207 47.345
3 1.657 6.137 53.482
113

4 1.354 5.015 58.497
5 1.182 4.377 62.874
6 1.080 4.000 66.874
7 .872 3.228 70.102
8 .805 2.981 73.083
9 .715 2.647 75.731
10 .653 2.419 78.150
11 .581 2.151 80.301
12 .564 2.088 82.389
13 .514 1.903 84.292
14 .502 1.859 86.151
15 .474 1.757 87.908
16 .429 1.588 89.495
17 .364 1.349 90.844
18 .350 1.297 92.141
19 .342 1.266 93.406
20 .297 1.099 94.505
21 .289 1.071 95.576
22 .276 1.024 96.601
23 .256 .947 97.548
24 .191 .707 98.255
25 .168 .624 98.879
26 .158 .586 99.465
27 .144 .535 100.000
Extraction Method: Principal Component Analysis.
a. When components are correlated, sums of squared loadings cannot be added to obtain a total variance. Diagram 50: Content and activities – Kaiser’s Criterion
114

Diagram 51: Content and activities – Scree Plot
Content and activities ‐ Pattern Matrixa
Component
1 2 3 4 5 6
4.1.8: Content and activities: read and listen to texts wide range of topics
.787
4.1.9: Content and activities: write and speak with some precision, flow and coherence
.746 .305
4.1.13: Content and activities: read and understand texts different length and genres
.687
4.1.12: Content and activities: oral interaction current and cross‐curricular topics
.646 ‐.333
4.1.11: Content and activities: present current and cross‐curricular topics
.613 ‐.323
4.1.15: Content and activities: write well‐structured texts of different types
.592
4.1.14: Content and activities: adjust learning strategies to purpose and situation
.516
4.1.10: Content and activities: adjust oral and written lang. to genre and situation
.473 .308
4.1.22: Content and activities: describe conditions indigenous peoples in English‐speaking countries
‐.820
4.1.21: Content and activities: history and geography UK and USA
‐.730
4.1.23: Content and activities: recognise some regional accents from English‐speaking countries
‐.612
4.1.20: Content and activities: discuss young people's life‐styles, values etc. in USA, UK++ and Norway
‐.605
115

4.1.19: Content and activities: describe and interpret graphical representations of numbers and other data
‐.531 ‐.432
4.1.3: Content and activities: critical and independent use of various tools
.734
4.1.1: Content and activities: situations, methods and strategies to learn
.718 ‐.393
4.1.2: Content and activities: compare and contrast L1 and L2 to learn
.611
4.1.4: Content and activities: use basic grammatical concepts to describe lang.
.601
4.1.5: Content and activities: pupils describe and self‐evaluate progress
.588 .308
4.1.7: Content and activities: use language as accurately as possible
.764
4.1.17: Content and activities: discriminate between positive and negative phrases ind. or groups
.523
4.1.6: Content and activities: develop vocabulary wide range of topics
.491
4.1.18: Content and activities: communicate using digital media
‐.745
4.1.24: Content and activities: read + discuss literary texts poem, short story, novel or play
‐.784
4.1.27: Content and activities: make and discuss own oral or written texts inspired by literature and art
‐.761
4.1.26: Content and activities: describe theme and composition in texts
‐.759
4.1.25: Content and activities: describe theme and composition in visual representations
‐.356 ‐.584
4.1.16: Content and activities: use content from different sources independently and critically
‐.345
116

Extraction Method: Principal Component Analysis. Rotation Method: Oblimin with Kaiser Normalization.
a. Rotation converged in 20 iterations. Diagram 52: Content and activities – Pattern Matrix
Organising teaching scale – rank order descriptive findings M SD
4.3.12: Organising teaching: use own experiences
4,94 ,737
4.3.14: Organising teaching: clarify expectations to effort and results
4,88 ,724
4.3.13: Organising teaching: expect good results
4,84 ,722
4.3.16: Organising teaching: keep a close eye on pupils' work to give feedback
4,76 ,685
4.3.9: Organising teaching: textbook
4,71 ,752
4.3.1: Organising teaching: class teaching
4,70 ,763
4.3.10: Organising teaching: work plan
4,64 ,965
4.3.11: Organising teaching: use pupils' knowledge and competence
4,58 ,888
4.3.2: Organising teaching: instruct individuals
4,54 ,745
4.3.15: Organising teaching: hard on sloppy work
4,50 ,832
4.3.8: Organising teaching: homework
4,27 ,880
4.3.3: Organising teaching: instruct groups
4,03 ,802
4.3.5: Organising teaching: tests
4,02 ,704
4.3.4: Organising teaching: project
3,22 ,976
4.3.6: Organising teaching: performances etc.
2,55 1,122
117

4.3.7: Organising teaching: inviting interesting people
2,40 1,080
Diagram 53: Organising teaching – descriptive findings
KMO and Bartlett's Test to show the factorability of data from the items on the organising teaching scale
Kaiser‐Meyer‐Olkin Measure of Sampling Adequacy. .720
Approx. Chi‐Square 564.701
df 120.000
Bartlett's Test of Sphericity
Sig. .000 Diagram 54: Organising teaching – KMO and Bartlett’s Test
Diagram 55: Organising teaching – Scree Plot
Organising Teaching ‐ Pattern Matrixa
Component
1 2 3
4.3.16: Organising teaching: keep a close eye on pupils' work to give feedback
.785
4.3.13: Organising teaching: expect good results
.738
4.3.14: Organising teaching: clarify expectations to effort and results
.720
4.3.15: Organising teaching: hard on sloppy work
.678
118

4.3.12: Organising teaching: use own experiences
.630
4.3.11: Organising teaching: use pupils' knowledge and competence
.554
4.3.10: Organising teaching: work plan
.499
4.3.2: Organising teaching: instruct individuals
.490
4.3.3: Organising teaching: instruct groups
.477 ‐.422
4.3.6: Organising teaching: performances etc.
‐.812
4.3.7: Organising teaching: inviting interesting people
‐.792
4.3.4: Organising teaching: project
‐.764
4.3.5: Organising teaching: tests
.748
4.3.8: Organising teaching: homework
.688
4.3.1: Organising teaching: class teaching
.552
4.3.9: Organising teaching: textbook
.547
Extraction Method: Principal Component Analysis. Rotation Method: Oblimin with Kaiser Normalization.
a. Rotation converged in 6 iterations. Diagram 56: Organising teaching – Pattern Matrix
Organising teaching ‐ Total Variance Explained
Initial Eigenvalues Component Total % of Variance Cumulative %
1 4.316 26.978 26.978
2 2.124 13.274 40.251
3 1.533 9.582 49.834
4 1.210 7.560 57.394
5 1.070 6.689 64.083
6 .876 5.476 69.559
7 .764 4.773 74.331
8 .758 4.739 79.070
9 .651 4.068 83.138
10 .504 3.148 86.286
11 .480 2.999 89.285
12 .455 2.846 92.131
13 .405 2.533 94.664
14 .368 2.297 96.961
15 .293 1.828 98.790
119

16 .194 1.210 100.000
Extraction Method: Principal Component Analysis.
a. When components are correlated, sums of squared loadings cannot be added to obtain a total variance. Diagram 57: Organising teaching – Kaiser’s Criterion
ICT activities subscale – rank order descriptive findings
M SD
5.1.6: ICT activities: pupils produce their own texts using digital tools
4,45 ,974
5.1.11: ICT activities: pupils use digital presentation tools
4,10 1,068
5.1.9: ICT activities: pupils collect material from Internet which they use, develop and present
3,83 1,116
5.1.2: ICT activities: pupils use learning platform
3,83 1,538
5.1.3: ICT activities: pupils work with pedagogic net‐resources linked to the textbook
3,74 1,146
5.1.4: ICT activities: pupils work with independent pedagogic net‐resources (games, web‐pages)
3,50 1,034
5.1.8: ICT activities: pupils work with English texts downloaded from Internet
3,47 1,053
5.1.7: ICT activities: pupils use game‐like pedagogic software to gain knowledge and competence
3,40 1,111
5.1.13: ICT activities: programmes training pupils in basic grammatical terminology
3,32 1,066
5.1.5: ICT activities: pupils exchange information and experiences using digital tools
3,13 1,173
5.1.14: ICT activities: programmes training English and American history and geography
3,03 1,100
5.1.12: ICT activities: pupils use digital tools to communicate with each
2,73 1,364
120

other and pupils in other countries
5.1.10: ICT activities: pupils use different types of software to learn English (e.g. sound recording)
2,63 1,149
5.1.15: ICT activities: pupils use digital portfolios as part of what is assessed
2,55 1,500
Diagram 58: ICT activities ‐ descriptive findings
ICT general positive belief subscale – rank order descriptive findings
M SD
6.1.1.1: ICT good results: subject matter more interesting
4.91 .907
6.1.1.2: ICT good results: net access to more varied material
4.88 .922
6.1.1.3: ICT good results: pupils work independently and present it (e.g. portfolios)
4.31 1.156
6.1.1.4: ICT good results: help and cooperate more using the net
3.87 1.178
Valid N (listwise) Diagram 59: General ICT beliefs – descriptive findings
ICT positive effects subscale – rank order descriptive findings M SD
7.1.22: grade importance: ICT reach new aims which are positive for Eng. subject
4,23 ,906
7.1.20: grade importance: ICT leads to increased pupil autonomy
3,82 ,930
7.1.21: grade importance: ICT more efficient ways of acheiving trad. aims
3,79 1,007
7.1.12: grade importance: use of ICT better results boys
3,69 1,095
7.1.17: grade importance: ICT support my didactic priorities and methods
3,68 1,195
121

7.1.13: grade importance: use of ICT better results girls
3,62 ,996
Valid N (listwise) Diagram 60: ICT positive effects – descriptive findings
122

References
Becker, H. J. (1994). How exemplary computer-using teachers differ from other teachers:
Implications for realising the potential of computers in school. Journal of Research on
Computing in Education, 31(4), 356-385.
Bronfenbrenner, U. (1979). The ecology of human development: Experiments by nature and
design. Cambridge, Mass.: Harvard University Press.
Chapelle, C. A. (2005). Computer-assisted language learning. In E. Hinkel (Ed.), Handbook
of research in second language teaching and learning (pp. 743-757). New York:
Routledge.
Cohen, L., & Manion, L. (1994). Research methods in education. London: Routledge.
Dede, C. (2008). Theoretical perspectives influencing the use of information technology in
teaching and learning. In J. Voogt, & G. Knezek (Eds.), International handbook of
information technology in primary and secondary education (pp. 43-63). New York:
Springer.
Fuchs, T., & Wössmann, L. (2004). Computers and student learning: Bivariate and
multivariate evidence on the availability and use of computers at home and at school.
Brussels Economic Review, 47(3/4), 359-385.
Hattie, J. (2009). Visible learning: A synthesis of over 800 meta-analyses relating to
achievement. London: Routledge.
123

Hinostroza, J. E., Labbé, C., López, L., & Iost, H. (2008). Traditional and emerging IT
applications for learning. In J. Voogt, & G. Knezek (Eds.), International handbook of
information technology in primary and secondary education (pp. 81-97). New York:
Springer.
Ibsen, E. (2004). Engelsk i europa - 2002: Norsk rapport fra en europeisk
engelskundersøkelse om holdninger til og ferdigheter i engelsk ved utgangen
obligatoriske grunnskolen. Oslo: UiO/ILS.
ITU (Forsknings- og kompetansenettverk for IT i utdanning). (2009). Skolens digitale tilstand
2009. Oslo: Gazette.
Jonassen, D. H. (2000). Computers as mindtools for schools: Engaging critcal thinking.
Upper Saddle River, N.J.: Merrill.
KD (Kunnskapsdepartementet). (2003). NOU 2003: 16 I første rekke - forsterket kvalitet i
grunnopplæringen for alle. Oslo: Kunnskapsdepartementet.
KD (Kunnskapsdepartementet). (2006). Læreplanverket for kunnskapsløftet. Oslo:
Utdanningsdirektoratet.
Lauvås, P., & Handal, G. (1990). Veiledning og praktisk yrkesteori. Oslo: Cappelen.
Lie, S., Kjærnsli, M., & Brekke, G. (1997). Hva i all verden skjer i realfagene? internasjonalt
lys på trettenåringers kunnskaper, holdninger og undervisning i norsk skole. Oslo:
Universitetsforlaget.
Lizardo, O. (2004). The cognitive origins of bourdieu's habitus. Journal for the Theory of
Social Behaviour, 34, 375-401.
124

Lund, A. (2004). The teacher as interface: Teachers of EFL in ICT-rich environments :
Beliefs, practices, appropriation. Oslo: UniPub.
Lund, A. (2009). Å Være digital i engelsk. In H. Otnes (Ed.), Å Være digital i alle fag (pp. 87-
104). Oslo: Universitetsforlaget.
Mason, M., Law, N., Pelgrum, W. J., & Plomp, T. (2008). Pedagogy and ICT use: In schools
around the world findings from the IEA sites 2006 study. Dordrecht: Comparative
Education Research Centre.
Mueller, J., Wood, E., Willoughby, T., Ross, C., & Specht, J. (2008). Identifying
discriminating variables between teachers who fully integrate computers and teachers
with limited integration. Science Direct. Computers and Education, 51(4), 1523-1537.
Oxford, R. L., Tomlinson, S., Barcelos, A., Harrington, C., Lavine, R. Z., Saleh, A., &
Longhini, A. (1998). Clashing metaphors about classroom teachers: Toward a systematic
typology for the language teaching field. System, 26(1), 3-50.
Pallant, J. (2007). SPSS survival manual: A step by step guide to data analysing using SPSS
for windows. Maidenhead: McGraw-Hill ; Open University Press.
Robson, C. (2002). Real world research: A resource for social scientists and practitioner-
researchers. Oxford: Blackwell.
Salomon, G. (1991). Transcending the qualitative-quantitative debate; the analytic and
systemic approaches to educational research. Educational Researcher, 20(6), 10-18.
Salomon, G. (2000). It's not just the tool, but the educational rationale that counts. 2000 Ed-
Media Meeting, Montreal.
125

UFD (Utdannings- og Forskningsdepartementet). (2004). Program for digital kompetanse
2004-2008. Oslo: Utdannings- og forskningsdepartementet.
Vavik, L., Andersland, S., Arnesen, T., Arnesen, T., Espeland, M., Flatøy, I., Grønsdal, I.,
Fadnes, P., Sømoe, K., & Tuset, G. (2010). Skolefagsundersøkelsen 2009 - utdanning,
skolefag og teknologi. Stord: Høgskolen Stord/Haugesund.
Zhao, Y., Pugh, K., Sheldon, S., & Byers, J. L. (2002). Conditions for classroom technology
innovations. Teachers College Record, 104(3), 482-515.
126

List of diagrams
DIAGRAM 1: NORWEGIAN LOWER SECONDARY SCHOOL PUPILS’ ENGLISH PROFICIENCY EXPRESSED IN SCORES ON TESTS OF LISTENING COMPREHENSION, LINGUISTIC COMPETENCE, READING COMPREHENSION, AND WRITTEN PRODUCTION (IBSEN, 2004): 19.... 12
DIAGRAM 2: SIGNIFICANT CORRELATIONS BETWEEN SCHOOL FACTORS AND TEST RESULTS (IBSEN, 2004): P.56. .......................... 13 DIAGRAM 3: CORRELATION BETWEEN TEST SCORES, GRADES, SELF‐EVALUATION AND CLASSROOM ACTIVITIES (IBSEN, 2004): 57. .. 13 DIAGRAM 4: (ZHAO ET AL., 2002)’S MODEL OF FACTORS WHICH FACILITATED OR HINDERED TEACHERS’ USE OF TECHNOLOGY IN
CLASSROOM CONTEXTS ...................................................................................................................................... 19 DIAGRAM 5: ILLUSTRATION OF THE POSITION OF THE TEACHER AT THE INTERFACE BETWEEN THREE OVERLAPPING FIELDS OF ENQUIRY25 DIAGRAM 6: CLASSIFICATION OF ICT APPLICATIONS AND THEIR EDUCATIONAL USE.................................................................. 26 DIAGRAM 7: LØVLIE’S ‘PRACTICE TRIANGLE’ ILLUSTRATING THE RELATIONSHIP BETWEEN ACTIONS AND ‘THEORY OF PRACTICE’ (LAUVÅS
& HANDAL, 1990) ........................................................................................................................................... 32 DIAGRAM 8: FRAMEWORK FOR RESEARCH DESIGN (ROBSON, 2002): 82.............................................................................. 37 DIAGRAM 9: DESCRIPTIVE FINDINGS ON THE USE OF DIFFERENT ICT TOOLS IN THE TEACHING OF EFL.......................................... 62 DIAGRAM 10: DESCRIPTIVE FINDINGS RELATED TO TEACHERS' USE OF DIFFERENT ICT ACTIVITIES IN THE TEACHING OF EFL.............. 63 DIAGRAM 11: ASSOCIATIONS BETWEEN IPIM AND IDAP .................................................................................................. 66 DIAGRAM 12: CORRELATION IPIM/IDAP AND ICT TOOLS ................................................................................................ 68 DIAGRAM 13: GENERAL ICT POSITIVE – DESCRIPTIVE FINDINGS........................................................................................... 70 DIAGRAM 14: GENERAL ICT NEGATIVE – DESCRIPTIVE FINDINGS ......................................................................................... 70 DIAGRAM 15: BELIEFS ICT EFFECTS – DESCRIPTIVE FINDINGS.............................................................................................. 71 DIAGRAM 16: ANOVA – ICT INTENSITY (BINNED) AND FORMAL AND INFORMAL ICT COMPETENCE .......................................... 75 DIAGRAM 17: LOW TO HIGH ICT INTENSITY CROSS TABULATED WITH FORMAL ICT QUALIFICATIONS ........................................... 76 DIAGRAM 18: LOW TO HIGH ICT INTENSITY CROSS TABULATED WITH NEED ACCESS TO ICT IN SPARETIME.................................... 76 DIAGRAM 19: LOW TO HIGH ICT INTENSITY CROSS TABULATED WITH SELF‐PERCEIVED SOLID ICT COMPETENCE ............................ 77 DIAGRAM 20: ICT INTENSITY (BINNED) AND BASIC SKILLS ‐ ANOVA .................................................................................... 78 DIAGRAM 21: LOW TO HIGH ICT INTENSITY CROSS TABULATED WITH BASIC SKILLS .................................................................. 79 DIAGRAM 22: : ICT INTENSITY (BINNED) AND MAIN AREAS ‐ ANOVA .................................................................................. 79 DIAGRAM 23: LOW TO HIGH ICT INTENSITY CROSS TABULATED WITH MAIN AREAS ............................................................... 80 DIAGRAM 24: ICT INTENSITY (BINNED) AND ICT BELIEFS ‐ ANOVA .................................................................................. 81 DIAGRAM 25: LOW TO HIGH ICT INTENSITY CROSS TABULATED WITH ICT POSITIVE EFFECTS...................................................... 81 DIAGRAM 26: LOW TO HIGH ICT INTENSITY CROSS TABULATED WITH ICT GENERAL POSITIVE BELIEF ........................................... 81 DIAGRAM 27: ICT INTENSITY (BINNED) AND SELF‐PERCEIVED COMPETENCE (SPC) ‐ ANOVA................................................... 82 DIAGRAM 28: LOW TO HIGH ICT INTENSITY CROSS TABULATED WITH SELF‐PERCEIVED COMPETENCE ........................................ 83 DIAGRAM 29: ICT INTENSITY (BINNED) AND CONTENT AND ACTIVITIES ‐ ANOVA................................................................... 84 DIAGRAM 30: LOW TO HIGH ICT INTENSITY CROSS TABULATED WITH CONTENT AND ACTIVITIES................................................. 85 DIAGRAM 31: ICT INTENSITY (BINNED) AND ORGANISING TEACHING ‐ ANOVA ..................................................................... 86 DIAGRAM 32: LOW TO HIGH ICT INTENSITY CROSS TABULATED WITH ORGANISING TEACHING ................................................... 87 DIAGRAM 33: ICT INTENSITY CORRELATED WITH IDENTIFIED ICT ASSOCIATED VARIABLES ......................................................... 89 DIAGRAM 34: MULTIDIMENSIONAL SCALING (PROXSCAL) – ALL VARIABLES IN SYSTEM OF ICT ASSOCIATIONS............................ 91 DIAGRAM 35: MODEL SUMMARY STANDARD MULTIPPEL REGRESSION – SYSTEM OF ICT ASSOCIATED VARIABLES .......................... 93 DIAGRAM 36: SIGNIFICANCE LEVEL MULTIPPEL REGRESSION – SYSTEM OF ICT ASSOCIATED VARIABLES........................................ 94 DIAGRAM 37: COEFFICIENTS MULTIPPEL REGRESSION – SYSTEM OF ICT ASSOCIATED VARIABLES ................................................ 95 DIAGRAM 38: REGIONAL DISTRIBUTION OF EFL TEACHERS IN THE SAMPLE .......................................................................... 106 DIAGRAM 39: AGE DISTRIBUTION IN SAMPLE................................................................................................................. 106 DIAGRAM 40: DISTRIBUTION OF TEACHING EXPERIENCE IN SAMPLE.................................................................................... 107 DIAGRAM 41: DISTRIBUTION OF FORMAL ENGLISH QUALIFICATION IN SAMPLE ..................................................................... 107 DIAGRAM 42: REGIONAL DISTRIBUTION OF SCHOOLS (TOTAL AND SAMPLE), TEACHERS (TOTAL AND SAMPLE) AND EFL TEACHERS .. 107 DIAGRAM 43: SELF‐PERCEIVED COMPETENCE – DESCRIPTIVE FINDINGS ............................................................................... 109 DIAGRAM 44: SPC ‐ KMO AND BARTLETT’S TEST.......................................................................................................... 109 DIAGRAM 45: SPC – KAISER’S CRITERION .................................................................................................................... 109 DIAGRAM 46: SPC – SCREE PLOT ............................................................................................................................... 110 DIAGRAM 47: SPC – PATTERN MATRIX ....................................................................................................................... 111 DIAGRAM 48: CONTENT AND ACTIVITIES – DESCRIPTIVE FINDINGS ..................................................................................... 113 DIAGRAM 49: CONTENT AND ACTIVITIES – KMO AND BARTLETT’S TEST............................................................................. 113
127

128
DIAGRAM 50: CONTENT AND ACTIVITIES – KAISER’S CRITERION ........................................................................................ 114 DIAGRAM 51: CONTENT AND ACTIVITIES – SCREE PLOT ................................................................................................... 115 DIAGRAM 52: CONTENT AND ACTIVITIES – PATTERN MATRIX ........................................................................................... 117 DIAGRAM 53: ORGANISING TEACHING – DESCRIPTIVE FINDINGS........................................................................................ 118 DIAGRAM 54: ORGANISING TEACHING – KMO AND BARTLETT’S TEST ............................................................................... 118 DIAGRAM 55: ORGANISING TEACHING – SCREE PLOT...................................................................................................... 118 DIAGRAM 56: ORGANISING TEACHING – PATTERN MATRIX.............................................................................................. 119 DIAGRAM 57: ORGANISING TEACHING – KAISER’S CRITERION........................................................................................... 120 DIAGRAM 58: ICT ACTIVITIES ‐ DESCRIPTIVE FINDINGS .................................................................................................... 121 DIAGRAM 59: GENERAL ICT BELIEFS – DESCRIPTIVE FINDINGS .......................................................................................... 121 DIAGRAM 60: ICT POSITIVE EFFECTS – DESCRIPTIVE FINDINGS .......................................................................................... 122


