
1
CD Summit & Jenkins Days Dallas
IBM Bluemix Garage Method Workshops – see the method in action
April 5th 12:30 - 4pm
Workshop - Manage and Learn from Your Minimum Viable Product By David E. Cox Senior Technical Staff Member, SaaS Delivery Lead Architect, IBM

2
Before you use this information, read the information in "Notices" on page 49. © Copyright IBM Corporation 2016. U.S. Government Users Restricted Rights - Use, duplication or disclosure restricted by GSA ADP Schedule Contract with IBM Corp.
3
Workshop Introduction The Manage and Learn from Your Minimum Viable Product workshop explores the Manage and Learn phases of the IBM® Bluemix® Garage Method and all of the associated practice, toolchain, tool, track, and experience articles. First, a bit about the articles that are fundamental to the method:
– Practices define an overall business transformation goal and present achievable activities that you and your team can do to reach that goal.
– Toolchains consist of a set of complementary and compatible tools that, when used together, create a flexible solution. Integrations across a toolchain help ease the workflows between the tools so that they work in synergy. In this way, a toolchain of complementary and compatible tools can boast collective capabilities that are greater than the sum of the individual tools.
– Tracks tell a successful story that represents a guided path through the practices, toolchains, and tools that are used to develop a solution. The track that you follow depends on your business and transformation goals.
– Experiences are just that: articles about transformation told from the perspective of IBMers who have been through it.
In this workshop, learn how to manage and learn from innovative new applications on the cloud by walking through the Manage and Learn phases of the Accelerating innovation with cloud native track of the IBM Bluemix Garage Method. Learn the practices, tools, and the Cloud-native toolchain that are used to develop on the cloud.
MANAGE
Ensure operational excellence Continuously monitor application status and performance Ensure high availability and fast recovery Leverage log data to expedite problem identification and resolution Shift operational practices to the front of the development cycle to improve reliability
Let’s explore some of the Manage practices available on the site:
Operations automation Operations is a costly business. Automation enables you to reduce costs and focus your valuable staff on higher value tasks.
Experience: Resilient operations
Chaotic testing Continuously improve stability and recovery time of your production environment by injecting ongoing random failures.
High availability

4
To maintain 99.999% availability, the IBM Bluemix Garage Method team practices development, monitoring, and operations techniques for high availability.
Auto-scaling applications Use auto-scaling for your applications to ensure that enough resources are available at peak times and to save costs by reducing the allocated resources during times of low usage. Fast recovery Continuous availability requires a new approach to how applications are developed and deployed. You can use techniques to manage nondisruptive change. The Circuit Breaker pattern In a cloud application with many interdependent microservices, use of the Circuit Breaker pattern ensures that a single failure does not take down an entire service.
Automated monitoring Automated monitoring is the most reliable way to ensure high availability of your applications and reduce down time.
Tool: New Relic
Tool: PagerDuty
LEARN
Continuously experiment to deliver the right solution
Formulate hypotheses and design experiments to drive development Establish clear metrics for decision-making Drive findings to the backlog and pivot
Let’s explore some of the Learn practices available on the site:
Hypothesis-driven development Continuous delivery demands the use of hypotheses, not requirements, to deliver what customers want. Using this approach, developers embrace a mindset of continuous experimentation and are ready to pivot based on the outcome of the experiment.
Tool: Google Analytics
A/B testing Compare versions of a web page to gather empirical data, so that you can determine which approach gets the best results.

5
Workshop itinerary Part 1: (10 minutes)
Request IDs for Bluemix, Slack, and Sauce Labs. Configure Deploy to Bluemix and click go.
Instructor-led discussion on Manage (10 minutes) (While applications are deploying…)
Overview of Continuous Delivery, IBM Bluemix DevOps Services, IBM Bluemix
Automated Testing
Fast Recovery Part 2: (15 minutes)
Activity 1 Verification(sample app)
Activity 2 (Monitoring with New Relic and PagerDuty) Part 3: Instructor-led discussion on Manage (10 minutes)
High availability
Chaos testing Part 4: (10 minutes)
Activity 3 (Slack integration) Part 5: Instructor-led discussion on Learn (10 minutes)
Hypothesis-driven development
A/B testing Part 6: (25 minutes)
Activity 4 (Google Analytics) Total 90 minutes .

6
Activity #1 Deploy the sample application
7
Create an application to monitor.
Option 1: Use the application from the Code - Deliver - Run workshop (skip to Activity #2)
Option 2: Create the sample app from Code - Deliver - Run workshop (15-20 minutes)
Prerequisites
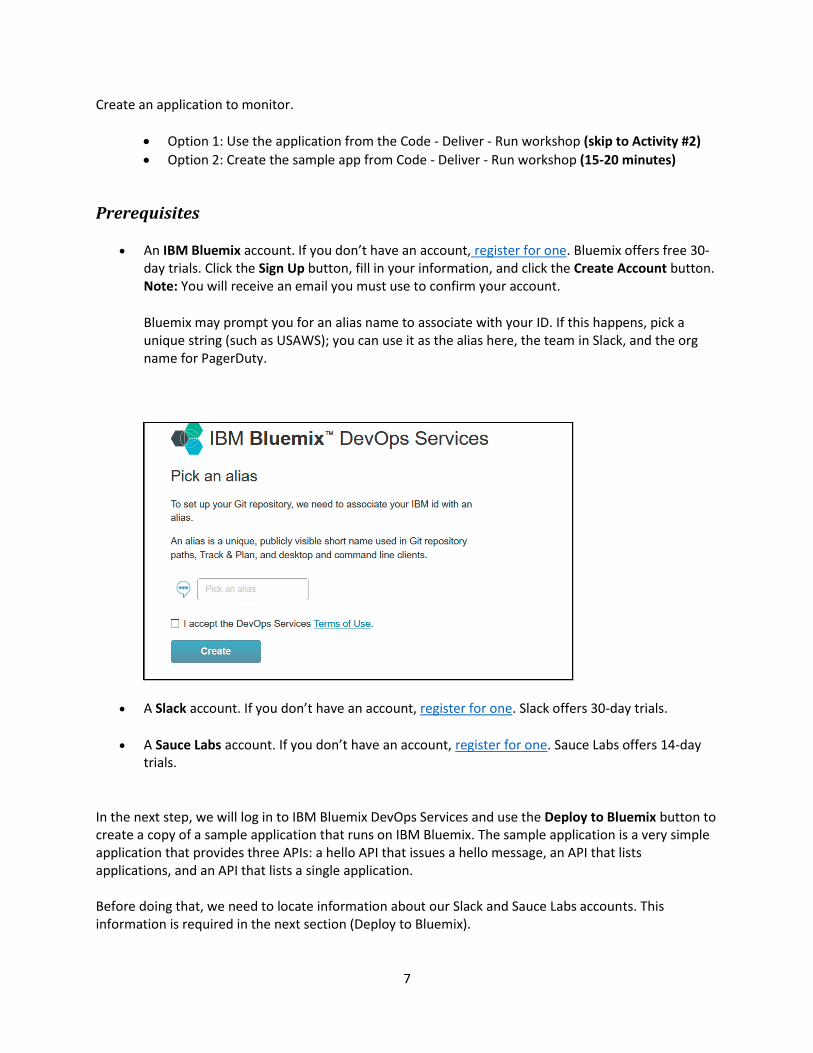
An IBM Bluemix account. If you don’t have an account, register for one. Bluemix offers free 30-day trials. Click the Sign Up button, fill in your information, and click the Create Account button. Note: You will receive an email you must use to confirm your account.
Bluemix may prompt you for an alias name to associate with your ID. If this happens, pick a unique string (such as USAWS); you can use it as the alias here, the team in Slack, and the org name for PagerDuty.
A Slack account. If you don’t have an account, register for one. Slack offers 30-day trials.
A Sauce Labs account. If you don’t have an account, register for one. Sauce Labs offers 14-day trials.
In the next step, we will log in to IBM Bluemix DevOps Services and use the Deploy to Bluemix button to create a copy of a sample application that runs on IBM Bluemix. The sample application is a very simple application that provides three APIs: a hello API that issues a hello message, an API that lists applications, and an API that lists a single application. Before doing that, we need to locate information about our Slack and Sauce Labs accounts. This information is required in the next section (Deploy to Bluemix).

8
1. In preparation for configuring the Slack integration, the API Authentication Token is found by going to https://api.slack.com/web. Scroll down to the authentication section and click the Create Token button next to the appropriate Slack account.
2. In preparation for configuring the Sauce Labs integration, we need to locate your account’s access key. To locate the key, go to this link: https://saucelabs.com/beta/users/username. where username is the user name created during the trial set up. Click the up arrow next to your name, and then click My Account.

9
On the My Account page, scroll down to see the Access Key section. Click the Show button.
Authorize the showing of the key. Copy the key to the clipboard.
Deploy the sample application
1. Click to launch the sample application deployment. Login to Bluemix.
Your default region will be IBM Bluemix US South, your organization will be your user ID, and your space will be dev.
10
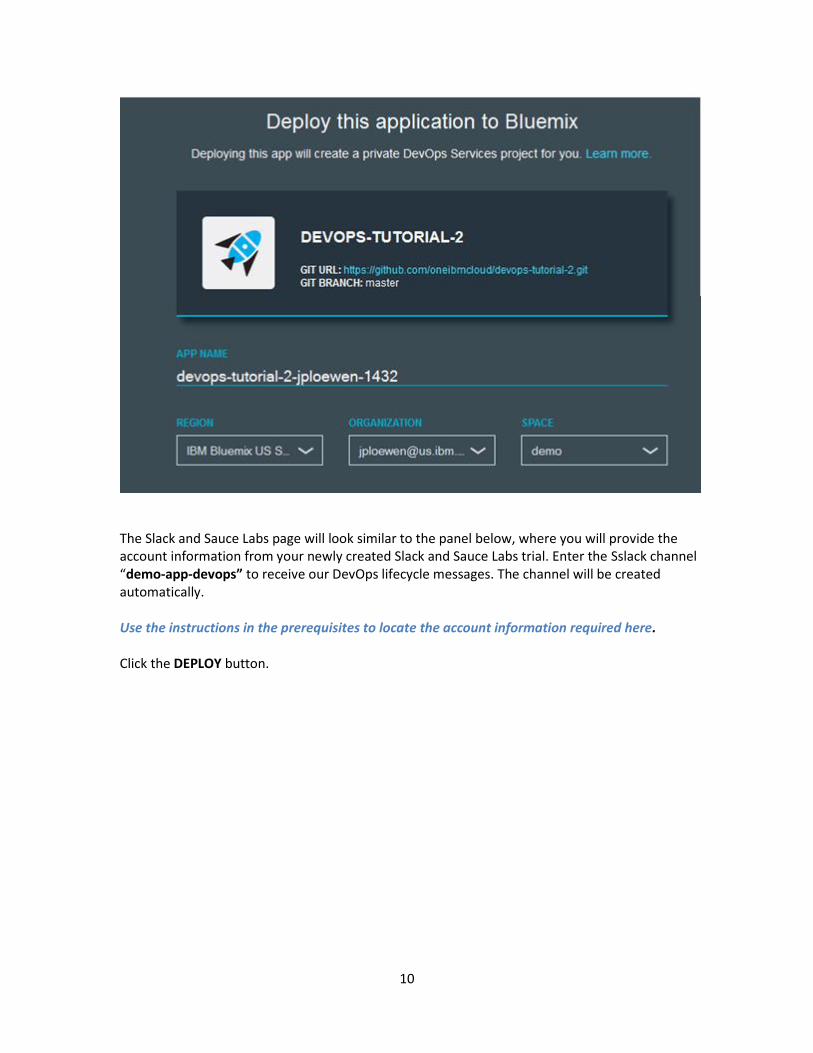
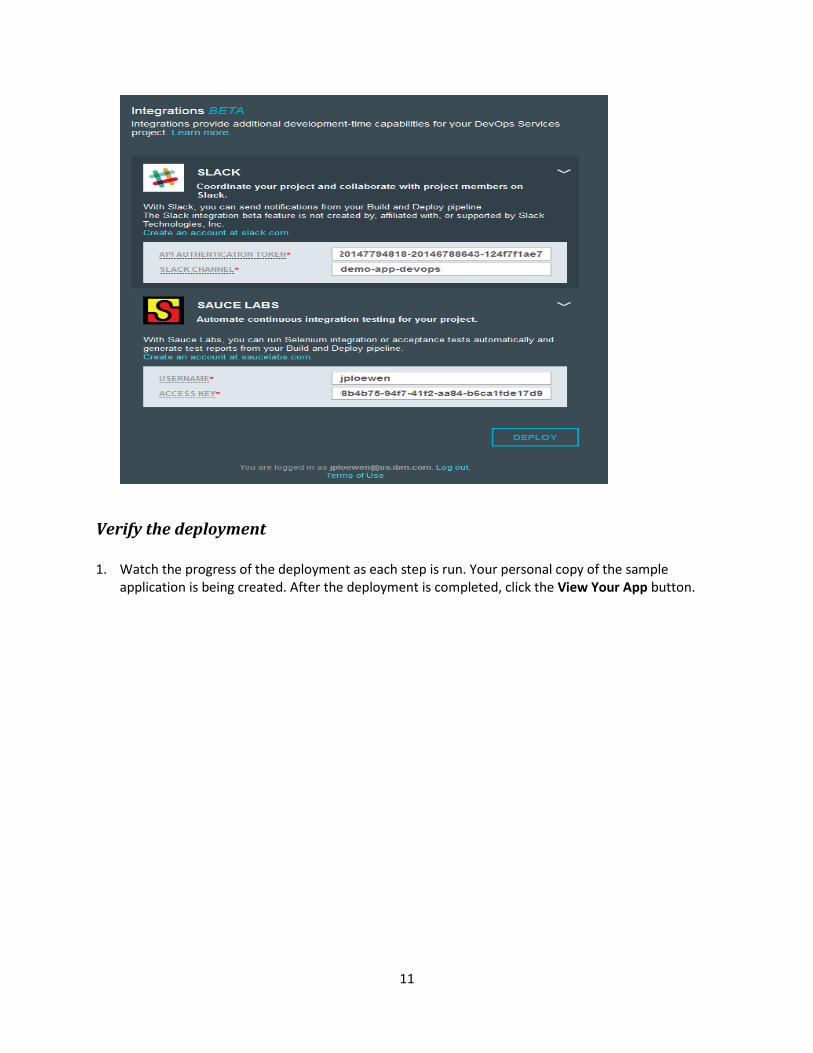
The Slack and Sauce Labs page will look similar to the panel below, where you will provide the account information from your newly created Slack and Sauce Labs trial. Enter the Sslack channel “demo-app-devops” to receive our DevOps lifecycle messages. The channel will be created automatically.
Use the instructions in the prerequisites to locate the account information required here.
Click the DEPLOY button.
11
Verify the deployment
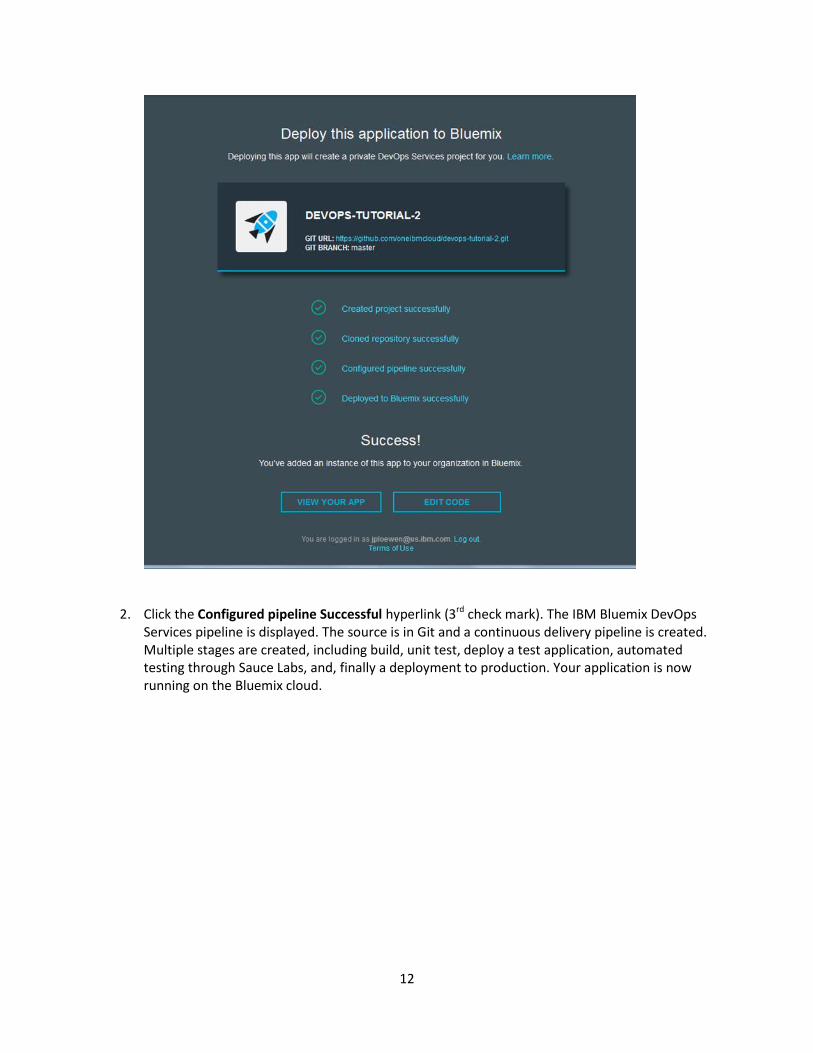
1. Watch the progress of the deployment as each step is run. Your personal copy of the sample application is being created. After the deployment is completed, click the View Your App button.
12
2. Click the Configured pipeline Successful hyperlink (3rd check mark). The IBM Bluemix DevOps Services pipeline is displayed. The source is in Git and a continuous delivery pipeline is created. Multiple stages are created, including build, unit test, deploy a test application, automated testing through Sauce Labs, and, finally a deployment to production. Your application is now running on the Bluemix cloud.
13
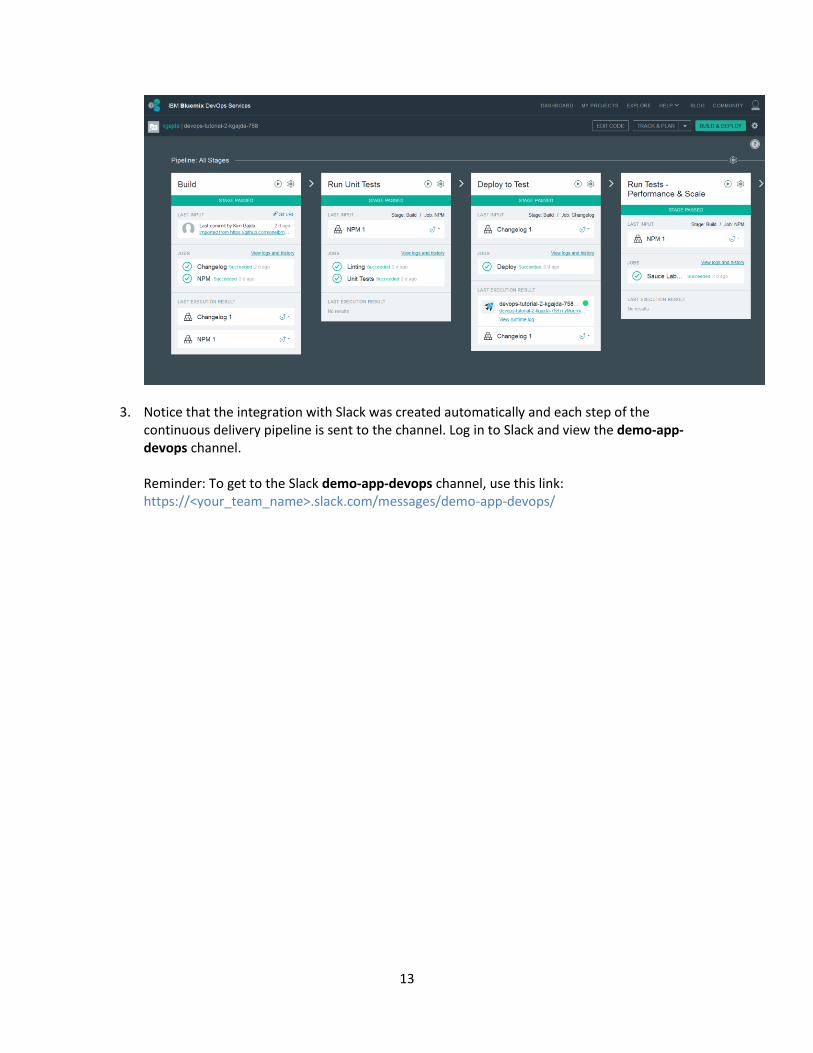
3. Notice that the integration with Slack was created automatically and each step of the continuous delivery pipeline is sent to the channel. Log in to Slack and view the demo-app-devops channel.
Reminder: To get to the Slack demo-app-devops channel, use this link: https://<your_team_name>.slack.com/messages/demo-app-devops/

14
4. Visit the Bluemix Dashboard. View the running applications by clicking the Dashboard link at the top of the screen.
15
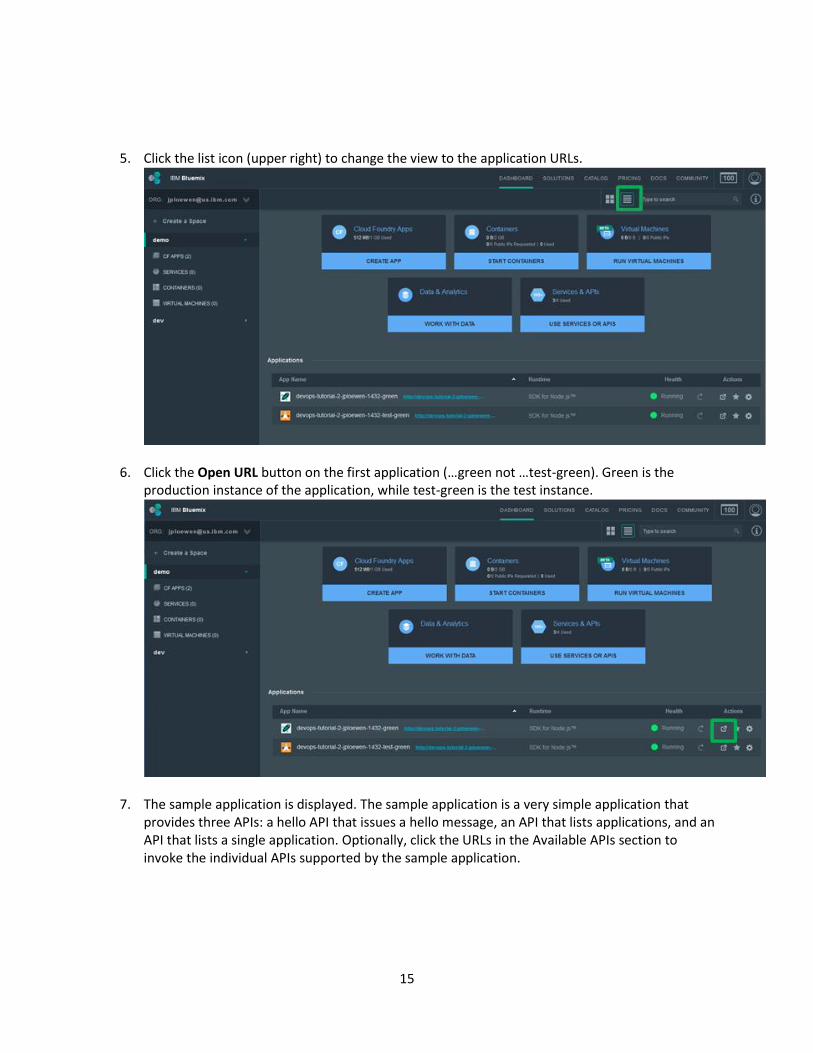
5. Click the list icon (upper right) to change the view to the application URLs.
6. Click the Open URL button on the first application (…green not …test-green). Green is the production instance of the application, while test-green is the test instance.
7. The sample application is displayed. The sample application is a very simple application that provides three APIs: a hello API that issues a hello message, an API that lists applications, and an API that lists a single application. Optionally, click the URLs in the Available APIs section to invoke the individual APIs supported by the sample application.

16

17
Activity 2: Monitor your sample application Set up New Relic, a synthetic monitor, notification channel, and alert policy. In this section, we will walk through the basics of setting up monitoring for our sample application using New Relic. There are many tools that provide similar function; refer to the Automated monitoring practice for more tool suggestions. Because we are using New Relic trial accounts, we will send notifications to PagerDuty by email. We will create a simple escalation policy that may involve two people or the same person being contacted two different ways (for illustration). We will simulate an outage with our demo application and see how callouts and escalation can help our DevOps teams.
Prerequisites
A New Relic account. If you don’t have an account, register for one. New Relic offers 30-day trials.
A PagerDuty account. If you don’t have an account, register for one. PagerDuty offers 14-day trials.
PagerDuty Setup 1. Log in to PagerDuty and start a free 14-day trial. An initial setup wizard is provided. Enter your
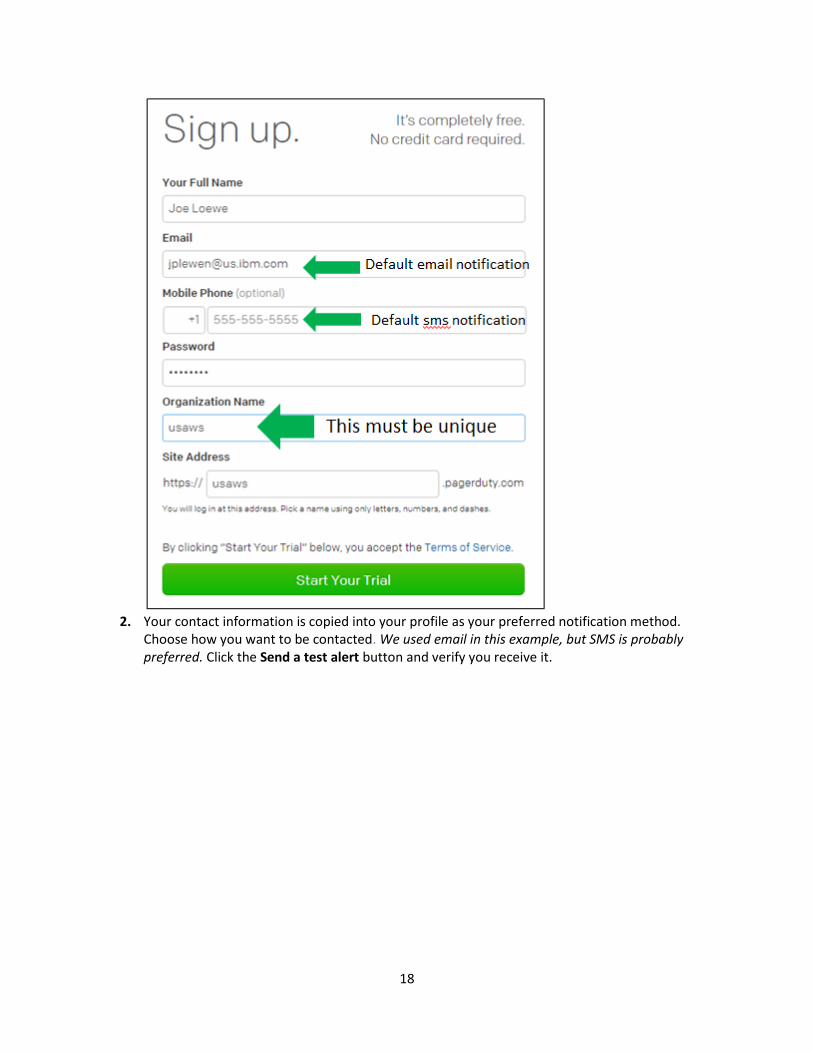
name, phone number, and email address. The phone number and email address will be used to send you notification as part of this workshop. Enter a string for organization. This must be unique, such as usaws. PagerDuty will create a unique URL for you to log in to (for example, usaws.pagerduty.com) and email address for your service (for example, [email protected]).
18
2. Your contact information is copied into your profile as your preferred notification method.
Choose how you want to be contacted. We used email in this example, but SMS is probably preferred. Click the Send a test alert button and verify you receive it.
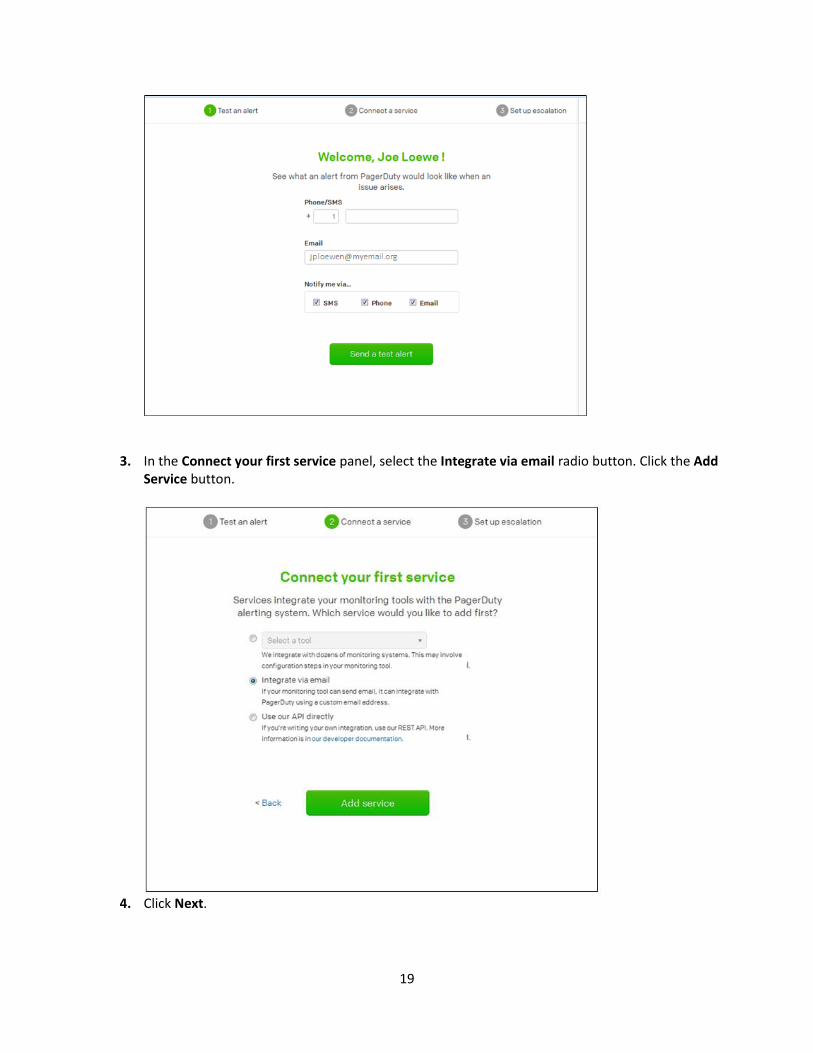
19
3. In the Connect your first service panel, select the Integrate via email radio button. Click the Add Service button.
4. Click Next.

20
5. In the Setup Incident Escalation page, you will be the primary contact in our escalation policy. Set the wait time (such as 5 minutes) and the secondary responder’s email. Here, we used another email address ([email protected]) for ourselves to illustrate the escalation. Click Finish.

21
1. Review the service configuration to understand what the wizard created. Click the down arrow
next to the gear for the Email service. Select View.

22
8. Note the email address associated with your service. The general format is email@your_org.pagerduty.com. Click on the escalation policy name Default.
9. The escalation policy matches our 2-tier approach.
Create a monitor
1. Log in to New Relic and start your free trial. Enter the requested information, select 1-2 server for the number of app servers and nodejs for platforms to monitor.

23
2. In this step, we create a simple synthetic ping monitor to check our sample application and verify that we see the string “Application APIs” on the screen.
Log in to New Relic, click the Synthetics tab, and then click Add Monitor.
3. Fill out the details related to the monitor:
Select Ping.
Enter the monitor name (such as Demo App Prod ).

24
Add your sample application’s URL (for example, http://devops-tutorial-2-jploewen-1432.mybluemix.net/). You can see your application’s URL on the Bluemix dashboard of the Bluemix DevOps pipeline’s Deploy to Production stage.
Specify “Available APIs” in the Response Validation field.
Select 2-3 locations from which to ping (for example, San Francisco, Dublin, and Sydney).
Set the frequency to 1 minute.
Add the email address of your PagerDuty service, such as “[email protected] ” in the Email address field. Yours will be similar, but contain your org. The format is email@your_org.pagerduty.com.
Click the Create my monitor button.
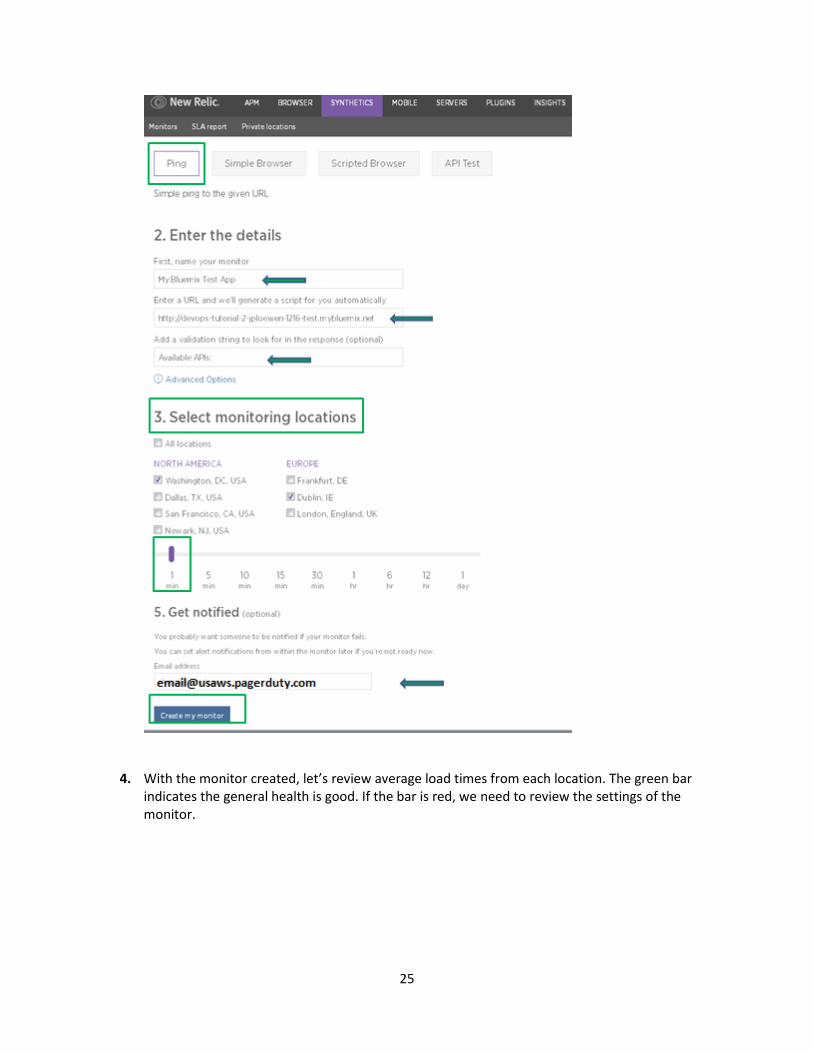
25
4. With the monitor created, let’s review average load times from each location. The green bar
indicates the general health is good. If the bar is red, we need to review the settings of the monitor.

26
5. Once the monitoring of our application has been running for a few minutes, we can verify that our monitor will detect that our sample application is not running. Go to the Bluemix Dashboard and stop the application. Click the gear to open the menu, and then click Stop App.
6. Notice that the New Relic monitor reflects the failure.
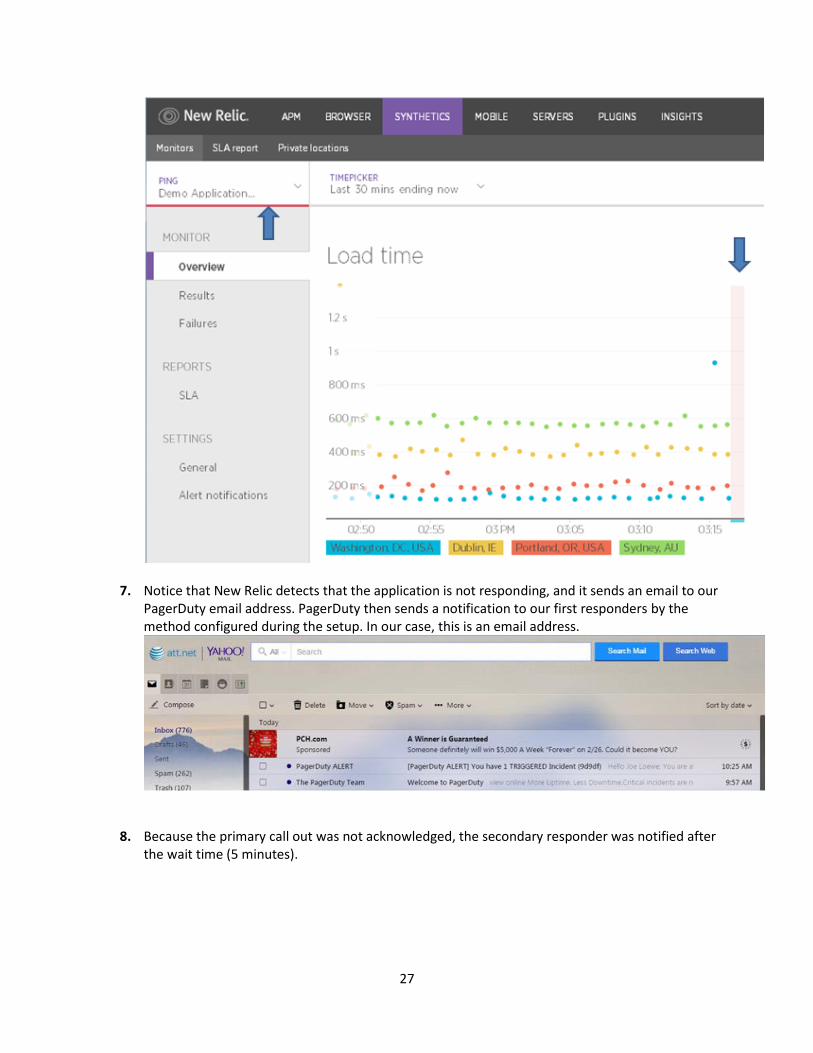
27
7. Notice that New Relic detects that the application is not responding, and it sends an email to our PagerDuty email address. PagerDuty then sends a notification to our first responders by the method configured during the setup. In our case, this is an email address.
8. Because the primary call out was not acknowledged, the secondary responder was notified after the wait time (5 minutes).

28
9. Finally, we see PagerDuty also records the incident. Resolve the incident by clicking the check box next to the incident and clicking the Resolve button.
10. Restart the demo application in the Bluemix Dashboard using the Start App command.

29
Activity #3: Enhance collaboration with Slack When incidents occur we want to communicate this to the entire team for collaboration. We can also benefit from knowing what else is happening with our applications DevOps lifecycle. In this activity, we will leverage PagerDuty to forward incidents to our Slack channel.
Prerequisites We want to enable our Slack account to receive events from PagerDuty. First, we configure Slack to receive webhooks events.
1. Log in to Slack and click the down arrow next to the team name. Click Apps and Custom Integrations.
2. The integrations page is launched in a new window (https://slack.com/apps). Enter “pagerduty” in the search box. Select PagerDuty in the list.

30
3. The PagerDuty configuration page is displayed. Click the Install button next to your Slack team name.
31
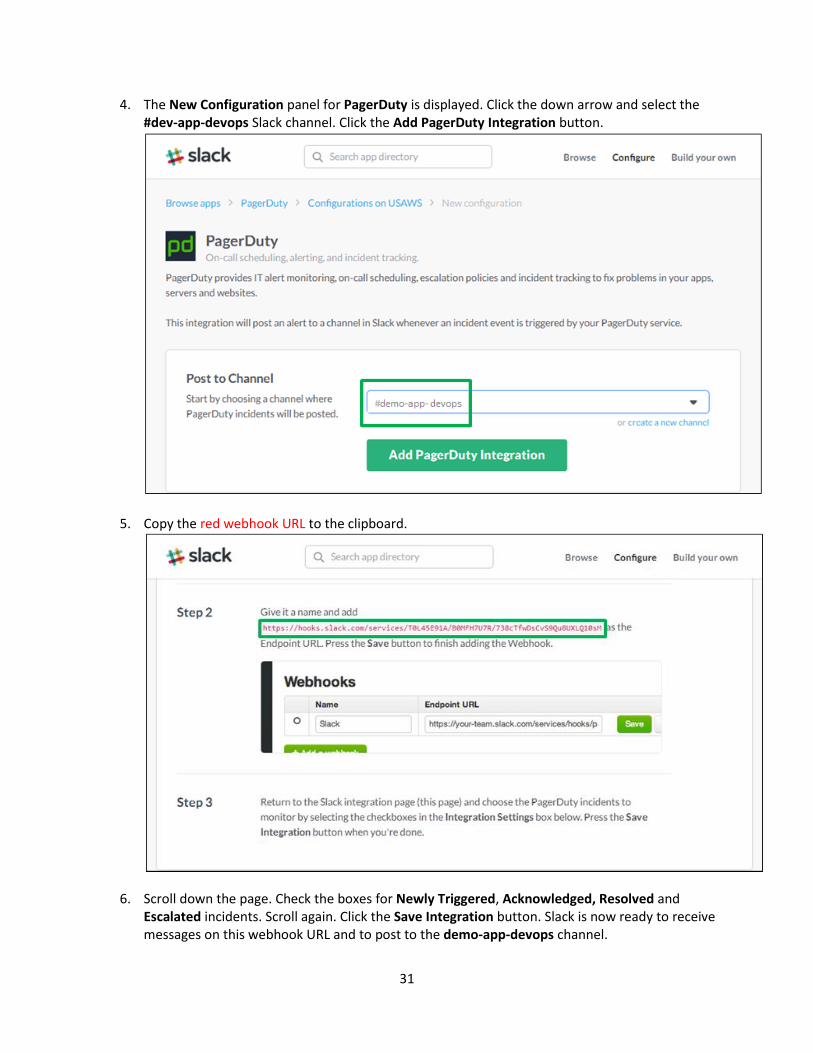
4. The New Configuration panel for PagerDuty is displayed. Click the down arrow and select the #dev-app-devops Slack channel. Click the Add PagerDuty Integration button.
5. Copy the red webhook URL to the clipboard.
6. Scroll down the page. Check the boxes for Newly Triggered, Acknowledged, Resolved and Escalated incidents. Scroll again. Click the Save Integration button. Slack is now ready to receive messages on this webhook URL and to post to the demo-app-devops channel.

32
7. The Slack demo-app-devops channel shows the integration was added.
Configure PagerDuty to send incidents to Slack
2. Log in to PagerDuty. Click Configuration, and then click Services.

33
3. Click the down arrow next to the gear for the Email service. Select View.
4. Note the Integration Email address matches what we configured in the New Relic email address
field for the monitor. Scroll down to the Webhooks list and click the Add a webhook button.

34
5. Enter the text Slack_demo-app-devops in the Name field. Paste the Slack webhook URL (red webhook URL) into the Endpoint URL field. Make sure you copy the whole URL. Click the Save button.
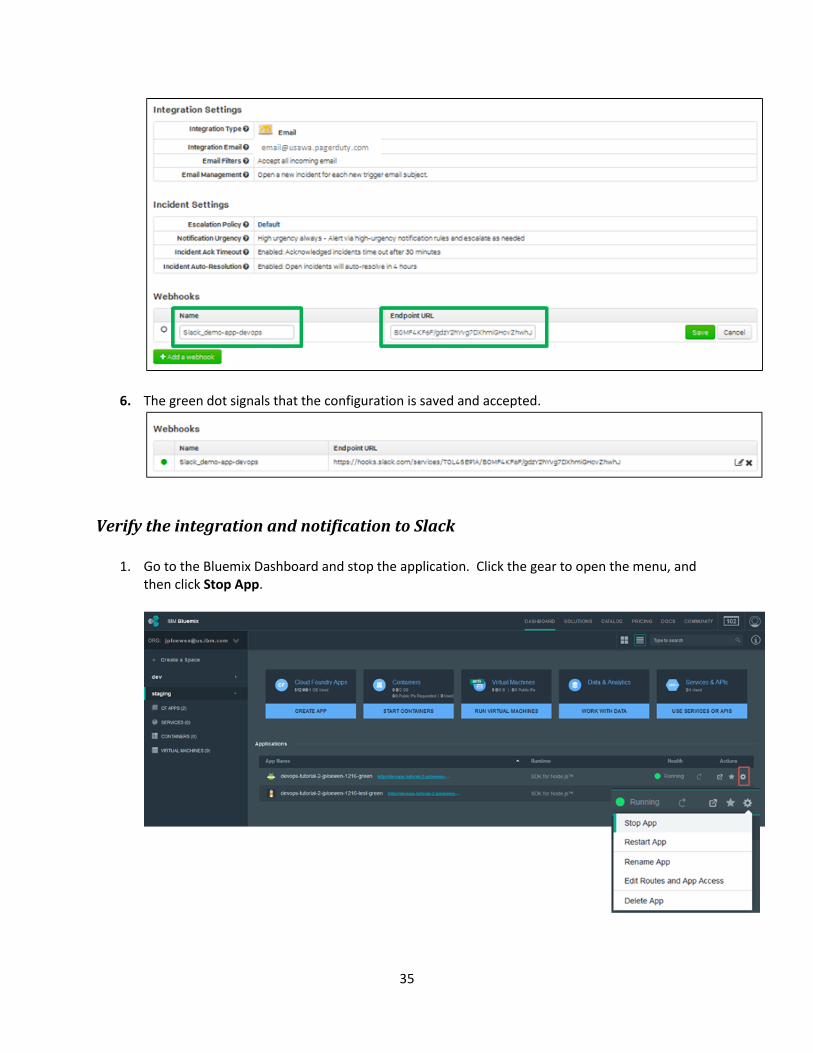
35
6. The green dot signals that the configuration is saved and accepted.
Verify the integration and notification to Slack
1. Go to the Bluemix Dashboard and stop the application. Click the gear to open the menu, and then click Stop App.
36
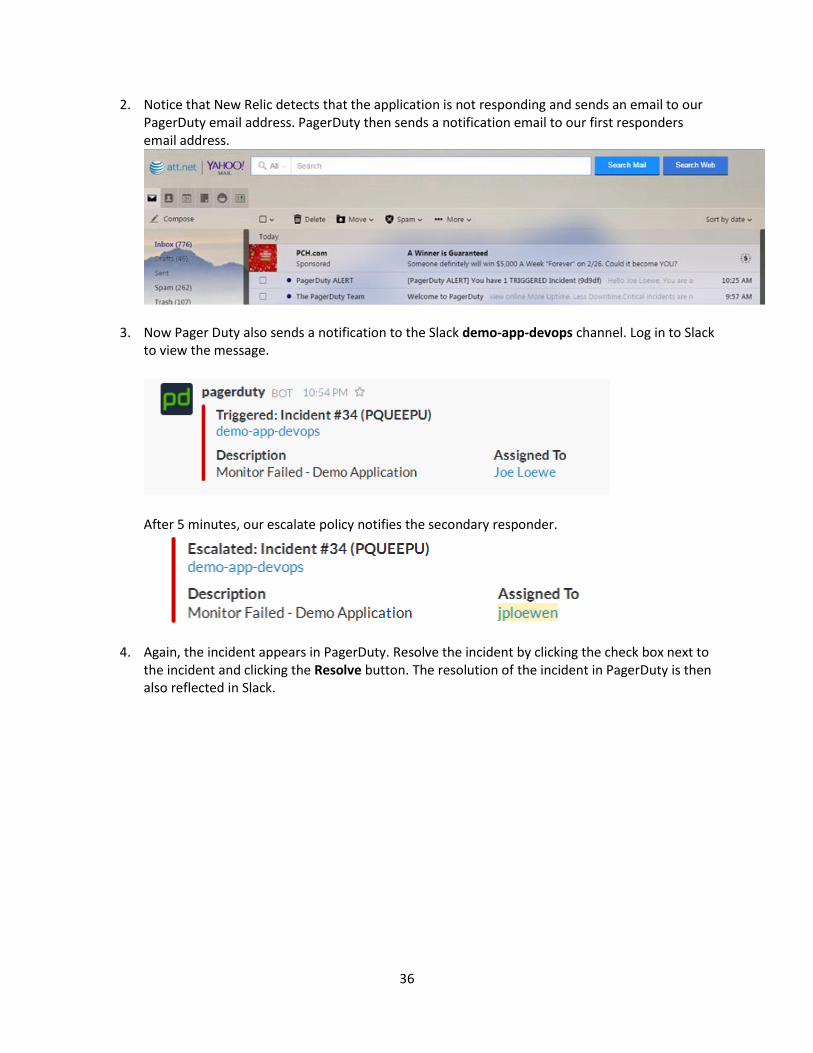
2. Notice that New Relic detects that the application is not responding and sends an email to our PagerDuty email address. PagerDuty then sends a notification email to our first responders email address.
3. Now Pager Duty also sends a notification to the Slack demo-app-devops channel. Log in to Slack to view the message.
After 5 minutes, our escalate policy notifies the secondary responder.
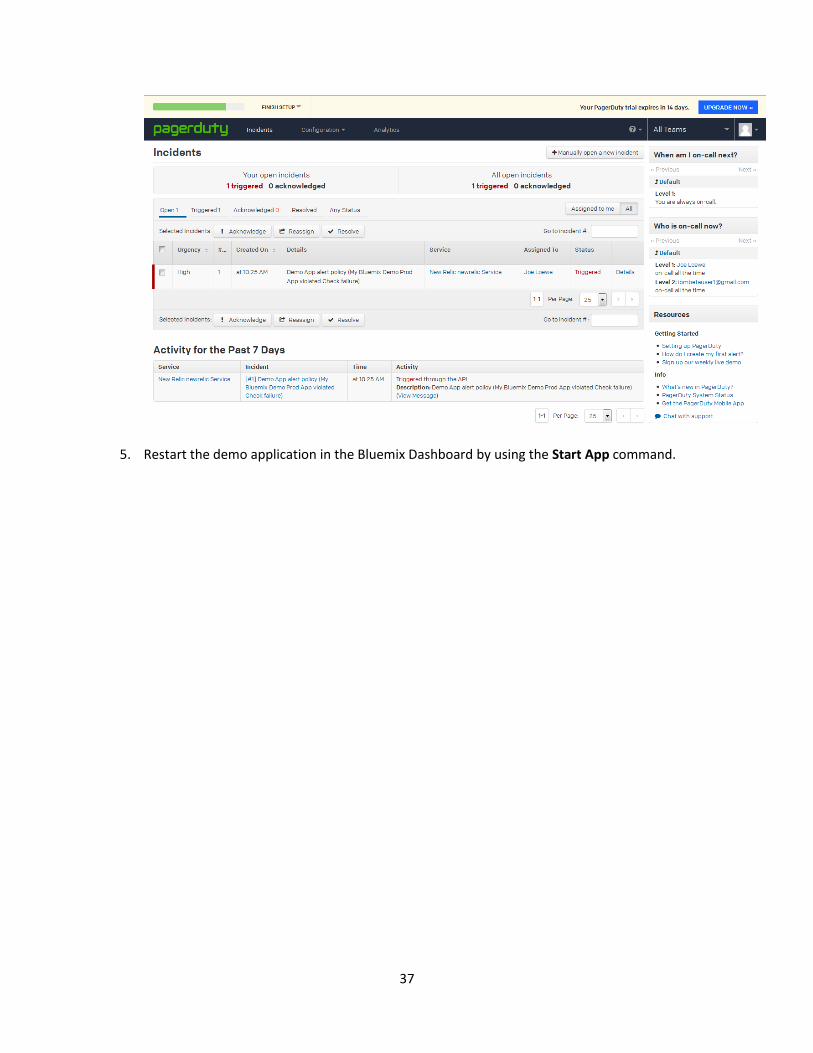
4. Again, the incident appears in PagerDuty. Resolve the incident by clicking the check box next to
the incident and clicking the Resolve button. The resolution of the incident in PagerDuty is then also reflected in Slack.
37
5. Restart the demo application in the Bluemix Dashboard by using the Start App command.

38

39
Activity #4: Understand the user experience
40
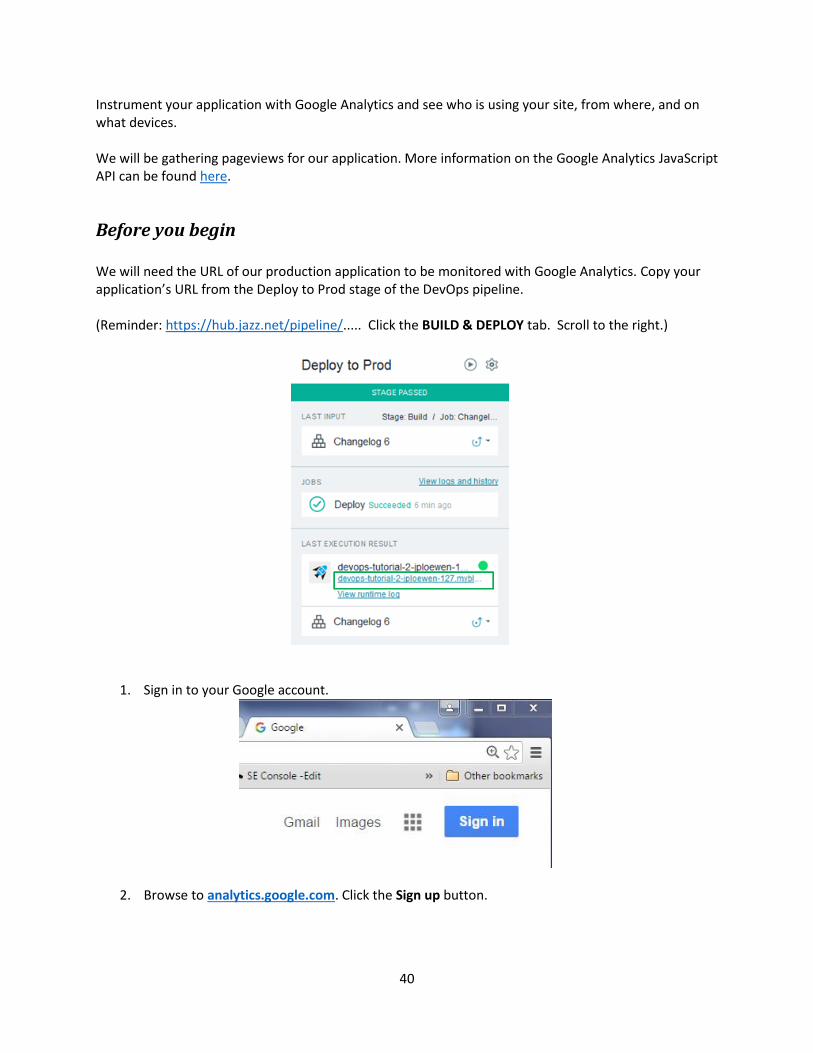
Instrument your application with Google Analytics and see who is using your site, from where, and on what devices. We will be gathering pageviews for our application. More information on the Google Analytics JavaScript API can be found here.
Before you begin We will need the URL of our production application to be monitored with Google Analytics. Copy your application’s URL from the Deploy to Prod stage of the DevOps pipeline. (Reminder: https://hub.jazz.net/pipeline/..... Click the BUILD & DEPLOY tab. Scroll to the right.)
1. Sign in to your Google account.
2. Browse to analytics.google.com. Click the Sign up button.

41
3. Fill in the account name, website name, and website URL (see Before you begin). Then, click the
Get Tracking ID button.

42
4. Click I Accept when the terms of service dialog box is displayed.
5. You will land on a page with your tracking ID, and a text box containing JavaScript. Copy the
contents of this text box to your clipboard.
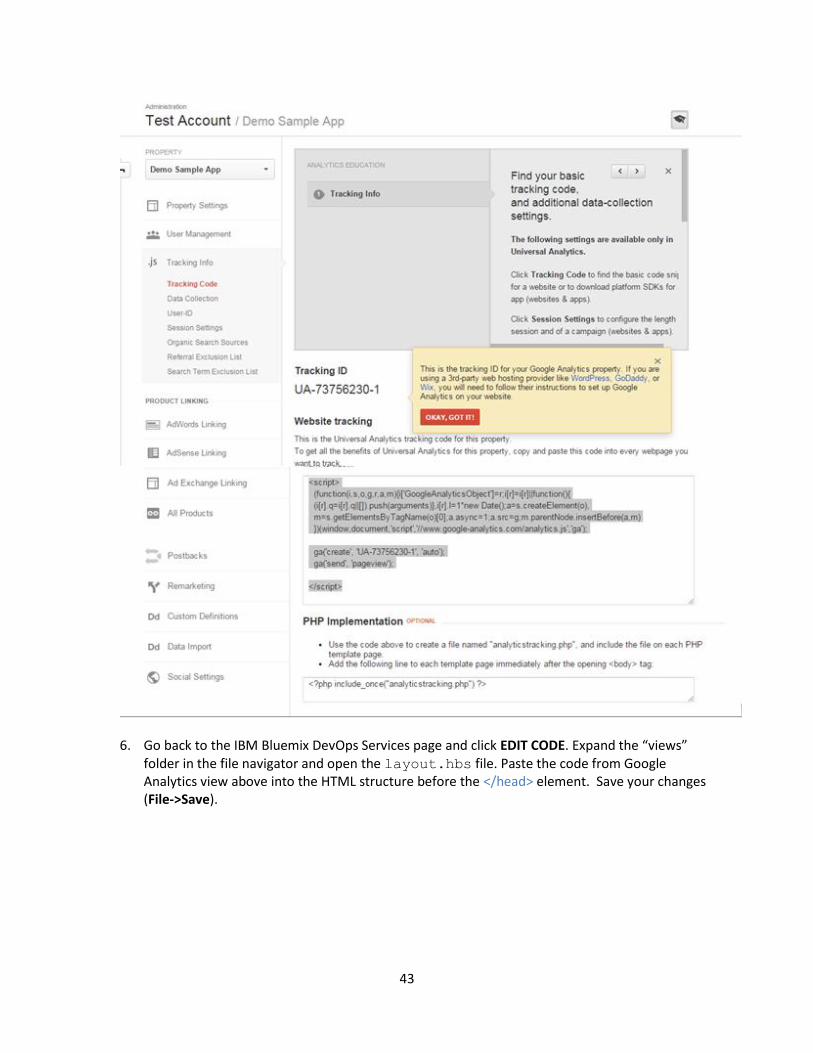
43
6. Go back to the IBM Bluemix DevOps Services page and click EDIT CODE. Expand the “views”
folder in the file navigator and open the layout.hbs file. Paste the code from Google Analytics view above into the HTML structure before the </head> element. Save your changes (File->Save).

44
7. Click the Git Repository icon on the left side.
8. A new outgoing change should show up on the left side. The middle panel shows the changes to
the layout.lbs file. Enter the comment “Added Google Analytics” in the comment field and click the Commit button. In the left panel, click the Sync button.

45
9. Syncing changes automatically reruns the pipeline. Click the BUILD & DEPLOY button at the top
right to see the continuous delivery process in action. The pipeline includes stages to build, run unit tests, deploy to test, run performance and scale tests, and then deploy to production. Each stage of the pipeline will change to “Stage passed” as it succeeds. This takes approximately 10 minutes.
(Reminder: https://hub.jazz.net/pipeline/..... Click the BUILD & DEPLOY tab) 10. Once all the pipeline stages have passed, click the link to view your app. Right-click the URL of
your application in the Deploy to Prod stage.

46
11. Refresh the page several times to create page loads. These will be recorded by Google Analytics.
12. Open Google Analytics and navigate to the Reporting tab, and then click Real Time->Overview.
You should see an active user from your approximate location.

47

48
Survey
– Please help us expand and improve the site by taking our survey.

49
Notices This information was developed for products and services offered in the US. This material might be available from IBM in other languages. However, you may be required to own a copy of the product or product version in that language in order to access it. IBM may not offer the products, services, or features discussed in this document in other countries. Consult your local IBM representative for information on the products and services currently available in your area. Any reference to an IBM product, program, or service is not intended to state or imply that only that IBM product, program, or service may be used. Any functionally equivalent product, program, or service that does not infringe any IBM intellectual property right may be used instead. However, it is the user's responsibility to evaluate and verify the operation of any non-IBM product, program, or service. IBM may have patents or pending patent applications covering subject matter described in this document. The furnishing of this document does not grant you any license to these patents. You can send license inquiries, in writing, to: IBM Director of Licensing IBM Corporation North Castle Drive Armonk, NY 10504-1785 U.S.A. The following paragraph does not apply to the United Kingdom or any other country where such provisions are inconsistent with local law: INTERNATIONAL BUSINESS MACHINES CORPORATION PROVIDES THIS PUBLICATION "AS IS" WITHOUT WARRANTY OF ANY KIND, EITHER EXPRESS OR IMPLIED, INCLUDING, BUT NOT LIMITED TO, THE IMPLIED WARRANTIES OF NON-INFRINGEMENT, MERCHANTABILITY OR FITNESS FOR A PARTICULAR PURPOSE. Some states do not allow disclaimer of express or implied warranties in certain transactions, therefore, this statement may not apply to you. This information could include technical inaccuracies or typographical errors. Changes are periodically made to the information herein; these changes will be incorporated in new editions of the publication. IBM may make improvements and/or changes in the product(s) and/or the program(s) described in this publication at any time without notice. Any references in this information to non-IBM websites are provided for convenience only and do not in any manner serve as an endorsement of those websites. The materials at those websites are not part of the materials for this IBM product and use of those websites is at your own risk. IBM may use or distribute any of the information you supply in any way it believes appropriate without incurring any obligation to you. The performance data and client examples cited are presented for illustrative purposes only. Actual performance results may vary depending on specific configurations and operating conditions.
50
Information concerning non-IBM products was obtained from the suppliers of those products, their published announcements or other publicly available sources. IBM has not tested those products and cannot confirm the accuracy of performance, compatibility or any other claims related to non-IBM products. Questions on the capabilities of non-IBM products should be addressed to the suppliers of those products. Statements regarding IBM's future direction or intent are subject to change or withdrawal without notice, and represent goals and objectives only. This information contains examples of data and reports used in daily business operations. To illustrate them as completely as possible, the examples include the names of individuals, companies, brands, and products. All of these names are fictitious and any similarity to the names and addresses used by an actual business enterprise is entirely coincidental.
Trademarks IBM, the IBM logo, and ibm.com are trademarks or registered trademarks of International Business Machines Corp., registered in many jurisdictions worldwide. Other product and service names might be trademarks of IBM or other companies. A current list of IBM trademarks is available on the web at "Copyright and trademark information" at www.ibm.com/legal/copytrade.shtml.


