Download - IABM Industry Update Industry Update Peter White, CEO, IABM Peter Bruce, APAC Director, IABM

IABM Industry UpdatePeter White, CEO, IABM
Peter Bruce, APAC Director, IABM

Regional Focus: Asia-Pacific• Peter Bruce, APAC Director, IABM

IABM Industry Update Breakfast – Broadcast Asia 2017 IABM Copyright 2017 @THEIABMwww.theiabm.org
An Overview
Asia-Pacific
• The market in APAC is varied as it includes countries at very different stages of broadcast industry development
• Some countries are in the midst of transitioning to digital/HD broadcasting with a great deal of spending going into digital transmission, infrastructure and monitoring equipment
• Others have already migrated to digital/HD broadcasting and are pioneering the adoption of cutting-edge technologies such as UHD and ATSC 3.0
Source: Statista
2015 2016 2017 2018 2019 2020 2021 CAGR (2015-2021)Population 3421m 3450m 3477m 3504m 3530m 3555m 3579m 0.8%GDP / Capita US$ $6,200 $6,433 $6,799 $7,209 $7,705 $8,288 $8,897 6.2%Internet Penetration (%) 43.2% 45.5% 48.0% 50.5% 53.1% 55.9% 58.7% 5.3%Smartphone Penetration (%) 29.1% 32.4% 35.3% 37.9% 40.1% 42.0% 43.6% 7.0%

IABM Industry Update Breakfast – Broadcast Asia 2017 IABM Copyright 2017 @THEIABMwww.theiabm.org
An Overview
Asia-Pacific

IABM Industry Update Breakfast – Broadcast Asia 2017 IABM Copyright 2017 @THEIABMwww.theiabm.org
• Economic growth in APAC remains the highest in the world, mostly driven by India and China – India > China
• The slowdown in the Chinese economy during 2015 softened in 2016 and 2017 as a result of a renewed increase in infrastructure investment
• Growth in Southeast Asia will average 4.8% in the next three years driven by the Philippines, Vietnam, Cambodia, Lao and Myanmar
Asia-Pacific Economic Outlook: Stronger than the rest of the world
Business Environment
-2%
-1%
0%
1%
2%
3%
4%
5%
6%
7%
8%
2015 2016 2017* 2018*
GDP Growth in Major World regions, 2015-2018
World Output
Advanced Economies
Emerging and DevelopingAsia
Emerging and DevelopingEurope
Latin America and theCaribbean
Middle East, North Africa,Afghanistan, and Pakistan
Sub-Saharan Africa
Source: IMF

IABM Industry Update Breakfast – Broadcast Asia 2017 IABM Copyright 2017 @THEIABMwww.theiabm.org
Most economies are dependent on China
Business Environment
0%
5%
10%
15%
20%
25%
30%
35%
Singapore Korea Malaysia Chile Thailand SaudiArabia
Australia NewZealand
Philippines Japan
Trade Linkages with China (Export and Import Ratios), Top 10 countries
Export ratio Import ratio Slowdown in China has affected economic activity in other countries as well!
Source: OECD (Organization for Economic Co-operation and Development)

IABM Industry Update Breakfast – Broadcast Asia 2017 IABM Copyright 2017 @THEIABMwww.theiabm.org
• Indonesia: GDP and manufacturing PMI are both rising. Economic conditions are still very positive. Infrastructure spending is though slowing
• Thailand: Strength of the baht undermining local export sector –imports have soared at the beginning of 2017 due to the currency’s appreciation. Infrastructure spending is accelerating
• Malaysia: Economy still suffering from low oil prices and lower global trade – this situation should improve in 2017 (more trade)
• Lao & Myanmar: the region’s fastest growing economies (growing 7% or higher)
• Singapore: will grow the lowest as it is the more mature economy (and it is more dependent on China’s growth)
Southeast Asia Economic Outlook: Generally Stronger
Business Environment
-10% -8% -6% -4% -2% 0% 2% 4% 6% 8% 10%
Myanmar
Lao
Cambodia
Vietnam
Philippines
Indonesia
Malaysia
Thailand
Singapore
Brunei
GDP Growth Forecasts
2016 2017
Source: IMF

IABM Industry Update Breakfast – Broadcast Asia 2017 IABM Copyright 2017 @THEIABMwww.theiabm.org
In the first part of 2017, most currencies have appreciated Vs USD
Business Environment
-10%
-8%
-6%
-4%
-2%
0%
2%
4%
6%
8%
10%
AUD/USD CNY/USD INR/USD IDR/USD JPY/USD MYR/USD NZD/USD PHP/USD SGD/USD KRW/USD TWD/USD VND/USD THB/USD
Selected APAC currencies, Gain/Loss Vs USD January-May 2017
Appreciation Vs USD
Depreciation Vs USD
Source: PACIFIC Exchange Rate Services
IABM Industry Update Breakfast – Broadcast Asia 2017 IABM Copyright 2017 @THEIABMwww.theiabm.org
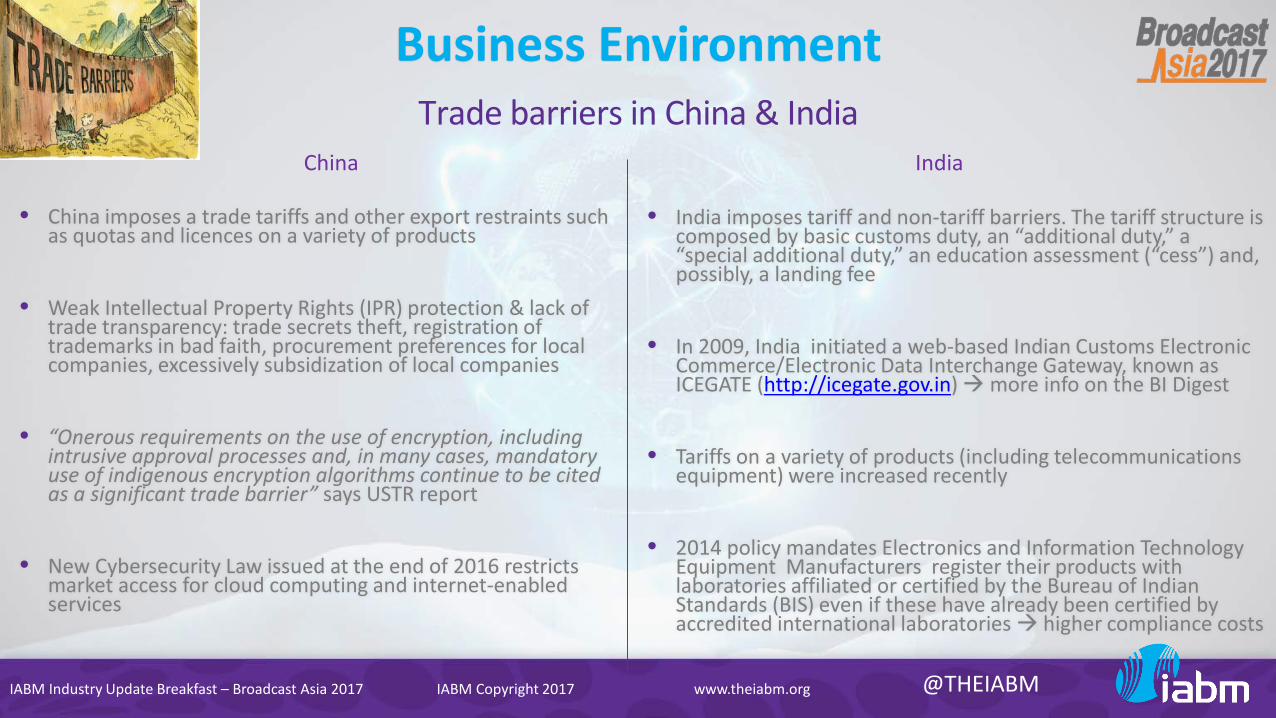
• China imposes a trade tariffs and other export restraints such as quotas and licences on a variety of products
• Weak Intellectual Property Rights (IPR) protection & lack of trade transparency: trade secrets theft, registration of trademarks in bad faith, procurement preferences for local companies, excessively subsidization of local companies
• “Onerous requirements on the use of encryption, including intrusive approval processes and, in many cases, mandatory use of indigenous encryption algorithms continue to be cited as a significant trade barrier” says USTR report
• New Cybersecurity Law issued at the end of 2016 restricts market access for cloud computing and internet-enabled services
Trade barriers in China & India
Business Environment
China
• India imposes tariff and non-tariff barriers. The tariff structure is composed by basic customs duty, an “additional duty,” a “special additional duty,” an education assessment (“cess”) and, possibly, a landing fee
• In 2009, India initiated a web-based Indian Customs Electronic Commerce/Electronic Data Interchange Gateway, known as ICEGATE (http://icegate.gov.in) more info on the BI Digest
• Tariffs on a variety of products (including telecommunications equipment) were increased recently
• 2014 policy mandates Electronics and Information Technology Equipment Manufacturers register their products with laboratories affiliated or certified by the Bureau of Indian Standards (BIS) even if these have already been certified by accredited international laboratories higher compliance costs
India

IABM Industry Update Breakfast – Broadcast Asia 2017 IABM Copyright 2017 @THEIABMwww.theiabm.org
• Positive operational performance at constant exchange rates. This changes when accounting for variance in exchange rates (between 2015 and 2016) – most currencies have lost ground Vs. USD
• Growing Pay-TV market – rising revenues and profits across the whole region
• Pay-TV threatened by online piracy – it is rife in Asia-Pacific
• Advertising picture varies depending on the country considered
Both Revenues and Profits are up!
End-Users’ Performance
5%
3%
0%
1%
2%
3%
4%
5%
6%
Revenue Change Profit Change
Asia-Pacific
Source: IABM End-User Index(Constant Exchange Rates)
IABM Industry Update Breakfast – Broadcast Asia 2017 IABM Copyright 2017 @THEIABMwww.theiabm.org
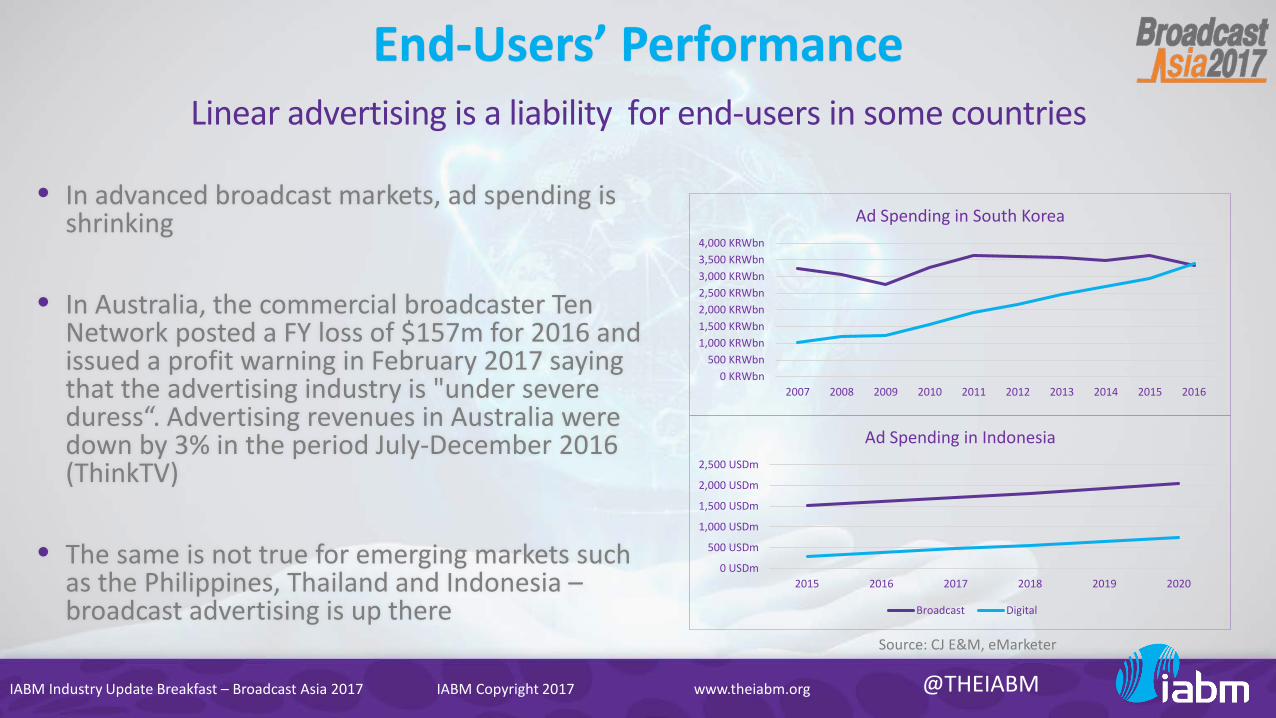
• In advanced broadcast markets, ad spending is shrinking
• In Australia, the commercial broadcaster Ten Network posted a FY loss of $157m for 2016 and issued a profit warning in February 2017 saying that the advertising industry is "under severe duress“. Advertising revenues in Australia were down by 3% in the period July-December 2016 (ThinkTV)
• The same is not true for emerging markets such as the Philippines, Thailand and Indonesia –broadcast advertising is up there
Linear advertising is a liability for end-users in some countries
End-Users’ Performance
Source: CJ E&M, eMarketer
0 KRWbn500 KRWbn
1,000 KRWbn1,500 KRWbn2,000 KRWbn2,500 KRWbn3,000 KRWbn3,500 KRWbn4,000 KRWbn
2007 2008 2009 2010 2011 2012 2013 2014 2015 2016
Ad Spending in South Korea
0 USDm
500 USDm
1,000 USDm
1,500 USDm
2,000 USDm
2,500 USDm
2015 2016 2017 2018 2019 2020
Ad Spending in Indonesia
Broadcast Digital

IABM Industry Update Breakfast – Broadcast Asia 2017 IABM Copyright 2017 @THEIABMwww.theiabm.org
• Pay-TV is expected to grow by 5.8% in the period 2016-2021. This is slower than before due to piracy – opportunity for conditional access & DRM vendors
• Subscriber growth is expected to slow down in Southeast Asia although ARPU is set to remain healthy
• Ad-blocking software is highly concentrated in Asia. For instance, the Asia-Pacific region contains 55% of global smartphone users but 93% of ad-blocking browser usage!
• In India and Indonesia, more than half the smartphone population use ad-blocking browsers. Pop-up ads appearing on browsers reduce page loading speed and this is exacerbated in emerging countries as mobile broadband infrastructure is less developed
Piracy & Ad-Blocking are major issues in APAC
End-Users’ Performance
Source: Pagefair
0 20 40 60 80 100 120 140 160 180
Egypt
Germany
Great Britain
France
UAE
Nigeria
Philippines
Vietnam
Malaysia
United States
Brazil
Saudi Arabia
Russian Federation
Pakistan
Indonesia
India
China
Active Users of Adblocking Browsers by Country, March 2016 (millions)
IABM Industry Update Breakfast – Broadcast Asia 2017 IABM Copyright 2017 @THEIABMwww.theiabm.org
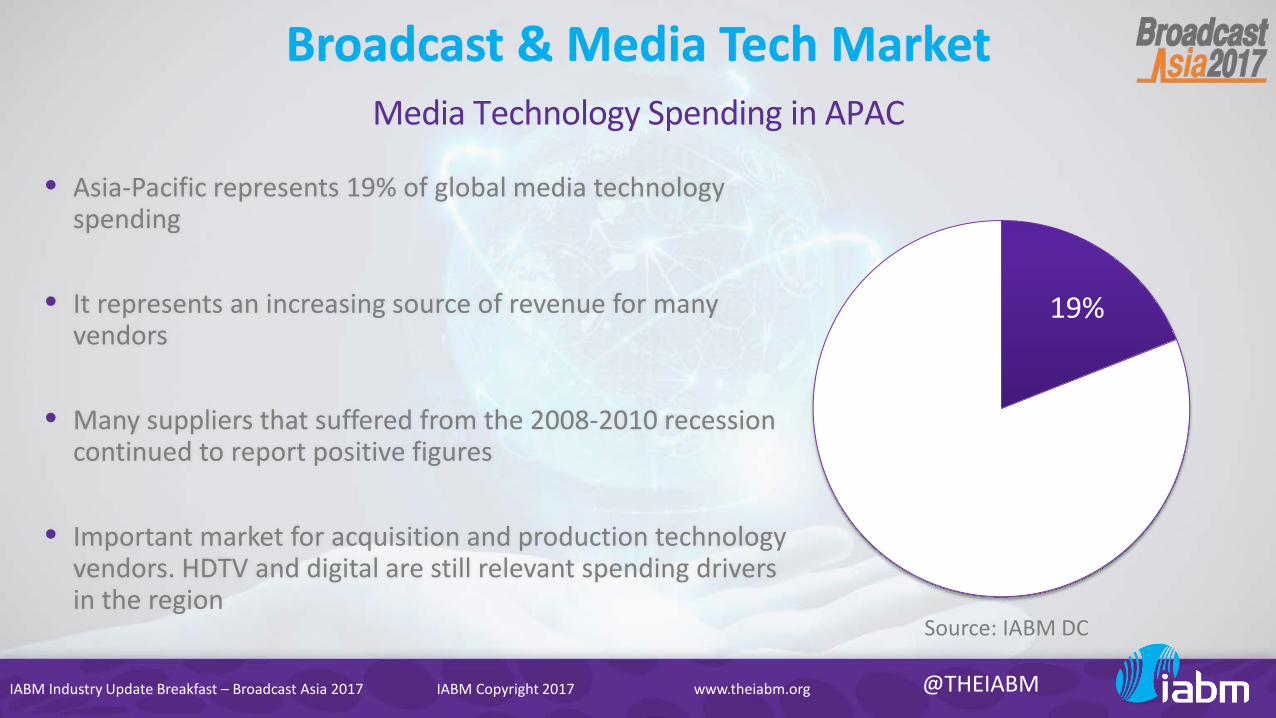
• Asia-Pacific represents 19% of global media technology spending
• It represents an increasing source of revenue for many vendors
• Many suppliers that suffered from the 2008-2010 recession continued to report positive figures
• Important market for acquisition and production technology vendors. HDTV and digital are still relevant spending drivers in the region
Media Technology Spending in APAC
Broadcast & Media Tech Market
19%
Source: IABM DC

IABM Industry Update Breakfast – Broadcast Asia 2017 IABM Copyright 2017 @THEIABMwww.theiabm.org
• Only five countries have completed the digital transition in APAC (12.5%), the rest is either going through the transition or has not started it yet. Major constraint to completing the transition is: lack of government funding to household and broadcasters
• One of the few exceptions is Thailand (where the transition is ongoing): the communications regulator has distributed millions of vouchers to buy digital equipment. Eligible households include those living in social housing and “state enterprise” officials. The expected DSO date is 2020
• In Myanmar, the original DSO plan entails the analogue switch-off of over 200 stations between 2017 and 2019. The expected DSO date is 2020. . The Myanmar government has recently issued five new free-to-air licences (DVB-T2) in April 2017 to the following broadcasters: DVB Multi Media, Fortune International, KuangMyanmar Aung, Mizzima Media, and Young Investment Group
Status of Digital Transition in APAC
Digital Transition
0%
10%
20%
30%
40%
50%
60%
70%
Completed Ongoing Not Started Unknown
Status of Digital Transition in APAC
Source: ITU

IABM Industry Update Breakfast – Broadcast Asia 2017 IABM Copyright 2017 @THEIABMwww.theiabm.org
• Vietnam intends to complete the transition to digital by 2020. Between 2017 and 2018 over 20 provinces will switch to digital
• The two most populous Southeast Asian countries, Indonesia and the Philippines, should complete their transitions by 2018 and 2023 respectively
• In Indonesia, DTT has been tested in 20 cities including Jakarta since 2016 – Indonesia is set to become the third-largest digital TV market by the end of the decade
• In the Philippines, GMA network has already invested in digital equipment. ABS-CBN has begun testing the technology in major cities. The government has recently unveiled its plan for transmission via the Japanese system ISBD-T
Status of Digital Transition in APAC
Digital Transition█ Not Started
█ Unknown
█ Completed
█ Ongoing
Source: ITU

IABM Industry Update Breakfast – Broadcast Asia 2017 IABM Copyright 2017 @THEIABMwww.theiabm.org
• South East Asia’s potential for increased HDTV channel deployment is big
• In China there is 1 HD channel for every 9.4m TV households. In the US there is 1 HD channel for every 197K TV households
• Other countries (except from Japan, South Korea etc.) have very low HD penetration rates as well
• Satellite broadcasting is important to the development of HD in Asia-Pacific. Many satellite service providers have expanded their capacity in the region to allow for a more extensive coverage
• In the next three years, the digital dividend in countries transitioning to digital will allow for more efficient delivery more HD channels
HD Deployment in APAC
HD Spending
0
100
200
300
400
500
600
700
US China
No. of HD Channels
Source: Statista

IABM Industry Update Breakfast – Broadcast Asia 2017 IABM Copyright 2017 @THEIABMwww.theiabm.org
• S Korea ATSC 3.0 UHD transmission to start the 31st May 2017 (beating USA). ATSC 3.0 will aid the further growth of 4K/UHD channels in the country
• The transition to 4K/UHD is underway in Japan, South Korea and India, where some local Pay-TV operators have already started broadcasting in the new format
• In Japan, some operators such as Sky Perfect JSAT have already launched 4K/UHD channels in 2015-2016. Japan’s Ministry of Internal Affairs & Communications announced that it aims at having 19-22 4K/UHD channels (operated by both FTA and Pay-TV broadcasters) on air by 2018 to focus on 8K deployment ahead of 2020 Tokyo Summer Games
• There have not been any noteworthy initiatives in Southeast Asia except from a few cases. First Media, an Indonesian Pay-TV provider, launched 4K/UHD in mid-2016
4K/UHD Adoption in APAC
4K/UHD Spending

IABM Industry Update Breakfast – Broadcast Asia 2017 IABM Copyright 2017 @THEIABMwww.theiabm.org
• The transition to file-based technology is still relevant in Asia-Pacific. According to our End-User data, about 20% of our APAC respondents have transitioned less than 50% of their operations to from tape to file – “file-based workflows” ranks high in the tech priorities’ index. This, along with digitization of workflows, is being adopted to make operations more efficient
• Media asset management ranks very high as well in the tech priorities’ index although primary priority remains multi-platform delivery – same in all other regions
File-Base Workflows & Media Asset Management
Other Spending Drivers
Facilis Technology partnered with local resellers in India,Hong Kong and The Philippines to help Asianbroadcasters such as ABS-CBN and Powervision TVmigrate to non-linear workflows
Telestream and Vizrt have partnered to integrate MAMand transcode solutions for media customers in theAPAC region
IABM Industry Update Breakfast – Broadcast Asia 2017 IABM Copyright 2017 @THEIABMwww.theiabm.org
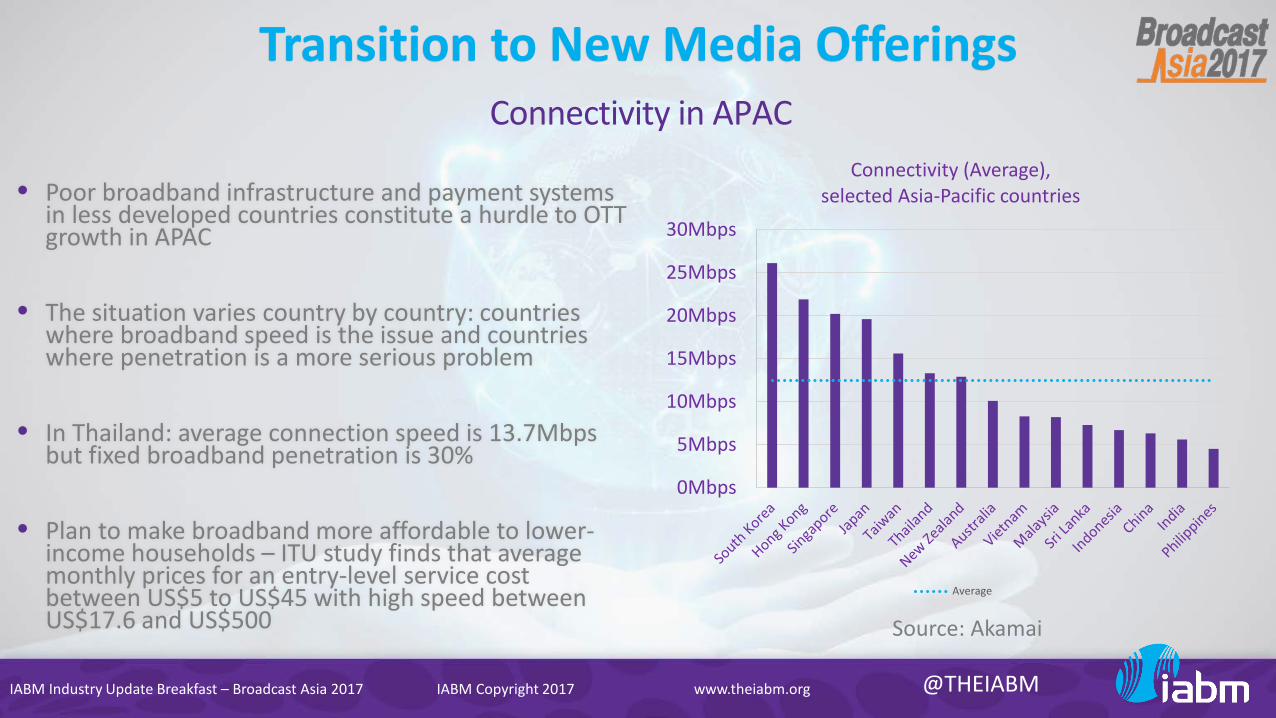
• Poor broadband infrastructure and payment systems in less developed countries constitute a hurdle to OTT growth in APAC
• The situation varies country by country: countries where broadband speed is the issue and countries where penetration is a more serious problem
• In Thailand: average connection speed is 13.7Mbps but fixed broadband penetration is 30%
• Plan to make broadband more affordable to lower-income households – ITU study finds that average monthly prices for an entry-level service cost between US$5 to US$45 with high speed between US$17.6 and US$500
Connectivity in APAC
Transition to New Media Offerings
0Mbps
5Mbps
10Mbps
15Mbps
20Mbps
25Mbps
30Mbps
Connectivity (Average),selected Asia-Pacific countries
Average
Source: Akamai

IABM Industry Update Breakfast – Broadcast Asia 2017 IABM Copyright 2017 @THEIABMwww.theiabm.org
• In most Southeast Asian countries, bank account penetration is very low
• Singapore is the exception – 96% penetration, like Luxembourg
• The majority of people who have a bank account often do not engage with it:
• Indonesia: 36% bank account penetration and 26% debit card ownership. Only 1% and 8.5% of these accounts are engaged in credit card and debit card transactions respectively
• Philippines: 31% bank account penetration and 20.5% debit card ownership. Usage rates are 2% and 3.5% respectively
Financial sector development in Southeast Asia
Transition to New Media Offerings
Source: World Bank
0%
10%
20%
30%
40%
50%
60%
70%
80%
90%
100%
Singapore Malaysia Thailand Indonesia Philippines Vietnam Myanmar Cambodia
Bank account penetration in Southeast Asia
Average
IABM Industry Update Breakfast – Broadcast Asia 2017 IABM Copyright 2017 @THEIABMwww.theiabm.org
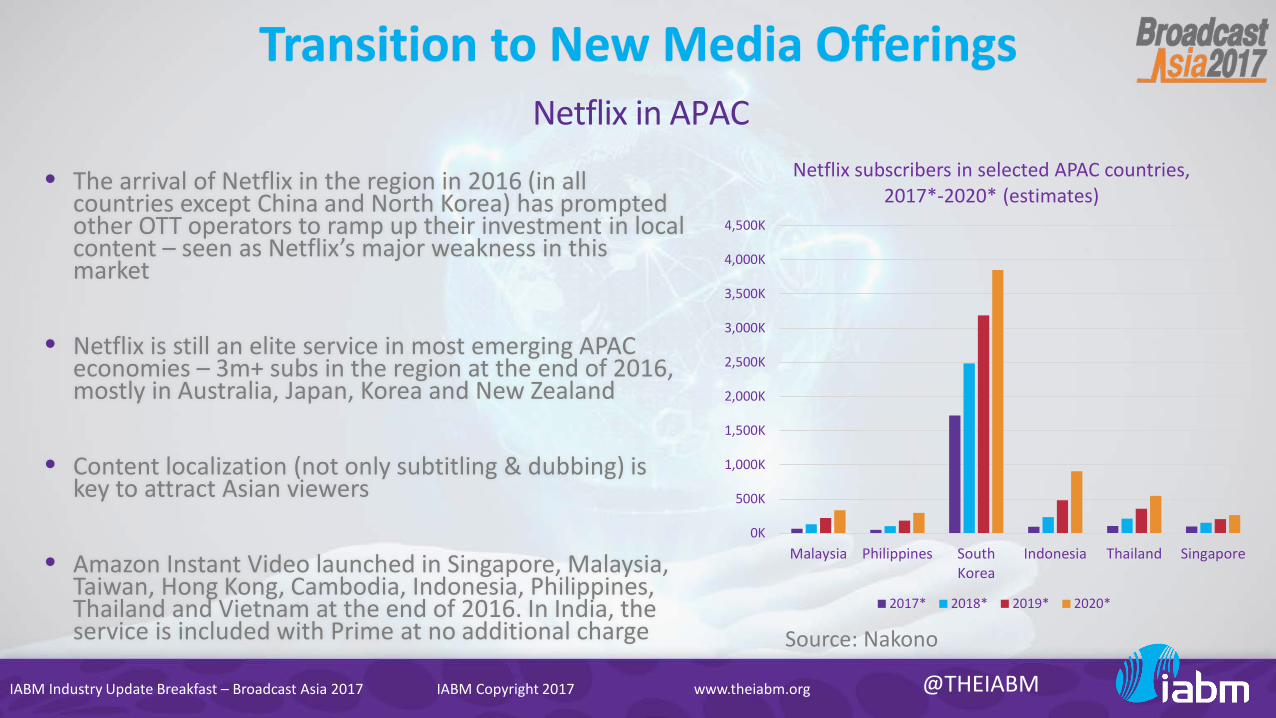
• The arrival of Netflix in the region in 2016 (in all countries except China and North Korea) has prompted other OTT operators to ramp up their investment in local content – seen as Netflix’s major weakness in this market
• Netflix is still an elite service in most emerging APAC economies – 3m+ subs in the region at the end of 2016, mostly in Australia, Japan, Korea and New Zealand
• Content localization (not only subtitling & dubbing) is key to attract Asian viewers
• Amazon Instant Video launched in Singapore, Malaysia, Taiwan, Hong Kong, Cambodia, Indonesia, Philippines, Thailand and Vietnam at the end of 2016. In India, the service is included with Prime at no additional charge
Netflix in APAC
Transition to New Media Offerings
Source: Nakono
0K
500K
1,000K
1,500K
2,000K
2,500K
3,000K
3,500K
4,000K
4,500K
Malaysia Philippines SouthKorea
Indonesia Thailand Singapore
Netflix subscribers in selected APAC countries, 2017*-2020* (estimates)
2017* 2018* 2019* 2020*

IABM Industry Update Breakfast – Broadcast Asia 2017 IABM Copyright 2017 @THEIABMwww.theiabm.org
• Viu: launched by Hong Kong-based media behemoth PCCW in 2015. It boasts over 9m subscribers in over 10 countries and is Netflix’s main competitor in the region. It offers both free and paid subscriptions
• LeEco: is the leader in the Chinese OTT market. It is a technology provider offering integration of its OTT subscription with its smart devices and TVs. LeEco acquired the rights for broadcasting important sports events such as the English Premier League and the World Cup
• Iflix: provides a paid subscription service offering in countries such as Malaysia, Indonesia, The Philippines and Thailand. In 2016, it entered a strategic partnership with the European Pay-TV operator, Sky
• HOOQ: is offered in Indonesia, The Philippines, Thailand and India. It is a video streaming service provider backed by Sony, Warner Bros. and Singaporean telco Singtel
Other New Media offerings
Transition to New Media Offerings
The State of the GlobalBroadcast & Media Industry
Peter White, CEO, IABM
IABM Industry Update Breakfast – Broadcast Asia 2017 IABM Copyright 2017 @THEIABMwww.theiabm.org
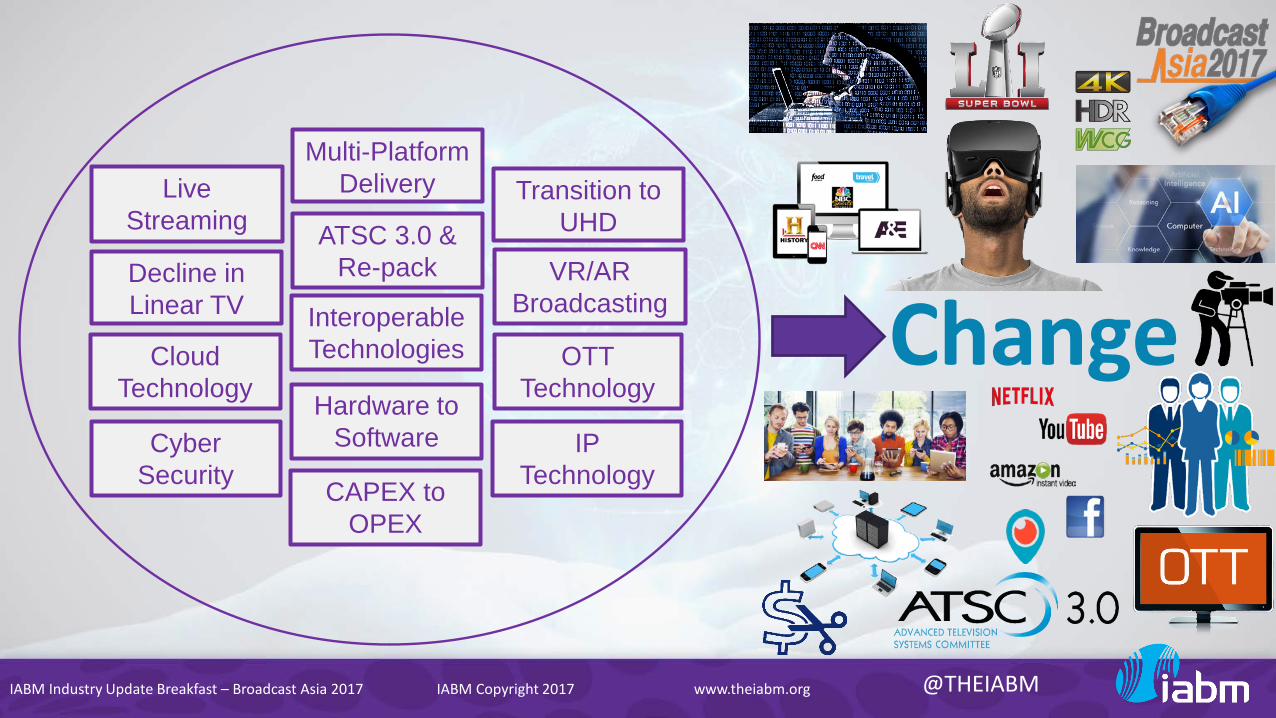
Multi-Platform DeliveryLive
Streaming
VR/ARBroadcasting
Transition toUHDATSC 3.0 &
Re-packDecline in Linear TV
CloudTechnology
CAPEX to OPEX
Hardware to Software
OTT Technology
InteroperableTechnologies Change
IPTechnology
Cyber Security
IABM Industry Update Breakfast – Broadcast Asia 2017 IABM Copyright 2017 @THEIABMwww.theiabm.org
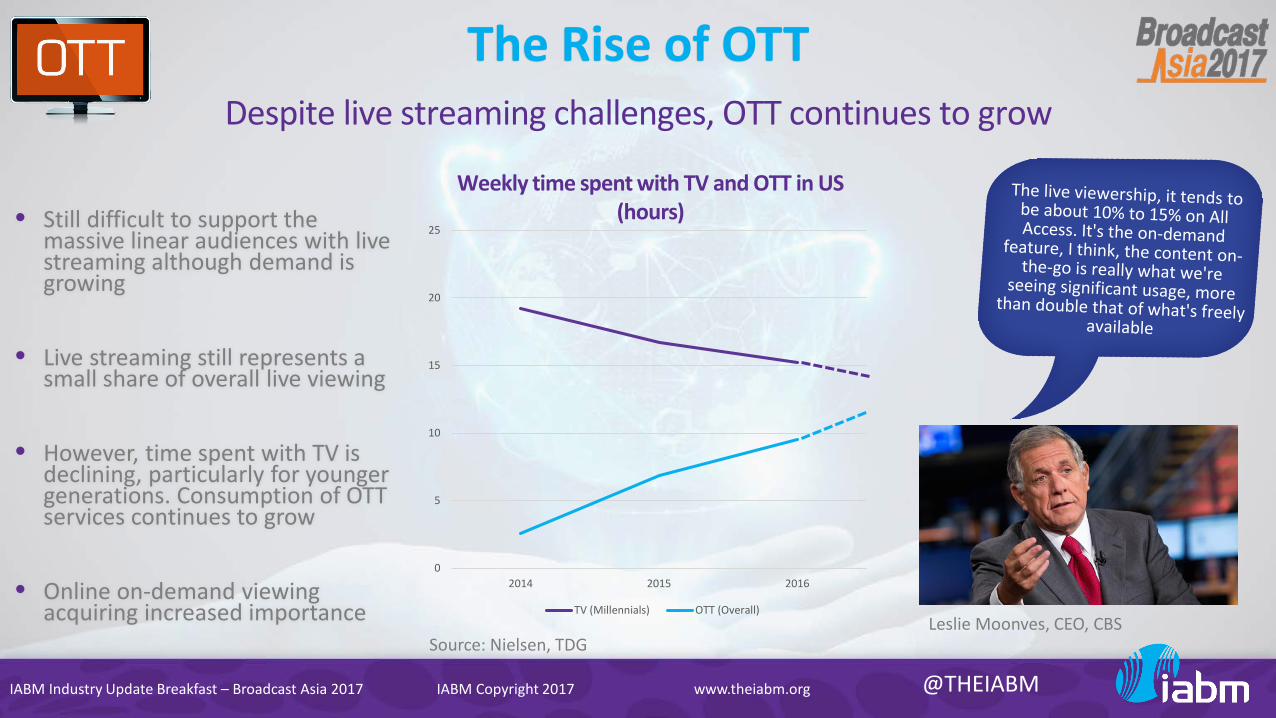
The Rise of OTTDespite live streaming challenges, OTT continues to grow
Weekly time spent with TV and OTT in US (hours)• Still difficult to support the
massive linear audiences with live streaming although demand is growing
• Live streaming still represents a small share of overall live viewing
• However, time spent with TV is declining, particularly for younger generations. Consumption of OTT services continues to grow
• Online on-demand viewing acquiring increased importance
Source: Nielsen, TDG
0
5
10
15
20
25
2014 2015 2016
TV (Millennials) OTT (Overall)Leslie Moonves, CEO, CBS

IABM Industry Update Breakfast – Broadcast Asia 2017 IABM Copyright 2017 @THEIABMwww.theiabm.org
The Rise of OTTTraditional US Broadcast & Media Landscape

IABM Industry Update Breakfast – Broadcast Asia 2017 IABM Copyright 2017 @THEIABMwww.theiabm.org
The Rise of OTTNew US Broadcast & Media Landscape
Traditional
New
Traditional
New
IABM Industry Update Breakfast – Broadcast Asia 2017 IABM Copyright 2017 @THEIABMwww.theiabm.org
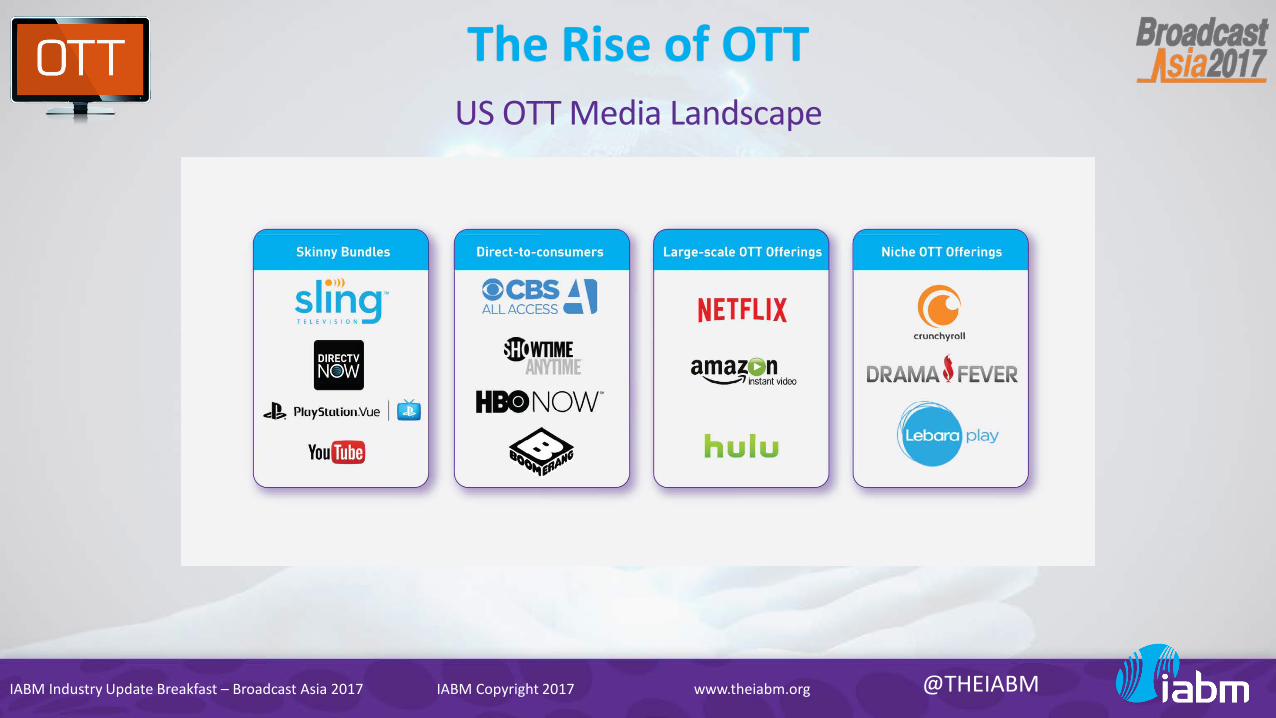
US OTT Media Landscape
The Rise of OTT

IABM Industry Update Breakfast – Broadcast Asia 2017 IABM Copyright 2017 @THEIABMwww.theiabm.org
35%30%
38%
17%
39%
29%
48%
25%29%
9%11%
8%
9%
10%
11%
10%
17% 11%
9% 14% 11%
11%
11%
12%
9%
16% 16%
12%18% 16%
22%
16%19%
16% 22%17%
35% 28% 27% 40% 24% 29% 17% 20% 27%
0%
20%
40%
60%
80%
100%
2013 NAB 2013 IBC 2014 NAB 2014 IBC 2015 NAB 2015 IBC 2016 NAB 2016 IBC 2017 NAB
0-20 21-40 41-60 61-80 81-100
New
Traditional
The Rise of OTTPercentage revenue from traditional broadcast operations versus new activities such as web,
mobile, streaming, multi-platform content delivery?
Source: IABM Pre-NAB Show 2017 End-User Survey
CURR
ENT

IABM Industry Update Breakfast – Broadcast Asia 2017 IABM Copyright 2017 @THEIABMwww.theiabm.org
34%29%
37%
18%
39%
30%
48%
22%26%
7% 14%9%
12%
11%15%
11%
18% 17%
13%
20% 16%
22%
16%18%
15%27%
17%
18%
21% 20%25%
20% 21%15% 22%
25%
27% 16% 17% 24% 14% 16% 11% 11% 15%
0%
20%
40%
60%
80%
100%
2013 NAB 2013 IBC 2014 NAB 2014 IBC 2015 NAB 2015 IBC 2016 NAB 2016 IBC 2017 NAB
0-20 21-40 41-60 61-80 81-100
New
Traditional
The Rise of OTTPercentage revenue from traditional broadcast operations versus new activities such as web,
mobile, streaming, multi-platform content delivery?
IN 2
–3
YEAR
S TI
ME
Source: IABM Pre-NAB Show 2017 End-User Survey
IABM Industry Update Breakfast – Broadcast Asia 2017 IABM Copyright 2017 @THEIABMwww.theiabm.org
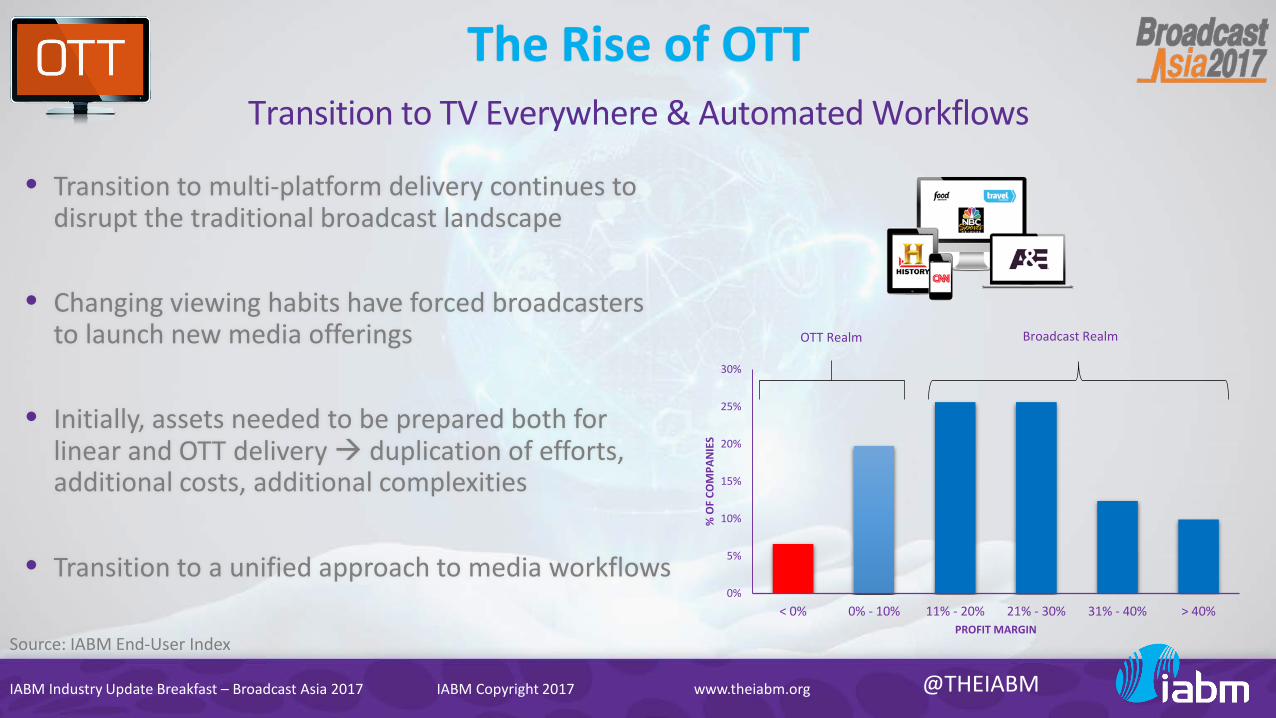
The Rise of OTT
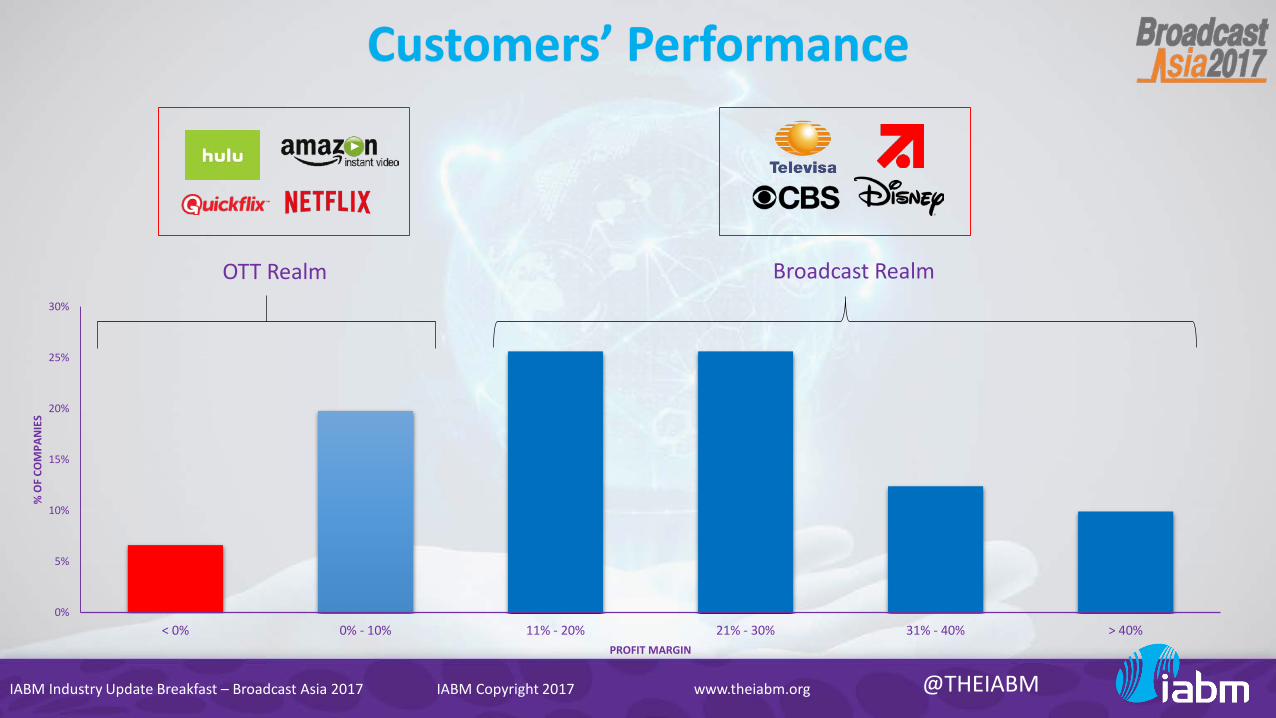
• Transition to multi-platform delivery continues to disrupt the traditional broadcast landscape
• Changing viewing habits have forced broadcasters to launch new media offerings
• Initially, assets needed to be prepared both for linear and OTT delivery duplication of efforts, additional costs, additional complexities
• Transition to a unified approach to media workflows
Transition to TV Everywhere & Automated Workflows
0%
5%
10%
15%
20%
25%
30%
< 0% 0% - 10% 11% - 20% 21% - 30% 31% - 40% > 40%
% O
F CO
MPA
NIE
S
PROFIT MARGIN
OTT Realm Broadcast Realm
Source: IABM End-User Index
IABM Industry Update Breakfast – Broadcast Asia 2017 IABM Copyright 2017 @THEIABMwww.theiabm.org
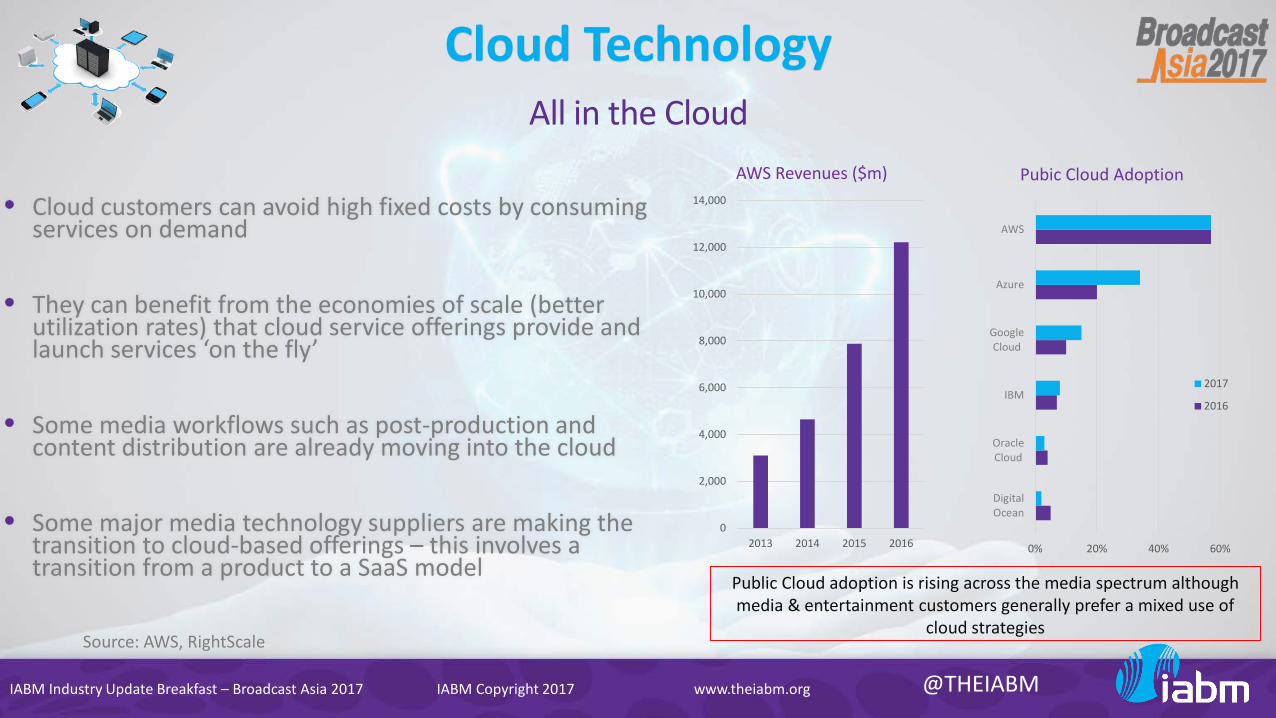
Cloud Technology
• Cloud customers can avoid high fixed costs by consuming services on demand
• They can benefit from the economies of scale (better utilization rates) that cloud service offerings provide and launch services ‘on the fly’
• Some media workflows such as post-production and content distribution are already moving into the cloud
• Some major media technology suppliers are making the transition to cloud-based offerings – this involves a transition from a product to a SaaS model
All in the Cloud
0
2,000
4,000
6,000
8,000
10,000
12,000
14,000
2013 2014 2015 2016
AWS Revenues ($m)
0% 20% 40% 60%
DigitalOcean
OracleCloud
IBM
GoogleCloud
Azure
AWS
Pubic Cloud Adoption
2017
2016
Source: AWS, RightScale
Public Cloud adoption is rising across the media spectrum although media & entertainment customers generally prefer a mixed use of
cloud strategies

IABM Industry Update Breakfast – Broadcast Asia 2017 IABM Copyright 2017 @THEIABMwww.theiabm.org
How likely are you to deploy some sort of cloud-based technology in the next 2-3 years?
What is the preferred deployment strategy for the adoption of cloud-based technology in your organisation?
4%
18%
19%
24%
35%
0% 10% 20% 30% 40% 50%
Other
Private Cloud (On-Premise)
Public Cloud
Private Cloud (Off-Premise)
Hybrid Cloud28%
0%
5%
10%
15%
20%
25%
30%
35%
Not at all likely Unlikely Somewhatlikely
Very likely We arealready doing
it today
15% 85%
Cloud Technology
IABM Industry Update Breakfast – Broadcast Asia 2017 IABM Copyright 2017 @THEIABMwww.theiabm.org
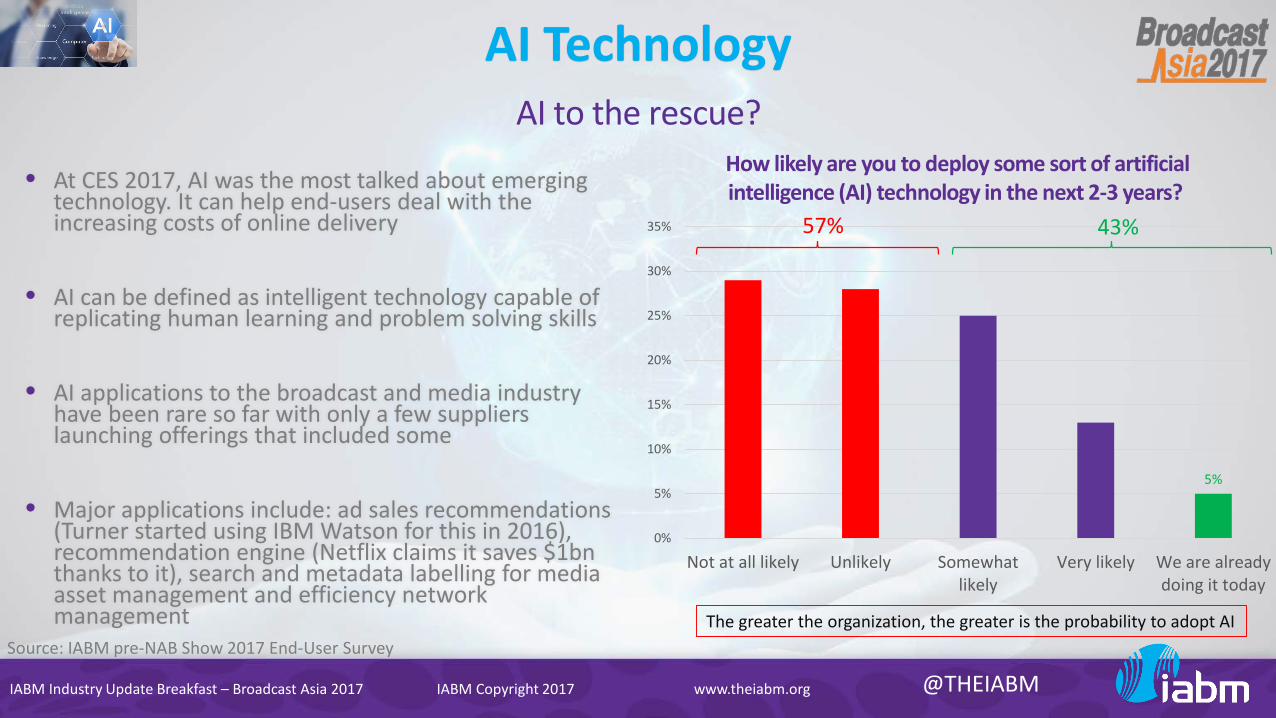
AI Technology
• At CES 2017, AI was the most talked about emerging technology. It can help end-users deal with the increasing costs of online delivery
• AI can be defined as intelligent technology capable of replicating human learning and problem solving skills
• AI applications to the broadcast and media industry have been rare so far with only a few suppliers launching offerings that included some
• Major applications include: ad sales recommendations (Turner started using IBM Watson for this in 2016), recommendation engine (Netflix claims it saves $1bn thanks to it), search and metadata labelling for media asset management and efficiency network management
AI to the rescue?How likely are you to deploy some sort of artificial intelligence (AI) technology in the next 2-3 years?
5%
0%
5%
10%
15%
20%
25%
30%
35%
Not at all likely Unlikely Somewhatlikely
Very likely We are alreadydoing it today
57% 43%
The greater the organization, the greater is the probability to adopt AISource: IABM pre-NAB Show 2017 End-User Survey

IABM Industry Update Breakfast – Broadcast Asia 2017 IABM Copyright 2017 @THEIABMwww.theiabm.org
Cyber Security CheckHackers continue to threaten media companies
40%
34%
16%
6%4%
Very high
Quite high
Quite low
Very low
Don't know
How high or low a priority is Cyber Security in your organization’s technology strategy?
IP-Networking, Cloud & Data Explosion create new vulnerabilities
Source: IABM pre-NAB Show 2017 End-User Survey
Has your organization experienced any Cyber Attacks in the last three years?
0%
10%
20%
30%
40%
50%
60%
70%
80%
90%
From 1 to 50 from 51 to 500 from 500 to 10000 Over 10000Number of Employees
No
Yes
“The default assumption is that everything is vulnerable”Robert Watson, Computer Scientist, University of Cambridge

IABM Industry Update Breakfast – Broadcast Asia 2017 IABM Copyright 2017 @THEIABMwww.theiabm.org
Customers’ PerformanceBroadcast Revenue Sources
Source: IABM pre-NAB Show 2017 End-User Survey
53%
19%
28%
License Fee/Gov. Funding
30%
35%
35%
47%
37%
7%9%
SubscriptionsAdvertising
Increase Stay the SameDecline
Increase Stay the SameDecline Don’t Know
Increase Stay the SameDecline

IABM Industry Update Breakfast – Broadcast Asia 2017 IABM Copyright 2017 @THEIABMwww.theiabm.org
Customers’ PerformanceTraditional Broadcast & Media Technology Buyers
Next-Generation Broadcast & Media Technology Buyers
Other Broadcast & Media Technology Buyers
Demand
Workflow / Asset Management
Video Editing Tools
Routing & Networking Products
Production Switchers
Test & Measurement Tools
Playout Automation Products
Ingest / Transcoding / Streaming Products
Transmitters
Audio Mixers & Consoles
System cameras (Studio / Location)
Integrated Playout (Channel-in-a-Box)
Near-Line / Off-Line Storage Products
Service Providers
Demand Demand
Product Vendors
Production / Post-Production Outside Broadcast Transmission Services Equipment Rental OTT/OVP Platforms Content Delivery Networks
Med
ia O
rgan
izatio
nsNo
n-M
edia
O
rgan
izatio
ns
Focus

IABM Industry Update Breakfast – Broadcast Asia 2017 IABM Copyright 2017 @THEIABMwww.theiabm.org
Customers’ Performance
Media Networks Pay-TV Operators
75% 25%
10%
-9%
8% 9%
-15%
-10%
-5%
0%
5%
10%
15%
Revenue Change Profit Change Revenue Change Profit Change
Media Networks Pay-TV Operators
9%
-7%
-15%
-10%
-5%
0%
5%
10%
15%
Revenue Change Profit Change
Overall Industry
% o
f Tot
al
Indu
stry
Rev
enue
s
Source: IABM End-User Index
93%
7%
Profit-Making
Loss-Making
% o
f Tot
al
Indu
stry
Rev
enue
s
47 countries covered
187 companies included in the sample

IABM Industry Update Breakfast – Broadcast Asia 2017 IABM Copyright 2017 @THEIABMwww.theiabm.org
Customers’ Performance
5%
1%
11%
-10%
5%3%
-15%
-10%
-5%
0%
5%
10%
15%
Revenue Change Profit Change Revenue Change Profit Change Revenue Change Profit Change
EMEA Americas Asia-Pacific
% o
f Tot
al
Indu
stry
Rev
enue
s
IABM Industry Update Breakfast – Broadcast Asia 2017 IABM Copyright 2017 @THEIABMwww.theiabm.org
Customers’ Performance
0%
5%
10%
15%
20%
25%
30%
< 0% 0% - 10% 11% - 20% 21% - 30% 31% - 40% > 40%
% O
F CO
MPA
NIE
S
PROFIT MARGIN
OTT Realm Broadcast Realm

IABM Industry Update Breakfast – Broadcast Asia 2017 IABM Copyright 2017 @THEIABMwww.theiabm.org
Suppliers’ PerformanceYear on Year Sales Growth, last 24 months up to March 2017
-15%
-10%
-5%
0%
5%
10%
15% Global 3 mth mov avg. Large 3 mth mov avg. SME 3 mth mov avg.
13.5%
Source: IABM Industry Index – March 2017

IABM Industry Update Breakfast – Broadcast Asia 2017 IABM Copyright 2017 @THEIABMwww.theiabm.org
Suppliers’ PerformanceProfit Statistics: Profit Growth (left) & % of Companies in Profit and Loss (right)
-25%
-15%
-5%
5%
15%
25%
Apr-
15
May
-15
Jun-
15
Jul-1
5
Aug-
15
Sep-
15
Oct
-15
Nov
-15
Dec-
15
Jan-
16
Feb-
16
Mar
-16
Apr-
16
May
-16
Jun-
16
Jul-1
6
Aug-
16
Sep-
16
Oct
-16
Nov
-16
Dec-
16
Jan-
17
Feb-
17
Mar
-17
Global 3 month mov avg.
Source: IABM Industry Index – March 2017
34.5%
65.5%
Profit Making Loss Making
Nov-16 Mar-17 Trend
In profit both years 53.4% 53.8% ↑
Moving from loss to profit 11.7% 11.7% =
In loss both years 24.3% 22.8% ↓
Moving from profit to loss 10.7% 11.7% ↑

Copyright @ 2013-2017 IABM DC
Total Market Size by Region
$b
$10b
$20b
$30b
$40b
$50b
$60b
2009 2010 2011 2012 2013 2014 2015 2016 2017 2018 2019 2020
Americas EMEA Asia Pacific
Asia Pacific19%
EMEA43%
Americas38%
$50.1 billion
Helicopter view of the Broadcast & Media Technology Industry
IABM Industry Update Breakfast – Broadcast Asia 2017
Copyright @ 2013-2017 IABM DC
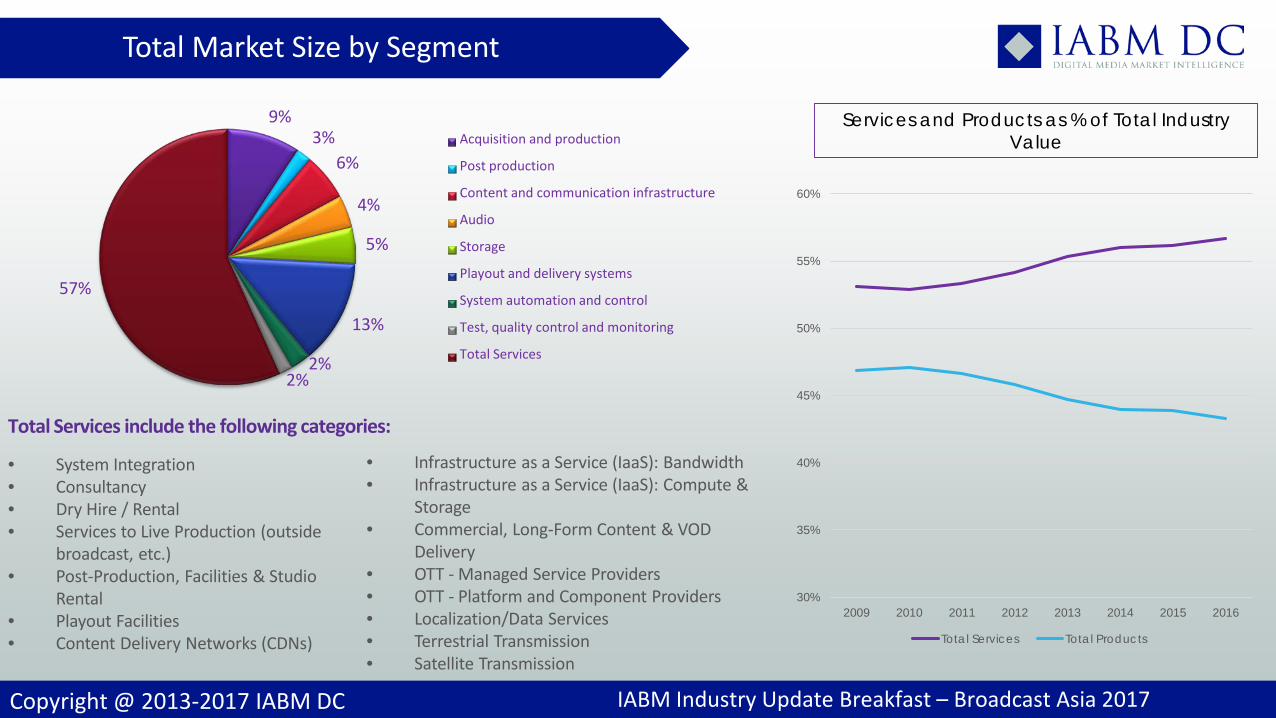
9%3%
6%
4%
5%
13%
2%2%
57%
Acquisition and production
Post production
Content and communication infrastructure
Audio
Storage
Playout and delivery systems
System automation and control
Test, quality control and monitoring
Total Services
Total Market Size by Segment
IABM Industry Update Breakfast – Broadcast Asia 2017
30%
35%
40%
45%
50%
55%
60%
2009 2010 2011 2012 2013 2014 2015 2016
Total Services Total Products
• System Integration• Consultancy• Dry Hire / Rental• Services to Live Production (outside
broadcast, etc.)• Post-Production, Facilities & Studio
Rental• Playout Facilities• Content Delivery Networks (CDNs)
Total Services include the following categories:
• Infrastructure as a Service (IaaS): Bandwidth• Infrastructure as a Service (IaaS): Compute &
Storage• Commercial, Long-Form Content & VOD
Delivery• OTT - Managed Service Providers• OTT - Platform and Component Providers• Localization/Data Services• Terrestrial Transmission• Satellite Transmission
Services and Products as % of Total Industry Value
Copyright @ 2013-2017 IABM DC
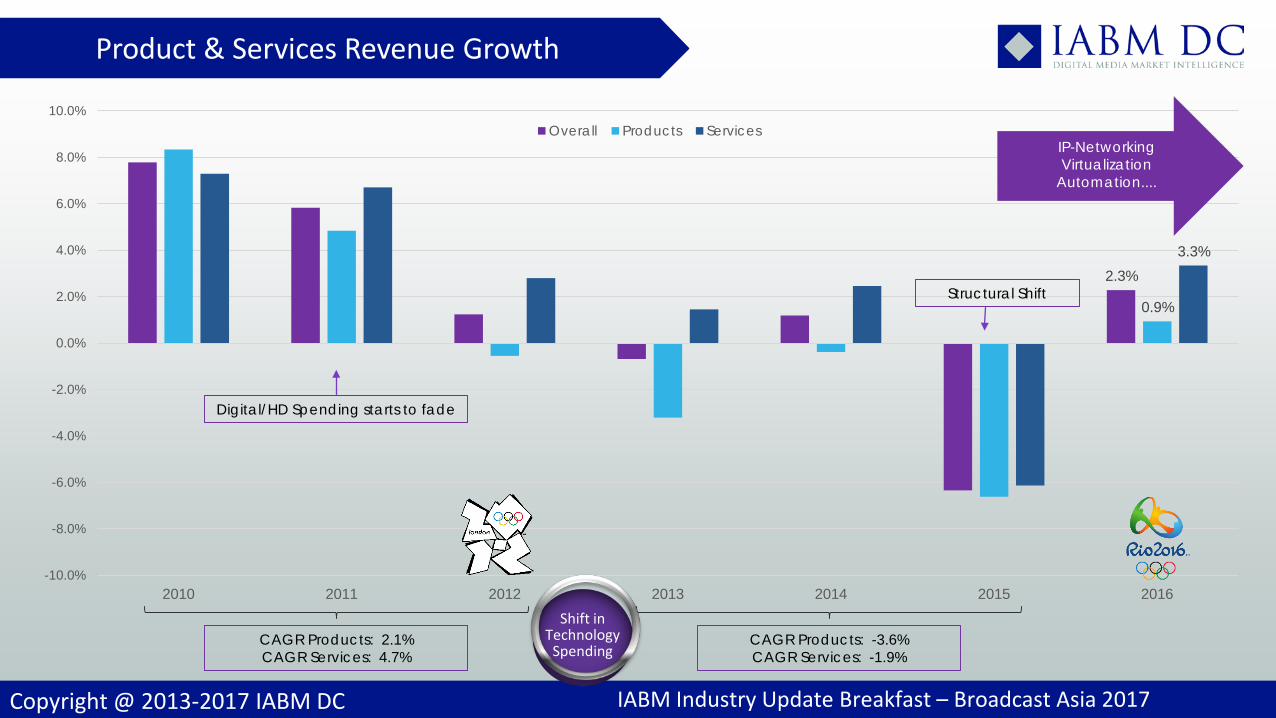
Product & Services Revenue Growth
2.3%
0.9%
3.3%
-10.0%
-8.0%
-6.0%
-4.0%
-2.0%
0.0%
2.0%
4.0%
6.0%
8.0%
10.0%
2010 2011 2012 2013 2014 2015 2016
Overall Products Services
Digital/HD Spending starts to fade
Structural Shift
CAGR Products: 2.1%CAGR Services: 4.7%
CAGR Products: -3.6%CAGR Services: -1.9%
IP-NetworkingVirtualization
Automation....
Shift inTechnology
Spending
IABM Industry Update Breakfast – Broadcast Asia 2017

IABM Industry Update Breakfast – Broadcast Asia 2017 IABM Copyright 2017 @THEIABMwww.theiabm.org
Suppliers’ View2 Important Transitions
• Broadcast and media technology users have traditionally relied on a CAPEX model with product upgrade cycles of up to 10 years
• The take-up of cloud computing in media & entertainment is favoring the transition to an OPEX model where costs flexibly vary on the basis of user demand
• Subscriptions guarantee steadier cash flows (and shorter product cycles) but suppliers are used to finance their high R&D expenditures with large money influxes (typical of licencefee/hardware model)
• Many traditional broadcast and media technology suppliers still rely on hardware as their primary source of revenues
• With end-users moving to software-defined infrastructures built on COTS equipment, bespoke hardware revenues are under pressure
• Traditional suppliers are therefore embarking on a difficult transition from purpose-built hardware to delivering software running on general-purpose equipment
From Hardware to Software From CAPEX to OPEX

IABM Industry Update Breakfast – Broadcast Asia 2017 IABM Copyright 2017 @THEIABMwww.theiabm.org
State of 4K/UHD Adoption4K/UHD Adoption – A Timeline
What is the most likely timeline for the launch of UHD offerings in your organization?
55%
10%
35%
0%
5%
10%
15%
20%
25%
30%
35%
40%
Alreadylaunched
1 to 3 years 4 to 6 years 7 to 10 years No plan tolaunch
Only 22% plan to launch UHD offerings in the next 3 years
IABM Industry Update Breakfast – Broadcast Asia 2017 IABM Copyright 2017 @THEIABMwww.theiabm.org
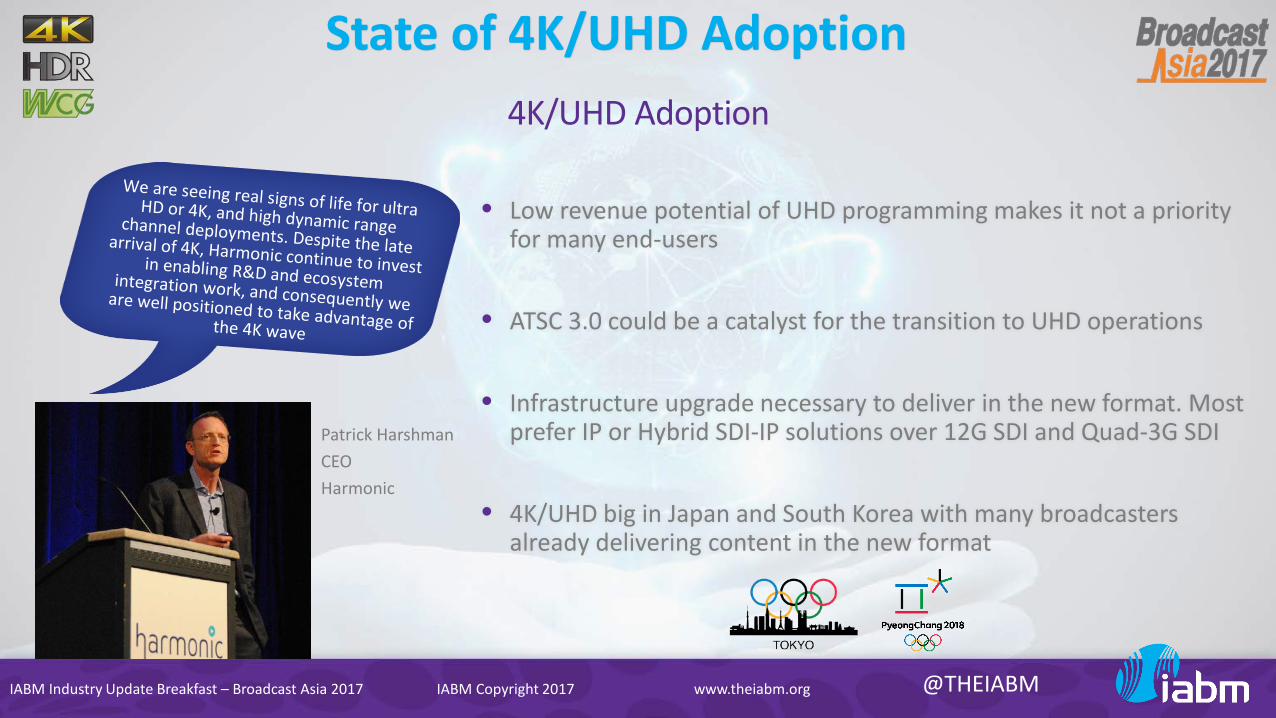
State of 4K/UHD Adoption
• Low revenue potential of UHD programming makes it not a priority for many end-users
• ATSC 3.0 could be a catalyst for the transition to UHD operations
• Infrastructure upgrade necessary to deliver in the new format. Most prefer IP or Hybrid SDI-IP solutions over 12G SDI and Quad-3G SDI
• 4K/UHD big in Japan and South Korea with many broadcasters already delivering content in the new format
4K/UHD Adoption
Patrick HarshmanCEOHarmonic
IABM Industry Update Breakfast – Broadcast Asia 2017 IABM Copyright 2017 @THEIABMwww.theiabm.org
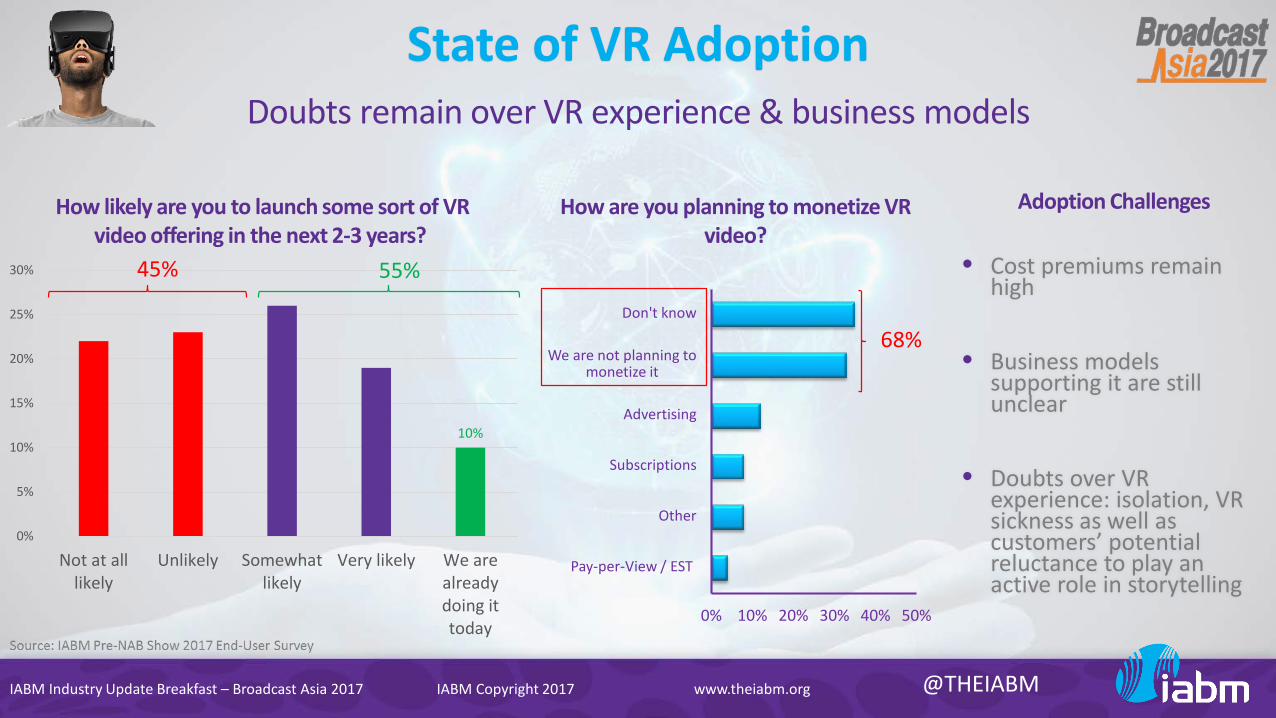
State of VR AdoptionDoubts remain over VR experience & business models
How are you planning to monetize VR video?
0% 10% 20% 30% 40% 50%
Pay-per-View / EST
Other
Subscriptions
Advertising
We are not planning to monetize it
Don't know
68%
How likely are you to launch some sort of VR video offering in the next 2-3 years?
10%
0%
5%
10%
15%
20%
25%
30%
Not at alllikely
Unlikely Somewhatlikely
Very likely We arealreadydoing ittoday
45% 55% • Cost premiums remain high
• Business models supporting it are still unclear
• Doubts over VR experience: isolation, VR sickness as well as customers’ potential reluctance to play an active role in storytelling
Adoption Challenges

IABM Industry Update Breakfast – Broadcast Asia 2017 IABM Copyright 2017 @THEIABMwww.theiabm.org
Transition to IPTransition to IP Infrastructures
John StroupCEOBelden
Source: IABM pre-NAB Show 2017 End-User Survey
0% 5% 10% 15%
Transmitters
Production switchers
Camera lenses
Routing & networking products (IP)
Ingest / transcoding / streamingproducts
System cameras (studio / location)
Camera support & accessories
Camcorders
Workflow / asset managementsolutions
Video editing tools
0% 5% 10% 15%
Playout automation products
Library & storage managementproducts
Audio mixers & consoles
System cameras (studio / location)
Playout / transmission servers
Routing & networking products(baseband & hybrid)
Newsroom systems
Camera support & accessories
Workflow / asset managementsolutions
Routing & networking products (IP)
All Respondents Large Broadcasters
Of the products / solutions that you plan to purchase over the next 12 months, which is the most important priority? (Top 10)

IABM Industry Update Breakfast – Broadcast Asia 2017 IABM Copyright 2017 @THEIABMwww.theiabm.org
The Importance of InteroperabilityCustomer preferences & Interoperability
Source: IABM pre-NAB Show 2017 End-User Survey
0% 10% 20% 30% 40% 50% 60% 70% 80% 90% 100%
One stop shop "end to end" solution provider
Multiple suppliers for custom 'best of breed'
NAB 2017
IBC 2016
Customers still prefer ‘best-of-breed’ solutions
2%3%
Not at all important
Not Important
39%36%20%
Moderately Important Important Very
Important
Therefore, interoperability is important for most of them
Never, ever want to be locked in to one vendor
IABM Industry Update Breakfast – Broadcast Asia 2017 IABM Copyright 2017 @THEIABMwww.theiabm.org
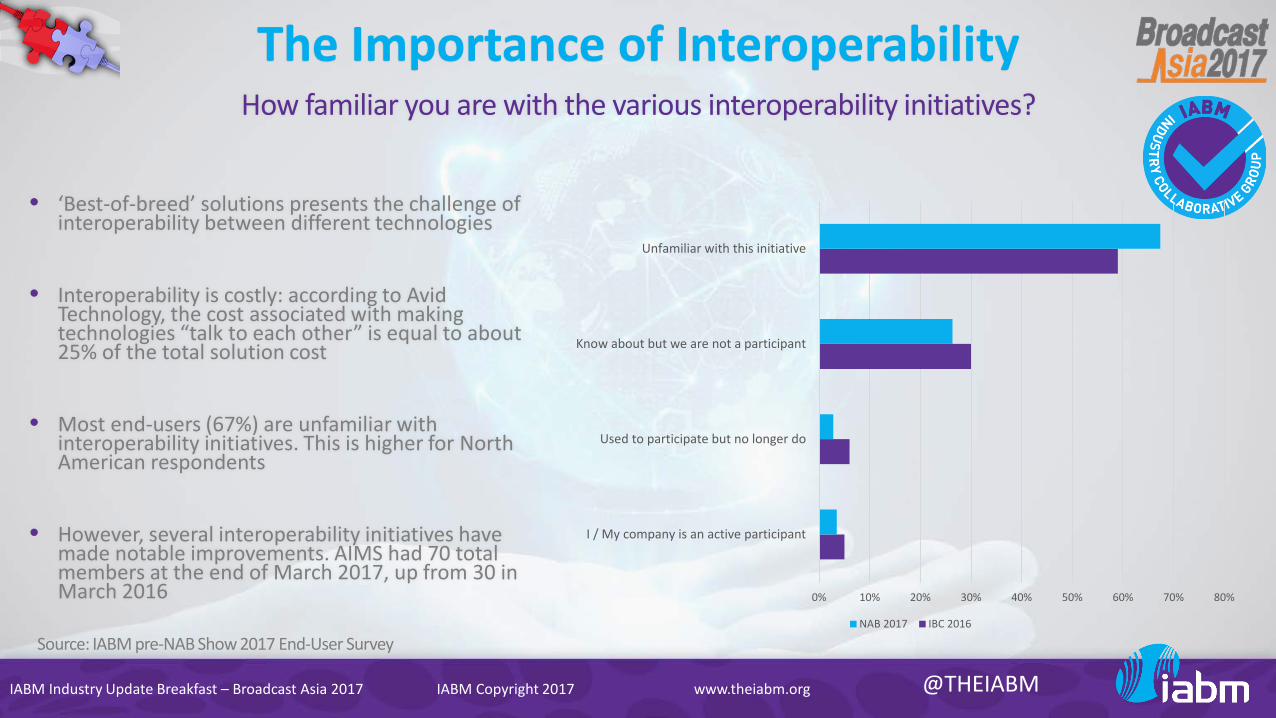
The Importance of InteroperabilityHow familiar you are with the various interoperability initiatives?
Source: IABM pre-NAB Show 2017 End-User Survey
• ‘Best-of-breed’ solutions presents the challenge of interoperability between different technologies
• Interoperability is costly: according to Avid Technology, the cost associated with making technologies “talk to each other” is equal to about 25% of the total solution cost
• Most end-users (67%) are unfamiliar with interoperability initiatives. This is higher for North American respondents
• However, several interoperability initiatives have made notable improvements. AIMS had 70 total members at the end of March 2017, up from 30 in March 2016 0% 10% 20% 30% 40% 50% 60% 70% 80%
I / My company is an active participant
Used to participate but no longer do
Know about but we are not a participant
Unfamiliar with this initiative
NAB 2017 IBC 2016
IABM Industry Update Breakfast – Broadcast Asia 2017 IABM Copyright 2017 @THEIABMwww.theiabm.org
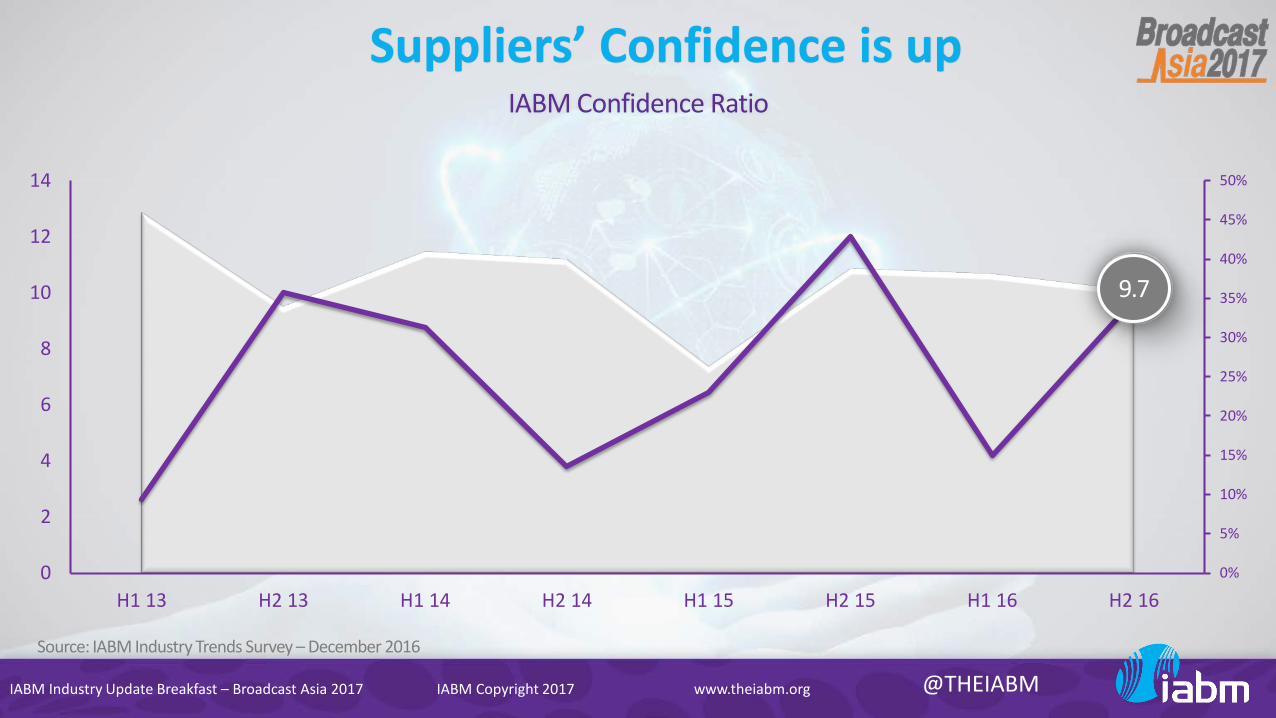
Suppliers’ Confidence is upIABM Confidence Ratio
Source: IABM Industry Trends Survey – December 2016
0%
5%
10%
15%
20%
25%
30%
35%
40%
45%
50%
0
2
4
6
8
10
12
14
H1 13 H2 13 H1 14 H2 14 H1 15 H2 15 H1 16 H2 16
9.7

IABM Industry Update Breakfast – Broadcast Asia 2017 IABM Copyright 2017 @THEIABMwww.theiabm.org
But Customers remain more confidentOutlook for the business environment, Suppliers and End-Users
Source: IABM pre-NAB Show 2017 End-User Survey, IABM Industry Trends Survey – December 2016
15%
46%
33% 6%
Suppliers
25%
48%
22%4%
End-Users
Very Positive
Quite Positive
Neutral
Quite Negative
Very Negative

The State of the GlobalBroadcast & Media Industry
Peter White, CEO, IABM
IABM Industry UpdatePeter White, CEO, IABM
Peter Bruce, APAC Director, IABM


