
SANDIA REPORTSAND88-0196 • UC~721
Unlimited ReleasePrinted August 1991
, Hydrogeochemical Studies of thei Rustler Formation and Related Rocks
in the Waste Isolation Pilot Plant Area,Southeastern New Mexico
M. D. Siegel, S. J. Lambert, K. L. Robinson, Editors
Prepared bySandia National LaboratoriesAlbuquerque, New Mexico 87185 and Livermore, California 94550for the United States Department of Energyunder Contract DE-AC04-76DP00789

Issued by Sandia National Laboratories, operated for the United StatesDepartment of Energy by Sandia Corporation.NOTICE: This report was prepared as an account of work sponsored by anagency of the United States Government. Neither the United States Government nor any agency thereof, nor any of their employees, nor any of theircontractors, subcontractors, or their employees, makes any warranty, expressor implied, or assumes any legal liability or responsibility for the accuracy,completeness, or usefulness of any information, apparatus, product, orprocess disclosed, or represents that its use would not infringe privatelyowned rights. Reference herein to any specific commercial product, process, orservice by trade name, trademark, manufacturer, or otherwise, does notnecessarily constitute or imply its endorsement, recommendation, or favoringby the United States Government, any agency thereof or any of theircontractors or subcontractors. The views and opinions expressed herein donot necessarily state or reflect those of the United States Government, anyagency thereof or any of their contractors.
Printed in the United States of America. This report has been reproduceddirectly from the best available copy.
Available to DOE and DOE contractors fromOffice of Scientific and Technical InformationPO Box 62Oak Ridge. TN 37831
Prices available from (615) 576-8401, FTS 626-8401
Available to the public fromNational Technical Information ServiceUS Department of Commerce5285 Port Royal RdSpringfield, VA 22161
NTIS price codesPrinted copy: A99Microfiche copy: A01

SAND88-0196Unlimited ReleasePrinted August 1991
DistributionCategory UC-721
Hydrogeochemical Studies of theRustler Formation and Related Rocksin the Waste Isolation Pilot Plant Area,
Southeastern New Mexico
M. D. Siegel, S. J. Lambert, and K. L. Robinson, EditorsSandia National Laboratories
Albuquerque, New Mexico 87185
ABSTRACT
Chemical, mineralogical, isotopic, and hydrological studies of the Culebra dolomite
member of the Rustler Formation and related rocks are used to delineate hydrochemical
facies and form the basis for a conceptual model for post-Pleistocene groundwater
flow and chemical evolution. Modern flow within the Culebra in the Waste Isolation
Pilot Plant (WIPP) area appears to be largely north-to-south; however, these flow
directions under confined conditions are not consistent with the salinity distribu
tion in the region surrounding the WIPP Site. Isotopic, mineralogical, and hydro
logical data suggest that vertical recharge to the Culebra in the WIPP area and to
the immediate east and south has not occurred for several thousand years. Eastward-. . 234U/238U ... h f f Pl'IncreasIng actIVIty ratlos suggest rec arge rom a near-sur ace elstocene
infiltration zone flowing from the west-northwest and imply a change in flow
direction in the last 30,000 to 12,000 years.

Culebra groundwaters are in chemical equilibrium with gypsum and are undersaturated
with halite and anhydrite. A partial-equilibrium model for the chemical evolution of
the groundwater suggests that Na, Cl, Mg, K, and SO4 are added to the Culebra by
dissolution of evaporite salts in adjacent strata. Equilibrium is maintained with
gypsum and calcite, but dolomite supersaturation Increases as the salinity of the
water increases. Stable-isotope compositions of carbonates are consistent with this
model and indicate that no recrystallization of dolomite in equilibrium with the
groundwater has occurred. Major and minor element correlations are consistent with
several plausible mechanisms of water/rock interaction, including sorption of lithium
and boron by clays and dissolution of Mg-rich clays.
11

ACKNOWLEDGMENTS
In addition to the authors of component chapters of this report, the editors thank
several individuals whose valuable discussions and critical reviews have improved
this report, specifically R. L. Beauheim, D. G. Brookins, W. H. Casey, P. B. Davies,
B. F. Jones, J. L. Krumhansl, A. R. Lappin, and L. N. Plummer. D. G. Brookins and W.
H. Casey provided detailed reviews of most chapters. J. L. Krumhansl provided an
additional review of the chapter on mineralogy. A. R. Lappin provided text and
figures summarizing the physical hydrology.
I. J. Hall assisted with the principal component analysis. S. E. Bayley helped with
the reduction of the data from that analysis and preparation of several of the
figures. P. James and M. Adams prepared the element ratio and factor score contour
plots. L. N. Plummer allowed us to use an unreleased version of the PHRQPITZ code
used in the saturation index calculations and provided some instruction in its use.
S. Anderholm assisted in the reaction path calculations using PHRQPITZ. T. Johnson
helped to coordinate preparation of the final figures. Suggestions by B. F. Jones,
L. N. Plummer, D. G. Brookins, and W. H. Casey led to extensive revisions, which
greatly improved this report.
III

GENERAL CONTENTS
Executive Summary ES-l
Chapter 1: Summary of Hydrogeochemical Constraints on GroundwaterFlow and Evolution in the Rustler Formation (M. D. Siegeland S. J. Lambert) 1-1
Chapter 2: Solute Relationships in Groundwaters from the CulebraDolomite and Related Rocks in the Waste Isolation PilotPlant Area, Southeastern New Mexico (M. D. Siegel,K. L. Robinson, and J. Myers) 2-1
Appendix 2A: Minerals Included in Saturation IndexCalculations with PHRQPITZ 2A-l
Appendix 2B: Use of Principal Component Analysis in Analysisof Hydrochemical Data: General Principles 2B-l
Appendix 2C: Varimax R-mode Principal Component Analysisof Culebra Waters: Supplemental Results 2C-l
Appendix 2D: Supplemental Analysis of SoluteRelationships in Selected Waters from theCulebra and Magenta Dolomites, Rustler/Salado Contact Zone, Dewey Lake Red Beds,and Bell Canyon Formation 2D-l
Chapter 3: Mineralogy of the Culebra Dolomite (T. Sewards, M. L.Williams, K. Keil, S. J. Lambert, and C. L. Stein) 3-1
Chapter 4: Normative Analysis of Groundwaters from the RustlerFormation Associated with the Waste Isolation PilotPlant, Southeastern New Mexico (M. W. Bodine, Jr.,B. F. Jones, and S. J. Lambert) 4-1
Chapter 5: Isotopic Constraints on the Rustler and Dewey LakeGroundwater Systems (S. J. Lambert) 5-1
Chapter 6: The Redox State and the Occurrence and Influence ofOrganics in the Culebra (J. Myers, P. Drez, and P. James) 6-1
Appendix 6A: A Preliminary Evaluation of Redox Datafor Culebra Groundwaters (K. L. Robinson) 6A-l
IV

EXECUTIVE SUMMARY
An understanding of the geological history of the Rustler Formation in the northern
Delaware Basin of southeastern New Mexico is considered fundamental to the evaluation
of the ability of the bedded evaporite environment at the Waste Isolation Pilot Plant
(WIPP) to isolate waste radionuclides from the accessible environment for long
periods of time. The Rustler is deemed important because it (1) is the uppermost
evaporite-bearing unit in the Ochoan (Permian) sequence, (2) is experiencing active
dissolution where it outcrops west of the WIPP Site, (3) immediately overlies the
Salado Formation, where the WIPP Facility is being mined, and (4) contains interbeds
of brittle fractured rock that contain the most abundant and regionally persistent
occurrences of groundwater associated with the evaporites.
The US Department of Energy agreed to carry out several supplementary geotechnical
studies as part of the WIPP Site characterization program. This report has been
prepared to satisfy part of that agreement, as specified in Appendix II to the
November 1984 Modification to the Working Agreement.
An extensive geochemical data base, including analyses of major and minor solutes,
redox data, mineralogical studies of intact core samples, and isotopic studies of
waters, carbonates, and sulfates, has been assembled for the Rustler Formation and
adjacent units in the northern Delaware Basin. These data were evaluated to compare
the aqueous geochemistry with host rock mineralogies, to delineate hydrochemical
facies in the Culebra member of the Rustler Formation, and to determine the consis
tency of these facies with groundwater flow patterns derived from site stratigraphy
and hydrology. The resulting synthesis of data and current hypotheses concerning the
origin, composition, and history of waters in the Culebra member of the Rustler
Formation and related units provides a tentative conceptual model for groundwater
flow in the Rustler during the last 12,000 to 16,000 years. This model can form part
of the basis for assessing the long-term performance of the geological containment
ES-l

system at the WIPP, which IS developed III the underlying evaporites of the Salado
Formation.
Based on the available hydrological data, modern flow within the Culebra at and near
the WIPP Site is interpreted to be largely north-to-south, except in relatively low
transmissivity areas directly affected by either a high-transmissivity zone in the
southeastern portion of the WIPP Site or by Nash Draw west of the WIPP Site. The
amount of modern vertical flow into and out of the Culebra near site-center remains
indeterminate; however, with the exception of the region in and near Nash Draw, this
flow may be negligible, making the assumption of confined flow within the Culebra
adequate for modeling purposes on some limited time scale. Specifically, it is
assumed that the steady-state confined flow is adequate on the time scale of hydro
logical testing and disturbances due to the sinking of the WIPP shafts, probably 100
years or less. This does not preclude a limited amount of localized downward flow
through the Tamarisk member from the Magenta to the Culebra over longer time periods,
as facilitated by higher potentiometric levels in the Magenta Ihan in the Culebra.
The measurement of modern head potentials, transmissivities, and/or fluid densities,
however, does not give any direct indication of time scales on which the system might
be transient. The geochemical and isotopic data suggest that inferences about flow
direction and velocity based on present hydrologic conditions and modeling alone may
not be uniformly applicable to directions and velocities during the past 10,000
years. In particular, present-day steady-state (north-to-south) regional water flow
directions under confined conditions are not consistent with the salinity distribu
tion at the WIPP Site, if the salinity distribution itself is assumed to be at steady
state (i.e., fixed in place). For example, a hydrochemical facies having low
salinity, with element ratios inconsistent with ongoing halite dissolution, lies
downgradient along the modern flow directions from more saline water to the north.
ES-2

Arguments that the observed solute distribution is generally consistent with the
current hydrological flow field must rely heavily on the assumption of extensive
vertical recharge and on the resultant subsurface mixing of at least two solute
assemblages, especially in the southern part of the site. This would be required to
provide fresher fluids to dilute the saline brines entering from the less permeable,
halite-rich strata east of the sixteen-square-mile area delineating the WIPP.
Isotopic data, however, indicate that vertical recharge to the Culebra in the WIPP
area and to the east and south has not occurred for several thousand years.
Specifically, the three available radiocarbon dates in the Culebra are in excess of
12,000 to 16,000 years in both northern and southern portions of the study area, with
no apparent regionally consistent or statistically significant age gradient.
Mineralogical and isotopic studies of sulfates in overlying layers also show that .no
significant amounts of either solutes or water have permeated vertically downward
from the surface to recharge the Culebra. Specifically, much of the anhydrite in the
Tamarisk member between the Magenta and Culebra members has not been hydrated to
gypsum by recrystallization in the presence of fresh water, D/H ratios in gypsum
throughout the Rustler are not consistent with a pervasively large water/rock ratio
accompanying such hydration, and comparison of 87Sr;86Sr ratios of gypsums and
carbonates in Rustler, Dewey Lake, and surface rocks shows that secondary sulfates
and carbonates in the Rustler did not form in a hydrological regime that was uni
formly interconnected with overlying rocks and the surface. Thus, the available
mineralogical, hydrological, and isotopic data indicate no significant vertical
connection between the Culebra and overlying strata.
The apparent discrepancy between modern flow direction and solute distribution can be
explained by a change in flow direction in the last 30,000, or perhaps 12,000 years.
S h d I . . . h II d . . 234U/238u ..uc a mo e IS consIstent WIt genera y eastwar -mcreasmg actIVIty
ratios that indicate recharge from a near-surface Pleistocene infiltration zone,
ES-3

flowing from the west-northwest. The model is also consistent with the cessation of
recharge in the late Pleistocene, as indicated by the radiocarbon dates. A likely
explanation for the less saline waters south of the WIPP Site is that at the time of
influx of the present generation of Culebra groundwater from the west-northwest,
Rustler halite was absent adjacent to the Culebra in that area, and did not provide a
source of NaC!. Thus, the postulated paleoflow direction (from the west-northwest)
is consistent with both flow perpendicular to the 234U/38U contours and flow
parallel to the hydrochemical facies boundary between more saline water in the north
and less saline water south of the WIPP.
A model for the chemical evolution of waters in the Culebra tentatively identi
fies the major sources and sinks for many of the solutes. It is proposed that:
(1) solutes are added to the Culebra by dissolution of evaporite minerals; (2) the
solubilities of gypsum and calcite increase as the salinity increases, and these
minerals dissolve as chemical equilibrium is maintained between them and the ground
water; (3) equilibrium is not maintained between the waters and dolomite, and suffi
cient Mg is added to the waters by dissolution of accessory carnallite or polyhalite
so that the degree of dolomite supersaturation increases with ionic strength;
(4) clays within the fractures and rock matrix exert some control on the distribution
of Li, B, Mg, and Si via sorption, ion exchange, and dissolution.
Increase of salinity in Culebra waters due to dissolution of evaporite salts in
adjacent rock units is an irreversible chemical process affecting the water chemis
try. The solubilities of gypsum, dolomite, and calcite increase with salinity up to
3 molal ionic strength and then decrease. Thus, even if the saturation indices for
gypsum and calcite are near zero, the waters may still be capable of dissolving
significant amounts of these phases if the salinity increases. Computer modeling of
several hypothetical reaction paths shows that addition of solutes (Mg, SO4' K, and
Cl) to the Culebra from evaporite minerals such as polyhalite and carnallite in a
ES-4

partial equilibrium system is consistent with the observed groundwater compositions,
if dolomite does not precipitate from supersaturated solutions.
Isotopic studies of minerals and waters provide some support for this model. Stable
isotope compositions of carbonate minerals indicate that calcite has precipitated in
equilibrium with the groundwater now found in the Culebra in some areas, but that
dolomite has not extensively recrystallized or exchanged isotopes with meteoric
groundwater of any age. There is also isotopic evidence that calcium sulfate has
recrystallized (dissolved and reprecipitated) in the presence of Rustler ground
waters.
The results of principal component analysis (PCA) suggest that reactions with clay
minerals may exert an observable influence on the water's minor-element chemistry
throughout the study area. When the effects of solute addition associated with
halite dissolution are factored out prior to the PCA, a Mg-SiOz-alkalinity
association is left that IS negatively correlated with a pH-B-Li association. These
correlations are consistent with several plausible mechanisms, including uptake of Li
by vacant octahedral sites In a clay lattice, sorption of B by surface sites of
clays, and dissolution of a reactive amorphous Si-Mg-rich layer in corrensite, the
dominant Culebra clay mineral.
Investigations that could further elucidate the hypotheses proposed here include
collection and analysis of isotopic and chemical data from additional boreholes,
systematic examination of the mineralogy of samples from highly transmissive zones
(containing core rubble rather than intact core), and more rigorous calculations of
the extent of mass transfer that could result from precipitation, dissolution, ion
exchange, and sorption.
ES-5

Chapter 1 (Siegel and Lambert)
CHAPTER 1:
SUMMARY OF HYDROGEOCHEMICAL CONSTRAINTSON GROUNDWATER FLOW
AND EVOLUTION IN THE RUSTLER FORMATION
Malcolm D. Siegel and Steven J. LambertSandia National Laboratories
ABSTRACT
Chemical, mineralogical, isotopic, and hydrological data from the Culebra dolomite
member of the Rustler Formation and related rocks were evaluated to delineate hydro
chemical facies in the Culebra dolomite, to compare these facies with host rock
mineralogies and hydrological flow patterns, and to formulate a conceptual model for
post-Pleistocene groundwater flow and chemical evolution in the Rustler. Modern flow
within the Culebra at and near the Waste Isolation Pilot Plant (WIPP) Site appears to
be largely north-to-south; however, these inferences about flow direction and
velocity may not be uniformly applicable to directions and velocities during the past
10,000 years. Present-day regional water flow directions are not consistent with the
salinity distribution at the WIPP Site, assuming confined hydrological flow. In
particular, a hydrochemical facies with low salinity and element ratios inconsistent
with halite dissolution lies downgradient from more saline water to the north.
Isotopic, mineralogical, and hydrological data suggest that vertical recharge to the
Culebra in the WIPP area and to the immediate east and south has not occurred for
several thousand years. These data are consistent with the view that the apparent
discrepancy between modern flow direction and solute distribution can be explained by
a change in flow direction during the last 30,000, or perhaps 12,000 years. This
d I . . . h II d . . 234U/238U .. . hmo e IS consIstent Wit genera y eastwar -mcreasmg aclivlty ralios t at
1-1
Chapter 1 (Siegel and Lambert)
suggest recharge from a near-surface Pleistocene infiltration zone, flowing from the
west-northwest. Culebra groundwaters are in chemical equilibrium with gypsum and
undersaturated with respect to halite and anhydrite. A partial-equilibrium model for
the chemical evolution of the groundwater suggests that Na, Cl, Mg, K, and SO4 are
added to the Culebra by dissolution of evaporite salts III adjacent strata.
Equilibrium IS maintained with gypsum and calcite, but dolomite supersaturation
increases as the salinity of the water increases. Isotopic studies of minerals and
waters provide some support for this model. Stable-isotope compositions of
carbonates indicate no recrystallization of dolomite in equilibrium with
the groundwater now found in the Culebra, but local precipitation of calcite has
apparently occurred. There is isotopic as well as mineralogical indication that
calcium sulfate has recrystallized (dissolved and reprecipitated) in the presence of
Rustler groundwaters.
Controls on the distribution of minor and trace elements are more problematic.
Reactions with clay minerals may exert an observable influence on the water's minor
element chemistry. Major and minor element correlations are consistent with several
plausible mechanisms, including sorption of lithium and boron by clays and silicate
dissolution.
1-2

Chapter 1 (Siegel and Lambert)
CONTENTS
1.1 INTRODUCTION 1-71.1.1 Purpose and Scope 1-71.1.2 Geological Setting 1-8
1.2 HYDROLOGIC SETTING OF CULEBRA AND RELATED ROCKS 1-221.2.1 Introduction 1-221.2.2 Culebra Dolomite 1-221.2.3 Related Rocks 1-30
1.3 SOURCES AND QUALITY OF GEOCHEMICAL DATA 1-311.3.1 Major and Minor Solute Data 1-311.3.2 Evaluation of Oxidation-Reduction Potential and Occurrence
of Organic Constituents in the Culebra 1-321.3.3 Mineralogical Data 1-321.3.4 Isotopic Data 1-33
1.4 RESULTS OF GEOCHEMICAL STUDIES 1-341.4.1 MajorIMinor Element Ratios and Correlations 1-341.4.2 Definition of Hydrochemical Facies of Culebra Groundwater
Based on Relative Proportions of Major Solutes 1-381.4.3 Principal Component Analysis of Rustler Groundwater
Compositions 1-431.4.3.1 Unrotated Principal Components 1-451.4.3.2 Rotated Principal Components 1-451.4.3.3 R-mode Factors Obtained after Partialling Out Total
Dissolved Solids 1-471.4.4 Classification of Rustler Groundwaters by Normative Salt
Assemblages 1-501.4.5 Calculations of Mineral Saturation Indices for Culebra
Waters 1-521.4.6 Partial Equilibrium Model for Major Solutes 1-591.4.7 Estimation of Oxidation-Reduction Potentials and Occurrence
of Organics in the Culebra Groundwaters 1-651.4.8 Isotopic Studies of Rustler Waters 1-691.4.9 Mineralogical Studies in the Culebra Member 1-781.4.10 Mineral Isotopic Studies 1-80
1-3

Chapter 1 (Siegel and Lambert)
CONTENTS (Continued)
1.5 DISCUSSION 1-861.5.1 Processes Affecting Groundwater Composition 1-86
1.5.1.1 Summary of Solute Relationships 1-871.5.1.2 Precipitation and Dissolution of Carbonates,
Sulfates, and Evaporite Salts 1-891.5.1.3 Reactions Involving Silicates 1-90
1.5.2 Consistency Between Solute and Isotope Distributions andHydrologic Flow 1-921.5.2.1 Steady-State Versus Transient Flow 1-921.5.2.2 The Origin of the Southern Low-Salinity Zone 1-941.5.2.3 Zonation of Normative Solute Characteristics 1-981.5.2.4 The Degree of Hydraulic Versus Geochemical Confinement 1-99
1.6 SUMMARY 1-100
1.7 REFERENCES 1-103
FIGURES
1-1. Setting of the WIPP Site relative to the northern Delaware Basin,including selected geomorphic features and boreholes (modifiedby Lappin [1988] from Figure 6-1 of Lambert [1983]) 1-9
1-2. Map showing location of wells mentioned in this document 1-101-3. Generalized stratigraphy of Guadalupian (Permian) and younger
rocks in the Delaware BasinA. Idealized north-south section, looking east, at the northern
apex of the Capitan Limestone, near the Eddy-Lea Countyline (from Lambert, 1983) 1-17
B. Stratigraphic column of Guadalupian and younger rocks,exclusive of the Capitan complex, including members of theRustler Formation (from Lappin, 1988) 1-18
1-4. Logarithms of calculated Culebra transmissivities at and nearthe WIPP Site (Figure 4.3 of LaVenue et al. [1988]) 1-23
1-5. Calculated Darcy-velocity vectors in the Culebra dolomite(Figure 4.5B of LaVenue et al. [1988]) 1-26
1-6. Calculated flowpaths and flow times within the Culebra dolomite(Figure 4.17 of LaVenue et al. [1988]) 1-27
1-4

Chapter 1 (Siegel and Lambert)
FIGURES (Continued)
1-7. Generalized head relations among units in the Rustler Formationand between the Rustler, Dewey Lake Red Beds, and Saladoat the WIPP Site (Figure 6-3 of Beauheim [1987]) 1-29
1-8. Contours of sodium concentration (mg/L) in study area (from Siegelet aI., Chapter 2) 1-36
1-9. Contours of ratios of KINa concentrations in study area (fromSiegel et aI., Chapter 2) 1-37
l-lD. Hydrochemical facies of the Culebra dolomite (from Siegelet aI., Chapter 2) 1-39
1-11. Trilinear diagram for Culebra groundwaters (from Siegelet aI., Chapter 2) 1-40
1-12. Relationship between Mg/Ca molar ratio and ionic strength(molal) for Culebra groundwater samples in differenthydrochemical facies (from Siegel et aI., Chapter 2) 1-41
1-13. Relationship between occurrence of halite in the Rustler andhydrochemical facies of the Culebra dolomite 1-42
1-14. Unrotated R-mode factor loadings for factors 1,2, and 3 forCulebra groundwaters (population 1) 1-46
1-15. Relationship between varimax R-mode factor scores forfactors 1A and 2A for Culebra groundwaters (population 1) 1-48
1-16. Varimax R-mode factor loadings of key elements for factors 1B,2B, 3B, 4B, and 5B obtained from partial-correlation matrixwith respect to TDS for Culebra groundwaters (population 1) 1-49
1-17. Relationship between gypsum and dolomite saturation indicesin Culebra groundwater samples (from Siegel et aI., Chapter 2) 1-56
1-18. Relationship between halite saturation indices and ionic strengthsof Culebra groundwater samples (from Siegel et aI., Chapter 2) 1-57
1-19. Relationship between anhydrite and gypsum saturation indices(states) and ionic strengths of Culebra groundwater samples(from Siegel et aI., Chapter 2) 1-58
1-20. Relationship between saturated index expression(2S1 I' - Sid I .) and ionic strengths for Culebra groundwatersca CHe 0 omHe(from Siegel et aI., Chapter 2) 1-60
1-21. Relationship between apparent solubility product 10gQfor gypsum and ionic strength in Culebra water samples 1-61
1-22. Change in Mg/Ca molar ratio as a function of reaction progress, typesof added salts, and dolomite saturation index for simulatedevolution of Culebra groundwaters 1-63
1-23. Change in sulfate concentration as a function of reaction progress,types of added salts, and dolomite saturation index forsimulated evolution of Culebra groundwater compositions 1-64
1-5

Chapter 1 (Siegel and Lambert)
1-24. Comparison of redox potentials calculated for several differentredox couples in waters from Culebra wells 1-67
1-25. Stable-isotope compositions of groundwaters from the RustlerFormation (Figure 5-1, adapted from Lambert and Harvey, 1987) 1-70
1-26. Tritium and deuterium concentrations in groundwaters from theSouthern High Plains, Texas, and the Delaware Basin, southeasternNew Mexico (Figure 5-2, from Lambert and Harvey, 1987) 1-72
1-27. Tritium and radiocarbon in Rustler and Dewey Lake groundwaters(Figure 5-11, adapted from Lambert and Harvey, 1987) 1-74
1-28. Contour map of 234U/38U activity ratio in groundwater from theCulebra dolomite member of the Rustler Formation (Figure 5-11,from Lambert and Carter, 1987) 1-76
1-29. Fence diagram showing stratigraphy of the Rustler Formation andmineralogy of the Culebra member (from Sewards et aI.,Chapter 3) 1-79
1-30. 618
0 values for coexisting carbonates and waters in the RustlerFormation (Figure 5-6, from Lambert and Harvey, 1987;Lambert, 1987) 1-81
1-31. 87Sr;86Sr ratios in Ochoan and related rocks (Figure 5-17;data from Brookins and Lambert [1988]) 1-83
1-32. 6D values of the water of crystallization in gypsums as afunction of depth (Figure 19A from Lambert, Chapter 5) 1-85
1-33. Relationship between hydrological flow and hydrochemicalfacies of the Culebra dolomite 1-93
1-34. Paleoflow (late Pleistocene) directions for groundwater in theCulebra member of the Rustler Formation from likely rechargeareas on outcrops in Nash Draw............................................................................... 1-96
TABLES
1-1. Chapters in This Report Containing Discussion of Various Types of DataAvailable at Each Well 1-11
1-2. Chemical Formulae of Minerals Mentioned in This Chapter 1-191-3. Saturation Indices for Common Evaporite Minerals Calculated
by PHRQPITZ 1-531-4. Chemical Process That May Affect the Solute Compositions of Culebra
Groundwaters 1-88
1-6

Chapter 1 (Siegel and Lambert)
CHAPTER 1.0
1.1 INTRODUCTION
1.1.1 Purpose and Scope
In the "Agreement for Consultation and Cooperation between [the1Department of Energy
and the State of New Mexico on the Waste Isolation Pilot Plant," the United States
Department of Energy (DOE) agreed to conduct geotechnical studies as part of its site
characterization program for the Waste Isolation Pilot Plant (WIPP). The Agreement was
enacted on July 1, 1981 and was subsequently modified in November 1984 and August
1987. The DOE agreed to provide the State with a report entitled "Hydrogeochemical
Facies in the Rustler Formation at the WIPP." The report was to "compare the solutes with
host rock mineralogies at and between various well sites" and "... attempt to delineate
hydrochemical facies in the Rustler Formation." In addition, "comparison of these facies
with flow patterns derived solely from physical hydrology [was to1be made for the purpose
of examining internal consistency" (United States Department of Energy and the State of
New Mexico, 1988).
This report synthesizes current data and hypotheses concerning the origin of the composi
tion of waters in the Culebra member of the Rustler Formation. Progress is described in
attempts to compare the aqueous geochemistry with host rock mineralogies and
geochemistry at and between various well sites and to delineate hydrochemical facies in the
Culebra member. These facies are then compared to modern groundwater flow patterns
derived from site stratigraphy and hydrology. Although the emphasis is on the properties
of waters in the Culebra member, preliminary results from work dealing with the Magenta
member, Rustler/Salado contact zone, and the Dewey Lake Red Beds are also included
where relevant.
1-7

Chapter 1 (Siegel and Lambert)
The area included in this study is shown in Figures 1-1 and 1-2. As shown in Figure 1-1, the
WIPP Site is located in southeastern New Mexico, in the northern portion of the Delaware
Basin. As used in this report, the term "WIPP Site" refers to the 16 square miles of 1'22S,
R31E contained within WIPP Zone 3 as shown in these Figures. Figure 1-2 shows the
locations of all wells and boreholes from which water and/or rock samples were taken and
described in this report. Table 1-2 describes the kinds of data available from each of these
locations.
The information collected in the independent studies described in Chapters 2 through 6 has
been integrated in this chapter. The techniques used and specific data examined by the
different research groups have led to alternative interpretations and hypotheses concerning
the origins of solutes and water in the Culebra. The primary purpose of this chapter is to
summarize the results of these investigations, present these differing views, point out the
areas of disagreement, and discuss investigations that might resolve the controversies.
1.1.2 Geological Setting
The general stratigraphy in the vicinity of the WIPP Site has been described in detail,
particularly in relation to occurrences and manifestations of groundwater, by Powers et al.
(1978) and Lambert (1983). The need to consider groundwater geochemistry in its geologi
cal context warrants the following brief discussion of the stratigraphy (Figure 1-3) and
geological features relevant to the geochemical results subsequently presented. The
chemical formulae of minerals mentioned in this section are given in Table 1-2.
The Delaware Basin became a distinct structure by the late Pennsylvanian Period to early
Permian Period, around 280 million years (Ma) ago. About 250 Ma ago, fringing reef-type
structures began to grow around the margins of the developing basin. Now termed the
Goat Seep Dolomite and Capitan Limestone, these carbonates interfinger with the basinal
deposits of sandstones, shales, and carbonates now called the Delaware Mountain Group,
the uppermost of which is the Bell Canyon Formation. The Bell Canyon contains
1-8

'~I ~~ =:IE •~
J I~
Z
TJal
\\\
N
~,
,,,,\
Texas
New Mexico
-'"L I 11:"',.", .It\. '_
'~d' ".....>- \0\~\~\
\
\\,,I,,
BAS IN
--------<128) ~Malaga Bend
WIPP-28.~-"'~....• WIPP-27'~ I.',",.-'" .... ~ .,,0: 1 ,
~ 3' l' .... ,..'i WIPP-30IZ: .,l ~ 'I 0" I
b'> Q li 1
; 't '?~ ",ii>/> Bt~ ~~ '\.\- ---- ERDA-9
r;"""'-......:;~L I
<0 WIPP-29 I WIPP Siter' (0, Boundary) Surprise Spring ".f, I\, .",
Laguna Grande q~\.
de la Sal I 0"
DIE1. A WAR E
20 km
10 15 miI ' i 'i '
,.,.,.------....-~,. I ---~ ~. ~".'" • C I~ . • ..~". Hackberry g I § Mlddleto" ,
" u
o
-__... .. ... '0-/'","'''' ... " .,:, .."' .,"
I ~" r. CarlsbadI V No.7.o,,,\\\)......,
v:;
TRI-6330-72-1
Figure 1-1. Setting of the WIPP Site relative to the northern Delaware Basin, including selected geomorphic featuresand boreholes (modified by Lappin [1988] from Figure 6-1 of Lambert [1983]).

Chapter 1 (Siegel and Lambert)
WIPP-25·
..N>-
~c<'a:•
R32ER31E
G~\ \) • WIPP-30
~
H-14-
"11":"'11
WIPp·2S-1
,.,1'El~
5 1 5UIO>'1°,,:cv",10>LIJ
1
...J
1
I AEC-7ERDA-6 I •
•+- LIVINGSTON RIDGE SURFACE~ I
o .AEC-8 I
"- 1
'" H-6 DDE-2· WIPP-14 1
" WIPP-34 H-S IWIPP-33. .WIPP-13
H-18 .WIPP-12 I.WIPP-19 ~ :WIPP-18 / WIPP Site
WIPP-21.-WIPP-22 Boundary.P-14 H-16- • ERDA-9 1
H-2- H-' eH-15-H-3 I
-DOE-' .P-18 I
R30E
• WIPP-27
Q
.~ +
N
R29E
WIPP-26.
1,
• WIPP-32
P-15
ILIVINGSTON RIDGE SURFACE
I-+-
eH-12
-H-17
·Unger Well
< H-40", P.ll_
Windmill WeIL~ Ranch Well- ~
'" • ('IIBarn Well 0-
"?'o•• FR-10
-South Well _Indian WellliI,:-
+• WIPP-29
..MN>-
H-l0-• Pocket Well
+Gnome-5
I_Gnome_4/
Gnome-B
-ERDA-10_Gnome Shaft• Gnome-'
Fairview Well-
i--H-9
• Engle Well
Two-Mile Well.
• _H-BPoker Trap Well
• Twin Wells
oIo
• Borehole or Well
2 3, I
2 4
4 mi
6 km
R29E R30E R31E R32E
TRI-6330-77-1
Figure 1-2. Map showing location of wells mentioned in this document.
1-10

Table 1-1. Chapters in This Report Containing Discussion of Various Types of Data Availableat Each Well
Well Unit1 Waters Rocks
Solutes Eh TOC PMC 3H 60 6180 A.R. Mnrlgy 87/86Sr 613C 6180 60 6 Head2
Zone A:
00E-1 Mag +00E-1 Cul 2,4 6 6 5 5
H-5 Mag 2,4 +H-5 Cul 2,4 6 6 5 5 5 5 5H-5 R/S 4 5 5
P-18 Cul 4 5 5P-18 R/S 4 5 5
.....,H-ll Cul 2,4 6 6 5 3..........
H-12 Cul 2,4 6 6 5 5
Zone B:
ENGLE Cul 2,4 6 6 5 5 5 n::rH-7 Mag
~
+ '0~
H-7 Cul 2,4 6 6 3 CD...,H-7 R/S 4 .....
~
(Il
H-8 Mag 4 + c;"O<l
H-8 Cul 2,4 6 6 ~
H-8 R/S 4 0 ~;:l0..
H-9 Mag 4 + C'H-9 Cul 2,4 6 6 5 5 5 :3H-9 R/S 4 ::r
CD...,~
---

Table 1-1. Chapters in This Report Containing Discussion of Various Types of Data Availableat Each Well (Continued) n::r
.§-'"Unit l ....Well Waters Rocks .....
~
PMC 3H 0180 87/86Sr 013C 0180 6 Head2 enSolutes Eh TOC 00 A.R. Mnrlgy 00 ;;;.
""'"-FR-IO Cul 5 5 pOi:l0..
Ranch OL 2 5 1:Twin P. OL 2,4
g.'"....-Indian Cul 4'-/
Two Mile Cul 4
Pocket OL 4 5 5.....,..... Windmill Cul 4N
Gnome-SH Cul 4
Gnome-l Cul 4
Gnome-4 Cul 4
Gnome-5 Mag 4
Gnome-5 R/S 4
Gnome-8 Cul 4
Unger OL 5
South Cul 4Fairview OL 5

Table 1-1. Chapters in This Report Containing Discussion of Various Types of Data Availableat Each Well (Continued)
Well Unit1 Waters Rocks
Solutes Eh TOC PMC 3H 60 6180 A.R. Mnrlgy 87/86Sr 613C 6180 60 Ii Head2
Zone C:
AEC-B OL 5 5AEC-B Tam 5AEC-B BC 5 5
00E-2 49r 000E-2 Mag +00E-2 Cul 2,4 6 6 5 500E-2 BC 2
'""""'H-1 Mag 4 5 5 +,H-1 Cul 4 5 5'""""'wH-1 lwrH-1 R/S 4 5 5
H-2 Mag 4 5 5 +H-2 Cul 2,4 6 5 5H-2 R/S 4 5 5 + n
::r'
H-3 49r .g~
H-3 Mag 2,4 5 5 + (1)....H-3 Cul 2,4 6 6 5 5 5 3 '""""'H-3 R/S 4 5 5
~
Vliii·
(Jq
H-4 Mag 2,4 + (1)~
H-4 Cul 2,4 6 6 5 5 5 5 5 3 5 5 Ol::>
H-4 R/S 4 5 5 0..
t""'Ol
H-6 Mag 2,4 0 g.H-6 Cul 2,4 6 6 5 5 5 5 3 5 5 (1)
H-6 R/S 4 5 5 ....~
~

Table 1-1. Chapters in This Report Containing Discussion of Various Types of Data Availablen
at Each Well (Continued) ::r~
'1:l-CD
Unit l ...,Well Waters Rocks >-'
r-.
3H 6180 87/86Sr 613C 6180 11 Head 2 CIl
Solutes Eh TOC PMC 6D A.R. Mnrlgy 6D~.
CDO<l
CD-H-IO Mag 4 + ~::;
H-IO Cul 4 3 0..
H-IO R/S 4 E;'3
H-14 49r (-) 0-CD
H-14 Mag +...,-~H-14 Cul 6 6
H-15 Cul 6 6
H-16 49r ( - )>-' H-16 Mag +,>-' H-16 R/S (+)..,.
H-17 Cul 6
H-18 Cul 6
P-14 Cul 2,4 6 6 5 5P-14 R/S 4 5 5
P-15 Cul 4 5 5P-15 R/S 4 5 5
P-17 Cul 2,4 6 6 5 5P-17 R/S 4 5 5
WIPP-12 Cul 3WIPP-13 Mag 5WIPP-13 Tam 5WIPP-13 Cul 2 5

Table 1·1. Chapters in This Report Containing Discussion of Various Types of Data Availableat Each Well (Continued)
Well Unit l Waters Rocks
Solutes Eh TOC PMC 3H 6D 6180 A.R. Mnrlgy 87/86Sr 613C 6180 6D fJ. Head2
WIPP-14 DL 5 5
WIPP-19 DL 5 5WIPP-19 Cul 6 6 3
WIPP-25 DL 5WIPP-25 49r 5WIPP-25 Mag 2,4 5 5 5 5 5 5 0WIPP-25 Cul 2,4 6 6 5 5 5 3 5 5 5WIPP-25 lwr 5WIPP-25 R/S 2,4 5 5 5 ( - )......,
......V1 WIPP-26 Mag 5
WIPP-26 Tam 5WIPP-26 Cul 2,4 6 6 5 5 5 3 5 5 5WIPP-26 R/S 2,4 5 5 5 (-)
WIPP-28 Mag 5 5 + nWIPP-28 Cul 2,4 5 5 5 5 5 ::rWIPP-28 R/S 2,4 5 5 5 0 ~
'1:l-0>...,WIPP-30 Mag 4 5 5 5 5 + ......WIPP-30 Cul 2,4 5 5 5 5 5 ~
~WIPP-30 R/S 2,4 5 5 5 0>{)q
~WIPP-33 49r 5 5 ~
WIPP-33 Mag 5 5 5 :J0..
WIPP-33 Cul 5 t""WIPP-33 lwr 5 ~g.
0>WIPP-34 49r 5 5 ...,-WIPP-34 Mag 5 5 ---WIPP-34 lwr 5 5

Table 1-1. Chapters in This Report Containing Discussion of Various Types of Data Availableat Each Well (Continued)
Well Unit l Waters Rocks
Solutes Eh TOC PMC 3H 6D 6180 A.R. Mnrlgy 87/86Sr 613C 6180 6D A Head2
Zone D:
WIPP-27 Mag 2,4 5 5 5 +WIPP-27 Cul 2,4 5 5 5 5 5WIPP-27 R/S 4 5 5
WIPP-29 Cul 2,4 6 5 5 5 3 5WIPP-29 R/S 2,4 5 5 5
S.Spring Tam 4 5 5
>-',>-'0\ 1. Unit abbreviations:
DL: Dewey Lake Red Beds49r: Rustler Fm., Forty-niner memberMag: Rustler Fm., Magenta dolomite memberTam: Rustler Fm., Tamarisk memberCul: Rustler Fm., Culebra dolomite memberlwr: Rustler Fm., lower memberBC: Bell Canyon Fm.
2. Comparison of hydraulic heads for nearby units.For Mag and R/S:
"+": unit's head is higher than that of Culebra; potential for flow into Culebra."-". unit's head is lower than that of Culebra; potential for flow from Culebra.
For 49r:"-". unit's head is lower than that of Magenta; potential for flow from Magenta into
Forty-niner.For all:
"0": approximately equivalent heads in units being compared."() ": potent ia1 flow direct ion is based on reported lower or upper 1imit for head of one
of the units (see Beauheim, 1987).

Surficial Deposits(Locally Triassic and Cretaceous Rocks. Ogallala on the High Plains;
Regionally Gatuiia. Mescalero Caliche and Aeolian Sand)
"6::::'c::.:::::=.:::::-....",=",..._"'=:::::=0:::.':::'".;::.,"::"'::".-~=.. -.="-=2''Z"):::;:;=:::::;.'."'::.. . ;z.:Zc.::•. :::.. ::.:;:;:::"",...-=:-:;:•.::::.. ::.~,;::::..~Dewey Lake Red Beds
----------------~----RustlerFormation
McNutt Potash Zone._---,---
-------------- SaladoFormation
Bell CanyonFormation
CastileFormation
Anhydrite I
}
Cherry CanyonFormation
-------
~ ~__ Anhydrite III
-~~_ -- Halite 11---_
~ Anhydrite II~ Halitel----
CapitanLimestone
Not to Scale
Queen Formation--::;~
Grayburg Formation
San Andres Limestone
Tansill FormaliitiiOo~nC====-::::::::::::=----~=_
Yates Forma~ti:o~n _=;;:::::§~~~"Seven Rivers Formation
TRI·6331~3·1
Figure 1-3. Generalized stratigraphy of Guadalupian (Permian) and younger rocks in the Delaware Basin.A. Idealized north-south section, looking east, at the northern apex of the Capitan Limestone, near theEddy-Lea County line (from Lambert, 1983).

Chapter 1 (Siegel and Lambert)
System Series Group Formation Member
Recent Recent Surficial Deposits
Quater- Pleisto- Mescalero Caliche
nary cene Gatuna
Triassic Dockum Undivided
Dewey LakeRed Beds
Forty-niner
Magenta Dolomite
Rustler Tamarisk
Culebra Dolomitec: lower"'0.s:
"0
Salado
c:.!l!E~
" Castilea.
c: Bell Canyon
c: ~c:
.!l! :Ja. 0:J ::;;"' "" ~
"' "' Cherry:J ~c.:l "' Canyon
"CBrushyCanyon
TRI-6330-89-2
Figure 1-3. B. Stratigraphic column of Guadalupian and younger rocks, exclusive of theCapitan complex, including members of the Rustler Formation (fromLappin, 1988).
1-18

Chapter 1 (Siegel and Lambert)
Table 1-2. Chemical Formulae1
of Minerals Mentioned in This Chapter
Mi neraI
AmesiteAnhydriteCalciteCarna11 i teCh IoriteCorrensiteDolomiteFeldsparGlauberiteGypsumHal iteIII iteKainiteKieseriteLangbeiniteMagnes itePolyhal itePyrite
QuartzSerpentineSmectiteSyl vite
Formula
(Mg 4AI 2)(Si 2AI 2)OI0(OH)8CaS04CaC03KMgCl 3'6H20
(Mg,AI,Fe)12(Si,AI)8020(OH)16mixed-layer chlorite/smectite
CaMg(C03)2(K,Na,Ca) (Si ,AI )408
Na 2Ca(S04)2CaS04,2H20
NaCI
Kl_1.SAI4[Si7_6.SAll_l.S020](OH)4KMgCI S04 ' 3H20MgS04, H20
K2M9 2(S04)3MgC03K2Ca 2Mg(S04)4'2H 20FeS2Si02Mg3Si 20S(OH)4(Ca/2,Na)O.7(AI,Mg,Fe)4(Si,AI)8020(OH)4,nH20KCI
I. Formulae are taken from Fleischer (1987) and Deer, Howie, andZussman (1962).
1-19

Chapter 1 (Siegel and Lambert)
local occurrences of economically important hydrocarbons and sporadically distributed
oilfield-type brines, and forms the substrate for later evaporite deposition. The Capitan
Limestone has a locally developed cavernous porosity displaying the classic features of
limestone karst and includes Carlsbad Caverns.
The sandstones and shales of the Bell Canyon Formation grade upward into the alternating
sequence of sulfate and carbonate laminations characteristic of the Castile Formation. The
thick Castile sequences of sulfate/carbonate are interrupted two (and locally three) times
by comparably thick sequences of bedded rock salt containing glauberite as an accessory
mineral. The Salado Formation overlying the Castile consists dominantly of halite, inter
rupted at various intervals of meters to tens of meters by beds of anhydrite, polyhalite,
mudstone, and local potash mineralization (sylvite or langbeinite, with or without accessory
carnallite, kieserite, kainite, and glauberite, all in a halite matrix) of economic importance.
The nonhalitic units, on the order of 0.1 to 1 m thick, have been numbered (in some cases
named) for convenience as "marker" beds, where uniquely identifiable, to facilitate cross
basinal stratigraphic correlation. The WIPP mined facility is being emplaced just above
Marker Bed 139 in the Salado, at an approximate depth of 660 m. Radiometric dates on
sylvites (Register and Brookins, 1980) and polyhalites (Brookins et aI., 1980) give generally
concordant post-Permian ages of crystallization and/or recrystallization of 214 ± 15 Ma
and 195-205 Ma, respectively. Clay minerals from the WIPP Facility in the Salado preserve
a possibly detrital geochemical signature, unaltered by deposition and diagenesis, and
having a radiometric age of 428 ±7 Ma (Brookins and Lambert, 1987; 1988).
The Rustler Formation, overlying the Salado, contains five members according to the
regional stratigraphic nomenclature, in ascending stratigraphic sequence: (1) a lower
member (unnamed) consisting of siltstone/mudstone, anhydrite locally altered to gypsum,
and containing halite under most of the WIPP Site; (2) the relatively permeable Culebra
dolomite member, containing dominantly dolomite with subordinate anhydrite and/or
gypsum; (3) the Tamarisk member, dominantly anhydrite/gypsum, with subordinate
1-20

Chapter 1 (Siegel and Lambert)
fine-grained clastics, containing halite to the east of the WIPP Site; (4) the Magenta
member, another dolomite/sulfate unit containing sporadic occurrences of groundwater
near the WIPP Site; and (5) the Forty-niner member, similar in lithology to the other
nondolomitic units, but containing halite only in the easternmost part of the study area.
The Culebra member is the first major water-bearing unit above the WIPP Facility; for this
reason, the hydrochemistry and hydrology of Culebra groundwater in the study area shown
in Figures 1-1 and 1-2 is the primary focus of this work.
The Dewey Lake Red Beds are the uppermost Permian unit, consisting of siltstones and
claystones locally transected by concordant and discordant fractures that are either unal
tered or contain gypsum (selenite and satin spar). The Dewey Lake contains sporadic
occurrences of groundwater, mostly in the area south of the WIPP Site. The Triassic
Dockum Group (undivided) rests on the Dewey Lake in the east half of the site and thick
ens eastward.
Locally throughout the area sands, gravels, and boulder conglomerates of the Gatuna
Formation occur as channel and alluvial pond deposits as part of a high-energy stream
system that dissected the southeastern New Mexico landscape in the middle Pleistocene.
One such channel was Nash Draw, a broad, shallow solution valley west of the WIPP Site,
where outcrops of the Rustler Formation have been eroded into shallow karstic landforms
typical of subaerially exposed gypsum terrane. The pedogenic Mescalero caliche com
monly is developed on top of the Gatuna where it occurs, and on many other rock types as
well. Late Pleistocene spring deposits, dominantly of gypsite, occur just inside the eastern
scarp of Nash Draw, and are thought to represent remobilization of sulfates from the
Dewey Lake Red Beds and perhaps part of the upper Rustler Formation by groundwaters
moving westward into Nash Draw during the late Pleistocene.
1-21
Chapter 1 (Siegel and Lambert)
1.2 HYDROLOGIC SETTING OF CULEBRA ANDRELATED ROCKS
1.2.1 Introduction
The hydrologic system in the Rustler Formation has been the subject of intense study since
1976. The results of these studies to date are summarized by Lappin (1988) and briefly
reviewed here. Recent findings concerning physical hydrology within the Rustler have
yielded various interpretations; consistency between interpretations based on physical
hydrology and those based on geochemical and isotopic observations is a significant topic
of discussion in this work.
The most important constraints on numerical models for calculating the modern or present
day flow velocities and directions in a groundwater system are the heads and
transmissivities in various parts of the system. These parameters are inferred from other
observations. The basic data describing the hydrologic properties of the Culebra over the
study area consist of water-level measurements and observations of drawdown and/or
recovery during hydraulic tests. Equivalent freshwater heads are derived from pressure
data (water-level measurements) and a fluid density at each point. The time-dependent
drawdown function obtained in response to pumping is then numerically simulated by
varying the transmissivity until an optimized match between calculated and observed
drawdown function is obtained. Assuming vertical homogeneity across the tested interval,
this gives the best available estimate of transmissivity. The hydrologic testing that yielded
the head and transmissivity data base is summarized by Lappin (1988).
1.2.2 Culebra Dolomite
Estimated Culebra transmissivities in the WIPP Site area and within Nash Draw range over
approximately six orders of magnitude, from about 2 x 10⁻⁹
m2
/s a short distance east of the
site to about 10-3
m2/s west of the site, on the east side of Nash Draw (Figure 1-4). Values
1-22

Chapter 1 (Siegel and Lambert)
H-10e
.---.--.--(
I\I
!,./
/.--
// N
)' j/
/
c'f'.
..)·0
c<;>.
/II\\\
\\\\
II
+ I!.--
....... .- WIPP Site,., Boundary
//
WIPP-2S!./e
.....
"+ f'PP-26
I,\\
\
+ "\
\\I
+ I
oI
3I
4 miI • H-12 Well Name and location
o 2 4 6 km + Pilot Point
TRI-6330-131-1
Figure 1-4. Logarithms of calculated Culebra transmissivities at and near the WIPP Site(Figure 4.3 of LaVenue et al. [1988]).
1-23

Chapter 1 (Siegel and Lambert)
shown in Figure 1-4 are 10glO of transmissivities in units of m2/s and are based on a
steady-state calibration against the freshwater-equivalent head distribution. Culebra trans
missivities in the central portion of the site, including very near the positions of all four
WIPP shafts, are less than 10-6 m2
/s. LaVenue et aI. (1988) estimate that uncertainties in
transmissivity measurements are half an order of magnitude or less. They estimate that the
uncertainty in calculated freshwater heads at most locations is approximately ±2 m.
A continuous but complex zone of variable and higher Culebra transmissivities is present
northwest, west, and south of the site; this zone extends into the southeast and northwest
portions of the WIPP Site. In spite of the transmissivity determinations at 39 discrete
locations in the Culebra, there is no direct field evidence of aqueous mass transport be
tween the relatively high-transmissivity region in the southeast portion of the site
(containing the H-4 hydropad and hole DOE-I) and the less saline groundwater system in
the halite-free extensively gypsified region of the Rustler further south (containing holes
H-7 and H-9). In fact, as discussed in Section 1.4.2, these two regions are geochemically
dissimilar. The degree of fracturing appears to have some control over transmissivity in the
Culebra, especially where the transmissivity is higher than about 10-6
m2/s. The most
fractured portions of the unit almost certainly carry the most groundwater.
The analytical and numerical modeling of Rustler groundwater flow has, over the years,
used various assumptions to explain various observations. For example, no hydrologic
modeling studies to date consider possible reactions within the Culebra that might lead to
local changes in fluid density or composition, such as halite dissolution from adjacent
portions of the Rustler. Assumption of steady-state brine-density distribution (Haug et aI.,
1987) results in significant problems with model calibration that assumes completely
confined flow. Haug et a!' (1987) examine the effects of possible steady-state vertical
inputs into the Culebra of fluids having different densities, from either the lower member
of the Rustler or the Magenta. LaVenue et a!. (1988) relax the assumption of long-term
steady-state fluid compositions, but do assume that the fluid density distribution
1-24

Chapter 1 (Siegel and Lambert)
is fixed on the time scale of local fluid-pressure changes in response to site characterization
and shaft sinking (as long as 100 years). They also assume that the Culebra is completely
confined on this same time scale.
The numerical modeling of the Culebra groundwater system using the measured formation
pressures, a function to estimate the distribution of fluid densities, and a transmissivity
distribution modified from an original kriged estimate, results in the instantaneous (present
day) flow directions and Darcy velocities within the Culebra shown in Figure 1-5. The
hydrologic flow is calculated assuming the transmissivity distribution shown in Figure 1-4
and the freshwater-equivalent head distribution. Present-day flow within the Culebra at
and near the WIPP Site, ignoring possible effects of both fractures and anisotropy, appears
to be largely north-to-south, except in relatively low-transmissivity areas directly affected by
either the high-transmissivity zone in the southeastern portion of the WIPP Site or by Nash
Draw west of the WIPP Site. Calculated Darcy velocities range over six orders of mag
nitude, from 10-12 mls (m3/m2s) east of the WIPP Site to as high as 10-6 mls in central Nash
Draw.
Darcy velocities do not include consideration of effective porosity and therefore do not
represent actual groundwater particle velocities, nor can groundwater travel times be
calculated directly from them unless effective in situ porosity values are known or assumed.
Particle flowpaths and flowtimes within Nash Draw calculated by LaVenue et al. (1988)
assuming steady state, the transmissivity and head distributions used to derive Figure 1-5,
and a uniform effective in situ porosity of 16% are shown in Figure 1-6. They range from
450 years along a 25.1-km path in the west (particle A) to 2800 years along a 26.3-km path
in the eastern part of Nash Draw (particle C). However, changes in the Nash Draw shallow
groundwater system since the beginning of potash mining about 50 years ago (Hunter,
1985) make the steady-state assumption unrealistic in Nash Draw on even this short time
scale.
1-25

Chapter 1 (Siegel and Lambert)
•
N
J,WIPP'
• Site I
Boundary. .
:.--- -, I
\ ! I J I 1 I III1IUIII I \ \ '
\' \ t II I I III/Will I I I \
\ \ \ \ \ \ 1I1111mlll, I •
}\ \ ~ l I 1111/1/1
111/ I I •
},
J 1 j I IllllI'"'' I I • •
1 I / I / llll\\\~'\\ I • I
1/ ;; / III I Illllllli \ I I , I
j/l. ~ ~~~ II. IIJV~~ ~ : I •
~~~~ ~ (t~nl\~ 1; ~ "" I
~ ~ i \~ l,1 \" -------,\\ I
I\ .............~ ,I \ ""~ ,
, I , \ \\.,,~\ \ ' '
\ \ \ I ,\ \\\\~\'1 \ \
\ \ \ \ , \ , ""\lUI I I I '
\ \" -- -- .... " '''''llU1 I 1 I \ '
\ '\" ............--,~"lW\ I I \ \ '
Darcy-Velocity Vector Scale
--oI
o
1 2 3 4 miI I ) )
I I I2 4 6 km
----1..~ 1 x 10⁻⁶ m/s
1 x 10⁻⁷ m/s
1x10⁻⁸ m/s
1 x 10⁻⁹ m/s
TR 1-6342-228-1
Figure 1-5. Calculated Darcy-velocity vectors in the Culebra dolomite (Figure 4.5B ofLaVenue et al. [1988]).
1-26

Chapter 1 (Siegel and Lambert)
DOE-2H-6
R 32 E
IN
jI Ul-I '"....
IIIIII Ul
'"'"....III
~I,..51 Eo ~(.) 13~ . lB UliBl~ M
'"....
H-l0•
R 32 E
H-5
G ER 31 E
R 31 E
• WIPP·3Q
•P·17
WIPP SiteBoundary
• WlPP-13
H-18. .WIPP-12• WIPP-18
H-15•
• WIPP-28
Cabin Baby.
.WIPP-27
R 30 E
WIPP·26
Ul
Ul
'"'"....
UlM
'"....
4miI
oIo
i2
2 3I I
4i6km
Calculated Particle Travel Times
Particle A = 4.5 X 10² yrsParticle B = 9.8 x 10² yrsParticle C = 2.8 x 10³ yrsParticle D = 1.6 x 10⁴ yrsParticle E = 1.4 x 10⁶ yrsParticle F =5.8 x 10 4 yrsParticle G =3.6 x 10⁴ yrs
TRI-6342-20-1
Figure 1-6. Calculated flowpaths and flow times within the Culebra dolomite (Figure 4.17of LaVenue et al. [1988]).
1-27

Chapter 1 (Siegel and Lambert)
LaVenue et al. (1988) calculated the particle travel time from north to south along a
13.7-km path in the eastern part of the WIPP Site (particle E) to be more than one million
years. Travel time from directly above the center of the waste-emplacement panels to the
southern boundary of the WIPP Site (along a 4-km segment of path G in Figure 1-6)
is about 13,000 years. These results, however, cannot be used to quantitatively predict
the behavior of the groundwater over the next 10,000 to one million years given the prob
able non-steady-state character of the Culebra hydrology, as discussed in Section 1.5.2. The
amount of possible vertical flow into and out of the Culebra near site-center remains
indeterminate and cannot be directly measured in the field (see Figure 1-7). At several
well locations, the relationships between the heads in the Culebra and adjacent units
indicate the potential for vertical flow into the Culebra (see Table 1-1). At H-16, H-3, H-2,
H-l, H-14, and DOE-I, the head in the Magenta is higher than that of the Culebra. At H-2
and H-16, the measured head in the Rustler/Salado contact zone is higher than that of the
Culebra. The amount of flow, however, may be negligible, making the assumption of
confined transient flow within the Culebra adequate for modeling purposes, at least for
short-term stresses associated with WIPP shafts and well tests. This assumption mayor
may not be valid for all modeling aspects over a 1O,000-year time frame. In Nash Draw, for
example, the development of near-surface gypsum karst has certainly allowed the Culebra
to be hydraulically connected to various other Rustler horizons, including the Magenta.
At two localities near the site (holes H-3 and H-14), the Magenta head is greater than the
head in claystone in the overlying Forty-niner member; therefore, any modern fluid flow
between these two members at these two localities is upward, not downward. The head
relationships between the Forty-niner and the Magenta at H-16 are probably similar
(Beauheim, 1987). This precludes recharge of the Magenta and underlying units by direct
downward infiltration from the surface at those localities. It has not been possible to
measure hydraulic conductivities within the upper part of the unnamed lower member of
the Rustler in borehole testing from the surface; thus, the degree of upward flow from the
Rustler/Salado contact zone near the site-center (where the head relationships
1-28

Chapter 1 (Siegel and Lambert)
Dewey Lake Red Beds ?
Anhydrite/Gypsum ?Forty-niner
Member Claystone
Anhydrite/Gypsum
Magenta Dolomite Member
Anhydrite/Gypsum ?Tamarisk
c: Member.2
'"E Claystone ?~
0u. Anhydrite/Gypsum ?~
~u; Culebra Dolomite Member::la:
Claystone, Halite, Gypsum
lowermember
Siltstone
?
Salado Formation
Direction 01 Hydraulic Gradientbetween Two Water-Bearing Units
Direction of Hydraulic Gradient Unknownbecause 01 Unknown Head in Unit
TRI-6344-550-1
Figure 1-7. Generalized head relations among units in the Rustler Formation and between the Rustler, Dewey Lake Red Beds, and Salado at the WIPP Site(Figure 6-3 of Beauheim [1987]).
1-29

Chapter 1 (Siegel and Lambert)
favor such a flow direction) cannot be determined. Horizontal hydraulic conductivities
within the lower member claystone and siltstone range from 10-13 to 10-14 m/s. The ex
tremely low hydraulic conductivity of the Tamarisk and relatively high transmissivity of the
Culebra suggest that transient confined flow within the Culebra prevails at and near the
WIPP Site.
Flow velocities calculated from a given set of heads and a given transmissivity distribution
are interpretable as only a "snapshot" of instantaneous or modern behavior, unless the
assumption of a steady state can be defended and the distribution of effective porosity is
known. Physical measurements alone indicate only the present directions of potential fluid
flow within and across the boundaries of the Rustler Formation. These inferences about
flow direction and velocity may not be applicable to directions and velocities during the
past 10,000 years, or during in the next 10,000 years, the interval of interest to regulatory
agencies governing radioactive-waste repositories. Consequently, climatic variations and
their influence on groundwater flow will be included as a factor affecting the uncertainty in
the hydrologic modeling for performance assessment of the WIPP.
1.2.3 Related Rocks
Data for other hydrologic units of interest, including the Magenta, Dewey Lake, Triassic,
and "brine aquifer" near the Rustler/Salado contact zone, are much less abundant than for
the Culebra, although some of them have been used in various model calculations of
hypothetical flow crossing bedding planes into or out of the Culebra. Some testing at
selected points has been carried out in other horizons of the Rustler, including the Forty
niner, Tamarisk, and lower members of the Rustler (Lappin, 1988). Most of the data from
non-Culebra units overlying the Salado in the study are reported by Mercer (1983) and
Beauheim (1987).
1-30

Chapter 1 (Siegel and Lambert)
1.3 SOURCES AND QUALITY OF GEOCHEMICALDATA
1.3.1 Major and Minor Solute Data
Analyses of major and minor solutes from water samples collected by several different
agencies and analyzed in different laboratories from 1976 to 1987 were considered in this
work. The sources of data include the US Geological Survey (USGS) (Mercer, 1983;
Mercer and Orr, 1979; Bodine et aI., Chapter 4), the International Technologies (IT)
Corporation (Uhland and Randall, 1986; Uhland et aI., 1987; Randall et aI., 1988), and
Sandia National Laboratories (Robinson, 1988). In many cases, large discrepancies exist in
the concentrations of major and minor solutes reported for the same location by different
agencies. Much of the variation can be attributed to differences in sampling methods, to
differences in analytical techniques, or to changes in the groundwater chemistry due to
contamination. As discussed below, some of the inconsistencies among conceptual models
proposed for the hydrochemical system at the WIPP can be attributed to discrepancies
among the data sets. A list of wells from which water analyses were obtained is found in
Table I-I. Additional details concerning the solutes analyzed at each well, the dates of
sample collection, and the methods of chemical analyses are found in Chapters 2, 4, and 6
and in the references cited in these chapters.
Siegel et al. (see Table 2-2) tabulate the values used for their calculations dealing with the
concentrations of major and minor elements for waters in the Rustler Formation. Data
from Table 2-2 were used in the saturation index calculations, factor analyses, and element
ratio contours discussed below. Robinson (1988), Lambert and Harvey (1987), and Siegel
et al. (Chapter 2) describe the different data sets examined and the development of a
critical evaluation procedure to determine the criteria for acceptable values.
Bodine et al. (Chapter 4) used the SNORM computer code (Bodine and Jones, 1986) to
evaluate data for their hydrochemical study. Their final data base for the Rustler
Formation includes 161 chemical analyses from 70 sites representing 107 horizon-site
1-31

Chapter 1 (Siegel and Lambert)
sampling points (see Table 1-1). The authors compiled data for the calculations from a
variety of sources, including the data compiled in Robinson (1988), analyses reported in
previous WIPP Site characterization and USGS Technical File reports, and new chemical
analyses by USGS staff. In several cases, data from samples rejected by Robinson (1988)
or Lambert and Harvey (1987) were accepted by Bodine et al. for use in calculating salt
norms.
1.3.2 Evaluation of Oxidation-Reduction Potential and Occurrence ofOrganic Constituents in the Culebra
A data set from the WIPP Water Quality Sampling Program (WQSP) was independently
evaluated by the IT Corporation and used in the calculations of Eh described below and in
Chapter 6. Analyses of concentrations of members of four oxidation-reduction ("redox")
couples and platinum electrode potential measurements were obtained from 21 wells in the
Culebra during the period from 1985 to 1987 and used to calculate apparent Eh values (see
Table 1-1). In most cases, the concentration of one of the members of a specific redox
couple was below the limit of detection and only an upper or lower bound for the Eh could
be calculated. Robinson (Appendix 6A) independently evaluated these redox data and
compared them to a larger data set collected between 1985 and 1989.
Final groundwater samples from 21 Culebra wells listed in Table 1-1 were analyzed for
total organic carbon (TOC) in acidified solutions passed through a 0.45 micron filter.
Details of the sample collection and analytical techniques are found in Chapter 6.
1.3.3 Mineralogical Data
Mineralogical data were obtained from 12 cores from three east-west traverses in the
Culebra member. Over 100 samples were analyzed by optical microscopy, quantitative
x-ray diffraction (XRD), and x-ray fluorescence. Core from one borehole (WIPP-12) was
examined to obtain a representation of the textural variations in the Culebra, while core
from another (WIPP-19) was examined both texturally and mineralogically to obtain some
1-32

Chapter 1 (Siegel and Lambert)
degree of representation of the entire Rustler near the center of the WIPP Site. Sample
locations are listed in Table 1-1 and analysis techniques are summarized in Chapter 3. As
discussed in more detail in Chapter 3, the samples examined in this study were from intact
core that may not be representative of the principal water-bearing zones. The rock most
recently in contact with Culebra groundwater is commonly a small fraction of the dolomite
member and is likely to be reduced to rubble by partial dissolution, and hence be poorly
recovered from the borehole.
1.3.4 Isotopic Data
Several isotopic studies have been conducted on rocks and waters from the Rustler
Formation and related units. Lists of sample locations for each isotope are found in Table
1-1. Data pairs for 6D_618
0 are available for water samples from 70 localities: six from the
Magenta, 21 from the Culebra, 17 from the RustlerjSalado contact zone, three from the
Dewey Lake, four from the confined portion of the Capitan limestone, 12 from the vadose
Capitan, one from the Triassic, one from alluvium, and five from the surface. The total
number of replicate data-pairs, whether they represent replicate samplings at different
times or replicate analyses of the same sample, was 86. Ten of these data pairs are for
samples suspected to be nonrepresentative. A description of the samples, analytical
methods, and criteria for judging sample quality is given in detail by Lambert and Harvey
(1987). Carbonates from the Magenta (five localities) and Culebra (nine localities) were
analyzed for their 613
C and 618
0 values in a total of 43 replicates (Lambert, 1987; Lambert
and Harvey, 1987). Values for 6D of the water of crystallization in gypsums from selenite
veins in the Dewey Lake and veins and alabaster from the Rustler have been measured at
11 horizon-sites representing five different boreholes (20 total replicates). Values for 613
C
and 14C (percent-modem-carbon) have been obtained from waters from 16 horizon-sites
representing 12 different wells (21 replicates); tritium measurements are available for
seven wells (eight replicates). These are described in detail by Lambert (1987). Total
uranium concentrations and uranium-isotope activity ratios are available for waters from
five RustlerjSalado contacts, nine Culebra locations, two Magenta locations, one potash
mine, one rainfall, and one surface spring locality (Lambert and Carter, 1987). Finally, 38
1-33

Chapter 1 (Siegel and Lambert)
gypsums and anhydrites and 29 carbonates from Dewey Lake veins, RustIer veins and beds,
Salado and Castile beds, caliche, and spring deposits have been analyzed for their 87Sr/86Sr
ratios (Brookins and Lambert, 1988).
Lambert and Harvey (1987) proposed that the same criteria for evaluating the validity of a
water sample used in determining a representative solute composition were also applicable
to stable-isotope studies. The same criteria described by Robinson (1988) for judging the
representativeness of the major solute composition of a water sample, however, are not
applicable to certain trace isotope studies, such as radiocarbon. Many of the water samples
used in the radiocarbon studies reported by Lambert (1987) and summarized here were
collected according to the same criteria for major solutes. However, despite evaluation by
such criteria, 12 of the 16 radiocarbon samples were found to be mixtures of native dis
solved carbon and contaminant modern carbon introduced during the development of the
sampling boreholes.
Other trace isotopes in groundwaters, such as uranium, have required still different sam
pling criteria. Barr et at. (1979) reported the correlative changes in total dissolved uranium
and 234U;238U activity ratio with total iron. Lambert and Carter (1984) illustrated the
effects of introduced contaminants on the uranium-isotope composition of water from a
flowing well. It is tentatively concluded that preferred sampling criteria for 234U;238U
studies are similar to those for metallic trace elements. The transient changes in such
elements (e.g., iron) during a sampling period are discussed by Robinson (1988).
1.4 RESULTS OF GEOCHEMICAL STUDIES
1.4.1 Major/Minor Element Ratios and Correlations
In simple hydrologic and hydrochemical systems, spatial trends in element concentrations
and ratios can be used to suggest flow directions and to delineate potential sites of recharge
or interaquifer leakage. Average concentrations of major and minor elements in Culebra
1-34

Chapter 1 (Siegel and Lambert)
waters were calculated from data sets obtained from the Sandia National Laboratories
(SNL), IT Corporation, USGS, and New Mexico Environmental Evaluation Group (EEG)
sampling and analysis programs. These average values are given in Table 2-2. Figure 1-8
shows contours of sodium concentration over the study area. Actual values for each well
are also given. Contour placement is controlled by several factors, including the selected
contour interval, smoothing factors, and radius of influence of the data points. The loca
tion of each contour is influenced by several data points; therefore, there may be
discrepancies between the placement of contour lines and the concentrations at some well
locations. The contours for sodium are similar to those for chloride, total dissolved solids
(IDS) and fluid density.
The spatial trends in interelement correlations were examined by contouring ratios of
Br/Cl, Na/Cl, Na/K, Sr/Ca, and other minor/major solute ratios. Results of these calcula
tions are given in Chapter 2. The important features that emerge from these plots are
given below:
The Na/Cl molar ratio in the southern portion of the site is higher than would be
produced by simple dissolution of halite, suggesting the potential contribution by
dissolution of Na-silicates in this area.
The K/Na weight ratios, Mg/Ca molar ratios, and Na and Sr concentrations are
anomalously high at WIPP-27 and WIPP-29, suggesting that contamination by potash
refining operations is important at these locations. Contours for the K/Na weight ratio
are shown in Figure 1-9. Names for the wells indicated in Figure 1-9 are given in
Figure 1-8.
Element ratios and concentrations of several elements are anomalous at P-14 when
compared to water compositions at the surrounding wells. Concentrations of Ca, Sr,
and I are anomalously high, and the concentration of SO4 is anomalously low at this
site.
1-35

Chapter 1 (Siegel and Lambert)
30,000
20,000
'H-563,000
'0,000
• Engle Well190
WIPP-308600
I
H-9·150
• WIPP-2815,000
DOE-l.-146,000
~~-t-+-'K 50,000H-ll
39,000
H-12.50,000
40,000H-7•210
WIPP SiteBoundary
.WIPP-27
H-6
WI PP-25 18,00't0:.-__,e...----Jc.....,~_./
3250 •
·WIPP-13~319,000 • 18,000
• WIPP-26 P-14 ~3500 4100 •
N
;
.WIPP-29
0 2 3 4 mi
I Ii I
r
0 2 4 6 km H-854•
TRI-6341-27-0
Figure 1-8. Contours of sodium concentration (mgjL) in study area. The WIPP Siteboundary is indicated for reference (from Siegel et aI., Chapter 2).
1-36

Chapter 1 (Siegel and Lambert)
0.025
WIPP Site
iUndary
·0.030
.0.023
.0.0290.048.
0.024.0.024 •0.024.
0.0370.029·
0.023
0.010•
0.026 •·0.033 0 2 3 4 mi
I !I I
!
0 2 4 6 km
N
0.230•
TRI-6341-40-0
Figure 1-9. Contours of ratios of KINa concentrations in study area (from Siegel et aI.,Chapter 2).
1-37

Chapter 1 (Siegel and Lambert)
The Cl/Br ratio is highest in Nash Draw, intermediate through the center of the WIPP
Site, and lowest in P-14 and H-4.
1.4.2 Definition of Hydrochemical Facies of Culebra GroundwaterBased on Relative Proportions of Major Solutes
Based on the major solute compositions presented in Table 2-2, four hydrochemical facies
are delineated in Figures 1-10, 1-11, 1-12, and 1-13. Compositions of waters at locations
indicated by solid circles in Figure 1-10 are described in Figure 1-13. Compositions of
several other wells (see Chapter 4) indicated by open circles were not included in the
original data set used to define the facies, but their compositions are consistent with the
facies borders. The facies borders indicated in Figure 1-13 are located by reference to the
wells, whereas the boundaries of the halite dissolution zones are located by reference to
control points (Snyder, 1985) plotted by Lappin (1988, Figure 4.1.2).
Zone A contains a saline (about 3.0 molal) NaCl brine with a Mg/Ca molar ratio between
1.2 and 2.0. This water is found in the eastern third of the site; the zone is roughly coinci
dent with the region of low transmissivity. On the western side of the zone, halite in the
Rustler has been found only in the unnamed lower member; in the eastern portion of the
zone, halite has been observed throughout the Rustler (see Figure 1-13).
Zone B contains a dilute CaSO4-rich water (ionic strength <0.1 m) in the southern part of
the site. Mg/Ca molar ratios are uniformly low (0.4-0.5). This zone is coincident with a
high-transmissivity region; halite is not found in the Rustler in this zone.
Zone C contains waters of variable composition with low-to-moderate ionic strength (0.3 to
1.6 m) in the western part of the WIPP Site and the eastern side of Nash Draw. Mg/Ca
molar ratios range from 0.5 to 1.2. This zone is coincident with a region of variable trans
missivity. In the eastern part of this zone, halite is present in the lower member of the
Rustler; on the western side of the zone, halite is not observed in the formation. The most
1-38

Chapter 1 (Siegel and Lambert)
(H-l0) •
A
WIPP Site/Boundary
eEngle Well
eWIPp-30
-~-
c,.'
DOE-2. ,/H-6,......-..;.;;:..:...-:r'---. H-5
.WIPP:';"3/
\.... • WIPP-19H-16. "
(H-2) •• H-l .H-15
H-3. IH-14. • eOOE-1
J •H-11
,II\), ,11\11 ,~"}\\\,.
't'
P14.
B
WIPP-2S. ~,$-\'>
!it" "'1;,,,,
-~-
~.t' ;nome-a~\. Gnome-4 m Ll Gnome Shaft
~. 0
Gnome-1;p
"t"$ ~,
J;
"'t," ,'I-}.1.,%
o
N
South Well 0
• (FR-l0)
'I'"~
,It''lt.,\":
,,1;
4,
f,,' jl)lj:,c'
~j"ill'lIII".qll"'I!tI"
WIPP-27. iIII~
Q/'I
/X- /
CO .//
/' WIPP-26;)~,'?,h
~ ./WIPP-29 e ./
/
Two-Mile Well 0 ~'
oIo
1 2 3 4 mi A,I I II I I
2 4 6 km -'",1',11
eH-8 A, B, C. D Facies
-'- Facies Border
::J. 0,. Well Location
TRI-6331-78-1
Figure 1-10. Hydrochemical facies of the Culebra dolomite (from Siegel et aI., Chapter 2).
1-39

Chapter 1 (Siegel and Lambert)
o Facies Ao Facies Bt'J. Facies C• Facies 0
....-- 20,/ -,
/ H-6 '",I H.4 '::~-2\ H-3/ WIPP,~9I WI PP-30........~ J H-58
H 2 __ " H-5C.- ~ H-11 §\ H-12 ....
\WIPP-27 \ DOE-1,
\ 20 WIPP-28,..... /
....... _--_/
100 ----
----/ ....." DOE-2 '"
~/H-6 tyH-3WIPP-2."
H-' I \ ""IL, \~ I \
/; 0 I WIPP-27 O---P-17 ~ \,.,; 0 ~ I \ WIPP-290" H-70\ ~ 80.A. .- 80'
<0 < \ ~ I~ \ H-5C. H-11, H-5B~ H-12 '~ \ 00E-1 /
" 90 ho/........ _--""'"
/120
- .....,/ "-~ / "'" / 10 WIPP-2. \
\I WIPP-30\
H-3 WIPP-26 \I WIPP-29 WIPP-25o ~1' I~~ I
~ 20/S WIPP.27/.. I('\ H-ll, H-SB, H-seo H-12 /.
cj),........ DOE-1/,....... _--
H-2
\ I H-''P¥d/'Jo/6I-'>f-!:.~I++-.¥~1: '"
50;---':"-- 100
TRI-6330-35-1
Figure 1-11. Trilinear diagram for Culebra groundwaters (from Siegel et aI., Chapter 2).
1-40

Chapter 1 (Siegel and Lambert)
Ionic Strength (molal)
TR 1-6344-97-0
Figure 1-12. Relationship between Mg/Ca molar ratio and ionic strength (molal) forCulebra groundwater samples in different hydrochemical facies (from Siegelet a!., Chapter 2).
1-41

Chapter 1 (Siegel and Lambert)
•
•
-~
c
•
•
B
. :::;
OO[Jo
f4?~./%
W{
D
N
4.?1,'jlJl~,.
~j"lIltIIJ""III""'I''''
• III ~
/Q:-
</7/
X- /c:, /
//
~ /..//
•
A,B,C,D Hydrochemical Facies
C ,0 •• Well location
INo Halite--~ In Rustler
-.- Facies Border
,....--------------, ,II" ,~--
ITTTTTTTTTITlI Ha lite inIilllilillWJ lower member
4 miI
1:\::::\::: :«1 ~~~tl::e~:::::r
I~~~I Halite in Forly-niner,;; Tamarisk, and lower
member
• oIo
I2
2
I4
3
I6 km
TR 1-6344-551-0
Figure 1-13. Relationship between occurrence of halite in the Rustler and hydrochemicalfacies of the Culebra dolomite.
1-42

Chapter 1 (Siegel and Lambert)
saline (NaCl-rich) water is found in the eastern edge of the zone, close to core locations
where halite is observed in the Tamarisk Member.
Zone D, a fourth zone comprising wells WIPP-27 and WIPP-29, can be defined based on
inferred contamination related to potash refining operations in the area. Waters from
these wells have anomalously high salinities (3-6 m) and K/Na weight ratios (0.22) com
pared to other wells at the site (0.01-0.09). At WIPP-29, the composition of the Culebra
water has changed over the course of a 7-year monitoring period. The Mg/Ca molar ratio
at WIPP-29 is anomalously high, ranging from 10 to 30 during the monitoring period.
The chemical characteristics of each of the facies are described by the Piper (trilinear)
diagram shown in Figure 1-11. This plot summarizes relationships between the major
solutes in the Na-K-Mg-Ca-CI-S04-C0
3system. The diagram shows the relative propor
tions of the ions on an equivalents/liter basis. Relative proportions of cations and anions
are displayed separately in the triangular plots in the bottom half of the figure. In the
rhombus in the upper portion of the diagram, the ratio of divalent to monovalent cations
and the ratio of chloride to sulfate + carbonate + bicarbonate are shown.
Compositions of Culebra waters from Zone A have nearly identical ionic proportions and
plot on the same location in the graph near the Na-CI corner. They are distinguished from
waters in Zone C by their higher Mg/Ca ratio and ionic strengths (see Figure 1-12). Dilute
groundwater from Zone B plot near the Ca-S04
corner and water from Zone C cover a
wide area in the plot. Waters from Zone D have similar ionic proportions to those of Zone
A and are distinguished primarily on the basis of salinity and K/Na ratio, parameters that
are not shown in Figure 1-11.
1.4.3 Principal Component Analysis of Rustler GroundwaterCompositions
In the previous section, hydrochemical facies for Culebra groundwaters were defined using
the relative proportions of the concentrations of seven major solutes. These solute ratios
1-43

Chapter 1 (Siegel and Lambert)
can be represented by a trilinear plot as shown in Figure 1-11. To show relationships
among the 17 independent chemical variables presented in Table 2-2, the method of
principal component analysis (PCA) was used. This method summarizes the relationships
among the variables and shows how these relationships differ for each water composition.
The principal components or factors identified from PCA can be thought of as hypothetical
compositional end members (Q-mode PCA) or can be used to express the relationships
among the compositions in terms of a small number of independent underlying correlations
(R-mode PCA). This information can be used to refine the definition of hydro
chemical facies and to suggest the nature of chemical reactions that control groundwater
composition.
In R-mode PCA, several kinds of correlations are possible. For example, two cations that
are dissolved from the source mineral will be positively correlated, whereas elements
whose concentrations are inversely related by a solubility product will be negatively corre
lated. Appendix 2B explains the basic concepts and vocabulary of PCA. The origins of the
factor-loading matrices and factor-score matrices, the significance of factor rotations,
examples of interelement correlations and their possible geochemical interpretations, and
the need for data transformations are explained. Section 2.3.3 describes the application of
this technique to waters from the Culebra dolomite and related rock units. The following
section is a summary of that work.
Two data sets were used in the analysis. Population 1 included data for Ca, Mg, K, Na, CI,
SO4' B, Li, Si02
, Br, Sr, alkalinity, and pH from 22 samples from the Culebra. Population 2
included data from wells for which analyses of the above elements plus Fe, Mn, F, and I
were available (20 samples from the Culebra, Magenta, Dewey Lake, and Bell Canyon
units). In most respects, the results for the two populations were similar.
1-44

Chapter 1 (Siegel and Lambert)
1.4.3.1 Unrotated Principal Components
R-mode PCA was carried out using the PCA programs in SAS (Statistical Analysis System
Institute, 1982). Three principal components (factors) account for approximately 96% of
the total variance of population 1 and are shown in Figure 1-14. Factor loadings are listed
in Table 2-7. Factor 1 accounts for approximately 67% of the total variance of the data set.
It is characterized by high positive correlations (loadings) for all of the variables except pH,
bicarbonate alkalinity, and silica. The factor accounts for most of the variance of sodium
and chloride, and it is likely that this factor represents addition of solutes by dissolution of
evaporite minerals. For this reason, the factor is referred to as the "salinity factor" in this
report.
Factor 2 accounts for approximately 18% of the variance of the data set. It is characterized
by large loadings for pH, bicarbonate alkalinity, and silica and boron concentrations. This
combination of elements may reflect sorption and silicate and carbonate diagenesis. It is
referred to as the "silicate/bicarbonate factor" in this report.
Factor 3 accounts for approximately 11% of the total variance and exhibits high positive
loadings for calcium and strontium and a high negative loading for sulfate. This element
association probably reflects dissolution/precipitation of gypsum and is referred to as the
"sulfate factor" in this report.
1.4.3.2 Rotated Principal Components
As discussed in Appendix 2B, several alternative orientations of the principal component
axes may be equally efficient in describing the variance in the data set. The unrotated
principal components described in the previous section were compared to those obtained
from varimax, equamax, and quartimax rotational schemes to determine if any element
associations were common. It was found that the factor-loading matrices from all rota
tional schemes contained the same key element associations described above for the
unrotated components. The loading matrices differed primarily in the relative loadings of
1-45

Chapter 1 (Siegel and Lambert)
1.00 r--=..,-=,----------------==-------,
0.50Cl<:'C.,0...J 0.00013.,"-
-0.50
0.50Cl<:'C.,0...J 0.00013.,"-
-0.50
Factor 167% (Salinity)
Na Cl Ca Mg K
Factor 218% (Silicate/Bicarbonate)
li
-1.00 '-------,----------,----::-:-..".,---------'Na CI Ca Mg K Sr pH HC03 504 Si02 Br B Li
1.00
0.50Cl<:'C.,0...J 0.00-013.,"-
-0.50Factor 311% (Sulfate)
-1.00Na CI Ca Mg K Sr pH HCO J 504 Si02 Sr B U
TRI-6344-113-0
Figure 1-14. Unrotated R-mode factor loadings for factors 1, 2, and 3 for Culebragroundwaters (population 1).
1-46

Chapter 1 (Siegel and Lambert)
other elements and the variance explained by the salinity, silicate/bicarbonate, and sulfate
factors.
The compositions of the samples in terms of the factors are described by the factor scores.
Relationships between varimax factor scores for the salinity and sulfate factors are plotted
in Figure 1-15, which also indicates hydrochemical facies of each well. Factor scores are
listed in Table 2C-2. Figure 1-15 shows that the first two principal components can be used
to delineate the same groups of wells identified in Figures 1-10 through 1-12. Thus, the
definition of hydrochemical facies based on the proportions of major solutes is supported
by correlations among the major and minor elements examined in this study.
1.4.3.3 R-mode Factors Obtained after Partialling Out Total Dissolved Solids
The three major factors obtained from the R-mode analysis described above are strongly
affected by halite dissolution. Solutes are added directly from the halite, or indirectly
because the solubilities of sulfate and carbonate phases increase as the ionic strength
increases (see Section 1.4.5). A second R-mode PCA examined interelement correlations
independent of the effects of halite dissolution. In this analysis, the principal components
of the partial correlation matrix with respect to TDS concentration were extracted. A more
detailed description of the procedure is in Appendix 28.
Five factors accounted for 99% of the variance that remains after the TDS were partialled
out. In Figure 1-16, the variables with the highest loadings for each factor are identified.
Factor loadings are plotted only for elements that have important geochemical significance
or that strongly influence the orientation of the factors (loading >0.23). The complete
factor-loading matrix is found in Table 2-8. Factor IB is dominated by the negative correla
tion of Ca and Sr with sulfate and is suggestive of dissolution/coprecipitation of Sr and Ca
in a sulfate phase such as gypsum or anhydrite. It accounts for 67% of the total variance of
Ca, 35% of the total variance of Sr, and 24% of the total variance of sulfate. This factor is
similar to the sulfate factor (3) described previously. Factors 2B, 4B, and 5B are similar to
the silicate factor (2) described previously and contain all or portions of two negatively
1-47

Chapter 1 (Siegel and Lambert)
I I T T I I I
[OJ P-14 • Culebra A
!"'I Culebra B
- [OJ Culebra C -
-+- WIPP-27__ CulebraD
-DOE-2 [OJ [OJ H-6B -
WIPP-26 [OJ [OJ H-3B P~7 .ll-12.H-5e
WIPP-25 [OJ DOE-1. .H-5B
WIPP-30 [OJ WIPP-28
H-7BIiiiIH-2AI:iiiI [OjH-4B
- IiiiiI Engle Well -H-9B
H-8BIiiiI
I I , , I I~IPP-~
,
3.0
2.0
$~::l
~ 1.0..~
0u
<J)
c(N~ 0.00u.....
-1.0
-2.0-2.0 -1.4 -0.8 -0.2 0.4 1.0 1.6 2.2 2.8
Factor 1A Score (Salinity)
TAI-6344-79-0
Figure 1-15. Relationship between varimax R-mode factor scores for factors lA and 2A forCulebra groundwaters (population 1).
1-48

Chapter 1 (Siegel and Lambert)
Mg pH HCO J Si0 2 B Li
0.50
0.50
1.00,-----------,
1.00 ,-----------,
-0.50
IFactor 28 I-1.00 L~~__-===--.J
1Factor 48 I-1.00 L:::=== ~
Na CI Mg pH B
0.50
0.00
-0.50
IFactor 3B I-1.00
Na CI B,
1.00
0.50
0.00
-0.50
IFactor 58 I-1.00
HC03 Si02 B Li
1.00
><~ 0.50m-E 01.- C~ .-m">m.. 0 0.00" ....0 ~
EB, ua: m... -0.50
-1.00Ca 5, SO,
1.00
~
.<!-m-E 01'i: Cca:g> m.. 0" ....o ~
EB, ua: m...
~
)(cfm-E 01.- C~ .-m"> m.. 0" ....o ~
EB, ua: m...
TRI-6344-112-0
Figure 1-16. Varimax R-mode factor loadings of key elements for factors 1B, 2B, 3B, 4B,and 5B obtained from partial-correlation matrix with respect to TDS forCulebra groundwaters (population 1).
1-49

Chapter 1 (Siegel and Lambert)
correlated groups of variables. One group involves the correlation of Mg, K, bicarbonate
alkalinity, and silica; the other group contains pH, B, and Li. This pattern of element
associations may be due to a combination of processes including sorption, ion exchange,
carbonate diagenesis and silicate diagenesis and is discussed in more detail in Section 2.4.3.
In another factor extracted from population 2, variance in Mg was associated with a large
amount of the variance of F and SO4. As discussed in Chapter 2, this factor may indicate
the presence of sellaite (MgF2) contained in anhydrite. Descriptions of the other factors
and representation of the compositions of the water samples in terms of the factors are also
in Chapter 2.
The correlations of the major elements described by the PCAs confirm the definition of
hydrochemical facies described in previous sections. The correlations of the minor ele
ments, as revealed by the PCA, provide insight into the identity of the minerals that control
the concentrations of Sr, F, Si, B, and Li. The calculations suggest that Sr is present in
sulfates, that F is present as MgF2 in anhydrite, and that concentrations of Si, B, and Li are
affected by reactions involving clay minerals.
1.4.4 Classification of Rustler Groundwaters by Normative SaltAssemblages
Bodine et al. (Chapter 4) suggest that recasting the chemical composition of a water into a
"salt norm" is a useful diagnostic tool for inferring possible origins of the water's solutes.
The normative salt assemblage (or "salt norm") is the quantitative equilibrium assemblage
of salts that would precipitate from a natural water if it were evaporated to dryness under
ideal equilibrium conditions at 25 0 C and atmospheric pressure. The normative as
semblage yields a diagnostic chemical-mineralogical characterization of the water that
indicates the nature of possible water/rock interactions in subsurface environments and
may contribute in determining the water chemistry's evolutionary path.
1-50

Chapter 1 (Siegel and Lambert)
The SNORM computer code (Bodine and Jones, 1986) calculates salt norms based on the
Gibbs Phase Rule, free energy data, and observed low-temperature mineral associations.
Bodine et al. (Chapter 4) applied SNORM to the data set described above that was ob
tained from their independent evaluation of water chemistry data from the Rustler
Formation. Based on these calculations, they identify four end-member norms in brines
collected from the WIPP Site:
Type 1 brines contain normative alkaline-earth chloride salts and low Cl/Br « 300)
ratios; these are termed "primitive-diagenetic" norms and may result when connate
waters are involved in dolomitization
Type 2 dilute solutions contain normative alkali-bearing carbonates that suggest dissolu
tion of detrital silicates through carbonic acid hydrolysis in a weathering/recharge zone
Type 3 dilute sulfate-rich solutions are produced when surface-derived (fresh) waters
dissolve anhydrite or gypsum and little else
Type 4 saline halite-rich brines are produced when surface-derived (fresh) waters dis
solve anhydrite or gypsum and halite in the Rustler and upper Salado.
In Chapter 4, Bodine et al. show that the compositions of most waters in the Rustler
Formation can be produced by mixing of the above four end-member brines, types 1 and 4
being the most common. The fluid produced by the dehydration of gypsum may also be a
component of some well waters. Note, however, that most waters of the four types con
sidered by Bodine et al. for which <518
0 and <5D values are available have diagnostically
meteoric stable-isotope characteristics (Lambert and Harvey, 1987; Lambert, Chapter 5).
In the Culebra member, water (which mayor may not be representative of fluid native to
the formation) sampled from P-18 contains the highest proportion of primitive-diagenetic
brine. In the Rustler/Salado contact zone, wells in the center of the WIPP Site (H-S and
1-51

Chapter I (Siegel and Lambert)
H-{i) contain the highest proportions of the "primitive"-norm-type fluids. Water from
WIPP-15 in the Gatuna Formation is dominantly type 2; dissolution of an anhydrite-rich
rock by this water would produce waters like H-7 or H-I, which have strong type 3 signa
tures. Examples of waters with a significant component of type 4 water include H-5 and
DOE-I. According to Bodine et al. in Chapter 4, in both the Culebra and the
RustlerjSalado contact zones, the relative proportion of recharge water to primitive
diagenetic water increases to the north, west, and south of the WIPP Site.
1.4.5 Calculations of Mineral Saturation Indices for Culebra Waters
Mineral saturation indices may provide insight into the nature of chemical processes that
control solute concentrations in groundwaters. Saturation indices in Culebra waters have
been calculated for minerals commonly observed in the Ochoan Series (see Table 1-3).
The computer code PHRQPITZ (Plummer et aI., 1988), which uses the Pitzer model for
ion-interactions, was utilized for these calculations. All water samples are saturated with
respect to gypsum, undersaturated with respect to halite, and with the exception of
WIPP-29 in Zone D, all samples are undersaturated with respect to anhydrite. Dolomite
and calcite saturation indices are variable, indicating both undersaturation and supersatura
tion with respect to the carbonates. The relationships between saturation indices and ionic
strength for several minerals are shown in Figures 1-17, 1-18, and 1-19.
As discussed by Siegel et al. in Chapter 2, the relationships among the saturation indices,
pH, and calculated pC02
suggest that the loss of CO2
gas from the water during sample
collection may be responsible for part of the apparent supersaturation of the carbonates.
Other potential sources of error in the calculations of carbonate equilibria include uncer
tainties in the pH measurements due to the use of an activity scale inappropriate for saline
Na-Cl brines, errors in laboratory measurements of major solute compositions, and the
choice of an inappropriate value for the Gibbs free energy of formation for dolomite to
calculate the saturation indices.
I-52

Table 1-3. Saturation Indices for Common Evaporite Minerals Calculated by PHRQPITZ
Ionic Charge1 Saturation Indices2Strength
aH 0Balance log
Well Date Lab (molal) --I1!L Error ....8n.!L ~ ....QQL -.lim... -lill- ....!lli.- ~2-2-
Culebra:
DOE-1 4/85 UNC 2.53 7.10 0.923 9.05E-03 -0.12 -0.34 -0.13 0.03 -1. 26 -0.62 -2.60
DOE-2 3/85 UNC 1.19 7.00 0.968 -6.52E-02 -0.18 -0.21 -0.14 0.01 -2.03 -0.77 -2.33
ENGLE 3/85 UNC 0.09 7.40 0.999 1.00E-03 -0.22 0.22 0.38 0.00 -6.02 -0.68 -2.44
H-2A 4/86 UNC 0.27 8.00 0.994 -4.33E-03 -0.25 0.45 0.78 -0.04 -3.49 -0.52 -3.38
H-3B3 2/85 UNC 1.08 7.40 0.971 -2.53E-03 -0.20 -0.08 0.12 0.00 -2.11 -0.65 -2.86H-3B3 6/84 UNC 1.08 7.40 0.972 -2.56E-02 -0.15 -0.02 0.23 0.04 -2.13 -0.59 -2.83
~H-4B 5/81 UNC 0.455 8.00 0.991 -1.49E-02 -0.17 0.36 1.07 0.04 -3.13 -0.13 -3.35, H-4B 7/85 UNC 0.42 7.70 0.991 4.14E-03 -0.20 0.07 0.46 0.01 -3.17 -0.45 -3.04V1w H-4C 8/84 UNC 0.45 7.80 0.991 4.82E-03 -0.20 0.19 0.77 0.01 -3.12 -0.26 -3.11
H-5B 6/81 UNC 2.993 7.90 0.906 -1.18E-01 -0.10 0.71 2.12 0.04 -1.08 0.57 -3.21H-5B 8/85 UNC 2.97 7.40 0.908 8.46E-02 -0.11 -0.02 0.68 0.03 -1.09 -0.15 -2.86H-5C 10/81 UNC 3.002 7.90 0.906 -1.20E-01 -0.08 0.75 2.20 0.05 -1.08 0.61 -3.17
H-6B 5/81 UNC 1.178 7.00 0.969 2.24E-04 -0.15 -0.04 0.16 0.05 -2.05 -0.64 -2.16n::r
H-6B 9/85 UNC 1.13 6.90 0.970 -1. 28E-02 -0.20 -0.16 -0.07 -0.01 -2.08 -0.75 -2.07 ~(b...,
H-781 3/86 UNC 0.089 7.20 0.999 -4.09E-04 -0.23 0.07 0.01 -0.01 -5.86 -0.90 -2.20 ~
---enH-8B 1/86 UNC 0.083 7.60 0.999 -1. 97E -04 -0.23 0.33 0.66 -0.01 -7.45 -0.52 -2.70 0'
OQ
!!.H-9B 11/85 UNC 0.087 7.40 0.999 3.70E-04 -0.22 0.24 0.37 0.00 -6.23 -0.71 -2.43 r.>
§.
£;'g.(b...,...'-'

Table 1-3. Saturation Indices for Common Evaporite Minerals Calculated by PHRQPllZ(Continued) n
::r
Charge l Saturation Indices2.§
Ionic...(b
Strength Balance log...,
aH 0......
Well Date Lab (molal) -1?lL Error ....8n1L ~ ....QQL ~ ....!!tl.- ....!lli... -l&Q2 ""'-2- (/)~.
(b
H-lIB3 6/85 UNC 2.23 7.20 0.934 -3.60E-02 -0.13 -0.17 0.12 0.03 -1.39 -0.54 -2.63 I)Q
!!.~
H-12 8/85 UNC 2.72 7.20 0.916 4.42E-02 -0.12 -0.15 0.34 0.02 -1.18 -0.35 -2.61 ::>0-
P-14 2/86 UNC 0.582 6.80 0.988 -9.06E-03 -0.15 0.14 0.18 0.05 -3.01 -0.81 -1.81 r3cr"
P-17 3/86 UNC 1. 67 7.50 0.953 -3.61E-02 -0.18 0.10 0.73 0.00 -1.70 -0.22 -2.90(b...,...'-'
WIPP-25 8/80 UNC 0.26 6.90 0.995 3.21E-03 -0.24 0.03 0.04 -0.03 -3.56 -0.84 -1.69
WIPP-26 8/80 UNC 0.329 6.90 0.993 -5.12E-03 -0.18 -0.04 -0.10 0.03 -3.36 -0.91 -1.86WIPP-26 8/80 G 0.330 6.90 0.993 -3.71E-02 -0.23 0.09 0.14 -0.02 -3.32 -0.79 -1.84
...... WIPP-26 11/85 UNC 0.371 7.10 0.992 -9.29E-03 -0.20 0.10 0.18 0.02 -3.22 -0.77 -2.14,tJ\-I'- WIPP-27 9/80 UNC 2.573 6.30 0.922 -7.62E-02 -0.12 -0.38 -0.40 0.03 -1.29 -0.87 -1.33
WIPP-28 9/80 UNC 0.903 6.50 0.976 -2.42E-02 -0.26 0.16 0.53 -0.07 -2.27 -0.48 -0.76
WIPP-29 8/80 UNC 4.908 6.10 0.840 -2.06E-Ol 0.02 -0.72 0.01 0.09 -0.61 -0.21 -0.87WIPP-29 8/80 G 4.472 6.10 0.853 -2.74E-Ol -0.15 -0.45 0.61 -0.07 -0.64 0.21 -1.10WIPP-29 12/85 UNC 6.57 5.90 0.773 -2.070-01 -0.01 -1.25 -0.56 -0.01 -0.20 -0.16 -0.75
WIPP-30 9/80 UNC 0.582 8.80 0.986 -2.50E-02 -0.18 1. 12 2.37 0.02 -2.73 0.41 -4.41

Table 1-3. Saturation Indices for Common Evaporite Minerals Calculated by PHRQPITZ(Continued)
0.20 8.00 0.997 -2.79E-03 -0.16 0.52 1.02 0.06 -4.04 -0.34 -3.47
IonicStrength
Date Lab (mol a1) ....Iili..- aH2~
4.89E-04 -1.88 0.37 0.67 -1.66 -7.52 -0.54 -2.39
log~2
Saturation Indices2
8.68E-03 -0.13 -0.17 -0.40 0.00 -1.09 -1.07 -1.96
ChargelBalanceError ...An.!L
2.95 6.60 0.907
0.011 7.70 0.9991/86 UNC
7/85 UNC
7/85 UNC
Well
Magenta:
H-3Bl
DeweyLake:
TWIN-P
BellCanyon:
.... DOE-20
VIVI
1. Charge balance error (CBE in equivalents per kilogram of water) is calculated as: CBE (eq/kg H20) =
~ cations (eq/kg H20) - ~ anions (eq/kg H20)2. Mineral names: Anh = anhydrite; Cal = calicite; Dol = dolomite; Gyp = gypsum; Hal = halite; Mag =
magnesite. n::r{l(b........---C/).
{2.
i::::0.'-'
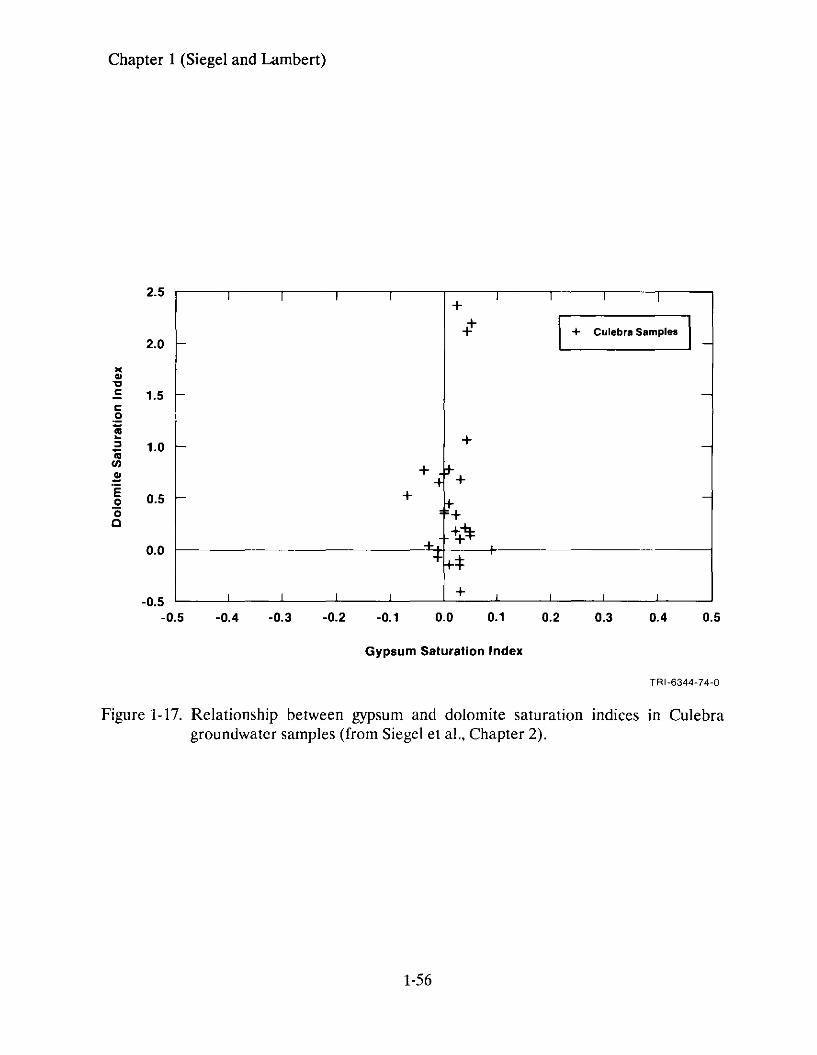
Chapter 1 (Siegel and Lambert)
I I I I
+I I I I
-t I + Culebra Samples I_f-
f--- -
f- + -
+.+~+f--- +
~+-
... ~\"\+f+*
I I I I + I I
2.5
2.0
)(..".= 1.5c:.E1;;~
::J 1.0-to(J)
.!·E
0.50'00
0.0
-0.5-0.5 -0.4 -0.3 -0.2 -0.1 0.0 0.1 0.2 0.3 0.4 0.5
Gypsum Saturation Index
TR 1-6344-74-0
Figure 1-17. Relationship between gypsum and dolomite saturation indices in Culebragroundwater samples (from Siegel et aI., Chapter 2).
1-56

Chapter 1 (Siegel and Lambert)
+ +0
-1Q.~
l'~
-2Q.
«-'"oS! -3
".."Cl: -4l:.20; -5~
:l0;U)
~-6
+iii:I:
-7
+-8
0
+r+'*'
+-tt'-
1
+
2
+ + + *
3 4
I + Culebra Samples I
5 6
Ionic Strength (molal)
TRI-6344-102-0
Figure 1-18. Relationship between halite saturation indices and ionic strengths of Culebragroundwater samples (from Siegel et aI., Chapter 2).
1-57

Chapter 1 (Siegel and Lambert)
0.6I I I I I I
-0.•~~
Q.0( 0.4 f- -~
Dl.2
"'".., 0.2" -
",~ +i;j~
~t +:';. + *+ -t:> f'.i;j 0.0 or",Ul
E +!f'.6 i;.:>.. 6
Q. 6 M... -0.2 ~6 d' f'.Cl is..., 0. 6
"..~'<:.., -0.4 - -... + Gypsum.s:::
" 0 Anhydrite0(
-0.6 I I I I I I
0 1 2 3 4 5 6 7
Ionic Strength (molal)
TRI-6344-96-0
Figure 1-19. Relationship between anhydrite and gypsum saturation indices (states) andIOmc strengths of Culebra groundwater samples (from Siegel et aI.,Chapter 2).
1-58

Chapter 1 (Siegel and Lambert)
The degree of carbonate mineral saturation independent of the effects due to
CO2
outgassing can be determined by examining the value of the saturation index (51)
expression:
2 51 I' - SId I . .ca cIte 0 omite
The value of this expression is independent of the uncertainty in the carbonate ion activity
and equals zero when the solution is saturated with respect to both calcite and dolomite.
Figure 1-20 shows that the value of the saturation index expression for the Culebra waters
decreases as a function of ionic strength. This means that once the effects of the CO2
outgassing are corrected for, many of these waters are either supersaturated with respect to
dolomite and/or undersaturated with respect to calcite. The degree of disequilibrium
increases with ionic strength.
1.4.6 Partial Equilibrium Model for Major Solutes
In Chapter 2, Siegel et al. suggest that the solute relationships described in the preceding
sections might be indicative of a partial equilibrium system. In a partial equilibrium
system, solution/mineral equilibria shift nearly reversibly in response to an irreversible
process (Helgeson, 1968; Plummer, 1984). Increase of salinity in Culebra waters due to
dissolution of evaporite salts in adjacent rock units is an irreversible chemical reaction
process affecting the water chemistry. The increase in salinity changes the apparent
solubilities of carbonates and sulfates. As shown in Figure 1-21, the solubilities of
dolomite, calcite, and gypsum increase with salinity up to 3 molal ionic strength and then
decrease. Thus, even if the saturation indices for these minerals are near zero, the waters
may still be capable of dissolving significant amounts of these phases in response to salinity
increase.
1-59

Chapter 1 (Siegel and Lambert)
0.2 r-------~----- --,----------,--------~
0.0
:t: ++
+ P-14
Runs 1-7
~Eoo -0.2oCIl
I -0.4
j·u~ -0.6~
H-4B(7/85)+ H·4B
+(5/81)H-4C+
+
++
+ WIPP-27
+
+CIlN
-0.8
-1.0o
+•
Culebra Samples
Calculated Values
1 2
Ionic Strength (molal)
3
Run 10
Run 11
4
TRI-6344-101-0
Figure 1-20. Relationship between saturated index expression (2S1 I· - SId I .) andca cite oomlteionic strengths for Culebra groundwaters. Compositions of hypotheticalsolutions calculated by reaction-path simulations described in Section2.4.2.2 are indicated by solid lines (from Siegel et aI., Chapter 2).
1-60

Chapter 1 (Siegel and Lambert)
-2.40..........
Zone...
~
~ICD 16 ;
~_z~n~o "'" -2.80 ...E-- ...
E ...~ i
I· -I""- Zone.. ..." 00
...CD -3.20 A.2
~z~e-1-3.60
0 1 2 3 4 5 6 7
Ionic Strength (molal)
TRI-6344-93-0
Figure 1-21. Relationship between apparent solubility product logO for gypsum and ionicstrength in Culebra water samples. LogO is calculated from the thermodynamic solubility constant logK and the activity coefficients of thereactants (logO = logK -logyCaZ+ - logySO; - Zlog a
HzO)'
1-61

Chapter 1 (Siegel and Lambert)
In Section 2.4.2.2, Siegel et al. use the PHRQPITZ code (Plummer et aI., 1988) to evaluate
a partial equilibrium model for precipitation/dissolution of gypsum, calcite, and dolomite
in the Culebra. The PHRQPITZ code was used to calculate the compositions of waters
that would be produced by several hypothetical reaction paths. Parametric simulations
were carried out to determine the effect of certain assumptions about chemical reaction
rates, sources of solutes, and initial conditions on the groundwater compositions. Figures
1-22 and 1-23 compare the changes in concentrations of major solutes along two hypotheti
cal reaction paths with compositions of waters in the Culebra. Both runs assume
equilibrium is maintained with respect to calcite and gypsum, while halite plus accessory
evaporite salts are added to solution. The solutions are closed with respect to atmospheric
CO2
, and initial pC02
is 10-2atmosphere. For Figure 1-22, reaction progress is indicated by
ionic strength. For Run 1, dolomite saturation is maintained (SI = 0), while pure halite is
added to the hypothetical solution. For Run 10, dolomite does not react with solution
(variable saturation index), while halite and leonite plus MgCl2
are added. Mg/Ca molar
ratios of Culebra groundwaters are plotted for comparison. Values for WIPP-29 are not
plotted. For Figure 1-23, reaction progress is indicated by moles of chloride added. Sulfate
concentrations of Culebra groundwaters are plotted for comparison.
Run 1 assumes a simple partial equilibrium model in which pure NaCl is added to the
solution while the groundwaters are maintained at equilibrium with respect to calcite,
dolomite, and gypsum. The concentrations of Ca, Mg, SO4' and C03
change due to the
changes in the solubilities of calcite, dolomite, and gypsum described above. The system is
closed with respect to CO2
gas exchange; the initial partial pressure of CO2
is 10-2
atmos
pheres. As the reaction proceeds, dedolomitization (dissolution of dolomite and
precipitation of calcite) and dissolution of gypsum occur. Figures 1-22 and 1-23 show that
Run 1 does not reproduce the compositions of Culebra waters. This simple model provides
a good fit to many of the observed calcium concentrations; however, concentrations of Mg
and SO4 are considerably below the predicted values.
1-62

Chapter 1 (Siegel and Lambert)
I I /
/
5
4
I
'"
o Culebra A
o Culebra B
6 Culebra C
.. Culebra 0
I I
". " .....
I I
". ' ..". ' .. ....
Run 9: $1 1.0 ' ..... /....
/.
" .....-
".
/
4.0
I
3.5
/
Run 1: 51 0.0
I
3.0
I
2.5
/
I
2.0
/
/
I
1.5
Run 11: SI Variable t M9C0'y'
I
1.00.5
~n10:.,Cr6 ;IU~arI8ble + MgCI2
-
/-----L'" ~D. -.[J-- .
/ ~ -------____ Run8: SloO.5/', .' ~... [J --- _
tP./~... "'WIPP-27 -
/' /', !'rf:L- ..~
-
2 -
3 -
o0.0
1
o10a:
Ionic Strength (molal)
TRI-6344-98-0
Figure 1-22. Change in Mg/Ca molar ratio as a function of reaction progress, types ofadded salts, and dolomite saturation index for simulated evolution ofCulebra groundwaters.
1-63

Chapter 1 (Siegel and Lambert)
0.25
WIPP-29 (12/85) +
+ WIPP-27
+ WIPP-29 (8/801
Run 1: 51 ::: 0.0
Run 10: 51 Variable + MgCI2
--Run 8: 51 = 0.5
/./" Run 11: 51 Variable + MgC03
........ - ··········Run9: 51:: 1.0/
.7
+ Culebra Samples
0.20
0.15
0.05
0.10
o'":r
Cl......"0E
+ P-14
0.00o 1 2 3 4 5 6
Moles Chloride/kg H20
TR 1·6344-89-0
Figure 1-23. Change in sulfate concentration as a function of reaction progress, types ofadded salts, and dolomite saturation index for simulated evolution ofCulebra groundwater compositions.
1-64

Chapter 1 (Siegel and Lambert)
In Run 10, saturation with dolomite was not maintained. The starting solution was
produced by equilibrating distilled water with calcite, dolomite, and gypsum at an initial-Z ..
pCOZ
of 10 atmosphere. The system was then closed to pCOZ
gas, and addition of Na, Cl,
K, Mg, and SO4 by congruent dissolution of halite and incongruent dissolution of polyhalite
and carnallite was simulated. Carnallite dissolves incongruently to form KCl and a solution
containing MgZ+ and Ce. In Run 10, this was simulated by adding MgClZ
to the reaction
solution. Incongruent dissolution of polyhalite was simulated by addition of leonite
(KzMg(S04)·4H20). The K/Cl ratio of the Culebra waters was used to estimate a
reasonable leonite/halite ratio. The MgClz/halite ratio was then adjusted to fit the ob
served Mg/Cl ratio of the Culebra waters. Equilibrium between the waters and gypsum
and calcite was maintained; as the reaction proceeded both calcite and gypsum dissolved.
The saturation index of dolomite was calculated as the reaction progressed, but dolomite
was not allowed to dissolve or precipitate.
Figures 1-2Z and 1-23 show that Run 10 reproduces the trends of the Ca, Mg, and S02
concentrations in this suite of Culebra groundwaters. The calculated dolomite saturation
indices for Run 10 were used to calculate values of the saturation index expression
described previously and are plotted in Figure 1-20. The good correspondence between the
theoretical and observed solute concentrations in these figures shows that addition of
solutes (Mg, SO4' K, and Cl) to the Culebra from evaporite minerals such as polyhalite and
carnallite in a partial equilibrium system is consistent with the observed groundwater
compositions if dolomite does not precipitate from supersaturated solutions.
1.4.7 Estimation of Oxidation-Reduction Potentials and Occurrenceof Organics in the Culebra Groundwaters
Measurements of redox potentials have been made in Culebra waters using Pt electrodes
and N, I, As, and Se redox couple data. Apparent Eh values were calculated from the
concentrations of the redox couples using the Nernst equation. Sensitivity calculations
showed that the calculated Eh values were fairly insensitive to assumptions about
activity/concentration relationships, to reasonable uncertainties in the analytical data, and
1-65

Chapter 1 (Siegel and Lambert)
to errors introduced by uncertainty in the field pH measurements. However, the total
concentrations and concentrations of individual members of the couples were very close to
the detection limits of the analytical methods used. This meant that in most cases, the
existence of redox equilibria or disequilibria could not be established. Descriptions of the
sampling procedure, analytical techniques, and calculations are given in Myers et al.
(Chapter 6).
The results of the calculations for the most recent WQSP water samples are summarized in
Figure 1-24. Arrows indicate upper or lower limits resulting from one member of the pair
being present at levels below the detection limit. In these cases, the analyses were used to
set an upper or lower bound on the potential for that couple. Redox potentials could be
calculated for four wells and two wells, respectively, from the iodine and nitrogen couples.
For most of the other wells, an upper or lower bound could be calculated for these couples.
Three wells provided data to calculate potentials for the selenium couple, and data from six
wells could be used to calculate potentials for the arsenic couple. Lower redox bounds for
three additional wells could be calculated for the arsenic couple.
Although redox equilibrium cannot be established for any of these wells, groups of wells
that have similar characteristics can be identified. Samples in the first group include waters
from the Engle, H-7B, H-8B, and H-9B wells that show a range of calculated redox poten
tials all of which are greater than approximately 350 mV. This lower bound is defined by
the absence of measurable NH:. Samples from H-7B, H-8B, and H-9B from earlier WQSP
rounds, however, had measurable NH;, and thus the lower bound (indicated by the arrows
in the figure) may be an artifact of the analytical technique.
Data from a second group consisting of the WIPP-25, WIPP-26, H-12, and P-14 wells may
indicate redox disequilibrium. The calculated potentials span wide ranges and in some
wells the redox values calculated for the (/10; data lie above upper bounds defined by the
nitrogen data or values calculated for the arsenic couple.
1-66

Chapter 1 (Siegel and Lambert)
800 i--n-----PTTl-------;=========;_,+ As • N • Platinum
.... I x Se Electrode
rtIt
600 - t
;;E
'"l:
'"(;Co
400 -
[l':-.';
~.:
: :
[ :
I
I•: :::
I]::::
+
n: : :
:
......
......::x:............
-
'" ~ <D
~ NM N N
o- M ;;; CD a. a. a.OJ OJ ClW CD CD CD CD CD CD N .,~ ~ '" .,
~ 0. 0. 0.0 0 '? ., ~ <D ~ '" '" ~ ~ ~
" " ~~ J: ± ± ± ± ± ± ± J: ± ± ± J: a. a. ~ ~ ~
Well Name
TRI-6341-60-0
Figure 1-24. Comparison of redox potentials calculated for several different redox couplesin waters from Culebra wells.
1-67

Chapter 1 (Siegel and Lambert)
The final group, consisting of the balance of the wells, has calculated redox values below
approximately 350 mV. This upper bound is defined only by the absence of measurable
nitrate. Waters from these wells are relatively saline and contain low levels of total
nitrogen. If the high salt content of the water has prevented detection of the nitrate, then
the "upper bound" may be an artifact of the analytical technique.
In Chapter 6, Myers et al. note that the four wells in the southern part of the study area are
distinguished from the other wells by their higher redox potential ranges, lower IDS, and
lower halite saturation indices. They conclude that these characteristics suggest that either
a hydrologic divide separates them from the other more reduced wells of the north, or that
a region of recharge in the southern area provides a source of relatively oxic, low-TDS
groundwater to the Culebra.
Observations attesting to the presence of reduced species in some Rustler groundwaters
(WIPP-Z5, WIPP-Z6, WIPP-Z8, and WIPP-30) were reported by Lambert and Robinson
(1984). These included measurable to less-than-measurable but odoriferous concentrations
of hydrogen sulfide, iron slimes, rank (but not HZS) odors, milky-white and black
precipitates that developed as water samples stood in bottles under surface conditions, and
gaseous effervescence. Some of these observations were only transient over the time of
some pump tests. Whether they represent purging of accumulated concentrations of
species related to organic chemical reduction or an actual change in redox potential is not
known.
There are few data available for oxidation-reduction potentials in the other members of the
Rustler Formation. Redox potentials measured by Pt electrodes in wells in Nash Draw
were previously shown to be generally higher in the Culebra than at the Rustler/Salado
contact (Lambert and Robinson, 1984).
Values of TOC of Culebra samples described by Myers et al. in Chapter 6 range from < 1
to 7 mg/L. This range does not include higher values (14-15 mg/L) that are probably
1-68

Chapter 1 (Siegel and Lambert)
associated with contamination due to drilling or sampling activities. The amount of organic
carbon associated with halides (TOX) (Cl, Br, and Cl) was also analyzed and ranged from
<0.1 to 9.7 mg/L; however, an observed correlation between TOX and Cl concentration
may indicate significant analytical interference. In Chapter 6, Myers et al. conclude that
there was no reason to suspect the occurrence of halogenated organics contaminating the
Culebra. Other evidence for organic contamination of water samples drawn from the
Culebra is based on radiocarbon data and is discussed by Lambert (1987; Chapter 5).
1.4.8 Isotopic Studies of Rustler Waters
The isotopic geochemistry of Rustler and related groundwaters is discussed in detail by
Lambert in Chapter 5, with a summary of the sources of data (oxygen and hydrogen
isotopes, carbon isotopes including radiocarbon, tritium, radiochloride, and uranium. d 234U/238U .. .) d h . . . Th' d' ...concentratIOn an activity ratIOs an t elr mterpretations. IS Iscusslon IS m
turn a summary of that work, which is drawn from several source documents: Lambert
(1978), Lambert (1983), Lambert and Harvey (1987), Lambert (1987), and Lambert and
Carter (1987).
Confined Rustler groundwaters near the WIPP and in Nash Draw have isotopic composi
tions very tightly clustered along the worldwide meteoric field in c5D_c518
0 space (Figure
1-RU). The tightly clustered Rustler data plotting along the meteoric field (heavy solid
lines) at more negative c5-values have isotopic compositions that differ from the field of less
confined groundwaters having more positive c5-values. Small (up to -lO%») deviations of
c5-values from the meteoric field are not considered significant (line a; cf. Allison et aI.,
1985). WIPP 29 Culebra and Surprise Spring may have evolved by evaporation from a
shallow water table, with a c5D/c518
0 slope of 2 (lines b; d. Allison, 1982), from water
imported from the Ogallala aquifer for use in nearby potash-refining operations, from
modern-type water by oxygen-isotope shift (lines c), but probably not from evaporation of
confined Rustler-type water (slope = 5; line d; cf. Craig et aI., 1963). Groundwaters whose
stable-isotope compositions deviate markedly from that of a characteristically meteoric
1-69

Chapter 1 (Siegel and Lambert)
o
0.0-1.0-2.0
~ Magentao Culebra• Cavern<} Surface6 Dewey Lakeo Alluvium* Modern Ogallala
-3.0-4.0-5.0-6.0-7.0
60 Range,SENM Ogallala
------I--..
-8.0
Meteoric /Field 7iio...
<>~
/,c /. WIPP-29
.. -@ -/~ ----=-:::-=?0C L _--- .-? ----:::.¥
• '@. _ - '7 _ - - -............ Sur~rise
_- -~-p X ...... ......- Spnng
_";~2~~~:::::~/./~ ............ Inferred Modern--A0 /. ............ Delaware Basincr /....... Recharge
/. ......-/. ......-/
/. ......
CD ~,,-.-;~- ~ Confined....../. Rustler
@/</...... /
......-"""- /@
-10
-50
-40
-30
-20
-60
-70-9.0
cc
C>
io::::;;rJ),>~
TRI-6341-16-1
Figure 1-25. Stable-isotope compositIOns of groundwaters from the Rustler Formation(Figure 5-1, adapted from Lambert and Harvey, 1987).
1-70

Chapter 1 (Siegel and Lambert)
signature occur at the RustlerjSalado contact in the low-permeability portions of that zone
in the central and eastern parts of the WIPP Site (Lambert, Chapter 5) and near the
surface in the Culebra and Tamarisk members in the southwest portion of Nash Draw,
where hydrologic conditions are not as confining (Figu~ 1-25). Deviations in waters at the
Rustler/Salado contact are attributable to a profound degree of rock/water interaction
involving a relatively large rock/water ratio, while the isotopic signatures observed in
southwestern Nash Draw can arise from partial evaporation from the vadose zone and the
capillary fringe above the water table. Confined meteoric Rustler waters are virtually
identical in stable-isotope composition to confined meteoric Capitan waters at the
basin margin, indicating recharge of both types of confined waters under similar climatic
conditions.
By comparison, vadose Capitan waters from the Carlsbad Caverns system, groundwater
from a water table in alluvium, and near-surface accumulations that homogenize seasonal
variations in isotopic composition also have meteoric isotopic signatures, but have isotopic
compositions more positive in 6D_618
0 space than confined Rustler and Capitan waters
(Lambert and Harvey, 1987). The envelopes of 6-values for these two populations of
differing hydrologic character do not overlap (Figure 1-25). The data of Nativ and Smith
(1987) reveal that in Ogallala groundwaters underlying the high plains to the east, climati
cally similar to the Delaware Basin, the only groundwaters containing tritium levels
indicative of recent (post-1950) meteoric derivation (> 10 tritium units [TV]) all have 6D
values> - 42%0 (Figure 1-25), comparable to near-surface unconfined meteoric waters in the
Delaware Basin (Figure 1-26). High Plains data for Figure 1-26 are from Nativ and Smith
(1987); WIPP data are from Lambert and Harvey (1987) and Lambert (1987). Significantly
high tritium concentrations (> 10 TV), indicating derivation from a meteoric source since
1950, are restricted largely to groundwaters having 6D values more positive than about
- 42%0. Ogallala waters from nearby southeastern New Mexico have 6D values between -39
and - 41 %0, corresponding with 6D values of modern groundwater recharge in the Texas
High Plains. Hydrogen-isotope characteristics of groundwaters from the nearby
1-71

Chapter 1 (Siegel and Lambert)
80
70• Ogallala• Triassic, High Plains)( Permian, High Plains
• Permian, WIPP
•
60
50~c:::J
E 40:E.;:l-
30
20
10
o-70
x
x
-60
•
•
• x
• ••
••
• ••• •
-50 -40
60 (V-SMOW) "100
••
-30
•
-20
TRI-6331-"-0
Figure 1-26. Tritium and deuterium concentrations in groundwaters from the SouthernHigh Plains, Texas, and the Delaware Basin, southeastern New Mexico(Figure 5-2, from Lambert and Harvey, 1987).
1-72

Chapter 1 (Siegel and Lambert)
climatically similar Delaware Basin (WIPP data) are shown for comparison. The isotopic
signatures of confined Rustler and Capitan waters are distinct from that of both Ogallala
water with discernable modern input and of vadose Capitan and alluvial water. Thus, it is
likely that the isotopic compositions of confined Rustler and Capitan groundwaters in the
northern Delaware Basin are not characteristic of groundwaters that would be receiving
modern meteoric recharge under the present climatic conditions.
Some, but not all, Dewey Lake groundwaters may have a component characteristic of
climatic conditions fostering modern surficial recharge (Figure 1-25). Some have stable
isotope compositions comparable to the near-surface occurrences, and some are
comparable to confined Rustler groundwaters. Thus, recharge to the Dewey Lake, like
recharge to the Ogallala, appears to be variable in both space and time.
Only four out of 16 well-water occurrences gave internally consistent radiocarbon "age"
calculations based on the internally consistent interpretive model and assumptions of
Evans et al. (1979) for water-bearing carbonate rocks. The model of Evans et al. takes into
account dilution of atmospheric carbon by dissolution of carbonate rock, and carbon
isotope exchange between water and host rock. The mean of these four is 14,000 years;
95% confidence limits are ± 5,000 years. This is a minimum age estimate. It is not possible
to estimate an upper age limit because of the unavoidable possibility of at least small
amounts of unmitigable contamination even in these four samples. These tightly clustered
ages, given their individual confidence limits, while spread out from north to south across
the WIPP Site, do not allow consistent age gradients or travel times to be inferred across
the WIPP Site based on differences in radiocarbon ages (Figure 1-27). Ten of the 16
well-water occurrences were complexly contaminated due to unmitigable anthropogenic
well-bore effects. The remaining two are ambiguous, but all 16 probably represent three
component mixing, including some contamination. The four dated groundwaters (three
Culebra and one Dewey Lake) all have stable-isotope compositions belonging to the more
negative population in 6D_6 180 space (Figure 1-25). Thus, it is inferred that Rustler and
Dewey Lake groundwaters in this population have a significant component at least
1-73

Chapter 1 (Siegel and Lambert)
R30E
l!:lN....
MississippiChern. Corp.
Mine
R31E R32E
m~
R33E
N
lII)
OJ....
II)N
~
~N....
II
+I
II
I+I
TU Tritium Units
PMC Percent Modern Carbon
Dewey Lake IUnger Well .-0.08 TU
--------+-- WIPP Site
•~ I BoundaryH-30.05TU
+fH.12l1~.~ I
H-9(11.5 PMC)to 14,900 yr
•
WIPP-30.
• WIPP-28
I~;\ul(18 PMC)
.-7;-;----""1,1H-B(9.7 PMC)
1 0 12,000 yr
+
• WIPP-25
Dewey lake -- •Pocket Well(3.7 PMC)
to 14,000 yr +
WIPP-26•
• "'fI
MAWIPP-27 ~8.9TU
(68 PMC) Q
RF-l0.
+
~~
Laguna Uno
Laguna Grandede'8 Sal
h..-::;;~.::W:IP~P;-~29~~ __..:~~~~va~I _ne /_
[HTI~
(4.8 PMC) ."""-I 0 16,000 yr ~"""-
II)NN....
II)
'"~
R31ER29E R30E
.,0 1 2 3 4ml
I II
II
!I
I
0 2 4 6km
Engle Well I0.03 TU
f', ~~ 0o ~
u·8"'Im.., ~.., ...w.
Q ..... ~V ~to Jal
R32E
TRI-6331-21-2
Figure 1-27. Tritium and radiocarbon in Rustler and Dewey Lake groundwaters (Figure5-11, adapted from Lambert and Harvey, 1987).
1-74

Chapter 1 (Siegel and Lambert)
12,000 radiocarbon years old. All the tritium measurements from the WIPP area, which
are associated with the more negative (confined Rustler) isotopic compositions, are
<3 TV, indicating little or no contribution from the atmosphere since 1950. Figure 1-27
shows tritium and radiocarbon in Rustler and Dewey~Lake groundwaters. Unless other
wise specified as Dewey Lake (DL) or Magenta (MA), measurements in Figure 1-27 (all
from Lambert, 1987) apply to water from the Culebra member of the Rustler Formation.
The uniformly low ( < 7 TV) tritium concentrations near the WIPP Site indicate no intro
duction of an atmospheric component since 1950 (d. Isaacson et aI., 1974). Three Culebra
and one Dewey Lake water were amenable to dating by the carbonate-aquifer model of
Evans et al. (1979), giving times of isolation from the atmosphere ranging from 12,000 to
16,000 radiocarbon years. These data indicate long residence times or long travel times
from recharge areas, but provide no evidence of either modern vertical infiltration or
monotonic age gradients indicating north-to-south flow. Three of these data, from water
samples also having 6D analyses, are depicted in Figure 1-26.
The southeastern New Mexico climate more than 10,000 years ago fostered vegetation now
found only at higher elevations, as indicated by the packrat-midden studies of Van
Devender (1980). Late Pleistocene climate was probably wetter and more conducive to
recharge, as indicated by the concordance between the ages of packrat middens and the
relatively less contaminated radiocarbon in the Rustler and Dewey Lake groundwaters
described above. Fossil fauna (camels, horses, bison) from extinct spring deposits in Nash
Draw near the WIPP Site are of similar age and also indicate wetter conditions than at
present (Bachman, 1981).
Given the assumptions of the model of Osmond and Cowart (1976) for uranium systematics
in confined hydrologic flow systems, generalized flow directions in confined Rustler
groundwaters as inferred from 234U/38U relationships appear to have involved recharge
from a direction with an eastward-flowing component (Figure 1-28). This is not parallel to
modern flow directions inferred from potentiometric heads alone (d. Figure 1-10). A
change in flow direction back toward the west (the modern flow direction
1-75

Chapter 1 (Siegel and Lambert)
o 1 2 3 4 mi
1-1-.......,.Ir--'L...,r-'L--"r"o 2 4 6 km
...-\
, .............. _-.......
...-WIPP SiteBoundary
'0/;';',,' "; ;'
" ,/>'/ ".~,~ I " /,;
I " ,;I "WIPP-30 ;"f?>
1/ 8,06" 1:\'/
'I /" ."~ 'I I ,,/'% " I " ,\\"~ 'I I / ,,'"*"~ H-6 fi-f-L+----,L--+--r/~H-5
",)~'" 3.57 I , 11.6
~}WIPP-25 '\ I I.'-"'''(,'''' 3.12 \ \ " "
\' \ "\ , .....\" , ....
\, ---" ," ........
2 ...~ •1I'''Ifji''"/fl""~ WI PP-28
2.93•WIPP-27
N
Rain-1.74
TRI-6331-49-0
Figure 1-28, Contour map of 234U;238U activity ratio in groundwater from the Culebradolomite member of the Rustler Formation (Figure 5-11, from Lambert andCarter, 1987).
1-76

Chapter 1 (Siegel and Lambert)
indicated for saturated portions of the Magenta; Mercer, 1983) during the past 10,000 to
30,000 years is likely. The activity ratio decreases westward and somewhat southward
toward Nash Draw; high activity ratio values typically develop downgradient in hydrologic
systems under confined, reducing conditions and are associated with long residence times.
Control on contouring east of the WIPP Site is not particularly tight, due to the scarcity of
wells suitable for sampling in the eastern low permeability region of the Culebra. Eastward
increasing activity ratio values are interpreted as eastward flow during Pleistocene
recharge, and as mimicking an inverse-function of potentiometric head contours during
that time. During the time of wetter Pleistocene conditions when the Rustler was being
recharged in its outcrops in Nash Draw, the base level there was probably also being
lowered by accelerated erosion and dissolution. With the onset of a drier Holocene
climate and the cessation of significant recharge, the area whose base level was lowered has
probably governed the local hydraulic gradient, resulting in a general southward drainage.
The proposed change in flow direction is consistent with the apparently anomalous data
from borehole H-5. It is problematical to obtain either modern or ancient recharge in the
vicinity of borehole H-5. In spite of the high potentiometric level there relative to the
present downgradient area south and west (a condition commonly interpreted in physical
hydrology as indicative of recharge), the water there contains no significant tritium and has
the highest 234U;238U activity ratio (Lambert, Chapter 5). A high tritium content would be
indicative of modern recharge, while a high 234U;238U activity ratio would develop in the
downgradient, not the upgradient portion of a confined groundwater system, according to
the model of Osmond and Cowart (1976). The transmissivity there is also extremely low
(Lappin, 1988). Low permeability in the H-5 area may have inhibited subsurface drainage
following the cessation of eastward flow to the area, and the high potentiometric level is
suspected to be a relic of the paleoflow system.
1-77
Chapter 1 (Siegel and Lambert)
1.4.9 Mineralogical Studies in the Culebra Member
Detailed mineralogical analyses of samples from 12 different locations along three east
west trending traverses have been carried out using a variety of quantitative techniques.
Mineralogical and compositional data were obtained from both bulk matrix samples and
fractures. The results of this study are in Chapter 3 and briefly summarized below.
Figure 1-29 shows the bulk mineralogy in intact cores of the Culebra along a traverse from
Nash Draw (WIPP-29) to the eastern part of the WIPP Site (H-lO). The mineralogy ofH-7
and H-I0 is typical of most cores examined at the site. The dominant mineral is a fairly
pure dolomite (Ca/Mg - 1.05; FeO ~0.23%) and comprises about 85% by weight of the
bulk rock. Gypsum, calcite, and various clay minerals are observed throughout the Culebra
and are distributed heterogeneously both vertically and horizontally. Fractures are ob
served in all cores and are lined most commonly with clay and gypsum. Clay minerals are
present in all samples and comprise approximately 3 to 5% by weight of the bulk mineral
ogy. They occur as discrete seams along fracture surfaces or are finely dispersed
throughout the matrix. The dominant clay minerals are corrensite (an ordered mixed-layer
chlorite/smectite), illite, chlorite, and a serpentine-like mineral tentatively identified as
amesite. On the regional scale, corrensite is the most abundant mineral observed after
dolomite.
Gypsum occurs as a fracture and vug filling; all fracture surfaces examined by XRD showed
the presence of nearly pure CaS04
. 2H20. Calcite is present in significant proportions in
the top part of WIPP-29 and is interpreted to be of secondary origin (Sewards, et aI.,
Chapter 3). Microprobe analyses of microcrystalline calcite in WIPP-19 show that it is a
very low-Mg calcite. Trace amounts of pyrite, magnesite, quartz, and authigenic feldspar
have been observed in some cores.
A dark amorphous material is present in abundance in the Culebra samples and has been
tentatively identified as organic matter. It is generally associated with clays and often
1-78

H-7(Top of Core)
~
Eo"0c~.0•.,"
Dolomite
Gypsum
Clay
o 20 40 60 80 100
Weight (%)
1365
1385
1380
Forty-niner Member}Magen.la Dolomite Rustler
~~r::= Tamansk MemberCulebra Dolomite Formationlower member
13601---r---r--,.--,.--;H-10 Core
2700'
2600'
2500'
2100'
"c.~ 1375
1370:s
H-10(Top of Core 3650')
:c
H-7 Core237
240
245
250
-" 255C.•c
Clay260
265
270 Dolomite
0 20 40 60 80 100
Weight (%)
WIPP-29(Top of Core)
WIPP-29 Core12
15Calcite
20
- 25...... £,
Q.-.J •\0 C Clay30
35Dolomite
40
0 20 40 60 80 100
Weight (%)
TRI-6342-491-0
Figure 1-29. Fence diagram showing stratigraphy of the Rustler Formation and mineralogy of the Culebra member (fromSewards et aI., Chapter 3).

Chapter 1 (Siegel and Lambert)
occurs in algal structures or haloes surrounding vugs whose origin has been attributed to
biological activity.
1.4.10 Mineral Isotopic Studies
To evaluate further the degree of rock/water interactions in the Culebra and related rocks,
supporting data have been collected on the isotopic compositions of rocks and their
mineral components. These data include 618
0 and 613
C values of dolomite and calcite, 6D87 86 . 234 238
values ofgypsum, Sr/ SrratlOs ofboth carbonates and sulfates, andwhole-rock U/ U
activity ratios.
Th ... h 234U/238U .. . f kf b' h' (e vanatlOns III t e actIvIty ratIO 0 roc rom water- eanng onzons most
rubbled) in the Culebra are minor, generally statistically indistinguishable from the
theoretical secular-equilibrium value of unity (Lambert and Carter, 1987). However,
water/rock interaction has given rise to significant departures of the activity ratio from
unity in coexisting water, which has activity ratio values as high as 11.6 (Figure 1-28).
Despite a conclusively meteoric <518
0/6D signature for confined groundwaters in the
Culebra at the WIPP Site and in much of Nash Draw, the carbonate host mineralogy
(dominantly dolomite) has generally not recrystallized in the presence of the contained
water (Lambert, Chapter 5). However, secondary dolomite dissolution features (such as
vugs and etch pits) are commonly developed where the Culebra carries significant amounts
of water (Sewards et a!., Chapter 3). The only isotopic evidence of carbonate recrystalliza
tion in equilibrium with Rustler-type water (Figure 1-30) was found in secondary calcite in
a Culebra sample at WIPP-33, a borehole drilled in a collapse feature between the WIPP
Site and Nash Draw. This carbonate apparently precipitated in isotopic equilibrium at
ambient temperatures, involving a freshwater-type reservoir of carbon. Dolomitic aquifer
rock, although partially dissolved to locally enhance the porosity, has an extremely uniform
and relatively heavy isotopic composition (mean 618
0 = + 33.40/00, 95% CL = ± 1.00/00, n =10; mean 613C = +6.1 0/00,95% C = ± 1.10/00, n = 10). These values are more consistent with
an evaporitic origin than with diagenetic dolomitization of a biogenic limestone precursor
1-80
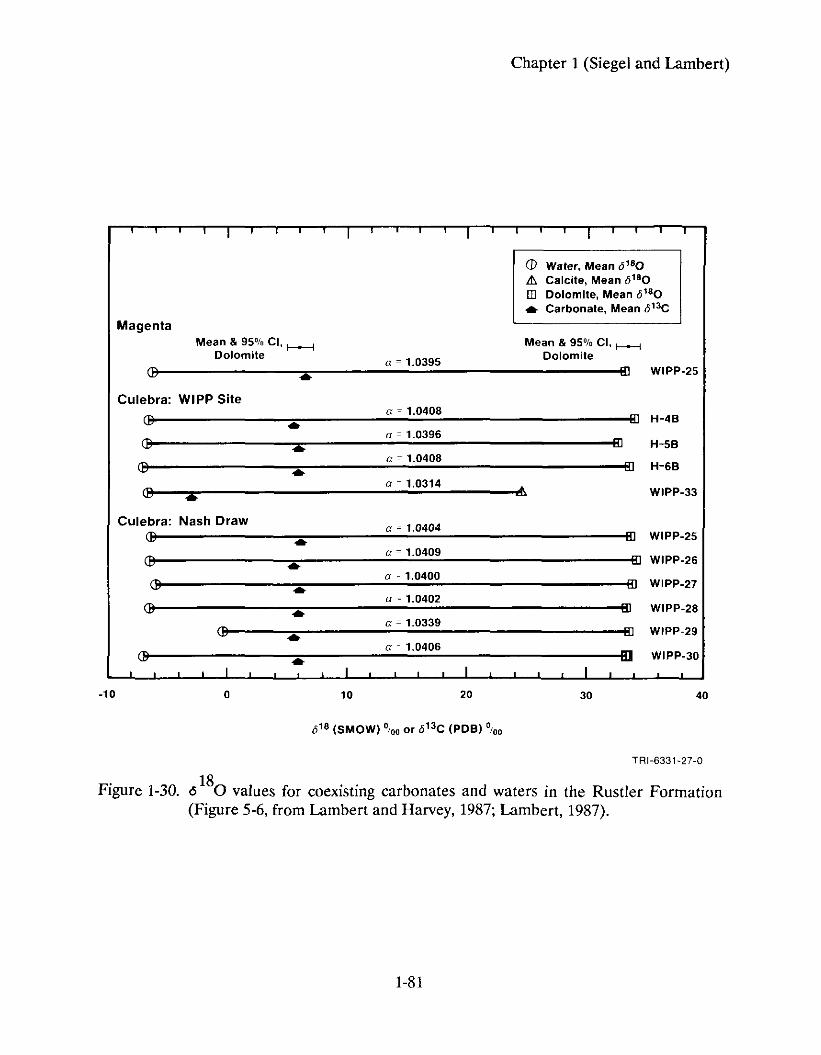
Chapter 1 (Siegel and Lambert)
(J) Water, Mean 6'80il'. Calcite, Mean 6180[J] Dolomite, Mean 6180.. Carbonate, Mean 613C
MagentaMean & 95% el, t------l Mean & 95% CI, .........-,
Dolomitea =1.0395
Dolomite
<B • ID WIPP-25
Culebra: WIPP Sitea =1.0408
ID H-4B<B • a =1.0396ID<B • H-5B
a =1.0408ID H-6B<B • a =1.0314
£ WIPP-33<B •Culebra: Nash Draw
a= 1.0404<B • ID WIPP-25
a =1.0409ID WIPP-26<B •
<Ba = 1.0400
ID WIPP-27• a = 1.0402<B • BI WIPP-28
a = 1.0339<B • 8J WIPP-29
a - 1.0406BlQl • WIPP-30
-10 0 10 20 30 40
TRI-6331~27-0
Figure 1-30. 618
0 values for coexisting carbonates and waters in the Rustler Formation(Figure 5-6, from Lambert and Harvey, 1987; Lambert, 1987).
1-81
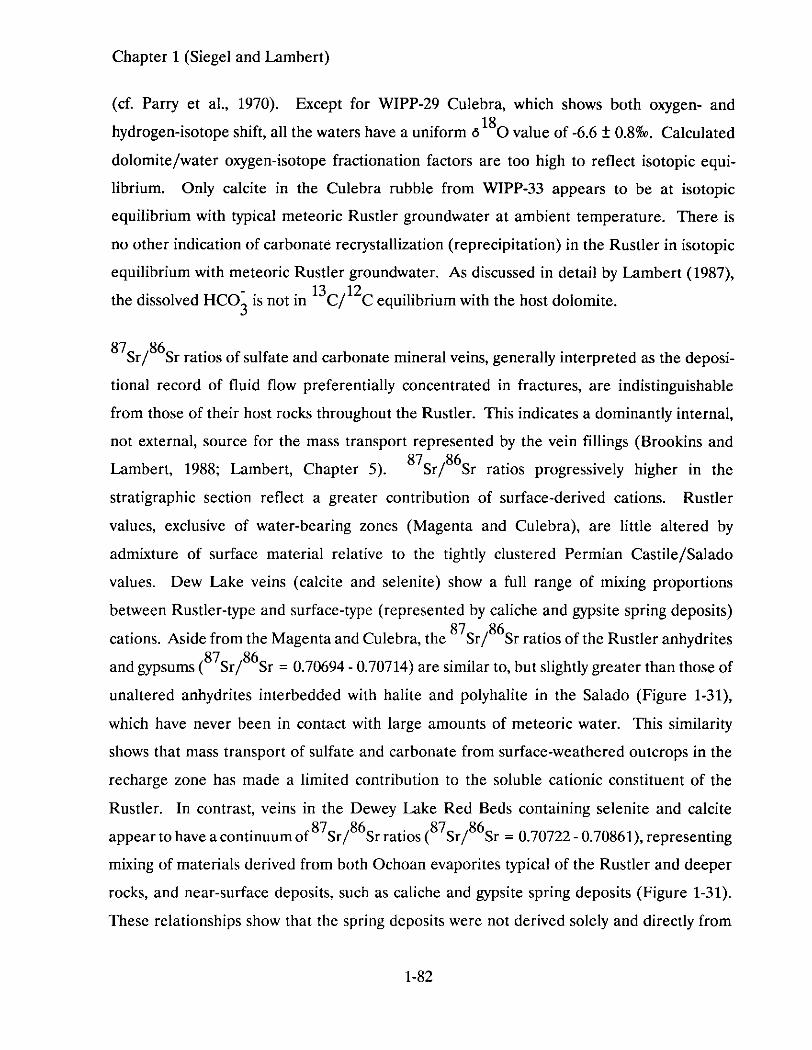
Chapter 1 (Siegel and Lambert)
(d. Parry et aI., 1970). Except for WIPP-29 Culebra, which shows both oxygen- and
hydrogen-isotope shift, all the waters have a uniform 618
0 value of -6.6 ± 0.8%0. Calculated
dolomite/water oxygen-isotope fractionation factors are too high to reflect isotopic equi
librium. Only calcite in the Culebra rubble from WIPP-33 appears to be at isotopic
equilibrium with typical meteoric Rustler groundwater at ambient temperature. There is
no other indication of carbonate recrystallization (reprecipitation) in the Rustler in isotopic
equilibrium with meteoric Rustler groundwater. As discussed in detail by Lambert (1987),
the dissolved HCO; is not in B C/12C equilibrium with the host dolomite.
87Sr;86Sr ratios of sulfate and carbonate mineral veins, generally interpreted as the deposi
tional record of fluid flow preferentially concentrated in fractures, are indistinguishable
from those of their host rocks throughout the Rustler. This indicates a dominantly internal,
not external, source for the mass transport represented by the vein fillings (Brookins and
La b 1988 La b Ch 5) 87S /86S ' . I h' h . hm ert, ; m ert, apter. r r ratIOs progressive y Ig er In t e
stratigraphic section reflect a greater contribution of surface-derived cations. Rustler
values, exclusive of water-bearing zones (Magenta and Culebra), are little altered by
admixture of surface material relative to the tightly clustered Permian Castile/Salado
values. Dew Lake veins (calcite and selenite) show a full range of mixing proportions
between Rustler-type and surface-type (represented by caliche and gypsite spring deposits)
cations. Aside from the Magenta and Culebra, the 87Sr/86Sr ratios of the Rustler anhydrites
and gypsums (87Sr;86Sr = 0.70694 - 0.70714) are similar to, but slightly greater than those of
unaltered anhydrites interbedded with halite and polyhalite in the Salado (Figure 1-31),
which have never been in contact with large amounts of meteoric water. This similarity
shows that mass transport of sulfate and carbonate from surface-weathered outcrops in the
recharge zone has made a limited contribution to the soluble cationic constituent of the
Rustler. In contrast, veins in the Dewey Lake Red Beds containing selenite and calcite
appear to have a continuum of87Sr;86Sr ratios (87Sr;86Sr = 0.70722 - 0.70861), representing
mixing of materials derived from both Ochoan evaporites typical of the Rustler and deeper
rocks, and near-surface deposits, such as caliche and gypsite spring deposits (Figure 1-31).
These relationships show that the spring deposits were not derived solely and directly from
1-82

Chapter 1 (Siegel and Lambert)
[] (2) Spring Gypsite
f'::, L2I1l& (5) Mescalero Caliche, Surface
[][] 0 []I] 00 0 (8)f'::, f'::, ~ ffi (8) Dewey Lake Veins
[]] [[l]]J 0 (7)f'::,~ (6)
"'1111 (16)f'::, (1)
ffi (9)
Rustler (Magenta)
Rustler Anhydrite/Gypsum
Rustler (Culebra)
Ill! (6) Castile/Salado Anhydrite
o Sulfatef'::, Carbonate
0.706500 0.707500 0.708500 0.709500 0.710500
TR 1-634 1-58-0
Figure 1-31. 87Sr;86Sr ratios in Ochoan and related rocks (Figure 5-17; data from Brookinsand Lambert [1988]).
1-83

Chapter 1 (Siegel and Lambert)
Rustler rock dissolved and mobilized westward in the late Pleistocene (cf. Bachman, 1981),
but instead require a dominant component similar to the high-87Sr extreme in Dewey Lake
strontium.
Finally, the D/H relationships in gypsums from the Rustler and Dewey Lake Red Beds are
characteristic of gypsification of anhydrite (or recrystallization of pre-existing gypsum) in
the presence of meteoric water. No gypsum thus far examined bears an isotopic signature
that would be expected for primary marine evaporitic sulfate (cD > 0%0). Although all
gypsums examined were meteorically influenced (cD <40%0), their cD values vary widely.
Figure 1-32 plots cD values of the water of crystallization in gypsums as a function of
depth. Solid lines delineate the range of gypsum compositions expected from recrystalliza
tion in the presence of a large amount of Rustler-type meteoric water (extremely high
water/rock ratio). Dashed lines bound gypsum cD values expected from small amounts of
such water completely scavenged during gypsification of anhydrite, and correspond to the
cD field for confined Rustler waters in Figure 1-25. A few cD values are consistent with
isotopic equilibrium between their waters of crystallization and large amounts of Rustler
type (Pleistocene) meteoric water. The variations in D/H ratio, both laterally and
vertically, attest to differing generations of meteoric water of different isotopic composi
tions hydrating the sulfate or else differing water/rock ratios with an isotopically uniform
reservoir contributing to the crystallographically bound water or some combination of the
two. The changes in D/H ratio adjacent to a water-bearing dolomite in WIPP-34 (Figure
1-32) suggest a varying water/rock ratio at that locality, rather than multiple generations of
gypsum recrystallization, although throughout the Rustler several discrete episodes may
have affected the gypsum.
On a regional basis, there is no correlation of cD value with depth, suggesting a non
uniform vertical permeability throughout the Rustler/Dewey Lake section. In a given
borehole core, the water/rock ratio inferred from the gypsum D/H ratio is highest, as
might be expected, near the brittle, water-bearing zones in the Rustler (i.e., stratabound
1-84
Chapter 1 (Siegel and Lambert)
o r--------r\-------rl-----.\----.--I----,
o Dewey Lake Selenile Veino Rustler Gypsum
-20 f- -
-40 - -
1000800
WIPP-34(Magenla)
o A-8 (Tamarisk)
DWIPP-19- --- - ----OWIPP-14-----------------
WIPP-34 (Forly-niner)8 WIPP-14 (Forly-niner)o WIPP-34
(lower)_______ DwIPP-1~ _
o WIPP-34 -(Forly-niner)
-60 -
o AEC-8
OWIPP-33(Forly-niner)
-800 200 400 600
Deplh (II)
TRI-6341-17-0
Figure 1-32. 6D values of the water of crystallization in gypsums as a function of depth(Figure 19A from Lambert, Chapter 5).
1-85

Chapter 1 (Siegel and Lambert)
dolomitic layers), but diminishes with distance from such a zone. This shows that recharge
has not taken place vertically from the surface. The vertical variations in D/H ratio,
together with the minimal surficial component of Sr, suggest that groundwater flow within
the Rustler near the WIPP Site is largely stratabound, having been recharged where near·
surface exposures of water-bearing units can receive infiltration and subsequently having
moved laterally.
1.5 DISCUSSION
A primary objective of this study is to determine if the spatial distribution of solutes is
consistent with the hydrologic flow directions predicted independently by hydrogeologic
studies assuming steady·state confined flow. Ancillary questions concern the time scale on
which the Culebra dolomite may be considered confined and the time scale on which the
flow within the Culebra may be considered transient.
The observed distribution of solutes in a hydrologic flow field is determined in part by the
location and magnitude of solute fluxes from potential sources and to potential sinks.
Section 1.5.1 describes a model for the chemical evolution of waters in the Culebra that
tentatively identifies the mineralogical sources and sinks for many of the solutes.
Resolution of the questions of transience and confined flow is addressed in Section 1.5.2.
This involves examination of isotopic ratios and the distribution of diagnostic minerals to
differentiate the independent histories of the solutes, water molecules, and mineral phases
in the Culebra.
1.5.1 Processes Affecting Groundwater Composition
Two common sources of solutes in groundwater are addition of species by mixing with
more saline waters and leaching or dissolution of solutes from the rock matrix. An ap·
parent addition of solutes to groundwater will also occur during evaporation. Sinks for
solutes include precipitation, coprecipitation, sorption, and ion-exchange; dilution of a
concentrated solution by a dilute groundwater will also lead to an apparent loss of solutes.
1·86
Chapter 1 (Siegel and Lambert)
Table 1-4 lists some of the processes and resulting effects that may have influenced the
compositions of groundwater in the Culebra. The relative importance of these processes is
discussed in the following sections.
1.5.1.1 Summary of Solute Relationships
The following solute relationships are described in the preceding sections of this chapter
and in Chapter 2:
Increases in the concentrations of Na, Cl, Ca, Mg. K, SO4' Br, B, and Li with ionic
strength; this relationship is illustrated by the "salinity factor" described in Section 1.4.3.
The near-perfect saturation of the solutions with respect to gypsum over the entire range
of ionic strength.
. The increase in the Mg/Ca ratio as the ionic strength increases (see Figure 1-12).
The negative correlation between pH and bicarbonate alkalinity observed after the
effects of salt dissolution are factored out. This relationship is most clearly indicated by
the silicate/bicarbonate factor described in Section 1.4.3.
The apparent supersaturation of dolomite; although potential loss of CO2
gas during
sampling introduces uncertainty into calculation of saturation indices of individual
carbonates, the relationship between saturation indices for calcite and dolomite indi
cates that the degree of dolomite supersaturation increases with ionic strength (see
Figure 1-20).
The correlation of Mg with Si02
and the negative correlation of Si02
with Li and B that
is observed after the effects of salt dissolution are factored out. This relationship is also
clearly indicated by the silicate/bicarbonate factor.
1-87

Chapter 1 (Siegel and Lambert)
Table 1-4. Chemical Processes That May Affect the SoluteCompositions of Culebra Groundwaters
Chemical Process
Halite dissolution
Precipitation/dissolutionof gypsum
Precipitation/dissolutionof calcite and dolomite
Dolomitization: 1calcite + Mg ~ dolomite + Ca
Dedolomitization: 1 dissolutionof gypsum and dolomite withconcurrent precipitation ofcalcite.
Sorption/desorption by clays
Mixing of connate hypersalineformation water with recharge 2water that has dissolved gypsum
Incongruent dissolution ofpolyhal ite
Dissolution of silicates
Dissolution of anhydritewith sellaite inclusions
Potential Effect(s) onConcentrations of Solutesin Culebra Groundwaters
Increase Na, C1, Br, Li;decrease Cl/Br;increase solubility of carbonatesand sulfates up to 3 molalionic strength and then decreasesolubility causing changes inCa, Mg, S04' C03Decrease/increase Ca, S04
Decrease/increase Ca, Mg, C03
Decrease Mg/Ca ratio
Decrease pH, alkalinity, S04;must maintainMg/Ca molar ratio < 1
Loss/gain of Li and B bysolution
Increase Mg, Ca, K, Na, Cl;decrease S04' Cl/Br ratio
Increase Mg, K, S04;decrease Ca, Cl/Br ratio
Increase Si, Mg, Na
Increase Ca, S04' Mg, F
1. Process may be important locally, as for example, at WIPP-33.2. Process discussed in Chapter 4.
1-88

Chapter 1 (Siegel and Lambert)
In Chapter 2, Siegel et al. suggest that these solute relationships are consistent with the
following processes: (1) solutes are added to the Culebra brines by dissolution of evaporite
minerals; (2) the solubilities of gypsum and calcite increase as the salinity increases; these
minerals dissolve as chemical equilibrium is maintained between them and the
groundwater; (3) equilibrium is not maintained between the waters and dolomite; sufficient
Mg is added to the waters by dissolution of accessory carnallite or polyhalite so that the
degree of dolomite supersaturation increases with ionic strength; and (4) clays within the
fractures and rock matrix exert some control on the distribution of Li, B, Mg, and Si via
sorption, ion exchange, and dissolution.
1.5.1.2 Precipitation and Dissolution of Carbonates, Sulfates, and Evaporite Salts
As discussed in Section 1.4.6, the first three of the above processes might be indicative of a
partial equilibrium system in which solution/mineral equilibria shift nearly reversibly in
response to increases of salinity due to dissolution of evaporite salts in rock units adjacent
to the Culebra. The solubilities of gypsum, calcite, and dolomite increase with salinity up
to 3 molal ionic strength and then decrease. Thus, even if the saturation indices for gypsum
and calcite are near zero, the waters may still be capable of dissolving significant amounts
of these phases as the salinity increases. Reaction path calculations show that addition of
solutes (Mg, S03' K, and Cl) to the Culebra from evaporite minerals such as polyhalite and
carnallite in a partial equilibrium system is consistent with the observed groundwater
compositions if dolomite does not precipitate from supersaturated solutions.
The results of the reaction path calculations are in qualitative agreement with the SNORM
calculations described by Bodine et al. in Chapter 4. In particular, the SNORM calcula
tions show that the saline waters in Zone A all have appreciable MgCI2
, MgSO4' and KCl
components. This normative signature may be the result of dissolution of the assemblage
halite/carnallite/polyhalite or mixing of a primitive brine with halite-dissolution water.
Isotopic studies of minerals and waters provide some support for this model. Stable
isotope compositions of carbonates indicate no recrystallization of dolomite in equilibrium
1-89

Chapter 1 (Siegel and Lambert)
with the groundwater now found in the Culebra, but local precipitation of calcite, at the
expense of dolomite, has apparently occurred in WIPP-33 Culebra. Dissolution of
dolomite is possible, but would leave neither a mineralogical nor an isotopic record.
Although the reaction path models predict dissolution of gypsum in response to increases
in salinity, reprecipitated gypsum appears to be quite common within the Rustler. The
cationic origins of anhydrite and gypsum in the Rustler, including Culebra gypsum, are
largely marine, with little contribution from surface weathering sources, as indicated by
their 87Sr;86Sr ratios (Figure 1-31). Hence, the calcium sulfate was not imported by dissolu
tion in a near-surface weathered recharge zone, but is of local origin. The variations in
D/H ratios in the waters of crystallization of Rustler gypsum, however, do attest to recrys
tallization in the presence of meteoric water. Although most of the dissolved calcium
sulfate originated locally within the evaporite section, the solid calcium sulfate hydrated in
response to influx of meteoric water (Figure 1-32). Thus, the isotopic data can be
reconciled with the results of the reaction path modeling if it assumed that sufficient
anhydrite is hydrated to replace the gypsum that dissolves in response to the salinity in-
crease.
1.5.1.3 Reactions Involving Silicates
The contribution of solutes from silicates is difficult to establish. In the southern part of
the study area (Zone B), the salt norms indicate alkali-carbonate and/or alkali sulfate
assemblages, consistent with silicate hydrolysis (Bodine et aI., Chapter 4). In addition, the
results of the PCAs described by Siegel et al. in Chapter 2 suggest that reactions with clay
minerals may exert an observable influence on the water's minor-element chemistry
throughout the study area. When the effects of solute addition associated with halite
dissolution are factored out prior to the PCA, a Mg-Si02-alkalinity association is left which
is negatively correlated with a pH-B-Li association. As discussed in Chapter 2, these
correlations (the silicate/bicarbonate factor) are consistent with several plausible
mechanisms, including uptake of Li by vacant octahedral sites in the clay lattice, sorption of
1-90

Chapter 1 (Siegel and Lambert)
B by surface sites (SOH) of clays (reaction 1), and dissolution of a reactive amorphous Mg
rich layer (MgSiX(am» in corrensite (reaction 2):
[1)
[2)
The importance of this factor is greatest in the western and southern parts of the site,
where dissolution of evaporite salts may have left residues relatively enriched in clays. A
survey of the literature provides ample evidence that sorption of boron and lithium and
release of magnesium and silica from clays in saline waters is possible (Siegel et aI.,
Chapter 2). However, geochemical and mineralogical evidence either supporting or
contradicting this model for the WIPP is ambiguous. The PCA of minor-element data
suggests that some degree of silicate hydrolysis has influenced the hydrochemistry
throughout the Culebra; however, in more saline waters (Zone C) the normative salts
suggestive of silicate hydrolysis are absent (Bodine et aI., Chapter 4). This inconsistency
may be related to the small data set used in the PCA or due to the masking of the norma
tive signature by subsequent massive dissolution of halite and other readily soluble
evaporites.
This controversy might be resolved by a systematic examination of the chemical and
isotopic compositions of mineral samples from highly transmissive zones (containing core
rubble rather than intact core), examination of the geochronological systematics (e.g.,
Rb/Sr) of the clays, more rigorous calculations of the extent of mass transfer that could
result from ion exchange and sorption, and application of factor analysis to a larger data set
of chemical analyses.
1-91

Chapter 1 (Siegel and Lambert)
1.5.2 Consistency Between Solute and Isotope Distributions andHydrologic Flow
1.5.2.1 Steady-State Versus Transient Flow
Ramey (1985) and Chapman (1988) observed that if the Culebra is a confined aquifer at
steady state, present-day regional water-flow directions are not consistent with the salinity
distribution at the WIPP Site, given the assumption of steady-state confined flow. These
observations were based on the compositions of water samples analyzed as of 1983 by the
USGS and on data gathered by the New Mexico EEG. The more extensive data set ex
amined in this study confirms these observations. As shown in Figures 1-5, 1-6, and 1-33,
Zone B (a facies with low salinity and element ratios inconsistent with halite dissolution)
lies downgradient from more saline water in Zone C. Flow within Zone C (but not from
Zone C to Zone B) may be consistent with progressive addition of solutes from dissolution
of halite in the lower member; however, the lack of a fully coupled flow and transport
model does not at this time allow quantitative mass balance calculations to be made along
the hydrologic flow paths inferred from physical measurements.
The inconsistencies between the steady-state confined-flow hydrologic model and
geochemical interpretations might be reconciled by considering the differences in the time
scales reflected by the computed hydrologic flow field, isotope ratios, and spatial distribu
tions of solutes and minerals. Specifically, the assumption of steady-state confined flow
may be adequate on the 100-year time scale of hydrologic testing and disturbances related
to the construction of the WIPP shafts. However, measurements of modern head poten
tials, transmissivities, and/or fluid densities do not give any direct indication of time scales
on which the system might be transient. In fact, the isotopic data suggest that transient
phenomena have taken place over the past 10,000 to 20,000 years in response to climatic
change. Similarly, the observation that the Culebra is confined on the time scale of
hydrologic testing does not ensure that vertical flux is negligible on a time scale measured
in millennia. As discussed below, mineralogical and isotopic data are required to assess the
1-92

11\'
,,"!"'\~"'\~
,\\'\
D
B
Chapter 1 (Siegel and Lambert)
eWIPP-30
H-S
A
• H-12
(H-l0)_
H-9 •• Engle Well
A. B, C, 0 Facies- Flow Direction
oIo
1I I
2
"?2 3 4 mi -"~I"~
I I I 3'~,
I i d\I\, ~\,.
4 6 km ~
-.- Facies Border
LJ, 0, • Well Location
TRI-6331-77-0
Figure 1-33. Relationship between hydrological flow and hydrochemical facies of theCulebra dolomite. Compositions of waters in each zone represented bysolid black circles are described in Figure 1-10. Compositions of severalother wells (see Chapter 4) indicated by open circles were not included inthe original data used to define the facies, but their compositions are consistent with the facies borders.
1-93
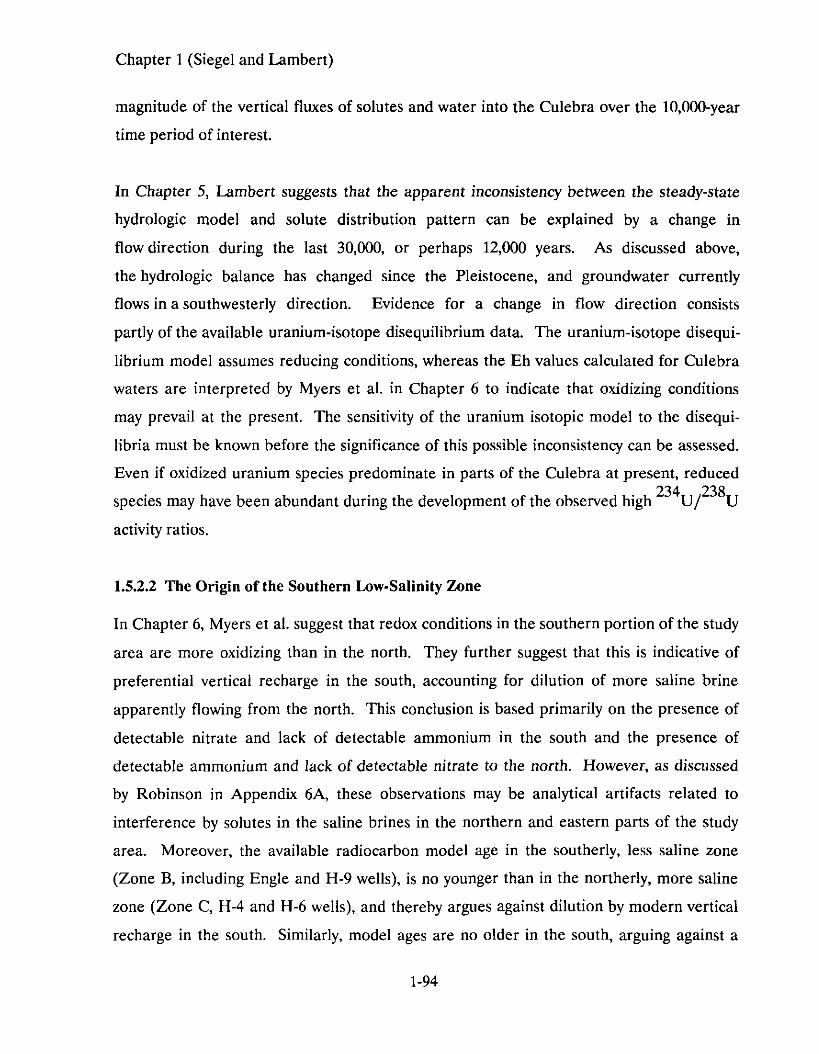
Chapter 1 (Siegel and Lambert)
magnitude of the vertical fluxes of solutes and water into the Culebra over the lO,OOO-year
time period of interest.
In Chapter 5, Lambert suggests that the apparent inconsistency between the steady-state
hydrologic model and solute distribution pattern can be explained by a change in
flow direction during the last 30,000, or perhaps 12,000 years. As discussed above,
the hydrologic balance has changed since the Pleistocene, and groundwater currently
flows in a southwesterly direction. Evidence for a change in flow direction consists
partly of the available uranium-isotope disequilibrium data. The uranium-isotope disequi
librium model assumes reducing conditions, whereas the Eh values calculated for Culebra
waters are interpreted by Myers et al. in Chapter 6 to indicate that oxidizing conditions
may prevail at the present. The sensitivity of the uranium isotopic model to the disequi
libria must be known before the significance of this possible inconsistency can be assessed.
Even if oxidized uranium species predominate in parts of the Culebra at present, reduced
species may have been abundant during the development of the observed high 234Up38U
activity ratios.
1.5.2.2 The Origin of the Southern Low-Salinity Zone
In Chapter 6, Myers et al. suggest that redox conditions in the southern portion of the study
area are more oxidizing than in the north. They further suggest that this is indicative of
preferential vertical recharge in the south, accounting for dilution of more saline brine
apparently flowing from the north. This conclusion is based primarily on the presence of
detectable nitrate and lack of detectable ammonium in the south and the presence of
detectable ammonium and lack of detectable nitrate to the north. However, as discussed
by Robinson in Appendix 6A, these observations may be analytical artifacts related to
interference by solutes in the saline brines in the northern and eastern parts of the study
area. Moreover, the available radiocarbon model age in the southerly, less saline zone
(Zone B, including Engle and H-9 wells), is no younger than in the northerly, more saline
zone (Zone C, H-4 and H-6 wells), and thereby argues against dilution by modern vertical
recharge in the south. Similarly, model ages are no older in the south, arguing against a
1-94

Chapter 1 (Siegel and Lambert)
monotonic north-to-south, steady-state flow persisting since the Pleistocene. The one
available radiocarbon age from the Dewey Lake Red Beds overlying the Rustler is consis
tent with this interpretation. The stable isotope characteristics of the Dewey Lake,
however, are consistent with the interpretation that waters at least 12,OOO-16,OOO.,Years old
and waters representing modern meteoric recharge in the area may be present in this unit.
Steady-state, north-to-south confined flow would not have preserved the lower-salinity zone
downgradient from the saline zone (Figure 1-33). The lower-salinity zone could have
arisen if the regional flow direction originally had a significant westerly component, as
suggested by the generally eastward-increasing 234U/38U activity ratios discussed above.
Similarities in radiocarbon age in the north and the south are consistent with water
recharging both north and south parts of the WIPP area simultaneously from a near
surface Pleistocene infiltration zone in the west-northwest (Figure 1-34), groundwater at
one time flowing locally subparallel rather than subnormal to the hydrochemical facies
boundary between Zones Band C. Pleistocene recharge from the west-northwest is consis
tent with the present orientation on the Zone BIC hydrochemical facies boundary, similar
radiocarbon ages in Zones Band C, eastward-increasing uranium isotope activity ratio
values, and some, but not all, of the calculated modern Darcian flow vectors. This general
ized paleoflow pattern during recharge is not consistent with either recharge from due
north, or monotonic southward steady-state flow. A likely paleorecharge zone is nearby in
surface outcrops of the Rustler Formation to the west in Nash Draw. Although it was once
proposed that recharge for water now flowing in the Rustler near the WIPP Site and Nash
Draw takes place as far north as Bear Grass Draw (Robinson and Lang, 1938), there is
neither need nor geochemical support for such a proposal. In fact, recent work by Hunter
(1985) suggests that Rustler flow from Bear Grass Draw southward toward the WIPP area
may be intercepted by a major discharge zone in Clayton Basin.
A likely explanation for the less saline waters of Zone B is that at the time of influx of the
present generation of Culebra groundwater in late Pleistocene time, Rustler halite was
absent adjacent to the Culebra in this area, thus not providing a source of NaC!. This is
1-95

Chapter 1 (Siegel and Lambert)
I South Woell \
IH-10).
A
/WIPPSiteBoundary
• WIPP-30
c •I .'.. '
DOE-2. ,/Il.....-=-=-=-='---.,...::-........ H.5H-6
1·~r-13
!.... .WIPP-19
•
H-16.·,(H-2)•• H~1 •
\.. • I H-15H-14. ~H-~ eDOE-1
'-/ H.11
1"!F Gnome-S, , I
~\ Gnome--4 00 8Gnome Shaft
Gnome-1
.j,,.;:;
,~ii.
I
D
.'
N
.\\,\'.,,'$
.\\\'
,,,1:."'\~,..'\'Ii;
.,\':!:);
"' ),-
~'~/",A~
0Two-Mile Well
B
eH-B
<;,;/",i':;""
H-S.Engle Welle
A. B, C, 0 Facies
=====> Paleoflow Direction
.... Flow Direction
-' - Facies Border
0, 0.. Well location
~llr,..,111" .111i" Nash Draw
TRI-6330-78-1
Figure 1-34. Paleoflow (late Pleistocene) directions for groundwater in the Culebramember of the Rustler Formation from likely recharge areas on outcrops inNash Draw. Paleoflow directions are superimposed on hydrochemicalfacies boundaries and modern flow directions interpreted from numericalmodeling of'physical hydrology measurements.
1-96

Chapter 1 (Siegel and Lambert)
consistent with the present-day correlation of halite occurrence in the Rustler and the
hydrochemical facies pattern (Figure 1-13). The halite might never have been deposited in
the south, or pre-existing halite may have been removed by earlier dissolution during the
development of the southeastern lobe of Nash Draw, which is included in Zone B. This
dissolution, however, would have taken place in response to an episode of groundwater
flow older than the present regime that began as early as 16,000 years ago. This older
episode of dissolution could have occurred as early as 600,000 years ago, in a time of wetter
climate while Nash Draw was still forming as part of the channel system of the ancestral
Pecos River (Bachman, 1980). It is also conceivable that the zone of higher Culebra
transmissivity south of the WIPP Site (Lappin, 1988) toward the southeastern lobe of Nash
Draw is simply a manifestation of the same processes that have contributed to the widening
of Nash Draw. Such processes are apparently responsible for an increasing transmissivity
west of the WIPP Site toward the central axis of Nash Draw. By logical extension, it is
likely that similar processes have created a "fringe" zone of increased transmissivity for
some distance outward in all directions from various parts of Nash Draw (beyond its
marginal scarp), including the southeastern lobe.
A karstic fringe zone along a stretch of the ancestral (Tertiary/Pleistocene) Pecos River
further south was proposed by Bachman (1984) as a consequence of evaporite dissolution
adjacent to the stream channel. There the thickness of the saturated zone approached
1500 ft, in which groundwater lost by upgradient seepage from the stream system dissolved
halite throughout the Salado Formation and discharged downgradient. A similar
mechanism may have acted on a smaller scale to dissolve evaporites adjacent to the Nash
Draw stream system during the Pleistocene, contributing to the development of a marginal
zone of enhanced transmissivity locally extending as far east as the WIPP Site. If the water
table in the late Pleistocene (at the apparent time of latest Culebra recharge) was at an
elevation (about 2977 ft) comparable to that reported for the water table that has arisen
from historic potash-brine dumping in Nash Draw (Hunter, 1985), Nash Draw was a
possible recharge area for the Culebra, because the base of the Culebra at known points
east of Nash Draw is at lower elevations.
1-97

Chapter 1 (Siegel and Lambert)
1.5.2.3 Zonation of Normative Solute Characteristics
The results of Bodine et al. (Chapter 4) suggest that the salt norm distribution is generally
consistent with the generalized zonation of solute distributions proposed by Ramey (1985)
and further developed by Siegel et al. in Chapter 2. The conceptual model reported by
Bodine et al. for Rustler solute distributions involves varying degrees of dilution of
primitive-diagenetic brines similar to that found in the low-permeability, halite-rich strata
east of the WIPP Site (e.g., P-18 in Zone A; see Figure 1-2). P-14 Culebra water also
displays a primitive-diagenetic solute norm. The diluent proposed to have infiltrated from
the surface (e.g., recharge fluid) has normative solute characteristics similar to those of
waters sampled from the siliciclastic alluvium in WIPP-15 (see Figure 1-2). Hydrolysis of
feldspars undergoing weathering in channel deposits of the Gatuna Formation (described
by Bachman, 1985) north and west of the WIPP Site is a potential source of solutes bearing
a Na-HC03
or -SO4 normative signature. This alkali-carbonate or -sulfate norm is
preserved in Zone B, represented by waters from H-7, -8, and -9 south of the WIPP Site.
Fresh waters infiltrating through this weathering zone acquired this solute assemblage, and
dissolved halite and anhydrite/gypsum in the Rustler, giving norms characteristic of such
dissolution (Zone C). In such dissolution brines, the alkali-carbonate or -sulfate norm may
not be preserved. Increasing proportions of recharge water have mixed with the primitive
water with increasing distance from P-18 and P-14. Note, however, the anomalous position
of the primitive-diagenetic solute norm at P-14, which lies within Zone C rather than Zone
A. This suggests that either Zone A-type solutes were at one time more widespread, or
that the primitive-diagenetic norm at P-14 is more locally controlled.
The mixing/dilution model of Bodine et al. in Chapter 4 relies heavily on extensive
recharge at some time (vertical, lateral, or both), especially in the southern part of the site,
to provide the fluids which dilute a pre-existing, perhaps regionally pervasive, primitive
diagenetic signature. The timing of such recharge, however, is unspecified by the model.
The isotopic, mineralogic, and hydrologic data discussed in other sections of this report
suggest that vertical recharge to the Culebra in the WIPP area and to the east has not
occurred for several thousand years.
1-98

Chapter 1 (Siegel and Lambert)
1.5.2.4 The Degree of Hydraulic Versus Geochemical Confinement
Hydrologic testing has revealed that on the time scale of a few months the Culebra is
hydrologically confined at all sites that have been sampled, except WIPP-25, WIPP-26, and~
WIPP-29. Generally, the hydraulic relationships suggest only limited vertical connection
between the Culebra and overlying strata. Whereas hydraulic measurements can quantify
short-term responses of the hydrologic flow system to transient pressure pulses such as slug
and pump-testing, geochemical measurements are more related to mass transport and
rock/water interactions that take place over longer periods, up to several thousand years.
Several geochemical observations are relevant to the degree of confinement of the Culebra
waters over long periods of time. First, available radiocarbon ages in the Culebra are in
excess of 12,000 to 16,000 years. The three model ages (at H-6, H-4, and H-9) were deter
mined at localities that effectively "bracket" the WIPP Site on the north and south. The
lack of a statistically significant difference among these ages, and the lack of a north-south
gradient in apparent age suggest either that rates of vertical infiltration at each location
have been virtually identical, or that lateral flow times to each location from the surface
recharge area(s) have been virtually identical. Given the significant geological differences
in the Culebra environment among the three localities, the first prospect is unlikely. The
second prospect is more consistent with the available uranium-isotope and solute data,
especially considering the significant differences in solutes among the three sampling
localities. Similarly, the absence of a statistically significant vertical gradient in apparent
age in the south (14,900 years in the Culebra at H-9 versus 14,000 years in the overlying
Dewey Lake at the nearby Pocket well) is inconsistent with a significant degree of modern
vertical infiltration there. In any case, groundwater has been isolated from the atmosphere
for about the same length of time at all three points in the Culebra.
Second, the preservation of extensive amounts of anhydrite and a varying water/rock ratio
during partial gypsification in the nondolomitic Rustler units overlying the Culebra suggest
that significant amounts of water have not permeated vertically from the surface to
recharge the Culebra where thick beds of overlying anhydrite are preserved. As noted by
1-99

Chapter 1 (Siegel and Lambert)
Beauheim (1987), at two points the modern Magenta head is higher than that in the over
lying Forty-niner, precluding a direct throughgoing connection between the surface and the
Culebra in at least parts of the WIPP area at the present time (see Figure 1-7).
Third, strontium isotope data suggest that vertical material transport from the surface to
layers underlying the Dewey Lake Red Beds has not been extensive. Even at the localities
of suspected vertical solution or fracture channels (e.g., WIPP-14, WIPP-33, and WIPP-34),
the 87Sr/86Sr ratios in the partially gypsified anhydrites of the Forty-niner and Tamarisk
b . d' .. I d' f f . h' h' h 87S /86S .mem ers m Icate minIma a mIXture 0 sur ace-type strontIUm avmg a Ig r r ratio,
a moderate amount of such admixture in the Culebra, and extensive admixture in the
Dewey Lake. This stratification of strontium constitutes evidence of minimal mass
transport across the Rustler/Dewey Lake contact, while allowing lateral transport of some
surface-type strontium through the Culebra from its near-surface exposures.
Finally, at certain localities previously suspected to represent karst conduits (e.g., WIPP-14
and WIPP-34) the water/rock ratios in gypsiferous horizons adjacent to the water-bearing
dolomites are significantly lower than in the dolomites themselves, as suggested by the
D/H ratios of gypsum and of various groundwaters. Such variations in the water/rock ratio
are consistent with some water having escaped from the dolomite into adjacent beds
(perhaps acquiring some solutes from halite dissolution). These variations are not consis
tent with water migrating downward into the Culebra, during which water would first pass
through a region of low water/rock ratio without having affected the gypsification of
overlying anhydrite. If this were a significant mechanism of recharge to the Culebra, the
stable-isotope composition of Culebra waters would exhibit a measurable shift away from
meteoric values as a result of water/rock interaction in a zone of low water/rock ratio.
1.6 SUMMARY
Based on the available data on formation pressures, fluid density distribution, and transmis
sivities, modern flow within the Culebra at and near the WIPP Site appears to be largely
1-100
Chapter 1 (Siegel and Lambert)
north-to-south, except in relatively low-transmissivity areas directly affected by either the
high-transmissivity zone in the southeastern portion of the WIPP Site or by Nash Draw
west of the WIPP Site. The amount of possible vertical flow into and out of the Culebra
near the center of the WIPP Site remains indeterminate.
These present-day regional water flow directions are not consistent with the salinity dis
tribution at the WIPP Site, given the assumption of steady-state, confined flow. Zone B, a
hydrochemical facies with low salinity and element ratios inconsistent with halite dissolu
tion, lies downgradient from more saline water in Zone C. In addition, the isotopic data
presented in this report further indicate that inferences about flow direction and velocity
obtained from measurements of modern head potentials and transmissivities may not be
applicable to directions and velocities in the past 10,000 years, or in the next 10,000 years-
the interval of interest to regulatory agencies governing radioactive-waste repositories.
In Chapter 5, Lambert suggests that this apparent anomaly can be explained by a change in
flow direction in the last 30,000, or perhaps 12,000 years. Prior to that time, the recharge
direction was dominantly from the west-northwest. In Chapter 4, Bodine et al. suggest that
solute distribution is derived by mixing of (perhaps originally widespread) primitive
diagenetic brines now found mostly in the low-permeability, halite-rich strata east of the
WIPP Site, with recharge water that has infiltrated from the surface and dissolved halite
and anhydrite/gypsum. The isotopic, mineralogic, and hydrologic data discussed in other
chapters of this report, however, suggest that vertical material transport into the Culebra in
the WIPP area and to the east and south has not occurred to a significant degree for
several thousand years (see Chapter 5). The SNORM results are not inconsistent with the
isotopic results if the recharge component proposed in Chapter 4 moved from its
paleorecharge area (Rustler outcrops in Nash Draw), where it acquired its alkali
carbonate/sulfate signature, thence laterally (stratabound) toward the east-southeast,
preserving isotopic indicators of age (radiocarbon) and paleoflow direction (uranium).
Such a paleoflow direction from nearby paleorecharge areas could also have resulted in the
1-101

Chapter 1 (Siegel and Lambert)
preservation of the northwest-southeast orientation of the hydrochemical facies transition
zone between Zones Band C.
Waters in the Culebra are undersaturated with respect to halite and anhydrite and
saturated with respect to gypsum. Evaluation of water/carbonate (calcite and dolomite)
equilibria is hindered by uncertainties in pH related to potential loss of CO2
gas during
sample collection. A model for the chemical evolution of water in the Culebra proposed by
Siegel et al. in Chapter 2 suggests that dissolution of salt and concomitant changes in
mineral solubilities constitute an important irreversible process affecting water chemistry.
Na, Cl, Mg, K, and SO4 are added to the Culebra by dissolution of evaporite salts in ad
jacent strata. Equilibrium is maintained with gypsum and calcite, but dolomite
supersaturation increases as the salinity of the water increases. Isotopic studies of minerals
and waters provide some support for this model.
Controls on the distribution of minor and trace elements are more problematical. For
waters of lower ionic strength, the contribution of solutes from silicates may be more
important. The results of the PCA described by Siegel et al. in Chapter 2 suggest that
reactions with clay minerals may exert an observable influence on the distribution of Si02
,
Mg, Li, and B throughout the entire study area.
1-102

Chapter 1 (Siegel and Lambert)
1.7 REFERENCES
Allison, G. B. 1982. "The Relationship between 180 and Deuterium in Wate.r in Sand
Columns undergoing Evaporation." Journal ofHydrology, Vol. 55:163-169.
Allison, G. B., W. J. Stone, and M. W. Hughes. 1985. "Recharge in Karst and Dune
Elements of a Semi-arid Landscape as Indicated by Natural Isotopes and Chloride."
Journal of Hydrology, Vol. 76:1-25.
Bachman, G. O. 1980. Regional Geology and Cenozoic History of the Pecos Region,
Southeastern New Mexico. Open File Report 80-1099. Denver, CO: US Geological Survey.
Bachman, G. O. 1981. Geology ofNash Draw, Eddy County, New Mexico. Open File Report
81-31. Denver, CO: US Geological Survey.
Bachman, G. O. 1984. Regional Geology of the Dchoan Evaporites, Northern Part of the
Delaware Basin. Circular 184. Socorro, NM: Bureau of Mines and Mineral Resources.
Bachman, G. O. 1985. Assessment of Near-Surface Dissolution at and near the Waste
Isolation Pilot Plant (WIPP), Southeastern New Mexico. SAND84-7178. Albuquerque, NM:
Sandia National Laboratories.
Barr, G. E., S. J. Lambert, and J. A. Carter. 1979. "Uranium Isotope Disequilibrium in
Groundwaters of Southeastern New Mexico and Implications Regarding Age-Dating of
Waters." Proceedings of the International Symposium on Isotope Hydrology. Vol 2.
STI/PUB/493. Vienna, Austria: International Atomic Energy Agency. 645-660.
1-103
Chapter 1 (Siegel and Lambert)
Beauheim, R. L. 1987. Interpretations of Single-Well Hydraulic Tests Conducted at and near
the Waste Isolation Pilot Plant (WIPP) Site, 1983-1987. SAND87-0039. Albuquerque, NM:
Sandia National Laboratories.
Bodine, M. W., Jr., and B. F. Jones. 1986. The Salt Norm: A Quantitative Chemical
Mineralogical Characterization ofNatural Waters. Water Resources Investigation Report 86
4086. Reston, VA: US Geological Survey.
Brookins, D. G., and S. J. Lambert. 1987. "K-Ar and Rb-Sr Age Determinations from Clay
Minerals and Related Minerals from the WIPP (Waste Isolation Pilot Plant), Southeastern
New Mexico." IsochronjWest No. 49:4-7.
Brookins, D. G., and S. J. Lambert. 1988. "WIPP Site Studies: Secondary Selenite Veins in
the Rustler Formation and Dewey Lake Red Beds." Materials Research Society Symposium
Proceedings. Vol. 112:233-241.
Brookins, D. G., J. K. Register, and H. Krueger. 1980. "Potassium-Argon Dating of
Polyhalite in Southeast New Mexico." Geochimica et CosmochimicaActa, Vol. 44:635-{i37.
Chapman, J. B. 1988. Chemical and Radiochemical Characteristics of Groundwater in the
Culebra Dolomite, Southeastern New Mexico. EEG-39. Santa Fe, NM: New Mexico
Environmental Evaluation Group.
Craig, H., L. I. Gordon, and Y. Horibe. 1963. "Isotopic Exchange Effects in the
Evaporation of Water, I: Low-Temperature Experimental Results." Journal of Geophysical
Research, Vol. 68:5079-5087.
1-104

Chapter 1 (Siegel and Lambert)
Deer, W. A, R. A Howie, and J. Zussman. 1962. Rock-Fonning Minerals. Vol. 3, Sheet
Silicates. Vol. 4, Framework Silicates. Vol. 5, Non-Silicates. London: Longman.
Evans, G. V., R. L. Odet, R. A Downing, R. A Monkhouse, and G. Rae. 1979. "Some
Problems in the Interpretation of Isotope Measurements in United Kingdom Aquifers."
Proceedings of the International Symposium on Isotope Hydrology, Vol. 2. STI/PUB 493.
Vienna, Austria: International Atomic Energy Agency. 679-706.
Fleischer, M. 1987. Glossary of Mineral Species. Tucson, AZ: the Mineralogical Record,
Inc.
Haug, A, V. A Kelly, AM. LaVenue, and J. F. Pickens. 1987. Modeling of Ground-Water
Flow in the Culebra Dolomite at the Waste Isolation Pilot Plant (WIPP) Site. SAND86-7167.
Albuquerque, NM: Sandia National Laboratories.
Helgeson, H. C. 1968. "Evaluation of Irreversible Reactions in Geochemical Processes
Involving Minerals and Aqueous Solutions. I. Thermodynamic Relations." Geochimica et
CosmochimicaActa. Vol. 32:853-877.
Hunter, R. L. 1985. A Regional Water Balance for the Waste Isolation Pilot Plant (WIPP)
Site and Su"ounding Area. SAND84-2233. Albuquerque, NM: Sandia National
Laboratories.
Isaacson, R. E., L. E. Brownell, R. W. Nelson, and E. L. Roetman. 1974. "Soil-Moisture
Transport in Arid Site Vadose Zones." Proceedings of the International Symposium on
Isotope Hydrology:97-114.
1-105

Chapter 1 (Siegel and Lambert)
Lambert, S. J. 1978. "Geochemistry of Delaware Basin Groundwaters." Geology and
Mineral Deposits of Ochoan Rocks in Delaware Basin and Adjacent Areas. Ed. G. S. Austin.
Circular 159. Socorro, NM: New Mexico Bureau of Mines and Mineral Resources. 33-38.
Lambert, S. J. 1983. Dissolution of Evaporites in and Around the Delaware Basin,
Southeastern New Mexico and West Texas. SAND82-0461. Albuquerque, NM: Sandia
National Laboratories.
Lambert, S. J. 1987. Feasibility Study: Applicability of Geochronologic Methods Involving
Radiocarbon and Other Nuclides to the Groundwater Hydrology of the Rustler Formation.
SAND86-1054. Albuquerque, NM: Sandia National Laboratories.
Lambert, S. J., and J. A. Carter. 1984. Uranium-Isotope Disequilibrium in Brine Reservoirs
of the Castile Formation, Northern Delaware Basin, Southeastern New Mexico. 1: Principles
and Methods. SAND83-0144. Albuquerque, NM: Sandia National Laboratories.
Lambert, S. J., and J. A. Carter. 1987. Uranium-Isotope Systematics in Groundwaters of the
Rustler Formation, Northern Delaware Basin, Southeastern New Mexico. SAND87.Q388.
Albuquerque, NM: Sandia National Laboratories.
Lambert, S. J., and D. M. Harvey. 1987. Stable-Isotope Geochemistry of Groundwaters in
the Delaware Basin of Southeastern New Mexico. SAND87-0138. Albuquerque, NM:
Sandia National Laboratories.
Lambert, S. J., and K. L. Robinson. 1984. Field Geochemical Studies of Groundwaters in
Nash Draw, Southeastern New Mexico. SAND83-1122. Albuquerque, NM: Sandia
National Laboratories.
1-106

Chapter 1 (Siegel and Lambert)
Lappin, A. R. 1988. Summary of Site-Characterization Studies Conducted from 1983
Through 1987 at the Waste Isolation Pilot Plant (WIPP) Site, Southeastern New Mexico.
SAND88-0157. Albuquerque, NM: Sandia National Laboratories.
LaVenue, A. M., A. Haug, and V. A. Kelley. 1988. Numerical Simulation of Ground-Water
Flow in the Culebra Dolomite at the Waste Isolation Pilot Plant (WIPP) Site. SAND88-7002.
Albuquerque, NM: Sandia National Laboratories.
Mercer, J. W. 1983. Geohydrology of the Proposed Waste Isolation Pilot Plant Site, Los
Medaiios Area, Southeastern New Mexico. Water Resources Investigation Report 834016.
Albuquerque, NM: US Geological Survey.
Mercer, J. W. and B. R. Orr. 1979. Interim Data Report on the Geohydrology of the
Proposed Waste Isolation Pilot Plant Site, Southeast New Mexico. Water Resources
Investigation Report 79-98. Albuquerque, NM: US Geological Survey.
Nativ, R., and D. A. Smith. 1987. "Hydrogeology and Geochemistry of the Ogallala
Aquifer, Southern High Plains." Journal ofHydrology, Vol. 91:217-253.
Osmond, J. K., and J. B. Cowart. 1976. "The Theory and Uses of Natural Uranium
Isotopic Variations in Hydrology." Atomic Energy Review, Vol. 14:621-679.
Parry, W. T., C. C. Reeves, Jr., and J. W. Leach. 1970. "Oxygen and Carbon Isotope
Composition of West Texas Lake Carbonates." Geochimica et Cosmochimica Acta,
Vol. 34:825-830.
Plummer, L. N. 1984. "Geochemical Modeling: A Comparison of Forward and Inverse
Methods." Proceedings First Canadian/American Conference on Hydrogeology. Ed. B.
Hitchen and E. I. Wallick. Worthington, Ohio: National Water Well Association.
1-107

Chapter 1 (Siegel and Lambert)
Plummer, L. N., D. L. Parkhurst, G. W. Fleming, and S. A. Dunkle. 1988. "PHRQPITZ
A Computer Program for Geochemical Calculations in Brines." Water Resources
Investigation unpublished report. Reston, VA: US Geological Survey.
Powers, D. W., S. J. Lambert, S. E. Shaffer, L. R. Hill, and W. D. Weart, ed. 1978.
Geological Characterization Report, Waste Isolation Pilot Plant (WIPP) Site, Southeastern
New Mexico. SAND78-1596. Albuquerque, NM: Sandia National Laboratories.
Ramey, D. S. 1985. Chemistry of Rustler Fluids. EEG-31. Santa Fe, NM: New Mexico
Environmental Evaluation Group.
Randall, W. S., M. E. Crawley, and M. L. Lyon. 1988. Annual Water Quality Data Report
for the Waste Isolation Pilot Plant. DOE-WIPP 88-D06. Carlsbad, NM: Waste Isolation
Pilot Plant Project Office.
Register, J. K., and D. G. Brookins. 1980. "Rb-Sr Isochron Age of Evaporite Minerals
from the Salado Formation (Late Permian), Southeastern New Mexico." IsochronjWest,
No. 29.
Robinson, K. L. 1988. Analysis of Solutes in Groundwaters from the Rustler Formation at
and near the WIPP Site. SAND86-0917. Albuquerque, NM: Sandia National Laboratories.
Robinson, T. W., and W. B. Lang. 1938. "Geology and Ground-Water Conditions of the
Pecos River Valley in the Vicinity of Laguna Grande de la Sal, New Mexico, with Special
Reference to the Salt Content of the River Water. New Mexico State Engineer. 77-100.
1-108

Chapter 1 (Siegel and Lambert)
Snyder, R. P. 1985. Dissolution of Halite and Gypsum, and Hydration of Anhydrite to
Gypsum, Rustler Formation, in the Vicinity of the Waste Isolation Pilot Plant, Southeastern
New Mexico. Open File Report 85-229. Denver, CO: US Geological Survey.
Statistical Analysis System Institute. 1982. SAS User's Guide: Statistics.
Uhland, D. W., and W. S. Randall. 1986. Annual Water Quality Data Report. DOE-WIPP
86-006. Carlsbad, NM: Waste Isolation Pilot Plant Project Office.
Uhland, D. W., W. S. Randall, and R. C. Carrasco. 1987. Annual Water Quality Data
Report, March, 1987. DOE-WIPP-87-006. Carlsbad, NM: Waste Isolation Pilot Plant
Project Office.
United States Department of Energy and the State of New Mexico. 1988. "Agreement for
Consultation and Cooperation between Department of Energy and the State of New
Mexico on the Waste Isolation Pilot Plant: Updated April 18, 1988." Appendix 11:3. On
file at the Waste Management and Transportation Library, Sandia National Laboratories,
Albuquerque, New Mexico.
Van Devender, T. R. 1980. "Holocene Plant Remains from Rocky Arroyo and Last Chance
Canyon, Eddy County, New Mexico." The Southwestern Naturalist, Vol. 25:361-372.
1-109


