
This article was downloaded by: [McMaster University]On: 16 October 2014, At: 13:15Publisher: RoutledgeInforma Ltd Registered in England and Wales Registered Number: 1072954 Registered office: Mortimer House,37-41 Mortimer Street, London W1T 3JH, UK
Journal of Motor BehaviorPublication details, including instructions for authors and subscription information:http://www.tandfonline.com/loi/vjmb20
Human Eye Movements during Visually Guided SteppingMark A. Hollands a , Dilwyn E. Marple-Horvat a , Sebastian Henkes a & Andrew K. Rowan aa University of Bristol , Bristol, U.K.Published online: 14 Jul 2010.
To cite this article: Mark A. Hollands , Dilwyn E. Marple-Horvat , Sebastian Henkes & Andrew K. Rowan (1995) Human EyeMovements during Visually Guided Stepping, Journal of Motor Behavior, 27:2, 155-163, DOI: 10.1080/00222895.1995.9941707
To link to this article: http://dx.doi.org/10.1080/00222895.1995.9941707
PLEASE SCROLL DOWN FOR ARTICLE
Taylor & Francis makes every effort to ensure the accuracy of all the information (the “Content”) contained in thepublications on our platform. However, Taylor & Francis, our agents, and our licensors make no representations orwarranties whatsoever as to the accuracy, completeness, or suitability for any purpose of the Content. Any opinionsand views expressed in this publication are the opinions and views of the authors, and are not the views of orendorsed by Taylor & Francis. The accuracy of the Content should not be relied upon and should be independentlyverified with primary sources of information. Taylor and Francis shall not be liable for any losses, actions, claims,proceedings, demands, costs, expenses, damages, and other liabilities whatsoever or howsoever caused arisingdirectly or indirectly in connection with, in relation to or arising out of the use of the Content.
This article may be used for research, teaching, and private study purposes. Any substantial or systematicreproduction, redistribution, reselling, loan, sub-licensing, systematic supply, or distribution in any form to anyoneis expressly forbidden. Terms & Conditions of access and use can be found at http://www.tandfonline.com/page/terms-and-conditions

Journal of Motor Behavior, 1995, Vol. 27. No. 2, 155-163
Human Eye Movements During Visually Guided Steppina
Y
Mark A- Hollands Dilwyn E. Marple-Horvat Sebastian Henkes Andrew K. Rowan University of Bristol Bristol, U.K.
ABSTRACT. Visually guided locomotion was studied in an experiment in which human subjects (N = 8) had to accurately negotiate a series of irregularly spaced stepping-stones while in- frared reflectometry and electrooculography were used to con- tinuously record their eye movements. On average, 68% of sac- cades made toward the next target of footfall had been completed (visual target capture had occurred) while the foot to be positioned was still on the ground; the remainder were completed in the first 300 ms of the swing phase. The subjects’ gaze remained fixed on a target, on average, until 51 ms after making contact with it, with little variation. A greater amount of variation was seen in the timing of trailing footlift relative to visual target capture. Assuming that subjects sampled the vis- ual cues as and when they were required, visual information appeared most useful when the foot to be positioned was still on the ground.
Key words: eye movements, locomotion, visuomotor
he environment through which we move consists of T irregular terrain cluttered with obstacles. As a result, a walking animal needs more than the simple reflex re- sponses or stereotyped rhythms, provided by spinal cir- cuitry, to perform purposeful actions efficiently. Su- praspinal motor control centers process a constant flow of incoming information and regulate gait patterns ac- cordingly. Most of the adaptations are in response to vis- ual cues, but the nature of these cues and how they are used to modify the basic locomotor synergy has not, un- til recently, received much attention.
Lee, Lishman, and Thomson (1982) investigated regu- lation of gait in long jumping and found fairly stereo- typed stride patterns during the run up to the board; ac- cumulated positional errors were regulated only in the last few strides before arrival at the take-off board. Dur- ing this “homing-in” phase, athletes regulated the verti- cal impulse of their steps to adjust their flight times so they would accurately strike the board. That they ad-
justed flight times rather than the spatial parameters of their gait suggests that the athletes were using informa- tion about how far in time they were from the board; time to contact was specified directly by the inverse of the rate of dilation of the retinal image of the board. (This information is available in the absence of information re- garding speed and distance from the board [Lee, 1980; see also Schiff & Detwiler, 19791.) Vertical impulse also seemed to be the controlled parameter for varying step length when running (Warren, Young, & Lee 1986). The visual information used to control vertical impulse was apparently provided by the “optic variable time,” which specifies time to contact when the velocity of an ap- proaching object remains constant.
In both long jumping and running, visual cues become important the moment that the process of avoidance or homing-in to the visual target needs to begin. The dis- tance of this point relative to the target depends upon several factors, such as speed of approach and the com- plexity of the adjustments that need to be made. Cutting, Springer, Braren, and Johnson (1992) divided this dis- tance into several components and calculated that by far the largest was the reaction time distance; the distance required to modify footfall was the least significant com- ponent. Gaze must therefore be adjusted so that informa- tion about an obstacle or footfall target can be received at least as far away as the sum of these components.
Once within the domain where visual cues are neces- sary, the timing of the visual sampling in relation to the
Correspondence address: Mark A. Hollands. Department of Physiology, University of Bristol School of Medical Science, University Walk, Brktol, BS8 ITD, U.K. E-mail address: M. HollandsQbristol.ac.uk
155
Dow
nloa
ded
by [
McM
aste
r U
nive
rsity
] at
13:
15 1
6 O
ctob
er 2
014
M. A. Hollands, D. E. Marple-Horvat, S. Henkes, &A. K. Rowan
step cycle is important, rather than the quantity. For ex- ample, with intermittent illumination during stepping, a very brief or instantaneous availability of visual informa- tion at particular points in time is more beneficial than longer lasting illumination at other times (see Assaiante, Marchand, & Amblard, 1989). Laurent and Thomson (1988) went some way to determining when visual cues are most beneficial by measuring the effect of intermit- tent visual sampling on the ability of subjects to walk toward and step onto a static target (subjects shortened or lengthened their strides to attain the required loca- tion). A brief pulse of light was given either during the stance phase or the swing phase of the foot to be posi- tioned. When the light was delivered during the swing phase, locomotion became awkward and ill-coordinated. Laurent and Thomson concluded that visual information is most useful at particular times in the locomotor se- quence, specifically, that it is more beneficial to planning if received when the foot to be repositioned is still on the ground (see also Assaiante et al., 1989).
Visual cues are therefore used to regulate step length only at critical points in time, perhaps depending on the size of the adjustment that is needed. The greater the re- quired adjustment, the longer the time that is needed (Patla, Robinson, Samways, & Armstrong, 1989).
The reason why sampling must occur at specific points in the action sequence presumably reflects the mecha- nisms used in altering gait: changing either step length or direction or both. Step length could be adjusted by changing reach at heel strike or by delaying or advancing heel strike; although this could occur late in the swing phase of the leg, such adjustment can easily leave the in- dividual off balance and can require further compensa- tory movements (which is, at best, inefficient). Hence, the use of the vertical impulse to regulate step length (Lee et al., 1982; Warren et al., 1986), in combination with more complex task-specific adaptations, is rendered necessary by important balance requirements (Patla et al., 1989).
Change in direction (to avoid obstacles or reach foot- fall targets) has been investigated by Patla, Prentice, Rob- inson, and Neufield (1991). A visual cue, delivered at two different times during walking, prompted subjects to al- ter direction by 60". They were unable to do this during the ongoing step but rarely failed when the cue to change was given on the previous step. Patla et al. concluded that subjects must plan direction change in the previous step so the acceleration of the body's center of mass toward the landing foot can be reduced to near zero. This allows translation of the center of mass toward the limb about to start the swing phase to begin earlier.
It has therefore been demonstrated that the visual cues associated with complex locomotor behavior need be used only at certain points in time during the step cycle. Evidence suggests that, while walking or running, visual cues are most useful when the foot to be positioned is on the ground. This is consistent with the theory of Lee et al., 1982, that step length is determined almost entirely
by the vertical component of the impulse applied during the stance phase. Other evidence suggests that informa- tion required to regulate step length is needed at different times, depending on the size of the required adjustment. The time required to preplan a change in direction ap- pears to be constrained by the mechanics involved in moving the body's center of mass to the required lo- cation.
In the experiments described above, visual information was given only at certain times during the step cycle, and the moment that an individual required visual informa- tion to perform precise footfall was inferred from how well subjects performed the given task under the different conditions. In contrast, our objective was to directly measure the point in time during the step cycle when vis- ual information is sampled and what that information comprises, which we achieved by accurately measuring eye movements continuously during a task that required precise placement of the feet at every step. Working on the assumption that individuals sample the most benefi- cial visual cues as and when they are required, this method should yield information on their nature and ex- actly when during the step cycle they are required to allow precision stepping.
Method
The Locomotor Tusk In this experiment, subjects were required to walk
upon a series of stepping-stones, arranged so as to de- mand precise foot placement at every step. Two different techniques were used to continuously record eye move- ments. The underlying rationale was that if the recorded eye movements could be related to the targets of footfall, the results should provide information regarding how and when visual cues are used in relation to the step cycle.
Subjects were asked to walk along a pathway of 18 irregularly spaced stepping-stones. The stones measured 10 X 10 cm and were attached to a 1.8- X 7-m length of heavy-duty white paper. We designed the small size of the stones and the irregularity of their spacing to necessitate visual sampling at every step. We also arranged the stones in a way that would require rela- tively large lateral movements of the walker's body and perhaps generate eye movements with a relatively large horizontal component. The stepping-stones consisted of pieces of copper-clad fiberglass (printed circuit board material) and were interconnected with multistrand equipment wire (invisible to the subject, beneath the pa- per sheet) and earthed. The configuration of stepping- stones is illustrated in Figure 1.
Footfall was recorded via sim- ple logic circuits connected to copper strips attached to the soles of the subjects' footwear. The circuit for each foot was arranged so that the output was 0 V at rest,
Stepping-stones.
Monitoring footfall.
156 Journal of Motor Behavior
Dow
nloa
ded
by [
McM
aste
r U
nive
rsity
] at
13:
15 1
6 O
ctob
er 2
014

Human Eye Movements
I I I
I I I
I I
0
0
0 0 O m 0
FIGURE 1. Diagram showing the configuration of the stepping-stones. Filled squares represent targets for left footfall con- tact, unfilled squares targets for right. The arrow indicates direction of walking.
rising to around 5 V when the foot was in contact with the earthed stepping-stone.
Two methods of measur- ing eye movement were used simultaneously: electroocu- logruphy (EOG) and infrured reflectometry (IR).
Electrooculography was used only to measure hori- zontal eye movements. Silver chloride-coated recording electrodes were placed as close to the outer comer of each eye as was practical, and an earthing electrode was placed in the middle of the forehead. To obtain infrared reflectometry, we mounted two infrared transmitter- detector pairs on a pair of lightweight spectacle frames so as to illuminate the nasal and temporal halves of the left eye (Carpenter, 1977). The whole arrangement was placed below the line of sight in the subject's peripheral visual field. The positioning of the emitterdetector is critical in achieving linear and symmetrical output re- cording differentially between the two detectors for left and right eye movements and was adjusted relative to the eye for each individual until such a signal was received. Correct positioning also minimized the effect of vertical eye movements.
Figure 2 shows a scatter graph of 2,400 consecutive data points taken from a walk lasting 12 s (the same walk illustrated in Figure 3). Clear correlation can be seen be- tween the EOG and IR data (r = .91, N = 2,400) sug- gesting that these two techniques provided an accurate representation of eye movements actually made.
Monitoring eye movement.
Eye movement signals obtained by using these two techniques and contact signals for each foot were digi- tized and recorded on tape for later analysis.
Electronic equipment required for both the eye move- ment and foot contact signals was placed on a mobile trolley that was pushed at an unobtrusive distance be- hind the subjects during the walks. Signals were fed via an umbilicus of screened coaxial cables to an adjacent room containing the digitizing and recording apparatus.
Subjects Eight subjects participated; 4 men and 4 women. Sub-
jects were between 16 and 38 years of age and between 160-185 cm in height. All subjects had normal unim- paired vision.
Protocol Subjects were told to make their way along the walk-
way, treading on each stepping-stone and walking at their own pace. Subjects typically were asked to make eight walks in one session.
A calibration was performed immediately prior to each walk. Subjects were required to make horizontal eye movements of magnitude 10, 20, and 30" left and right of a central point. We accomplished this by using a cali- bration chart on which clear markings were made. A shift of gaze between adjacent markings corresponded to 10" when the card was placed a set distance from the eyes.
June 1995, Vol. 27, No. 2 157
Dow
nloa
ded
by [
McM
aste
r U
nive
rsity
] at
13:
15 1
6 O
ctob
er 2
014

M. A. Hollands, D. E. Marple-Hotvat, S. Henkes, & A. K. Rowan
- -30 -25
+ . , I G . . . , ' . '
-20 -15 x 0 X
Y
0
I
a w
d-
0 N-
t
EOG (DEGREES I .L
FIGURE 2. Scatter graph of 2,400 consecutive data points extracted from the EOG and IR trace5 of one complc x- and y-axes are measured in volts.
ed walk. Th
Subjects were also asked to make vertical eye movements of 10" so that the effect of vertical eye movements on the horizontal eye movement signal could be assessed.
Results Figure 3 depicts the raw data obtained from one com-
pleted walk. Upward deflections on the EOG and IR traces correspond to leftward eye movements, downward deflections to rightward. High levels on the left and right contact traces represent times of foot contact with the stepping-stones.
A clear pattern of eye movements was discernible, with one major saccade per step cycle whose timing and direc- tion suggest that subjects made the saccades to fixate the next footfall target. This finding was supported by fur- ther analysis in which the horizontal component of the amplitude of a particular saccade (e.g., first left, third right) averaged for all subjects and walks (expressed in cm) correlated closely with the lateral displacement be- tween adjacent stepping-stones. Figure 4 shows a least squares linear regression of 17 averaged saccades (9 to the left, 8 to the right) with the lateral distance between the corresponding stepping-stones. A close correlation is evident.
158
The saccade amplitudes were converted to shift in gaze across the walkway (in cm) by simple trigonometry, given their value in degrees and the subject's height and assum- ing that subjects looked vertically downward; actual val- ues would differ only slightly if subjects looked a small distance ahead compared with the large distance repre- sented by their height.
I t is clear, therefore, that subjects made the observed saccades to fixate their gaze upon the next stepping- stone.
Assuming that visual cues were sampled as and when they were required, analysis of timing of footfall in rela- tion to visual target capture (end of saccade) should indi- cate when this information is required for precise footfall. The point in time that the visual cue is sampled and be- comes useful in guiding footfall is specified by the end time of the saccade to the target in question. How then does the end time of the saccade relate to the step cycle?
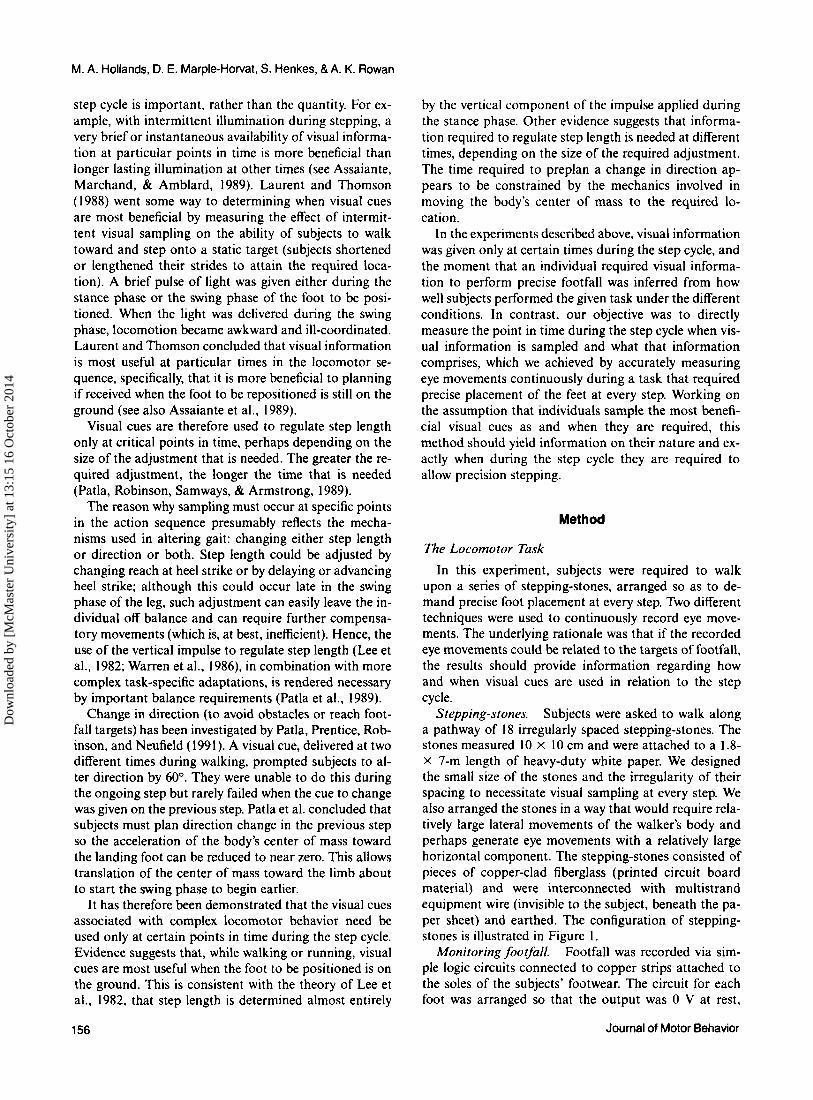
Figure 5A depicts averaged data of left footlift and right footfall relative to visual capture of the next target of the left foot (end time of leftward saccade) for all 8 subjects over 42 walks. The height of the contact trace at time zero corresponds to the percentage of steps (on the average) for which the foot was in contact with a
Journal of Motor Behavior
Dow
nloa
ded
by [
McM
aste
r U
nive
rsity
] at
13:
15 1
6 O
ctob
er 2
014

Human Eye Movements
LCON - - 0 .
1 2 3 4 6 6 7 8 9 10 11 12
RCON 5: 0
0 1 2 3 4 6 6 7 8 9 10 11 12
EQG
I R
Time (seconds)
FIGURE 3. Raw data from one completed walk. Positive values on the EOG and IR traces represent eye movements left of center, in degrees; negative values, right of center. High levels on the LCON and RCON contact traces represent times of foot contact with the stepping-stone.
stepping-stone. On average, at the end of the leftward saccade, the left foot was still in contact with the ground 75% of the time and the right foot had already landed 60% of the time. Similarly, Figure 5B depicts data of right footlift and left footfall relative to the end time of rightward saccades. On average, at the end of the rightward saccade, the right foot was still in contact with the ground 55% of the time and the left foot had already landed 70% of the time. Therefore, on average, footlift appeared to occur a little later when the left foot was targeting than when the right foot was.
Figure 6A illustrates how the relative timing between eye movements (in a particular direction), placed verti- cally in the sequence in which they occurred, and step- ping varied from step to step along the walkway. The first saccade to the left was not included in the results because there was no prior left foot contact.
A leftward saccade toward a stepping-stone left of cen- ter on the walkway was completed, on average, just after the right foot landed on a stepping-stone right of center, and the interval between these two events was fairly con- stant (M, -0.015 s; SO, 0.186); see Figure 6A. The same was true for rightward saccades ( M , -0.078 s, SO, 0.13); see Figure 6B.
The relative timing between a leftward saccade (to a stepping-stone left of center) was not, however, so closely tied to the time at which the left foot lifted from its stepping-stone (to swing toward the next stepping-stone left of center, at which the subject was then looking); see Figure 6C. This looser linkage of timing was also seen for rightward saccades and right footlift (Figure 6D). This variation shows that for some steps in the sequence, sub- jects delayed footlift from the previous stepping-stone. Possibly this reflected the relative complexity of the ad-
June 1995, Vol. 27, No. 2 159
Dow
nloa
ded
by [
McM
aste
r U
nive
rsity
] at
13:
15 1
6 O
ctob
er 2
014

M . A. Hollands, D. E. Marple-Horvat, S . Henkes, & A. K . Rowan
E 90 n
u
aJ a m u u m
W
rc. 0
aJ a 3
U
+
20 25 30 35 40 45 50 55 60 65 70 75 80 Horiz. displ. of footfall targets (cm)
20 25 30 35 40 45 50 55 60 65 70 75 80 Horiz. displ. of footfall targets (cm)
FIGURE 4. A least squares linear regression of 17 averaged saccades, with the lateral distance between the corresponding stepping-stones ( N = 17, r = .7821, p = .0002, two tailed). Nofe. Only 16 data points can be seen on the graph because two points were superimposed, sharing the coordinates.
justments of gait necessary to perform the step, that is, more time was needed to preprogram the action sequence for a more difficult step. Attempts to correlate this delay in footlift, however, with factors including required change in center of balance, step length, and angular change in direction, produced equivocal results.
The infrared technique for measuring horizontal eye movements was affected by vertical eye movements to a degree that varied from subject to subject. Vertical cali- bration consistently showed that the EOG technique was, in contrast, hardly affected. This means that had there been a substantial vertical component to a proportion of the saccades made, there would have been a high degree of noncorrespondence between eye movement signals yielded by the two techniques. The fact that the observed discrepancy was small, however (a high correlation was obtained between the two signals; Figure 2), means that any vertical component to the eye movements made was thus small. Therefore, had vertical eye movement been measured, it is hard to see how our conclusions could have been substantially different. I t is possible that am- plitude of saccade (the vector sum of horizontal and ver- tical components) would have correlated even more highly with the distance between stepping-stones.
Discussion From the general timing and direction of saccades and
the correlation analysis between their amplitude and the
160
lateral distance between adjacent stepping-stones, we can state with confidence that subjects made the observed saccades so their gaze would fixate on the next point of footfall (i.e., the next stepping-stone.) The drift back to- ward center gaze immediately after each saccade can be explained in terms of the subjects’ moving laterally closer to the stepping-stone. If the subject’s gaze remained fixed on the target, and the target moved toward the center of his visual field, clearly the gaze would drift toward the center.
Because the required footfall targets were visible con- stantly throughout the task, the subject’s peripheral vi- sion would have supplied in advance information regard- ing required direction change and approximate position of the stepping-stones. This accounts for the subject’s ability to saccade directly to the next stepping-stone. However, the fact that every subject made a saccade to each stepping-stone prior to making foot contact with it suggests that the precise information provided by foveal vision was at least preferable, if not necessary, to success- fully complete the task. Therefore, ascertaining when fo- veal vision is used should provide information on how such vision guides stepping.
In this experiment, 68% of the saccades to the next target had ended (i.e., new target capture was achieved) when the targeting foot was still in contact with the ground. The remaining saccades were completed in the first 300 ms of the swing phase. These results are consis-
Journal of Motor Behavior
Dow
nloa
ded
by [
McM
aste
r U
nive
rsity
] at
13:
15 1
6 O
ctob
er 2
014
Human Eye Movements
LCON
A
B
P m s
SACCADEI LEFT 1 - b - - - - . - - - - . - - . - . - . - . - - - . . - - - . - - - - -
4.1 -0.4 -0.a -0.0 -0.1 0.1 0.2 0.a 0.4 -
1 _ _ _ _ _ _ _ _ , _ _ _ _ . _ _ _ _ . _ _ _ __ -0.1 i O:I 0.2 0.a 0.4
RCON
SACCADE(RIOHT1
FIGURE 5. (A) Averaged data (8 subjects, 42 walks) of left footlift (LCON) and right footfall (RCON) relative to end time of leftward saccade. The y-axes on the foot contact traces represent percentage of feet in contact with the stepping-stones. (B) Averaged data (8 subjects, 42 walks) of right footlift and left footfall relative to end time of right- ward saccades.
tent with the theory (Laurent & Thomson, 1986) that vis- ual information is most useful when delivered during the stance phase of the targeting foot.
The fact that a subject’s gaze remained fixed on a tar- get until, on average, 51 ms after foot contact had been
made with it suggests that subjects may be able to modify gait even in the latter part of the ongoing step. Subjects seemed to saccade away to the next target only when they were confident that the current footfall was either just about to occur or already had occurred. It is therefore
June 1995, Vol. 27, No. 2 161
Dow
nloa
ded
by [
McM
aste
r U
nive
rsity
] at
13:
15 1
6 O
ctob
er 2
014

M. A. Hollands, D. E. Marple-Horvat, S. Henkes, & A. K. Rowan
End of left saccade B-
520 ow om 0.40 ow 080 1 0 0 120 A End of saccade . Righl Conlacl(secs )
End of righl saccade cP
7 oio 040 060 o m 1 6 0 lio End of saccade . Len contaa(secs
Phase I I
010 020 030 040 050 Ow 070 080 O W 100 l o or End of saccada Len Contact(secs )
D , End of right saccade 1
. . - _ _ _ A End of saccade . Righl conlaa(secs )
FIGURE 6. Relative timing between eye movements (placed vertically in the sequence in which they occurred) and corre- sponding foot contact with the target (indicating footfall and footlift) from step to step along the walkway. The end time of a saccade to a particular stepping-stone is represented by time zero on the x-axis (and other events are timed relative to this in- stant). Shading represents time that the relevant foot was in contact with the stepping-stones. (A) Right footfall and subse- quent footlift (which together indicate timing and duration of the stance phase) relative to end time of leftward saccade. (B) Left footfall and subsequent footlift (which together indicate timing and duration of stance) relative to end time of rightward saccade. (C) Left footlift and subsequent footfall (which together indicate timing and duration of the swing phase) relative to end time of leftward saccade. (D) Right footlift and subsequent footfall (which together indicate timing and duration of swing) relative to end time of rightward saccade.
possible that one requires foveal vision to regulate reach change so that accurate landing on the target may be fine-tuned.
Because subjects were told to walk on the stepping- stones, accurate footfall was the criterion for successful completion of the task. I t is not surprising, therefore, that they made sure this was achieved by fixating the stones until success was certain; this alone might explain why the timing of eye movements was very tightly linked to footfall on a target, more so than was footlift toward a target.
The delay in trailing footlift during some steps in the sequence might suggest, however, that extra time is needed to preprogram gait adjustments of increased
complexity. The reason that particular steps in this task should demand more complex gait modification than others remains unclear. More difficult steps may require larger changes in the position (or its derivatives) of the subject's center of mass.
ACKNOWLEDGMENT
This work was supported by the Physiological Society of Great Britain and the Wellcome Foundation. Technical exper- tise was provided by S. L. Gilbey.
REFERENCES
Assaiante, C.. Marchand. A. R., & Amblard, B. (1989). Dis- crete visual samples may control locomotor equilibrium and
162 Journal of Motor Behavior
Dow
nloa
ded
by [
McM
aste
r U
nive
rsity
] at
13:
15 1
6 O
ctob
er 2
014

Human Eye Movements
foot positioning in man. Journal of Motor Behavior, 21,
Carpenter, R. H. S. (1977). Movements of the eyes. London: Pion.
Cutting, J. E., Springer, K., Braren, P. A., & Johnson, S. H. (1992). Wayfinding on foot from information in retinal, not optical flow. Journal of Experimental Psychology: Human Perception and Performance, 121, 41-72.
Laurent, M., & Thomson, J. A. (1988). The role of visual infor- mation in control of a constrained locomotor task. Journal of Motor Behavior, 20, 17-37.
Lee, D. N. (1980). The optic flow field. Philosophical Transac- tions of the Royal Society, London. B. 290, 169-179.
Lee, D. N., Lishman, J. R., & Thomson, J. A. (1982). Regula- tion of gait in long jumping. Journal of Experimental Psy- chology: Human Perception and Performance, 8, 448-459.
Patla, A. E., Prentice, S. D., Robinson, C., & Neufeld, J. (1991). Visual control of locomotion: Strategies for changing direc-
79-9 1. tion and going over obstacles. Journal of Experimental Psy- chology: Human Perception and Performance, 17, 603-634.
Patla, A. E., Robinson, C., Samways, M., & Armstrong, C. J. (1989). Visual control of step length during overground loco- motion: Task-specific modulation of the locomotor synergy. Journal of Experimental Psychology: Human Perception and Performance, I S , 603-617.
Schiff, W., & Detwiler, M. L. (1979). Information used in judg- ing impending collision. Perception, 8, 647-658.
Thomson, J. A. (1986). Intermittent versus continuous visual control: A reply to Elliott. Journal of Experimental Psychol- ogy: Human Perception and Performance, 12, 392-393.
Warren, W. H., Jr., Young, D. S., & Lee, D. N. (1986). Visual control of step length during running over irregular terrain. Journal of Experimental Psychology: Human Performance and Perception, 12, 259-266.
Submitted November 16, I993
J O U R N A L O F
MOTOR BEHAVIOR ' Devoted to an understanding
of motor behavior as it is most broadly defined, this
W . 8 ... . B . B B B ... . ORDER FORM 0 YES! I would like to order a one-year subscription to Journal of Motor Behavior, published quarterly. I understand payment can be made to Heldref Publications or charged to my VISA/MasterCard (circle one).
: journal presents articles from various perspectives and dif- fering levels of analysis. It . encomDasses all areas of mo-
0 $55.00 individuals 0 $1 10.00 institutions A C C O U N T # E X P I R A T I O N D A T E
S I G N A T U R E tor behavior including psy- chology, kinesiology , neuro-
8 physiology, and biomechan- ics. Of special interest are the processes underlying mo- tor control, learning, and de-
original research, the journal
N A M E I I N S T l T U T l O N
A D D R E S S . C I T Y I S T A T E I Z I P
m C O U N T R Y
ADD $14.00 FOR POSTAGE OUTSIDE THE U.S. ALLOW 6 WEEKS FOR DELIVERY OF FIRST ISSUE. . velopment. ln addition to SEND ORDER FORM AND PAYMENT TO
HELDREF PUBLICATIONS, JOURNAL OF MOTOR BEHAVDR
1319 EIGHTEENTH STREET, NW, WASHINGTON, DC 20036-1802
PHONE (202) 29W67 FAX (202) 296-5149
SUBSCRIPTION ORDERS 1 (800) 3659753
. publishes theoretical and re- . view articles, notes and com- ments, and invited articles by recognized authorities.
.
.
June 1995, Vol. 27, No. 2 163
Dow
nloa
ded
by [
McM
aste
r U
nive
rsity
] at
13:
15 1
6 O
ctob
er 2
014


