
How the Batch Preheating System Can Affect theGlass Current Flow in the Melting Furnace
Mahdie Moaveni
14th
International seminar on furnace design operation & Process simulation 1

SIMULLEX GmbH provides technical consulting to glass manufacturing companies, furnace suppliers, as engineering and project management companies involved in Glass Industries worldwide.Our competence is mainly computer based – CFD simulation of all glass melting and conditioning processes.
Introduction 2

Goal of the Modeling study is to get
knowledge regarding the temperature
profile, the currents in the glass bath and the
combustion space of the glass melting
furnace. Advanced computer modeling and
an analysis of glass melting furnaces are
reliable tools, which allow you to forecast
and to visualize effect of any changes in
geometrical and operational parameters
prior to implementation.
It is useful in the elementary stage of new
furnace concept developments as well as for
the performance optimization of existing
furnaces.
Modeling study 3

Application of Batch preheating system
Application of the Batch and Cullet Preheating System as a reasonable energy recovery from waste gas since several decades in the glass industry
4

Application of Batch preheating system
Batch &
Cullet
Preheating
System
Significant amount of
energy saving by keeping
constant pull rate
Increase of pull rate
by keeping same
amount of energy
consumption
Increase of furnace life time by
keeping constant pull rate
-Replacement of some pre-
reactions of the batch into the
preheater (e.g. water
evaporation) lower
temperatures in the furnace
dust carry-over
-batch pre-treatment
-surface glazing, closed dog
house
-regenerator cleaning
Emission reduction
(NOx, SOx) due to
fossil energy input
decrease
5

Application of Batch preheating system
Sufficient operational data reported by different Batch Preheating System (BPS) suppliers depict 12-14% of energy saving in case of batch preheating up to 250-300°C
Data from Zippe Industrieanlagen GmbH
Specific Energy: appr. 3100 kJ/kg
Cullet: appr. 80%
Proportion Boost: appr. 7 %
6

Application of Batch preheating system
• Most of the experimental information are based on
✓ Energy consumption saving
✓ (more or less) dust carry over
• BUT: Aggressive process on account of very high temperatures allows less experimental
investigations about the effect of BPS on the glass current flow in the furnace; The process
parameters are virtually impossible to measure
• Even the particle trace test can merely give some information about the residence time but not
about the path of particles and other quality factors
Evaluation of processes with BPS
7

Role of the CFD-Simulation for the evaluation
•Realization of the
impact of BPS on
glass current,
temperature
distribution, glass
quality
Investigation
of process
parameters
•Consideration of
overall impact of
furnace features
•Also in
combination with
other elements in
furnace like
boosting and
bubbling
Impact of
BPS
•Optimum furnace
design
•Efficient
implementing of
BPS
Aim of the
investigation
Modeling Study 8
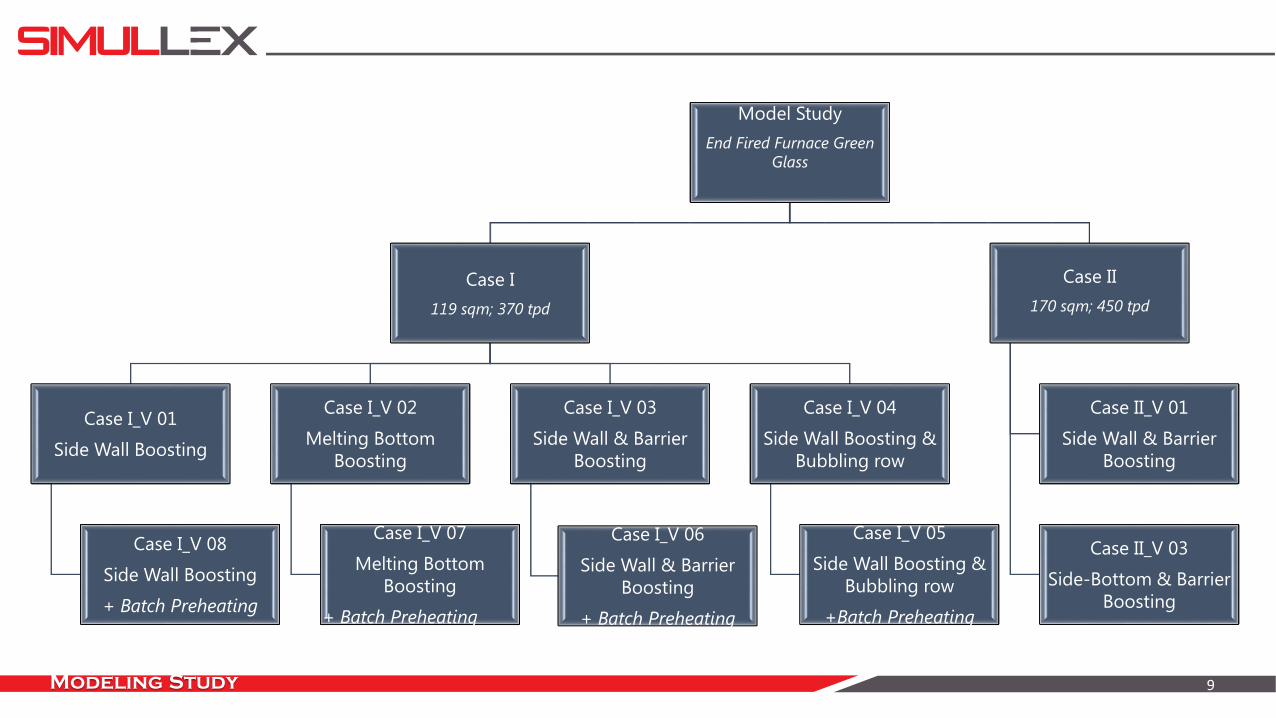
Modeling Study
Model Study
End Fired Furnace Green
Glass
Case I
119 sqm; 370 tpd
Case I_V 01
Side Wall Boosting
Case I_V 08
Side Wall Boosting
+ Batch Preheating
Case I_V 02
Melting Bottom
Boosting
Case I_V 07
Melting Bottom
Boosting
+ Batch Preheating
Case I_V 03
Side Wall & Barrier
Boosting
Case I_V 06
Side Wall & Barrier
Boosting
+ Batch Preheating
Case I_V 04
Side Wall Boosting &
Bubbling row
Case I_V 05
Side Wall Boosting &
Bubbling row
+Batch Preheating
Case II
170 sqm; 450 tpd
Case II_V 01
Side Wall & Barrier
Boosting
Case II_V 03
Side-Bottom & Barrier
Boosting
9

Case I_V 01 (Cold Batch)
&
Case I_V 08 (Preheated
Batch)
12 Side Electrodes
Case I_V 02 (Cold Batch)
&
Case I_V 07 (Preheated
Batch)
12 Melting Bottom
Electrodes
Case I_V 03 (Cold
Batch) &
Case I_V 06 (Preheated
Batch)
6 Side Electrodes &
10 Barrier Electrodes
Case I_V 04 (Cold
Batch) &
Case I_V 05
(Preheated Batch)
6 Side Electrodes
&
10 Bubbling
Nozzles
Case study 10

General Description
14000
8500
Pull Rate tpd 370
Product Container Glass
Color green
Cullet % 60
Length mm 14000
Width mm 8500
Melting Surface sqm 119
Melting Depth mm 1200
Ref. Depth mm 2200
Specific Melting surfacet/sqm 3.11
Doghouse 2 Side wall
Burners 3 (each Port)
General geometry description of all cases
11

Case study
Nm³/h
KW
KJ/Kg
% 8
% 72
% 12,34
12

Comparing the temperature distribution in melting tank and combustion space of the furnace withpreheated batch/ cold batch, considering reduced energy consumption with focus on:
Evaluation of the temperature distribution
✓ Desired riser temperature
✓ Proper bottom temperature
✓ Crown temperature over the wall
Temperature Distribution 13

Temperature Distribution
Boosting Configuration: 12 Side Electrodes
Temperature (°C); Glass melting tank model
Temperature (°C); Combustion model
Cold Batch
PreheatedBatch
14

Average glass Temperature of a slice 50 mm from the bottom along the furnace length
Boosting Configuration: 12 Side Electrodes
Melting areaRiser Temperature
Crown Temperature
Batch Preheating up to 250 °C in case ‘’Side Electrodes configuration’’:➢ Energy consumption reduction up to 12.5%➢ Achieving same riser temperature➢ Lower bottom temperature about 5 to 10 °C➢ Increase of crown temperature over the wall up to 4 °C
Temperature Distribution 15

Temperature distribution
Boosting Configuration: 12 Bottom Electrodes
Temperature (°C); Glass melting tank model
Temperature (°C); Combustion model
Cold Batch
PreheatedBatch
16

Average glass Temperature of a slice 50 mm from the bottom along the furnace length
Boosting Configuration: 12 Bottom Electrodes
Melting area
Riser Temperature
Crown Temperature
Batch Preheating up to 250 °C in case ‘’Bottom Electrodes configuration’’:
➢ Energy consumption reduction up to 12.5%
➢ Higher riser temperature up to 8 °C
➢ Lower bottom temperature about +3 to -7 °C
➢ Increase of crown temperature over the wall up to 4 °C
Temperature distribution 17

Temperature distribution
Boosting Configuration: 6 Side Electrodes & 10 Barrier Electrodes
Temperature (°C); Glass melting tank model
Temperature (°C); Combustion model
Cold Batch
PreheatedBatch
18

Average glass Temperature of a slice 50 mm from the bottom along the furnace length
Boosting Configuration: 6 Side Electrodes & 10 Barrier Electrodes
Melting areaRiser Temperature
Crown Temperature
Batch Preheating up to 250 °C in case ‘’Side & Barrier Electrodes configuration’’:
➢ Energy consumption reduction up to 12.5%
➢ Higher riser temperature up to 5 °C
➢ Nearly same range of temperature +/- 2 °C
➢ Increase of crown temperature over the wall up to 5 °C
Temperature distribution 19

Temperature distriution
Boosting Configuration: 6 Side Electrodes & 10 Barrier Electrodes
Temperature (°C); Glass melting tank model
Temperature (°C); Combustion model
Cold Batch
PreheatedBatch
20

Average glass Temperature of a slice 50 mm from the bottom along the furnace length
Boosting Configuration: 6 Side Electrodes & 10 Bubbling Nozzles
Melting areaRiser Temperature
Crown Temperature
Batch Preheating up to 250 °C in case ‘’Side & Barrier Electrodes configuration’’:
➢ Energy consumption reduction up to 12.5%
➢ Higher riser temperature up to 3 °C
➢ Nearly same range of temperature +/- 2 °C
➢ Increase of crown temperature over the wall up to 4 °C
Temperature distribution 21

Convection Flow; Glass Streamlines; Temperature Profile
Side Boosting Side & Barrier Boosting
Side Boosting & Bubbling
Bottom Boosting
22

Glass Quality Analysis
Glass quality parameters are derived from particle tracking in the glass model.A large number (200 000) of massless particles are released from the batch chargers and their trajectories are calculated through the furnace until the outputs at the model end.
• Calculation of the residence time for each particle in the glass model
• Storage of temperature, viscosity and velocity along each trajectory calculation of the melting, fining and mixing index
• The melting index: indication of the melting quality along the trajectory: a high value means that the particle resides for a long time in regions with high temperature and low viscosity. ∫Trajectory(T/μ)dt,
• The fining index: indication of the fining quality along the trajectory: a high value means that the particle resides for a long time in regions with temperature above a typical fining temperature and low viscosity.
∫trajectory((T − A)b /μc)dt
• The mixing index: indication of the mixing quality or the inhomogeneity dilution along the trajectory: the value denotes how many times a 1 cm thick cord can be diluted along the trajectory.
∫trajectory(4 ||grad v|| 2/3 Dr1/3 )/ (3(0.012/3))dt
Quality Analysis 23

Quality Analysis
Residence time is simply the time which the particle spent on its way between the starting point (batch chargers) and the target planes.
The case with Side & Barrier Boosting shows the highest min. residence time of critical particles with and without preheating system. Furthermore the effect of BPS on Residence time in this case is higher than all other cases.
24

Quality Analysis
Electrode Side Boosting; The path of 10 random fastest particles with minimum residence time.
Temperature (°C); Path of trace particles Temperature (°C); Path of trace particles
25

Quality Analysis
Bottom Boosting; The path of 10 random fastest particles with minimum residence time.
Temperature (°C); Path of trace particles Temperature (°C); Path of trace particles
26

Quality Analysis
Side & Barrier Electrodes; The path of 10 random fastest particles with minimum residence time.
Temperature (°C); Path of trace particles Temperature (°C); Path of trace particles
27

Quality Analysis
Side Electrodes & Bubbling ; The path of 10 random fastest particles with minimum residence time.
Temperature (°C); Path of trace particles Temperature (°C); Path of trace particles
28

Quality Analysis
Melting index is a function of local temperature on the trajectory, of dynamic viscosity of glass and of time. The higher the value of melting index of each trajectory, the longer time has the particle spent in regions of high temperature and of low viscosity.Thus the melting index informs us about the quality of melting along the trajectory. The absolute value of melting index dependson the type of glass.
The Case with Side & Barrier Boosting shows the highest Melting Index of critical particles. Moreover this electric configuration in combination with BPS has the most positive effect on quality of melting.
29

Quality Analysis
Mixing index is an indicator of inhomogeneity dilution capabilities. It is function of local velocity gradient tensor and diffusivity of typical cord compound (Al2O3, SiO2, and ZrO2). The results tell us how many times a 1 cm thick cord has been diluted while it follows the massless particle trajectory.
The Case I_V 03 (Side & Barrier Boosting) shows the highest Mixing Index of critical particles. Subsequently Case I_V 02 (Bottom Boosting) and the lowest value is related to Case I_V 01 (Side Boosting)
30

Quality Analysis
Sand dissolution index is a computation for each massless particle's trajectory which corresponds to sand grain tracing. Statistics are performed on the resulting values. For each trajectory, the theoretical largeness of sand grains that would be able to be dissolved is calculated. Consequently, as the sand grain travels through the glass melt, it gradually dissolves at the rate given by the grain growth function that depends on temperature.
The case with bottom boosting shows the highest values of Sand Dissolution index. Subsequently Case with side & barrier boosting. and the lowest value is related to the Case with Side Boosting.
31

Quality Analysis
Bubble growth index is a refining indicator which depicts the speed of growth and dissolution of the bubbles in the glass melt.
The case with bottom boosting shows the highest values of Sand Dissolution index. Subsequently Case with side & barrier boosting. and the lowest value is related to the Case with Side Boosting.
32

Conclusions:
• Revelation of the Case Study: by preheating up to 250 °C, a specific energy reduction up to appr. 12.5% isachievable
• Generally: improvement of glass quality indicators with BPS implementation observable
• Integrating the BPS + Side & Barrier Boosting
➢ highest value of residence time of critical particles & a more reasonable path of particles achievable
➢ Other indicators (e.g. mixing/melting index & bubble growth) have in the case of Barrier Boosting also thehighest value
➢ But: The Sand Dissolution Index has the highest value in the case with Bottom Electrodes
• Temperature Distribution in the cases of Side Electrodes & Bottom Electrodes: inspite of high riser & crowntemperature → slight decrease of bottom temperature
• In Case of Barrier Boosting or Bubbling implementation still suffiecient bottom temperature can be achieved
→ on account of Convection Current in melting area
• Consequently, it is recommended to apply a vertical element (preferably Barrier Boosting) in front of the wall if a BPS implementation is desired
Conclusions 33

Conclusions:
• Nonetheless, these results are related to the case study with the mentioned boundary conditions, which meansthat for an optimum solution, individual parameters should be taken into account
Conclusions 34

Thanks for your attention!
Dipl.-Ing. Mahdie Moaveni
SIMULLEX GmbHThomastrasse 7,92665 AltenstadtGermanyPhone: +49 9602 6175448Fax: +49 9602 6175449Mobile: +49 151 1213 0275Email: moaveni @simullex.comInternet: www.simullex.com


