
1
How Have M&As Changed? Evidence from the Sixth
Merger Wave
G.Alexandridis, C.F. Mavrovitis, and N.G. Travlos*
October 2010
We examine the characteristics of the sixth merger wave that started in 2003 and came to an
end approximately in mid-2007. The drivers of this wave lie primarily in the availability of
abundant liquidity, in line with neoclassical explanations of merger waves. Acquirers are less
overvalued relative to targets and merger proposals comprise higher cash elements.
Moreover, the market for corporate control is less competitive, acquirers are less acquisitive,
managers display less over-optimism and offers involve significantly lower premiums,
indicating more cautious and rational acquisition decisions. Strikingly however, deals
continue to destroy at least as much value for acquiring shareholders as in the 1990s.
Keywords: Merger waves, public acquisitions, premium, shareholder gains, method of
payment.
JEL Classification: G14, G30, G34
*Alexandridis and Mavrovitis are from the ICMA Centre, Henley Business School, Reading
University, U.K. Travlos is from ALBA Graduate Business School, Greece. Corresponding
author’s email address: [email protected]. Travlos acknowledges financial support
received from the Kitty Kyriacopoulos Chair in Finance. All errors are our own.

2
How have M&As Changed? Evidence from the Sixth Merger Wave
1. Introduction
Recent studies have examined the characteristics and success of M&As during the fifth
merger cycle that started in 1993 and peaked in 2000 where over $1.4 trillion was spent on
U.S. deals. This was marked by extensive overpayment, mega-deals, overvaluation of
acquiring firms, prevalence of equity financing, and significant value destruction for
acquiring firm shareholders (Andrade, Mitchell, and Stafford, 2001; Dong, Hirshleifer,
Richardson, and Teoh, 2006; and Moeller, Schlingemann, and Stulz, 2005). The sixth merger
wave emerged in 2003, only about three years after technology bubble burst and the end of
the fifth merger cycle. M&A activity peaked in 2006 with more than $1 trillion spent on deals
within the U.S. The new wave came to an end approximately in mid-2007, when investors
and corporate managers started showing real signs of skepticism about the state of the MBS
and credit markets and their potential ripple effects on the financial system and the economy
as a whole. As the crisis unfolded, credit tightened and financing became scarce, bringing
deals to a halt. The general macro-, micro-economic, corporate governance and capital
market environment significantly evolved during and following the recession stage that
ensued the fifth merger cycle. Moreover, important lessons were learned from the fifth
merger wave that may have resulted in improvements in the quality of acquisition decisions.
In this paper we examine whether the characteristics and success potential of deals that took
place during the sixth merger wave diverge from the previous experience.
It appears that behavioral theories according to which merger waves are more likely
to occur as a result of overvalued firms seeking to acquire less overvalued assets (Shleifer
and Vishny, 2003 and Rhodes-Kropf and Viswanathan, 2004) are unlikely to explain the
sixth merger cycle. The thriving stock prices amid this wave were based more on sound

3
fundamentals, rather than over-optimistic expectations. Consequently, acquirers‟ assets are
less highly valued relative to the 1990s wave and the valuation diversity between acquirers
and targets is narrower.1 Moreover, we find that the post millenium era is characterized by
lower U.S. corporate loan prime rates and ample cash balances, resulting in more debt and
free cash financing of merger deals. It is therefore more likely that the sixth merger wave was
propagated by the availability of abundant liquidity, in the spirit of Harford‟s (2005)
neoclassical explanation. Both access to cash (Martin, 1996) and firm valuations (Shleifer
and Vishny, 2003) have been associated with the choice of the method of payment and can
explain why a much smaller fraction of deals was financed with stock as opposed to the
1990s paradigm. The proportion of stock-swap financed acquisitions dropped by more than
50% while the overall amount of equity in the financing decreased by about 30%. In contrast,
both the cash financed transactions as well as the cash element in general increased to levels
last observed in the 1980s.
The bullish managerial and investor sentiment during the fifth merger wave led to
record levels of merger activity and regular “control contests” that made acquirers bid more
aggressively and, as a result, be prone to overpayment. If managers have learned their lesson
from this experience, then hubris or empire building motivated acquisition decisions should
be less frequent during the sixth merger cycle and competition for listed targets should be less
intense. We show that the market for corporate control was by 57.3% (25.7%) less
competitive in 2003-2007 compared to 1993-2000 based on the value (number) of listed
firms being targeted in successful deals. Acquisitions by frequent acquirers, that have been
associated with managerial hubris (Billett and Qian, 2008), were also by 35% less common
during the sixth merger wave. A CEO overconfidence measure based on the timing of option
exercise following Malmendier and Tate (2008) also reflects lower levels of managerial
1 Rhodes-Kropf, Robinson, and Viswanathan (2005) and Dong et al. (2006) find that acquirers were more
overvalued than targets in the 1980s and 1990s.
4
overconfidence. Given that premiums increase with takeover competition (Fishman, 1988;
and Alexandridis, Petmezas, and Travlos, 2010) and managerial over-optimism (Roll, 1986),
we should also expect less generous premiums during the sixth merger wave. Moreover, the
corporate governance improvements brought forward by the Sarbanes-Oxley Act in the
second half of 2002 may have resulted in improvements in valuation processes and the
quality of acquisition decisions in general. Accordingly, the average premium paid in public
acquisitions during the sixth merger cycle was 37.9% compared to 45.8% during the 1993-
2000 period.2 This divergence in premiums is statistically significant and robust to different
premium measures used and is not driven by any particular industries or other deal and firm
characteristics.
The findings above lead to another main conjecture; that acquirers should have been
able to retain more of the potential benefit from deals and create more value for their
shareholders. In an efficient market, we would therefore expect that investors perceive public
acquisition announcements more favorably than in the past.3 Our evidence suggests that this
is in fact not the case. Acquirers continued to realize significant losses around acquisition
announcements, similar or worse in magnitude to the previous experience. More specifically,
cash financed deals that took place in 2003-2007 did not create value for acquiring firms
shareholders, in contrast to the 1990s, while stock-swap transactions continued to result in
extensive losses. Target firms experienced similar or in some cases worse abnormal returns,
which can be attributed to the inferior premiums offered. As a result, acquisitions did not
create more overall synergistic value during the sixth merger wave.
Our work offers important contributions. First, we present new evidence on the sixth
merger wave. We show this is not driven by overvaluation motives since acquiring firms i)
2 Officer (2003) reports that acquirers paid on average premiums of 55% in public acquisitions between 1988
and 2000. 3 McKinsey & Co reports that during the latest M&A cycle (up to 2006) acquirers have been more disciplined
about creating value for their shareholders (Dobbs et al., 2007).

5
are less, if at all, overvalued, ii) buy targets that are less undervalued relative to themselves
iii) finance their acquisitions with stock-swaps infrequently. Instead, it appears that liquidity,
a fundamental element of more neoclassical theories, can help propagate merger waves. Of
course this does not invalidate “behavioral” theories but rather corroborates that it does not
take misvalued markets or firms for merger activity to thrive. Second, it appears that
managers have learned from the experience of the fifth merger cycle. The less intense
acquisitiveness and more sporadic “bidding-wars” as well as the lower takeover premiums
connote more cautious and rational acquisition decisions and possibly an improved
acquisition process as a whole where acquirers seek to retain more of the synergy gains for
their shareholders. However, the finding that acquirers continued to destroy value for their
shareholders and in some cases in fact destroyed more value than in the past attests that the
payment of lower premiums is not sufficient to warrant value creation. This implies that
although acquisition processes may have improved, they are still in many cases, to a great
extent, far from optimal and/or that the implementation problems associated with public
acquisitions are difficult to overcome.
The rest of the paper is organized as follows. Section II describes the data and
methodology used in our investigation and discusses the sample statistics. Section III
evaluates and compares acquisition premiums and shareholder gains of the two most recent
merger waves. Finally section IV provides concluding remarks.
2. Data, Statistics, and Methodology
The sample of acquisition announcements is from SDC and includes U.S., domestic,
completed deals that took place between 1993 and 2007.4 Figure 1 shows the dollar value
spent in all deals through time. The fifth merger wave started developing in 1993 where the
4 The acquirer and target are classified by SDC as either private, public or subsidiary firms.
6
total deal value surged by more than 70% from the one year earlier and then continued
building-up until 1998.5 The market for corporate control remained highly active in 1999 and
2000 where more than $1.3 and $1.4 trillion respectively was spent on M&As. The total
transaction value plummeted by 55% in 2001 and a further 39% in 2002. The sixth merger
wave started in 2003, with an increase in the total value spent of almost 30%, and peaked in
2006, where the value reached $1.13 trillion, before significantly dropping in late 2007.
Based on the total value spent on M&As the two merger wave peaks were within the periods
1998-2000 and 2005-2006. Goel and Thakor (2010) use a de-trended market P/E ratio
measure as in Bouwman et al. (2009) to identify merger waves.6 Based on this measure the
great majority of months between 1993-1999 and 2003-2007 are classified as merger wave
months. In contrast, all months within the 2000-2002 period are not classified as merger wave
months. We also follow Harford‟s (2005) methodology to identify 24-month merger wave
peaks. We first classify potential merger wave periods at the aggregate level by taking the
highest 24-month merger bid concentration in each of the periods 1993-2000 and 2001-2007.
We then perform 1000 simulations that randomly assign each merger bid to a month within
the corresponding period. If concentration in the actual 24-month period is higher than 95%
of the simulation based 24-month highest concentrations, then this period is classified as a
merger wave peak. This method also confirms that two merger wave peaks occurred in 1998-
1999 and 2005-2006. Performing the analysis at the industry level, based on Fama and
French 5-sector classification, verifies that there was a wave peak for all five industries
around the same periods.7
As most of our analysis focuses on relative valuations, acquisition gains and
premiums we concentrate on public acquisitions that comprise the majority of the total value
5 The unreported total deal value for 1992 was $160 billion.
6A month is classified as merger-wave month if its de-trended market P/E was above the average market P/E
over the past five-years. 7 The 5-industry classification is as in Kenneth French‟s website and includes the Consumer, Manufacturing,
HiTec, Healthcare, and Other.

7
spent on all M&As. However, where appropriate, we also examine whether our results are
similar for deals by private acquirers or where the target is unlisted. We select transactions
where the acquirer owns less than 10% of the target‟s shares prior to the acquisition proposal
and more than 50% after the completion of the deal, the transaction value is at least $1
million and the size of the target is at least 1% of the size of the acquirer. Acquiring firms are
listed on NYSE, AMEX or NASDAQ and have data on CRSP and COMPUSTAT. Clustered
acquisitions, where the acquirer is involved in more than one acquisition proposals within a
three day window are omitted from the analysis.8 Our final sample consists of 3,206
transactions.
Table 1 reports the sample statistics. Deals are partitioned according to the following
periods; 1993-2000 (fifth merger wave), 1998-2000 (fifth wave peak), 2001-2002 (recession),
2003-2007 (sixth merger wave) and 2005-2006 (sixth wave peak). Market capitalization is
measured one month prior to the acquisition announcement and is reported in 2007 dollars.
Acquirers are generally larger in the sixth merger wave compared to the 1990s. There are
however no significant variations in target size and target-to-acquirer relative size across the
different periods. Firm overvaluation is measured by Tobin‟s Q which is the market value of
assets over the book value of assets.9 Based on this measure, acquirers are markedly more
overvalued during the fifth merger wave relative to the sixth. Targets are also on average
more overvalued during the fifth merger wave but differences in medians do not confirm this.
More importantly, although acquirers are in general more highly valued than targets during
the fifth merger wave this differential disappears in 2003-2007. The evidence here suggests it
is unlikely that the sixth merger wave was initiated as a result of overvalued firms seeking to
acquire less overvalued assets (Shleifer and Vishny, 2003).
8 Including clustered acquisitions however does not materially affect our results.
9 Market value of assets is the book value of total assets minus the book value of common equity plus the market
value of common equity.

8
Along these lines, Shleifer and Vishny argue that acquisitions driven by overvaluation
are more likely paid for with stock-swaps. Both the stock financed transactions and the
percentage of equity financing dropped dramatically during the sixth merger cycle. From a
57.33% high during the fifth merger wave, stock financed transactions in 2003-2007 account
for only 24.65%; a drop in stock financing of approximately 57%. The portion of equity in
deals also decreased by nearly 32%. Conversely, both cash financed deals and the element of
cash in acquisition offers doubled during the sixth merger wave. This financing pattern may
have also been the result of lower interest rates and the record high corporate cash balances
during this period, leading to more debt and free cash flow financing respectively. The yearly
average of the Wall Street Journal‟s prime rate for the 2003-2007 (2005-2006) period is
6.14% (7.07%) compared to 8.01% (8.52%) for 1993-2000 (1998-2000). As a result, in the
sixth merger wave acquirers have higher industry adjusted debt-to-assets ratios at the fiscal
year end following the acquisition announcement year. Moreover, acquirers‟ assets-adjusted
cash balances are also higher than in the 1990s, implying more ample idiosyncratic liquidity.
Although the 2003-2007 period is characterized by heightened merger activity, the
market for corporate control for listed companies was less competitive than previously.
Competition is measured by the ratio of the number of listed firms acquired to the number of
all CRSP firms each year.10
We also use the value of all listed firms acquired as a percentage
of the market value of all CRSP firms. The fraction of U.S. listed firms targeted in completed
deals decreased by over 25% during the most recent merger wave compared to the 1993-
2000. The share of the value of all listed firms acquired in M&A deals dropped from 4.17%
(5.39%) in 1993-2000 (1998-2000) to 1.78% (2.31%) in 2003-2007 (2005-2006). Acquirers
were also less acquisitive during the sixth merger wave and acquisitiveness has been
10
A similar measure is used by Alexandridis et al. (2010) to proxy for competition at the country level. A more
extensive sample is used for the construction of the competition measure that is based on the number of all listed
firms acquired irrespective of the acquiring firm‟s public status. Using a measure based only on public
acquisitions produces similar results.

9
associated with managerial hubris (Malmendier and Tate, 2008 and Billett and Qian, 2008).
More than 38% of all acquisitions in the sample are made by acquirers involved in two or
more deals within a two year period.11
This share is 41.88% for 1993-2000 but only 28.12%
for 2003-2007 which may suggest that acquisition decisions during the sixth merger wave
were to a lesser extent driven by managerial over-optimism. We further examine variations in
the likelihood of managerial hubris driven acquisition decisions between the two waves by
using a measure based on in-the-money unexercised exercisable options held by the
acquirer‟s CEO following Malmendier and Tate (2008). We estimate Holder67 which
captures the timing of CEO options exercises. A CEO is classified as overconfident if he fails
to exercise her stock options although they are 67% in-the-money.12
Our results again
indicate that hubris infected acquirers were less frequent during the sixth merger wave and
therefore acquisition decisions are less likely to be motivated my managerial over-optimism.
We use two measures of acquisition premium. The first is the offer price over the
target‟s share price four weeks prior to the acquisition announcement and is reported for
observations between zero and two as in Officer (2003). The second is the market adjusted
target return for a 190 day window starting 63 days preceding the acquisition announcement,
as in Schwert (2000).13
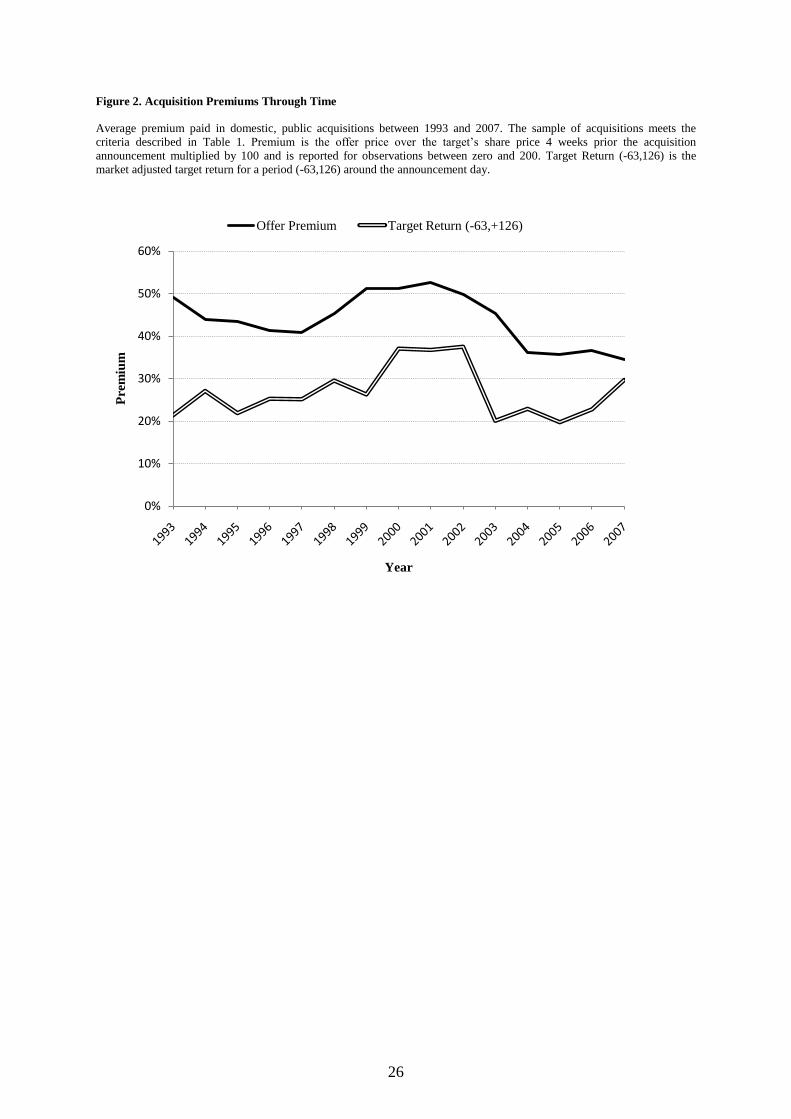
Figure 2 depicts acquisition premiums and indicates that they have
decreased through time and were unusually low during the sixth merger cycle. Table 1 shows
that acquiring firms paid on average a premium of more than 45% during the fifth merger
wave and 49% during the 1998-2000 peak but less than 38% during 2003-2007 and 2005-
2006. Accordingly, the premium paid for listed targets during the sixth merger cycle (2005-
2006) was on average 17.4% (26.5%), substantially lower than during 1993-2000 (1998-
2000). Premium differentials between the two waves and their peaks are statistically
11
Our results are similar when using a five year window as in Billett and Qian (2008) or other alternative
specifications. 12
Executive options data is manually collected from DEF 14A proxy statements in SEC filings. 13
Although for brevity we do not report results based on this measure in all tables, they are always very similar
to using the first measure.

10
significant at the 1% level for both mean and median estimates and irrespective of the
measure used.
For the return analysis we compute abnormal returns of acquiring and target firms
using market model returns where parameters are estimated over the period (-250,-15)
relative to the announcement day. The benchmark index used is the CRSP value-weighted
index.14
Abnormal returns are then cumulated over the three- or 21-day period surrounding
the acquisition announcement and are winsorized at the 1% and 99% levels. Total acquisition
gains are calculated using the market value-weighted average of the acquirer and target
abnormal returns, where market values are measured one month prior to the acquisition
announcement.
For the long-run analysis we calculate acquirer performance using average calendar-
time abnormal returns (ACTARs) to control for the cross sectional dependence of stock
returns. Acquirers enter the portfolio at the announcement month and remain for 36 months.
Abnormal returns are calculated as follows:
CTARi,t = Ri,t – RSize/BM benchmark,t
where Ri,t is the return of acquirer i at month t and RSize/BM benchmark,t is the return of the
corresponding 25 size and book-to-market equity (BE/ME) reference portfolio for the same
month as in Mitchell and Stafford (2000). The ACTAR is then given by the universal average
of all mean monthly abnormal return observations.
We also estimate monthly abnormal returns for a period of 3-years following the
acquisition announcement using calendar time portfolio regressions (CTPRs) of the following
form:
Rpt – Rft = p + bp (Rmt - Rft) + sp SMBt + hp HMLt + up UMDt + pt ,
14
The minimum estimation window is set to 30 days. Equally weighted benchmark returns or alternative
estimation windows produce very similar results.

11
where Rpt – Rft is the equally-weighted, monthly calendar time portfolio excess return and the
independent variables are the Fama and French (1993) and Carhart (1997) factors. Calendar
months with less than 10 return observations are excluded from regressions.
3. Empirical Results
3.1 Acquisition Premiums by Method of Payment
Our statistics indicate that lower premiums were paid for targets during the sixth
merger wave relative to the 1990s. This may be an indication that acquiring firms‟ managers
were more disciplined in creating value for their shareholders and that in general the quality
of acquisition decisions and processes improved relative to the years preceding this wave.
However, the significant differences we document in terms of how acquisitions are paid for
may drive our results. Huang and Walkling (1987) and Comment and Schwert (1995) find
that acquirers that pay with cash tend to offer higher premiums than acquirers that exchange
their stock. The rationale is that cash payments have a tax-related disadvantage relative to
stock swaps. Moeller et al. (2004) however document a negative relation between the
occurrence of a cash offer and the premium paid. It is therefore possible that target
shareholders require higher premiums in stock exchange offers to compensate them for the
loss they are likely to incur from the well documented depreciation in the value of the
acquirer in this case (Travlos, 1987).
Table 2 reports acquisition premiums by different time periods and methods of
payment. Overall, the premiums paid between 1993 and 2007 are similar for all payment type
subsets; cash, stock, and hybrid. The premiums offered within each payment method group
however vary according to the period examined. Premium differences between the sixth wave
and the 1990s wave are negative and statistically significant at the 1% level for all payment

12
subsets. Consequently, the large divergence in premiums documented between the two
merger waves persists irrespective of the method of payment used.
3.2 Acquisition Premiums by Industry Sector
If premiums vary by industry and the two waves we examine are characterized by
consolidation in different industries, then results may be driven by some particular sectors. If
more “irrational” premiums were paid for instance for high-growth companies during the
fifth merger wave, then the premium effect we document may be more pronounced for High-
Tech firms or may be even driven entirely by this sector.
Table 3 reports acquisition premiums by time period and target industry. We use the
Fama and French five industry classification to partition targets into sector groups but report
results for financials separately.15
No great variation is observed in terms of what type of
firms were acquired during the two waves. Acquisitions involving targets in the
manufacturing and consumer sectors represent a smaller segment of the sixth merger wave
compared to the 1993-2000 period. In contrast, there was an increase in acquisitions of firms
within „Healthcare‟ and „Financials‟. The highest premiums over the sample period are paid
for Hi-Tech targets (52.27%), followed by „Other‟ and „Consumer‟ sectors where the mean
premium is 49.77% and 49.1% respectively. On the other hand, the lowest premiums are paid
for financial firms (38.17%). In general, premiums are lower in 2003-2007 compared to
1993-2000 irrespective of the target sector. Differentials between the most recent merger
wave and the fifth merger wave are negative and statistically significant at conventional
levels for most sectors. The divergence in premiums is more pronounced in the
„Manufacturing‟ and „HiTec‟ sectors and less intense in the „Consumer‟ and „Other‟ sectors,
where however the number of observations is relatively small. Overall, it appears that the
15
Fama and French group financials (SIC codes 6000-6999) in the “Other” sector subset that also includes firms
in the mining, construction, construction material, transportation, hotel, business service, and entertainment
sectors.

13
premium differences we document is not driven by any particular industry but is rather a
ubiquitous phenomenon.
3.3 Acquisition Abnormal Returns
The fact that acquirers pay lower premiums during the sixth merger wave implies that
they should have been able to retain more of the potential benefit from deals and create more
value for their shareholders. We would therefore expect that investors react more favorably to
public acquisition announcements. On the other hand, given the lower premiums, target
shareholders should benefit less. Table 4 reports abnormal returns for three- and 21-day
windows around the acquisition announcement for acquirers and targets, as well as synergy
gains. Results are partitioned by time period and method of payment.
Panel A reports acquirer returns. Overall, public acquisitions result in a 1.50%
abnormal loss for acquiring firms in the three-day window surrounding the acquisition
announcement which is statistically significant at the 1% level. This is consistent with prior
evidence that public acquisitions fail to create value for acquirers.16
The documented value
loss can be attributed to the stock and hybrid payment subsets that result in abnormal returns
of -2.43% and -1.55%, respectively. Conversely, acquisitions paid for with cash are
associated with small but positive abnormal returns. Despite the lower premiums,
shareholders of acquiring companies did not earn better returns during the sixth merger wave
relative to the fifth. In fact, acquirers that paid with cash created less value, reflected in the
negative and statistically significant return differences between 2003-2007 and 1993-2000.
Stock financed deals also destroyed more value for acquirer shareholders based on the three-
day window. Results for the 21-day window are to a great extent similar and also suggest that
16
See for example, Firth (1980), Asquith (1983), Jensen and Ruback (1983), and Travlos (1987), Andrade,
Mitchell, and Stafford (2001), Fuller, Netter, and Stegemoller (2002), Moeller et al. (2004), and Faccio,
McConnell, and Stolin (2006).

14
acquirers do not appear to enhance their value more by making acquisitions during the sixth
merger cycle.17
Panel B reports target announcement returns. On average, targets experience
abnormal returns of 19.47%, significant at the 1% level for a three-day window around the
offer announcement. Gains are higher in cash deals (27.69%) compared to stock (16.42%)
and hybrid (18.43%) deals, although premiums for the three payment type subsets are similar.
This may be because target resistance is less common and the likelihood of success lower in
stock offers (Fishman, 1989; Jennings and Mazzeo, 1993). There is no evidence that target
returns were lower during 2003-2007 based on the three-day window. The picture however is
clearly different for the 21-day window where abnormal returns to target firms are higher for
all subsets and also the differences between gains in the 2003-2007 period and the 1990s
wave (or their peaks) are statistically significant in most cases. This is consistent with the
evidence that the premiums paid were lower during the most recent merger wave.
If acquisitions did not create more value for both acquirer and target firm shareholders
then overall acquisition gains should also not be expected to have increased after 2002. Panel
C reports synergy gains calculated using the market value weighted average of the acquirer
and target abnormal returns. Synergistic gains are positive and statistically significant at the
1% level irrespective of the return window used. However, acquisitions during the sixth
merger wave created less value when cash payments were involved. There is no clear
evidence of significant differences in combined gains from acquisitions between periods for
the rest of the subsets. All in all, although acquisitions during the sixth merger cycle appear to
be more promising for acquirers, they fail to create superior value for their shareholders as
well as synergy gains.
17
Unreported results show that acquirer returns are also not statistically different between the two merger waves
for deals where the target is unlisted.

15
3.4 Acquirer Winners and Losers
In the previous section we established that investors did not perceive public
acquisition announcements more favorably during the sixth merger wave compared to the
1990s. Mean and median returns to acquirers however do not accurately reflect the actual
distribution of winners and losers that may convey additional information about value
creation or destruction. Table 5 therefore reports the share of winners and losers as well as
extreme winners and losers around the acquisition announcement within each period and
payment method subset. Winners (Losers) are acquirers subject to positive (negative)
abnormal returns. Extreme winners (losers) are acquirers that experience abnormal returns
above (below) the median value of the positive (negative) return sub-set of the total sample.18
For the entire sample, there are more losers (60.2%) than winners (39.8%). Each of
these subsets is equally split into „moderate‟ and „extreme‟ winners and losers. 53.3%
(46.7%) of the acquirers that paid with cash and 34.9% (65.1%) of those that exchanged their
stock experienced positive (negative) abnormal returns. Within the winner-cash (loser-cash
group) group 49.9% (only 30.5%) are extreme winners (losers) and within the winner-stock
(loser-stock) group 48.4% (55.7%) are extreme winners (losers). There are more extreme
losers in the stock subset relative to the cash subset.
We observe significant differences in the distribution of winners and losers between
the two merger waves. In the fifth merger wave and during its peak in the end of the 1990s
extreme winners and losers comprise a larger share than moderate winners and losers in all
but the cash subset. Conversely, there was more pronounced concentration in the moderate
subsets during the sixth merger wave and its peak. Difference tests show that the decrease
(increase) in the share of extreme (moderate) winners in sixth merger wave, relative to the
1990s, is statistically significant at conventional levels in most cases. On the other hand, the
18
The median abnormal return for the winner (loser) subset is 2.6% (-3.6%).

16
stake of extreme (moderate) losers decreased (increased) notably but differences are driven
by the hybrid subset.
In general, acquirers experienced extreme abnormal returns less often during the sixth
merger wave irrespective of the method of payment used. This could reflect more efficient
investor reaction to acquisition announcements during this wave. Overall, the share of
winners did not increase while the share of extreme winners shrank, suggesting that there
were actually fewer acquirers that created (or were expected to create) superior value for their
shareholders during the sixth merger cycle.
3.5 Multivariate Analysis
In this section we perform multivariate tests to examine whether acquisition
premiums and returns are systematically related to the time period examined after controlling
for other firm and deal characteristics that may drive the results.
Table 6 reports regression estimates where the dependent variable is the acquisition
premium.19
The main explanatory variable is a dummy that takes the value of one if the
acquisition announcement takes place within 2003-2007 and zero otherwise. In some
specifications a 2005-2006 dummy is used instead. We also include control variables that
have been found to be associated with acquisition premiums. Alexandridis et al. (2010) show
that premiums increase with competition in the market for corporate control. We include in
our regressions a dummy variable (COMP) that takes the value of one when there is one or
more competing acquirers for the same target and zero otherwise. Premiums are also higher
in tender offers (Kohers, Kohers, and Kohers, 2007) and hostile offers (Schwert, 2000). We
therefore use two controls for tender offers (TEND) and hostility (HOST). The indicator
variable SERIAL controls for the presence of frequent acquirers that have been associated
19
Premium is defined as the ratio of the offer price to the stock price of the target four weeks prior to the
acquisition announcement. Results remain similar when using a premium measure based on target returns as in
Schwert (2000).

17
with managerial overoptimism (Billett and Qian, 2008) and, as a result, overpayment (Roll,
1986). Officer (2003) finds that acquirers pay less for financial firms. Our results in Table 3
corroborate this and also show that Hi-Tech targets receive the heftiest premiums.
Accordingly, we add two binary variables for the occurrence of acquisitions involving
technology (TECH) and financial (FIN) targets. We also include an inter-industry dummy
(INTER) that takes the value of one when the target and the acquirer have a different 2-digit
SIC code. Nathan and O‟Keefe (1989) find that premiums are negatively related to the
business cycle. The market run-up variable (RUNUP), defined as the Buy-and-Hold return of
the CRSP value-weighted index over the period (-180,-5) before the acquisition
announcement, controls for this effect. Huang and Walkling (1987) find that premiums are
higher in cash compared to stock acquisitions to compensate target shareholders for the
immediate tax implications. We thus include a dummy equal to one for stock swaps (STOCK)
and zero otherwise. Moeller et al. (2004) report that large acquirers (targets) pay (receive)
higher premiums. We therefore also take into account acquirer (ASIZE) and target (TSIZE)
size using the natural logarithms of their market capitalization one month prior to the
acquisition announcement. Finally, Dong et al. (2006) show that relative acquirer and target
valuations can affect the offer premium. We use the relative acquirer-to-target Tobin‟s Q
(RELQ) to control for this effect.
We run the regressions i) for the entire sample, ii) only for the periods that comprise
the two merger waves, and iii) the peak of the sixth merger wave and the peak of the fifth
merger wave. We also present results for two specifications in each case as including the
relative Q in the regressions significantly reduces our sample. In Regressions (1) and (2) the
coefficient of the „2003-2007‟ dummy is negative and statistically significant at the 1% level
corroborating that acquirers paid less for targets in the sixth merger wave. The sign and
significance of most of the explanatory variables are in most cases according to the
18
predictions of previous studies (Officer, 2003; Moeller et al., 2004; and Wang and Xie,
2009). All variables together explain 13.00% and 16.15% of the cross-sectional variation in
premiums in specifications (1) and (2), respectively.
In regressions (3) to (6) we examine differences in premiums between the two merger
waves and their peaks. We therefore include only 1993-2000 and 2003-2007 observations in
specifications (3) and (4) and only 1998-2000 and 2005-2006 observations in specifications
(5) and (6). Both wave dummies remain negative and statistically significant at the 1% level
in all cases. The premiums paid during the sixth merger wave are almost ten percentage
points smaller in absolute terms. Premiums are also 13% lower during the 2005-2006 peak
relative to 1998-2000. The sign and significance of the other explanatory variables are similar
to regressions (1) and (2).
Table 7 presents regression estimates where the dependent variable is the 3-day CAR
to acquiring firms.20
Explanatory variables are similar as in premium regressions. Asquith et
al. (1983), Travlos (1987), and Moeller et al. (2004) document a negative relation between
acquirer returns and the target-to-bidder relative size. Hence, we replace target size with
relative size (RSIZE). The coefficients of the „2003-2007‟ and „2005-2006‟ dummies are
statistically insignificant in most specifications suggesting that acquirers did not create more
value for their shareholders during the sixth merger wave. Tables 8 and 9 present estimates of
target and combined CARs regressions. Overall, regression results suggest that there is no
statistically significant difference in acquisition gains between the sixth merger cycle and the
1990s wave.
20
Results remain similar when we use a 5-, 11-, or 21-day CAR window.

19
3.6 Acquirer Long-Run Returns
Announcement window returns may reflect the initial perception of investors at the
acquisition announcement but not actual value creation. We therefore examine whether
acquirers that made acquisitions in the sixth merger wave benefit more in the long-run. In an
efficient market with rational investors, and given our results in the previous sections, we
would expect that acquirers did not experience superior long-term returns in the sixth merger
cycle compared to the 1990s. Table 10 reports monthly estimates of calendar time abnormal
returns to acquiring firms for a period of 36 months following the acquisition announcement.
Abnormal returns are measured using average calendar time abnormal returns (ACTARs) and
intercepts from calendar time portfolio regressions (CTPRs). The portfolio formation and
regression processes are discussed in section 2.
Based on ACTARs, acquirers in our sample experience negative abnormal returns of -
9.1% in the three-year period following the acquisition announcement. This result is driven
by the stock and hybrid subsets. CTPR alphas are nonetheless statistically insignificant. In
general, deals announced during the sixth merger wave resulted in negative abnormal returns
to acquiring companies while estimates for the fifth merger wave are in most cases
statistically insignificant. CTAR (CTPR) estimates for 2005-2006 correspond to a staggering
-28% (-23%) abnormal loss in the 36 months after the acquisition proposal. ACTAR
differences between the two merger waves and their peaks are only statistically significant for
the stock subset implying that acquirers that paid with stock during the sixth merger wave did
worse.21
Overall, acquisitions announced during the sixth merger cycle resulted in worse or at
best similar performance for acquirers relative to the fifth merger cycle.22
21
We do not compute CTAR differences as these involve regressing monthly return differences on the four
factors. However, there are no common months between the periods compared here. 22
Unreported results show that the performance of acquirers of unlisted targets was also no better during the
sixth merger wave.
20
4. Conclusion
In this paper we present new evidence on mergers and acquisitions from the sixth
merger cycle. The low financing rates and rich cash balances that resulted in liquidity awash,
as well as the fact that acquirers were less, if at all, overvalued relative to the 1990s, led to
more pronounced cash (and less equity) financing. The drivers of the sixth merger wave are
therefore more consistent with neoclassical explanations of merger waves. In addition, the
market for corporate control was less competitive, acquirers where less acquisitive and
acquirer CEOs displayed less over-confidence about their ability to create superior value
through M&As. As a result premiums paid during the sixth merger wave were significantly
lower than in the past, implying more rational and promising acquisition decisions.
Nonetheless, acquirers still destroyed at least as much value for their shareholders as in the
fifth merger wave.
21
References
Alexandridis, G., Petmezas, D., and Travlos, N. G., 2010, Gains from mergers and acquisitions around the
world: New evidence, Financial Management Forthcoming.
Andrade, G., Mitchell, M., and Stafford, E., 2001, New evidence and perspectives on mergers, Journal of
Economic Perspectives 15, 103-120.
Asquith, P., 1983, Merger bids, uncertainty, and stockholder returns, Journal of Financial Economics 11, 51-83.
Asquith, P., Bruner, R. F., and Mullins, D. W., 1983, The gains to bidding firms from merger, Journal of
Financial Economics 11, 121-139.
Billett, M. T., and Qian, Y., 2008, Are overconfident ceos born or made? Evidence of self-attribution bias from
frequent acquirers, Management Science 54, 1037-1051.
Bouwman, C. H. S., Fuller, K., and Nain, A. S., 2009, Market valuation and acquisition quality: Empirical
evidence, Review of Financial Studies 22, 633-679.
Carhart, M. M., 1997, On persistence in mutual fund performance, Journal of Finance 52, 57-82.
Comment, R., and Schwert, W. G., 1995, Poison or placebo? Evidence on the deterrence and wealth effects of
modern antitakeover measures, Journal of Financial Economics 39, 3-43.
Dobbs, R., Goedhart, M., and Suonio, H., 2007, Are companies getting better at m&a?, The McKinsey Quarterly
22, 7-11.
Dong, M., Hirshleifer, D., Richardson, S., and Teoh, S. H., 2006, Does investor misvaluation drive the takeover
market, Journal of Finance 61, 725-762.
Faccio, M., McConnell, J. J., and Stolin, D., 2006, Returns to acquirers of listed and unlisted targets, Journal of
Financial and Quantitative Analysis 41, 197-220.
Fama, E. F., and French, K. R., 1993, Common risk factors in the returns on stock and bonds, Journal of
Financial Economics 33, 3-56.
Firth, M., 1980, Takeovers, shareholder returns, and the theory of the firm, Quarterly Journal of Economics 94,
235-260.
Fishman, M. J., 1988, A theory of preemptive takeover bidding, RAND Journal of Economics 19, 88-101.
Fishman, M. J., 1989, Preemptive bidding and the role of the medium of exchange in acquisitions, Journal of
Finance 44, 41-57.
Fuller, K., Netter, J., and Stegemoller, M., 2002, What do returns to acquiring firms tell us? Evidence from
firms that make many acquisitions, Journal of Finance 57, 1763-1794.
Goel, A. M., and Thakor, A. V., 2010, Do envious ceos cause merger waves?, Review of Financial Studies 23,
487-517.
Harford, J., 2005, What drives merger waves?, Journal of Financial Economics 77, 529-560.
Huang, Y.-S., and Walkling, R. A., 1987, Target abnormal returns associated with acquisition announcements:
Payment, acquisition form, and managerial resistance, Journal of Financial Economics 19, 329-349.
Jennings, R. H., and Mazzeo, M. A., 1993, Competing bids, target management resistance, and the structure of
takeover bids, Review of Financial Studies 6, 883-909.
22
Jensen, M. C., and Ruback, R. S., 1983, The market for corporate control: The scientific evidence, Journal of
Financial Economics 11, 5-50.
Kohers, N., Kohers, G., and Kohers, T., 2007, Glamour, value, and the form of takeover, Journal of Economics
and Business 59, 74-87.
Malmendier, U., and Tate, G., 2008, Who makes acquisitions? Ceo overconfidence and the market's reaction,
Journal of Financial Economics 89, 20-43.
Martin, K., 1996, The method of payment in corporate acquisitions, investment opportunities, and management
ownership, Journal of Finance 51, 1227-1246.
Mitchell, M. L., and Stafford, E., 2000, Managerial decisions and long-term stock price performance, Journal of
Business 73, 287-329.
Moeller, S. B., Schlingemann, F. P., and Stulz, R. M., 2004, Firm size and the gains from acquisitions, Journal
of Financial Economics 73, 201-228.
Moeller, S. B., Schlingemann, F. P., and Stulz, R. M., 2005, Wealth desctruction on a massive scale? A study of
acquiring-firm returns in the recent merger wave, Journal of Finance 60, 757-782.
Nathan, K. S., and O'Keefe, T. B., 1989, The rise in takeover premiums: An exploratory study, Journal of
Financial Economics 23, 101-119.
Officer, M. S., 2003, Termination fees in mergers and acquisitions, Journal of Financial Economics 69, 431-
467.
Rhodes-Kropf, M., Robinson, D. T., and Viswanathan, S., 2005, Valuation waves and merger activity: The
empirical evidence, Journal of Financial Economics 77, 561-603.
Rhodes-Kropf, M., and Viswanathan, S., 2004, Market valuation and merger waves, Journal of Finance 59,
2685-2718.
Roll, R., 1986, The hubris hypothesis of corporate takeovers, Journal of Business 59, 197-216.
Schwert, W. G., 2000, Hostility in takeovers: In the eyes of the beholder?, Journal of Finance 55, 2599-2640.
Shleifer, A., and Vishny, R. W., 2003, Stock market driven acquisitions, Journal of Financial Economics 70,
295-311.
Travlos, N. G., 1987, Corporate takeover bids, methods of payment, and bidding firms‟ stock returns, Journal of
Finance 42, 943-963.
Wang, C., and Xie, F., 2009, Corporate governance transfer and synergistic gains from mergers and
acquisitions, Review of Financial Studies 22, 829-858.

23
Figure 1. Acquisition Activity Through Time
The figure shows the total value (in $ billions) spent between 1993 and 2007 in U.S., completed, domestic acquisitions as
reported in Thomson Financial SDC. Values are expressed in 2007 dollars. “All deals” include all reported corporate control
transactions. Transactions labeled as spinoffs, recapitalizations, self-tenders, exchange offers, repurchases, and privatizations
are excluded.
0
200
400
600
800
1,000
1,200
1,400
1,600
1,800
Tota
l De
al V
alu
e (
$b
il)
Year
All Deals

24
Table 1. Sample Statistics
The sample includes all U.S., completed, domestic, public mergers and acquisitions reported in Thomson Financial SDC
between 1993 and 2007. Acquirers are listed on NYSE, NASDAQ, or AMEX and have data available on CRSP and
COMPUSTAT. The acquirer owns less that 10% of the target‟s shares prior to the acquisition announcement and more than
50% after the deal completion. The deal value is at least $1 million and the size of the target is at least 1% of the size of the
acquirer. Statistics are reported for the entire sample and five other sub-periods. DEAL VALUE is the transaction value.
ASIZE (TSIZE) is the market capitalization (in $ million) of the acquirer (target) one month prior the acquisition
announcement. Values are in 2007 dollars. RSIZE is the target-to-bidder relative market value. Tobin‟s Q is the book value
of assets minus the book value of common equity plus the market value of common equity over the book value of assets at
the fiscal year end prior to the acquisition announcement year. RELQ is the acquirer‟s Tobin‟s Q over the target‟s Tobin‟s Q.
ALL STOCK (ALL CASH) are transactions financed with pure stock (cash). STOCK (CASH) is the proportion of stock
(cash) in the transaction. PREM is the offer price over the target‟s share price 4 weeks prior the acquisition announcement
multiplied by 100 and is reported for observations between zero and 200. TCAR (-63,126) is the market adjusted target return
for a period (-63,126) relative to the announcement day as in Schwert (2000). COMP is the share of listed firms (or the value
of listed firms) on CRSP targeted in completed deals. SERIAL is the percentage of acquirers that make 2 or more public
acquisitions during a 2-year period. HUBRIS is the percentage of acquiring firm managers that do not exercise vested stock
options although they are 67% in-the-money. DIVERS is the share of transactions where the acquirer and target have
different 2-digit SIC codes. INTEREST is the yearly average of the Wall Street Journal‟s prime rate and is based on corporate
loans posted by at least 70% of the 10 largest U.S. banks. DEBTLOAD is the acquirers‟ long-term debt-to-assets ratio
divided by the median long-term debt-to-assets ratio of the corresponding industry at the fiscal year end following the
acquisition announcement year. CASH RES for the Market (Sample) is the yearly average of the sum of cash and short-term
investments over the sum of total assets for all U.S. listed firms (acquirers in the sample). Difference tests are based on a t-
test for means and a Wilcoxon-test for medians. a, b, and c denote significance at the 1%, 5%, and 10% level, respectively.

25
All 1993-2000 1998-2000 2001-2002 2003-2007 2005-2006
(5)-(2) (6)-(3) (1) (2) (3) (4) (5) (6)
No of Observations 3,206 2,161 935 323 722 293
DEAL VALUE sum 5,336,112 3,604,647 2,563,378 403,995 1,327,470 721,621
mean 1,664 1,668 2,742 1,251 1,839 2,463 171a -279
ASIZE mean 7,839 6,927 10,925 7,455 10,738 13,797 3,811a 2,872
median 1,283 1,246 1,752 848 1,716 1,902 469a 150
TSIZE mean 1,328 1,267 1,977 1,069 1,633 2,338 366 362
median 194 175 227 109 308 416 134 188
RSIZE (%) mean 25.51 26.21 26.36 23.61 24.57 27.76 -1.64 1.40
median 14.03 14.67 13.78 12.40 12.88 15.17 -1.79 1.39
ACQQ mean 2.07 2.22 2.62 1.99 1.75 1.86 -0.47a -0.76a
median 1.30 1.32 1.44 1.25 1.28 1.37 -0.03 -0.07
TARQ mean 1.91 2.00 2.25 1.72 1.80 2.04 -0.20b -0.21
median 1.27 1.28 1.32 1.11 1.35 1.46 0.08c 0.14
RELQ mean 1.27 1.32 1.43 1.41 1.10 1.07 -0.22a -0.36a
median 1.06 1.07 1.12 1.10 1.02 1.01 0.05a -0.11a
ALL STOCK (%) mean 47.88 57.33 54.65 36.53 24.65 23.21 -32.68a -31.44a
STOCK (%) mean 62.14 68.30 66.82 55.52 46.65 45.30 -21.65a -21.53a
ALL CASH (%) mean 21.24 17.03 16.04 22.60 33.24 33.79 16.21a 17.75a
CASH (%) mean 31.85 25.01 25.28 36.97 50.03 51.39 25.02a 26.12a
PREM (%) mean 44.43 45.81 49.18 51.70 37.85 36.17 -7.96a -13.02a
median 36.37 38.20 42.56 43.64 30.17 30.20 -8.03a -12.36a
TCAR (-63,126) mean 27.06 27.04 30.37 37.06 22.75 21.30 -4.29a -9.07a
median 23.90 23.98 28.27 34.34 20.67 18.94 -3.30a -9.32a
COMP - Activity (%) mean 4.16 4.60 5.55 3.82 3.42 3.59
- Value Acquired (%) mean 2.75 4.17 5.39 1.61 1.78 2.31
SERIAL (%) mean 38.24 41.88 40.11 36.53 28.12 27.30 -13.75a -12.81a
HUBRIS (%) mean 67.89 70.87 74.56 45.00 66.67 57.45 -4.22 -17.12b
DIVERS (%) mean 30.44 30.26 31.55 29.72 31.30 32.76
INTEREST (%) mean 7.10 8.01 8.52 5.82 6.14 7.07
DEBTLOAD mean 5.09 3.52 4.55 4.40 7.55 7.44 4.03a 2.89a
median 1.39 1.25 1.14 1.17 1.88 2.17 0.63a 1.03a
CASH RES - Market (%) mean 9.26 8.58 8.58 9.45 10.29 10.44
- Sample (%) mean 9.50 8.08 7.75 9.32 11.85 10.29
26
Figure 2. Acquisition Premiums Through Time
Average premium paid in domestic, public acquisitions between 1993 and 2007. The sample of acquisitions meets the
criteria described in Table 1. Premium is the offer price over the target‟s share price 4 weeks prior the acquisition
announcement multiplied by 100 and is reported for observations between zero and 200. Target Return (-63,126) is the
market adjusted target return for a period (-63,126) around the announcement day.
0%
10%
20%
30%
40%
50%
60%
Pre
miu
m
Year
Offer Premium Target Return (-63,+126)

27
Table 2. Acquisition Premiums by Payment Method
The sample of acquisitions meets the criteria described in Table 1. Premium is the offer price over the target‟s share price 4 weeks prior the
acquisition announcement multiplied by 100 and is reported for observations between zero and 200. The cash (stock) subset comprises of
transactions financed with pure cash (stock). The Hybrid subset includes all remaining deals. n is the sample size. Difference tests are based
on a t-test for means and a Wilcoxon-test for medians. a, b, and c denote significance at the 1%, 5%, and 10% level, respectively.
Payment All 1993-2000 1998-2000 2001-2002 2003-2007 2005-2006
(5)-(2) (6)-(3) (1) (2) (3) (4) (5) (6)
All mean 44.43 45.81 49.18 51.70 37.85 36.17 -7.96a -13.02a
median 36.37 38.20 42.56 43.64 30.17 30.20 -8.03a -12.36a
n 2,416 1,583 740 237 596 242
Cash mean 46.87 48.19 52.66 56.09 42.55 41.11 -5.64b -11.54a
median 38.82 39.14 46.82 49.28 36.93 37.52 -2.21b -9.30a
n 555 290 129 56 209 84
Stock mean 43.86 44.37 48.60 54.28 34.37 33.65 -10.00a -14.95a
median 36.10 37.48 41.82 47.21 24.65 24.12 -12.83a -17.70a
n 1,120 883 396 90 147 54
Hybrid mean 43.46 47.22 48.18 46.46 35.89 33.48 -11.34a -14.69a
median 35.06 40.08 41.97 40.89 28.85 28.49 -11.24a -13.49a
n 741 410 215 91 240 104

28
Table 3. Acquisition Premiums by Sector
The sample of acquisitions meets the criteria described in Table 1. Premium is the offer price over the target‟s share price 4 weeks prior the
acquisition announcement multiplied by 100 and is reported for observations between zero and 200. Target sectors are based on the Fama
and French 5 industry classification but results for financial firms (SIC 6000-6999) are reported separately. n is the sample size. Difference
tests are based on a t-test for means and a Wilcoxon-test for medians. a, b, and c denote significance at the 1%, 5%, and 10% level,
respectively.
Industries All 1993-2000 1998-2000 2001-2002 2003-2007 2005-2006
(5)-(2) (6)-(3) (1) (2) (3) (4) (5) (6)
All
mean 44.43 45.81 49.18 51.70 37.85 36.17 -7.96a -13.02a
median 36.37 38.20 42.56 43.64 30.17 30.20 -8.03a -12.36a
n 2,416 1,583 740 237 596 242
Consumer mean 49.10 47.23 51.59 87.06 44.58 37.24 -2.65 -14.35
median 37.77 37.77 41.97 84.79 31.01 31.31 -6.77 -10.66
n 234 174 75 14 46 17
% 9.69 10.99 10.14 5.91 7.72 7.02
Financials
mean 38.17 39.10 39.62 42.54 34.17 32.90 -4.93b -6.72b
median 32.20 33.07 32.95 38.79 27.85 26.05 -5.23b -6.91b
n 902 576 242 92 234 94
% 37.33 36.39 32.70 38.82 39.26 38.84
HiTec
mean 52.27 54.02 58.34 67.47 42.17 37.21 -11.84a -21.12a
median 45.00 49.75 54.84 60.02 33.93 32.56 -15.82a -22.29a
n 564 342 187 65 157 64
% 23.34 21.60 25.27 27.43 26.34 26.45
Healthcare
mean 45.06 48.52 53.80 43.84 38.99 45.72 -9.53b -8.08
median 39.08 39.90 39.15 45.69 33.62 40.55 -6.28c 1.40
n 224 134 41 17 73 31
% 9.27 8.46 5.54 7.17 12.25 12.81
Manufacturing
mean 40.95 44.62 50.44 35.01 27.91 26.61 -16.70a -23.83a
median 34.99 36.25 41.33 36.05 23.91 27.39 -12.35a -13.95a
n 300 221 121 31 48 24
% 12.42 13.96 16.35 13.08 8.05 9.92
Other mean 49.77 51.06 50.29 50.28 44.88 49.16 -6.18 -1.13
median 43.78 46.27 46.95 53.77 31.62 30.87 -14.66c -16.08
n 192 136 74 18 38 12
% 7.95 8.59 10.00 7.59 6.38 4.96

29
Table 4. Gains to Acquirers, Targets, and the Combined Firm
The sample of acquisitions meets the criteria described in Table 1. Panel A, B, and C report acquirer, target, and combined firm cumulative
abnormal returns (CARs) over a 3- and a 21-day announcement window. Market model parameters are estimated over the period (-250, -15)
relative to the announcement day. Combined returns are calculated using the market value-weighted average of the acquirer and target
abnormal returns where market values are measured one month prior to the acquisition announcement. n is the sample size. Difference tests
are based on a t-test for means and a Wilcoxon-test for medians. a, b, and c denote significance at the 1%, 5%, and 10% level, respectively.
Panel A: Acquirer Returns
All 1993-2000 1998-2000 2001-2002 2003-2007 2005-2006 (5)-(2) (6)-(3)
(1) (2) (3) (4) (5) (6)
CARs (-1,+1)
All mean -1.50a -1.41a -2.13a -1.70a -1.66a -1.73a -0.25 0.40
median -0.98a -0.96a -1.53a -1.31a -0.90a -1.03a 0.06 0.50
n 3,206 2,161 935 323 722 293
Cash mean 0.68a 0.97a 1.40a 1.51b -0.02 0.10 -0.99b -1.30b
median 0.28b 0.42a 0.67a 0.79c -0.09 -0.09 -0.51b -0.76c
n 681 368 150 73 240 99
Stock mean -2.43a -2.12a -3.15a -4.26a -3.34a -2.87a -1.22b 0.28
median -1.63a -1.46a -2.38a -3.28a -2.28a -0.96b -0.83b 1.42
n 1,535 1,239 511 118 178 68
Hybrid mean -1.55a -1.41a -2.16a -1.18b -1.98a -2.54a -0.57 -0.38
median -1.27a -1.05a -1.57a -1.30b -1.53a -2.16a -0.48c -0.60
n 990 554 274 132 304 126
CARs (-10,+10)
All mean -2.05a -2.16a -2.99a -1.66b -1.89a -1.91a 0.27 1.09
median -1.65a -1.72a -2.62a -1.32b -1.62a -1.96a 0.10 0.65
n 3,206 2,161 935 323 722 292
Cash mean 0.31 0.89 1.35 1.28 -0.86 -0.36 -1.76b -1.71
median 0.30 0.78 1.02 0.82 -0.47 -0.47 -1.25b -1.49c
n 681 368 150 73 240 99
Stock mean -2.78a -2.76a -4.07a -3.57a -2.35a -1.94 0.41 2.13
median -2.13a -2.23a -4.46a -2.26a -1.43a -1.14 0.79 3.32
n 1,535 1,239 511 118 178 67
Hybrid mean -2.55a -2.84a -3.37a -1.63 -2.43a -3.11a 0.41 0.26
median -2.55a -2.41a -2.68a -2.13b -3.22a -3.39a -0.80 -0.71
n 990 554 274 132 304 126

30
Panel B: Target Returns
All 1993-2000 1998-2000 2001-2002 2003-2007 2005-2006
(5)-(2) (6)-(3) (1) (2) (3) (4) (5) (6)
CARs (-1,+1)
All mean 19.47a 18.23a 19.65a 26.99a 20.01a 18.91a 1.79b -0.74
median 16.23a 15.13a 15.98a 21.34a 16.67a 16.24a 1.54b 0.25
n 2,509 1,699 745 240 570 224
Cash mean 27.69a 26.80a 29.37a 37.33a 26.79a 24.12a -0.02 -5.25c
median 23.00a 21.64a 23.67a 31.55a 21.95a 19.74a 0.32 -3.93
n 541 295 118 46 200 83
Stock mean 16.42a 15.68a 17.47a 26.81a 14.58a 15.87a -1.10 -1.60
median 13.39a 13.28a 14.38a 22.93a 12.02a 15.60a -1.27 1.22
n 1,192 959 400 93 140 49
Hybrid mean 18.43a 18.03a 18.45a 22.44a 17.43a 15.84a -0.59 -2.62
median 14.88a 14.85a 14.72a 16.19a 14.87a 14.02a 0.03 -0.70
n 776 445 227 101 230 92
CARs (-10,+10)
All mean 23.31a 23.05a 25.95a 28.60a 21.84a 21.35a -1.21 -4.61a
median 20.27a 20.65a 23.47a 22.58a 18.77a 17.71a -1.88 -5.76b
n 2,509 1,699 745 240 570 225
Cash mean 31.12a 31.53a 36.82a 41.37a 28.10a 25.62a -3.43 -11.20a
median 26.95a 27.97a 31.58a 36.48a 23.66a 20.75a -4.31c -10.84a
n 541 295 118 46 200 83
Stock mean 20.51a 20.34a 23.52a 28.85a 16.13a 16.97a -4.21b -6.55b
median 18.04a 18.30a 21.84a 23.63a 14.57a 13.87a -3.73b -7.97b
n 1,192 959 400 93 140 50
Hybrid mean 22.13a 23.20a 24.49a 22.48a 19.91a 19.87a -3.29b -4.62c
median 18.81a 20.44a 20.45a 18.34a 17.62a 16.67a -2.82 -3.78
n 776 445 227 101 230 92

31
Panel C: Combined Returns
All 1993-2000 1998-2000 2001-2002 2003-2007 2005-2006
(5)-(2) (6)-(3) (1) (2) (3) (4) (5) (6)
CARs (-1,+1)
All mean 1.12a 1.14a 0.64a 1.03a 1.09a 1.15a -0.04 0.51
median 0.74a 0.76a 0.31c 0.71b 0.64a 0.67a -0.12 0.35
n 2,509 1,692 739 248 569 222
Cash mean 2.58a 2.92a 3.07a 3.40a 1.87a 1.82a -1.04b -1.25c
median 1.71a 2.10a 2.71a 2.70a 1.19a 0.91a -0.91b -1.80b
n 551 296 119 53 202 83
Stock mean 0.12 0.24 -0.33 -0.65 -0.17 0.42 -0.41 0.75
median -0.04 0.05 -0.46 -0.53 -0.52 0.28 -0.56 0.74
n 1,186 953 393 95 138 47
Hybrid mean 1.60a 1.88a 1.02b 1.37b 1.17a 0.90c -0.71 -0.12
median 0.89a 1.11a 0.30 1.20b 0.54a 0.42 -0.57 0.12
n 772 443 227 100 229 92
CARs (-10,+10)
All mean 1.12a 1.12a 0.66 0.64 1.31a 1.23b 0.19 0.57
median 0.79a 0.77a 0.56c 1.23 0.57a 0.33 -0.20 -0.23
n 2,509 1,692 739 248 569 222
Cash mean 2.85a 3.99a 4.53a 2.37 1.29b 0.92 -2.70a -3.61a
median 2.59a 3.58a 3.81a 1.38 1.22b 1.04 -2.36a -2.77a
n 551 296 119 53 202 83
Stock mean -0.18 -0.27 -1.14c -0.98 0.97 1.31 1.23 2.44
median -0.36 -0.44 -1.10c 0.27 -0.15 1.06 0.29 2.17
n 1,186 953 393 95 138 47
Hybrid mean 1.85a 2.16a 1.71b 1.23 1.53a 1.48c -0.63 -0.24
median 1.36a 2.07a 1.81b 2.38 0.52c -0.42 -1.54 -2.22
n 772 443 227 100 229 92

32
Table 5. Winners and Losers
The sample of acquisitions meets the criteria described in Table 1. The table reports the percentage share of winners and losers as well as moderate and extreme winners and losers around the acquisition
announcement. Winners (Losers) are acquirers subject to positive (negative) abnormal returns. Extreme winners (losers) are acquirers that experience abnormal returns above (below) the median value of the positive
(negative) return sub-set of the full sample. Difference tests are based on a t-test for means and a Wilcoxon-test for medians. a, b, and c denote significance at the 1%, 5%, and 10% level, respectively.
All 1993-2000 1998-2000 2003-2007 2005-2006
(4)-(2) (5)-(3) (1) (2) (3) (4) (5)
All Moder Extr All Moder Extr All Moder Extr All Moder Extr All Moder Extr All Moder Extr All Moder Extr
Winners
CAR>0
[0, 2.6] >2.6 [0, 2.6] >2.6 [0, 2.6] >2.6 [0, 2.6] >2.6 [0, 2.6] >2.6 [0, 2.6] >2.6 [0, 2.6] >2.6
All 39.8 50 50 41 48.9 51.1 37.1 41.2 58.8 36.8 58.6 41.4 34.8 57.8 42.2 -4.2b 9.7a -9.7a 2.3 16.6a -16.6a
Cash 53.3 50.1 49.9 54.9 46.5 53.5 58 40.2 59.8 48.3 59.5 40.5 47.5 57.5 42.5 -6.6 13.0b -13.0b 10.5 17.3c -17.3c
Stock 34.9 51.6 48.4 36.5 51.5 48.5 30.9 43 57 30.9 63.6 36.4 36.8 56 44 -5.6 12.1c -12.1c -5.9 13 -13
Hybrid 38.3 47.8 52.2 41.7 45.9 54.1 37.2 39.2 60.8 31.3 54.8 45.2 23.8 60 40 -10.4a 8.9 -8.9 13.4a 20.8b -20.8b
Losers
CAR<0
[-3.6, 0) <-3.6 [-3.6, 0) <-3.6 [-3.6, 0) <-3.6 [-3.6, 0) <-3.6 [-3.6, 0) <-3.6 [-3.6, 0) <-3.6 [-3.6, 0) <-3.6
All 60.2 50 50 59.1 48.2 51.8 62.9 40.6 59.4 63.2 56.8 43.2 65.2 57.1 42.9 4.2b 8.6a -8.6a -2.3 16.5a -16.5a
Cash 46.7 69.5 30.5 45.1 68.7 31.3 42 61.9 38.1 51.7 72.6 27.4 52.5 75 25 6.6 3.9 -3.9 -10.5 13.1 -13.1
Stock 65.1 44.3 55.7 63.5 45.5 54.5 69.1 38.2 61.8 69.1 42.3 57.7 63.2 34.8 65.2 5.6 -3.2 3.2 5.9 -3.4 3.4
Hybrid 61.7 49.3 50.7 58.3 44.3 55.7 62.8 37.8 62.2 68.8 56 44 76.2 57.3 42.7 10.5a 11.7a -11.7a -13.4a 19.5a -19.5a

33
Table 6. Regressions of Acquisition Premiums
The sample of acquisitions meets the criteria described in Table 1. The dependent variable is the offer premium; offer price
over the target‟s share price 4 weeks prior the acquisition announcement. Premium observations between zero and two are
excluded. Regressions are performed for i) the entire sample (specifications 1-2), ii) for 1993-2000 and 2003-2007
observations only (specifications 3-4), and iii) for 1998-2000 and 2005-2006 observations only (specifications 5-6). 2003-
2007 is a dummy variable that takes the value of 1 for acquisitions announced between 2003 and 2007, and zero otherwise.
2005-2006 is a binary variable that takes the value of 1 for acquisitions announced between 2005 and 2006, and zero
otherwise. COMP is a dummy variable equal to 1 if the target firm received at least one additional bid from a third party
when the initial bid was still under consideration, and zero otherwise. TEND is a dummy equal to 1 if a tender offer was
made to target shareholders and zero otherwise. SERIAL is a dummy equal to 1 if the acquiring firm has made 2 or more
acquisitions within 2 consecutive years, and zero otherwise. HOST is a dummy equal to 1 if the acquirer makes an offer to
target shareholders bypassing target management and zero otherwise. INTER is a dummy equal to 1 if the acquiring and the
target firms have a different 2-digit SIC code, and zero otherwise. FIN is a dummy equal to 1 if the target is a financial firm
with SIC code between 6000-6999, and zero otherwise. TECH is a dummy equal to 1 if the acquiring firm is in a high-tech
industry, and zero otherwise. RUNUP is the buy-and-hold return of the CRSP value-weighted index for a 6 month period
ending 10 days preceding the acquisition announcement. STOCK is a dummy variable if the transaction was financed 100%
with stock. ASIZE (TSIZE) is the natural logarithm of the acquirer‟s (target‟s) market capitalization one month prior to the
acquisition announcement. RELQ is the acquirer‟s Tobin‟s Q over target‟s Tobin‟s Q. Tobin‟s Q is defined as the book value
of assets plus market value of equity minus the book value of equity over the book value of assets at the fiscal year end prior
to the announcement year. N is the number of observations in each regression and Adj. R2 is the adjusted R-squared. p-values
are reported below regression estimates. a, b, and c denote significance at the 1%, 5%, and 10% level, respectively.
All 1993-2000 & 2003-2007 1998-2000 & 2005-2006
(1) (2) (3) (4) (5) (6)
Intercept 0.5592a 0.5377a 0.5337a 0.5244a 0.5408a 0.5977a
0.000 0.000 0.000 0.000 0.000 0.000
2003-2007 -0.0894a -0.0876a -0.0969a -0.0991a
0.000 0.000 0.000 0.000
2005-2006 -0.1287a -0.1377a
0.000 0.000
COMP 0.1393a 0.1106a 0.1754a 0.1479a 0.1119b 0.1215b
0.000 0.004 0.000 0.000 0.041 0.042
TEND 0.0315 0.0381 0.0380c 0.0319 0.0476 0.0692c
0.117 0.122 0.071 0.225 0.143 0.077
SERIAL 0.0189 0.0262 0.0044 0.0138 -0.0015 0.0258
0.184 0.112 0.765 0.420 0.945 0.316
HOST 0.1637a 0.1942a 0.1829a 0.2295a 0.1377 0.1280
0.004 0.001 0.002 0.000 0.180 0.225
INTER 0.0231c 0.0276c 0.0251c 0.0266 0.0221 0.0356
0.096 0.090 0.077 0.113 0.315 0.154
FIN -0.0956a -0.0904a -0.0806a -0.0791a -0.1029a -0.0939a
0.000 0.000 0.000 0.000 0.000 0.003
TECH 0.0266c -0.0022 0.0367b 0.0159 0.0510b 0.0359
0.099 0.907 0.026 0.411 0.042 0.217
RUNUP -0.1711b -0.1134 -0.2270b -0.2278b -0.1807 -0.2173
0.017 0.171 0.015 0.044 0.193 0.196
STOCK 0.0093 0.0071 0.0080 0.0045 0.0426c 0.0381
0.517 0.668 0.591 0.797 0.068 0.154
ASIZE 0.0378a 0.0359a 0.0365a 0.0353a 0.0390a 0.0307a
0.000 0.000 0.000 0.000 0.000 0.001
TSIZE -0.0704a -0.0701a -0.0638a -0.0647a -0.0656a -0.0664a
0.000 0.000 0.000 0.000 0.000 0.000
RELQ 0.0328a
0.0299a
0.0127
0.001
0.003
0.314
N 2,264 1,479 2,050 1,307 915 637
Adj. R2 (%) 13.00 16.15 12.33 15.64 13.96 17.06

34
Table 7. Regressions of Acquirer Returns
The dependent variable is the 3-day acquirer cumulative abnormal return (CAR) where market model parameters are
estimated over the period (-250, -15) relative to the announcement day. The sample meets the criteria described in Table 1.
Regressions are performed for i) the entire sample (specifications 1-2), ii) for 1993-2000 and 2003-2007 observations only
(specifications 3-4), and iii) for 1998-2000 and 2005-2006 observations only (specifications 5-6). 2003-2007 is a dummy
variable that takes the value of 1 for acquisitions announced between 2003 and 2007, and zero otherwise. 2005-2006 is a
binary variable that takes the value of 1 for acquisitions announced between 2005 and 2006, and zero otherwise. RSIZE is the
natural logarithm of the market value of the target over the market value of the acquirer, measured one month prior to the
acquisition announcement. The remaining variables are defined in Table 6. N is the number of observations in each
regression and Adj. R2 is the adjusted R-squared. p-values are reported below regression estimates. a, b, and c denote
significance at the 1%, 5%, and 10% level, respectively.
All 1993-2000 & 2003-2007 1998-2000 & 2005-2006
(1) (2) (3) (4) (5) (6)
Intercept 0.0091c 0.0004 0.0081 -0.0045 0.0007 -0.0193
0.073 0.963 0.135 0.611 0.934 0.131
2003-2007 -0.0042 -0.0022 -0.0037 -0.0003
0.136 0.539 0.207 0.924
2005-2006 0.0014 0.0108c
0.782 0.076
COMP -0.0111c -0.0082 -0.0090 -0.0109 -0.0147 -0.0161
0.092 0.312 0.204 0.214 0.214 0.222
TEND 0.0206a 0.0138a 0.0185a 0.0135b 0.0142b 0.0198b
0.000 0.008 0.000 0.018 0.040 0.022
SERIAL 0.0032 -0.0058c 0.0042 -0.0059 0.0066 -0.0016
0.202 0.092 0.118 0.105 0.144 0.773
HOST 0.0035 0.0211c 0.0044 0.0229c -0.0068 0.0102
0.762 0.090 0.722 0.090 0.774 0.669
INTER 0.0036 0.0010 0.0038 0.0011 0.0074c -0.0010
0.146 0.778 0.136 0.766 0.087 0.847
FIN 0.0017 -0.0019 -0.0003 -0.0047 0.0034 -0.0012
0.567 0.653 0.920 0.284 0.529 0.858
TECH -0.0146a -0.0157a -0.0165a -0.0189a -0.0067 -0.0082
0.000 0.000 0.000 0.000 0.187 0.192
RUNUP 0.0237c 0.0701a 0.0235 0.0779a 0.0254 0.0948a
0.058 0.000 0.164 0.001 0.354 0.009
STOCK -0.0162a -0.0156a -0.0141a -0.0122a -0.0191a -0.0127b
0.000 0.000 0.000 0.001 0.000 0.026
ASIZE -0.0024a -0.0030a -0.0022a -0.0019c -0.0025b -0.0020
0.000 0.002 0.001 0.064 0.017 0.184
RSIZE
-0.0099a
-0.0086a
-0.0093a
0.000
0.000
0.000
RELQ -0.0062a
-0.0077a
-0.0077a
0.002
0.000
0.005
N 3,206 1,663 2,883 1,464 1,228 704
Adj. R2 (%) 4.53 7.63 4.09 6.90 3.08 6.09

35
Table 8. Regressions of Target Returns
The dependent variable is the 3-day target cumulative abnormal return (CAR) where market model parameters are estimated
over the period (-250, -15) relative to the announcement day. The sample meets the criteria described in Table 1 and the
target firm is listed on CRSP and COMPUSTAT. Regressions are performed for i) the entire sample (specifications 1-2), ii)
for 1993-2000 and 2003-2007 observations only (specifications 3-4), and iii) for 1998-2000 and 2005-2006 observations only
(specifications 5-6). 2003-2007 is a dummy variable that takes the value of 1 for acquisitions announced between 2003 and
2007, and zero otherwise. 2005-2006 is a dummy variable that takes the value of 1 for acquisitions announced between 2005
and 2006, and zero otherwise. RSIZE is the natural logarithm of the market value of the target over the market value of the
acquirer, measured one month prior to the acquisition announcement. The remaining variables are defined in Table 6. N is the
number of observations in each regression and Adj. R2 is the adjusted R-squared. p-values are reported below regression
estimates. a, b, and c denote significance at the 1%, 5%, and 10% level, respectively.
All 1993-2000 & 2003-2007 1998-2000 & 2005-2006
(1) (2) (3) (4) (5) (6)
Intercept 0.2156a 0.2146a 0.1917a 0.1944a 0.2112a 0.2136a
0.000 0.000 0.000 0.000 0.000 0.000
2003-2007 0.0111 0.0138 0.0125 0.0138
0.222 0.152 0.173 0.164
2005-2006
0.0006 0.0060
0.969 0.703
COMP -0.0326c -0.0713a -0.0301 -0.0719a -0.0433 -0.0553
0.099 0.001 0.145 0.003 0.191 0.109
TEND 0.0859a 0.1029a 0.0886a 0.1041a 0.1245a 0.1578a
0.000 0.000 0.000 0.000 0.000 0.000
HOST 0.0937a 0.1137a 0.1093a 0.1379a 0.0726 0.0841
0.005 0.001 0.002 0.000 0.249 0.177
INTER 0.0113 0.0038 0.0171b 0.0127 0.0228c 0.0184
0.154 0.683 0.035 0.189 0.077 0.190
FIN -0.0174c -0.0200c -0.0166c -0.0218c -0.0158 -0.0244
0.067 0.073 0.086 0.058 0.319 0.156
TECH 0.0262a 0.0050 0.0229b 0.0010 0.0356b 0.0023
0.004 0.647 0.015 0.932 0.016 0.887
RUNUP -0.2844a -0.2605a -0.2271a -0.2247a -0.2674a -0.1735c
0.000 0.000 0.000 0.001 0.001 0.068
STOCK -0.0243a -0.0198b -0.0268a -0.0261a -0.0078 -0.0138
0.003 0.037 0.002 0.009 0.574 0.360
TSIZE -0.0144a -0.0151a -0.0106a -0.0117a -0.0147a -0.0156a
0.000 0.000 0.000 0.000 0.000 0.000
RSIZE -0.0318a -0.0311a -0.0301a -0.0292a -0.0281a -0.0257a
0.000 0.000 0.000 0.000 0.000 0.000
RELQ 0.0108c
0.0130b
0.0136c
0.055
0.026
0.059
N 2,509 1,640 2,269 1,451 969 696
Adj. R2 (%) 16.31 18.72 14.68 17.40 16.11 19.61

36
Table 9. Regressions of Combined Returns
The dependent variable is the 3-day combined acquirer and target cumulative abnormal return (CAR) where market model
parameters are estimated over the period (-250, -15) relative to the announcement day. Combined returns are calculated using
the market value-weighted average of the acquirer and target abnormal returns where market values are measured one month
prior to the acquisition announcement. The sample meets the criteria described in Table 1 and the target firm is listed on
CRSP and COMPUSTAT. Regressions are performed for i) the entire sample (specifications 1-2), ii) for 1993-2000 and
2003-2007 observations only (specifications 3-4), and iii) for 1998-2000 and 2005-2006 observations only (specifications 5-
6). 2003-2007 is a dummy variable that takes the value of 1 for acquisitions announced between 2003 and 2007, and zero
otherwise. 2005-2006 is a dummy variable that takes the value of 1 for acquisitions announced between 2005 and 2006, and
zero otherwise. The remaining variables are defined in Table 6. N is the number of observations in each regression and Adj.
R2 is the adjusted R-squared. p-values are reported below regression estimates. a, b, and c denote significance at the 1%, 5%,
and 10% level, respectively.
All 1993-2000 & 2003-2007 1998-2000 & 2005-2006
(1) (2) (3) (4) (5) (6)
Intercept 0.0339a 0.0339a 0.0349a 0.0349a 0.0223a 0.0236a
0.000 0.000 0.000 0.000 0.000 0.001
2003-2007 -0.0040 -0.0019 -0.0036 -0.0002
0.156 0.547 0.211 0.951
2005-2006 0.0022 0.0061
0.670 0.259
COMP -0.0070 -0.0112 -0.0057 -0.0120 -0.0074 -0.0155
0.253 0.121 0.385 0.127 0.494 0.183
TEND 0.0193a 0.0171a 0.0195a 0.0162a 0.0198a 0.0240a
0.000 0.000 0.000 0.002 0.002 0.002
SERIAL -0.0041 -0.0068b -0.0028 -0.0064b -0.0015 -0.0028
0.101 0.023 0.286 0.046 0.727 0.563
HOST 0.0160 0.0237b 0.0189c 0.0296b 0.0150 0.0267
0.122 0.039 0.092 0.019 0.464 0.202
INTER 0.0043c 0.0037 0.0057b 0.0049 0.0071c 0.0050
0.082 0.226 0.026 0.126 0.096 0.296
FIN -0.0026 -0.0023 -0.0042 -0.0050 -0.0008 -0.0059
0.397 0.540 0.181 0.202 0.874 0.318
TECH -0.0093a -0.0077b -0.0111a -0.0111a -0.0043 -0.0045
0.001 0.029 0.000 0.003 0.376 0.418
RUNUP 0.0074 0.0209 -0.0013 0.0273 0.0011 0.0478
0.554 0.173 0.937 0.205 0.967 0.140
STOCK -0.0151a -0.0162a -0.0137a -0.0142a -0.0132a -0.0123b
0.000 0.000 0.000 0.000 0.004 0.016
RSIZE 0.0064a 0.0055a 0.0068a 0.0059a 0.0055a 0.0048a
0.000 0.000 0.000 0.000 0.000 0.004
RELQ -0.0030
-0.0037c
-0.0054b
0.103
0.059
0.032
N 2,509 1,636 2,261 1,442 961 689
Adj. R2 (%) 6.84 6.37 7.29 7.00 3.96 5.42

37
Table 10. Acquirer Long-Run Returns
The table reports monthly calendar time acquirer abnormal returns. The sample meets the criteria described in Table 1. Acquirers
enter the portfolio on the announcement month of each transaction and remain for 36 months. Abnormal returns are calculated
using i) calendar time abnormal returns (CTARs) and ii) calendar time portfolio regressions (CTPRs). ACTARs acquirer
abnormal returns are calculated as CTARi,t = Ri,t – RSize/BM benchmark,t. where Ri,t is the return of acquirer i at month t and RSize/BM
benchmark,t is the return of the corresponding 25 size and book-to-market reference portfolio for the same month as in Mitchell and
Stafford (2000). The ACTAR is then given by the universal average of all mean monthly abnormal return observations. CTPR
intercepts are from a time-series regression of the following form: Rpt – Rft = p + bp (Rmt - Rft) + sp SMBt + hp HMLt + up UMDt
+ pt, where Rpt – Rft , is the equally-weighted, monthly calendar time portfolio excess return and the independent variables are
the Fama/French (1993) and Carhart (1997) factors. ACTAR difference tests are based on a t-test for means and a Wilcoxon-test
for medians. p-values are reported in brackets below abnormal return estimates. a,b, and c denote statistical significance at the
1%, 5%, and 10% level. Cal is the number of calendar months and n is the number of observations. Calendar months with less
than 10 return observations are excluded from regressions.
All 1993-2000 1998-2000 2001-2002 2003-2007 2005-2006
(5)-(2) (6)-(3) (1) (2) (3) (4) (5) (6)
All ACTAR -0.252a -0.149 -0.237 -0.183 -0.385b -0.801a -0.236 -0.564c
p-value [0.005] [0.219] [0.171] [0.372] [0.012] [0.003] [0.221] [0.070]
Cal 204 131 71 59 84 59
CTPRa -0.039 0.113 0.263 0.139 -0.257c -0.647a
p-value [0.714] [0.431] [0.219] [0.517] [0.051] [0.004]
Cal 202 130 71 58 82 58
n 3,170 2,135 922 321 290 714
Cash ACTAR -0.035 0.006 -0.072 1.194c -0.163 -0.282 -0.168 -0.210
p-value [0.783] [0.975] [0.812] [0.080] [0.396] [0.223] [0.523] [0.582]
Cal 204 131 71 59 84 59
CTPRa 0.264c 0.324c 0.309 0.982b -0.041 -0.264
p-value [0.065] [0.076] [0.292] [0.029] [0.792] [0.270]
Cal 199 125 67 53 80 54
n 672 361 145 73 99 238
Stock ACTAR -0.391b -0.043 -0.237 -0.569c -0.781b -1.102b -0.738b -0.866
p-value [0.012] [0.815] [0.433] [0.080] [0.013] [0.021] [0.042] [0.120]
Cal 204 131 71 59 84 59
CTPRa -0.210 0.245 0.344 -0.282 -0.651b -1.204b
p-value [0.209] [0.196] [0.281] [0.434] [0.032] [0.012]
Cal 201 128 70 55 80 54
N 1,525 1,232 508 118 67 175
Hybrid ACTAR -0.441a -0.439b -0.403 -0.252 -0.397c -0.993b 0.042 -0.590
p-value [0.001] [0.014] [0.104] [0.494] [0.057] [0.013] [0.876] [0.203]
Cal 204 131 71 59 84 59
CTPRa -0.160 -0.212 -0.115 0.181 -0.322c -0.479c
p-value [0.187] [0.215] [0.665] [0.443] [0.056] [0.087]
Cal 198 124 69 55 80 56
n 973 542 269 130 124 301


