The Role of Transfer in the Attainment of Bachelor’s
Degrees at Washington Public Baccalaureate Institutions, Class
of 2006
Higher Education Coordinating BoardOctober 27, 2009
University of Washington Tacoma
1

Method and Questions
• Used combined PCHEES & SBCTC data files
• Conducted by Paul Stern, Kirby Pitman, and Dave Pavelchek, SESRC – Puget Sound Division
• Examined academic and background characteristics of 2006 Public Baccalaureate Graduates (n=19,272), including by:• campus type – (main, branch, and center)• % transfer vs. direct entry• type of two-year degree earned• enrollment in pre-college English or math• successful degree completion (by 6 broad major
areas)2
Limitations
• Some variables were not available in the developing database (e.g. earned credits, etc.)
• Some data were missing, particularly transfer credits from institutions other than Washington Community and Technical Colleges
• Some data were collected inconsistently by colleges (e.g. dual credit)
3

Public degree production has grown rapidly at centers, branch campuses, and other off-campus
locations
4
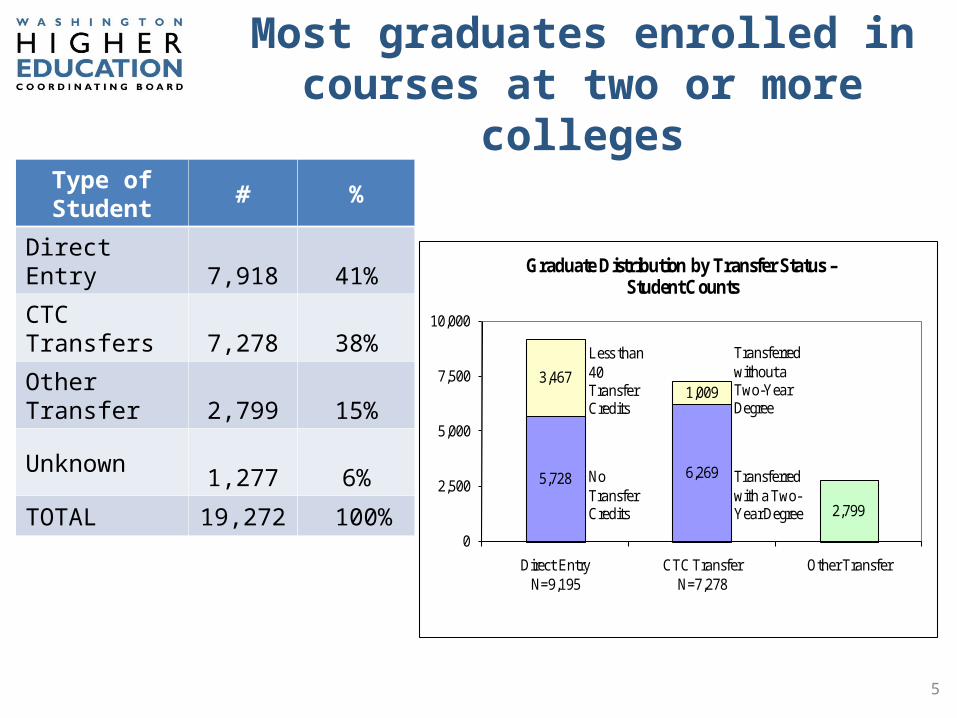
Most graduates enrolled in courses at two or more
colleges
5,728 6,269
2,799
3,4671,009
0
2,500
5,000
7,500
10,000
Direct Entry N=9,195
CTC TransferN=7,278
Other Transfer
Graduate Distribution by Transfer Status –Student Counts
Less than 40 Transfer Credits
NoTransferCredits
Transferred with a Two-Year Degree
Transferred without a Two-Year Degree
5
Type of Student # %
Direct Entry 7,918 41%
CTC Transfers 7,278 38%
Other Transfer 2,799 15%
Unknown 1,277 6%
TOTAL 19,272 100%

Direct entry students tended to be younger (under 25) than transfer
students
6
Transfer Status by Age at Graduation
0
2,500
5,000
7,500
10,000
Direct Entry (9,191)
CTC Transfers(7,278)
Other Transfer (2,797)
30+
25-29
Under 25
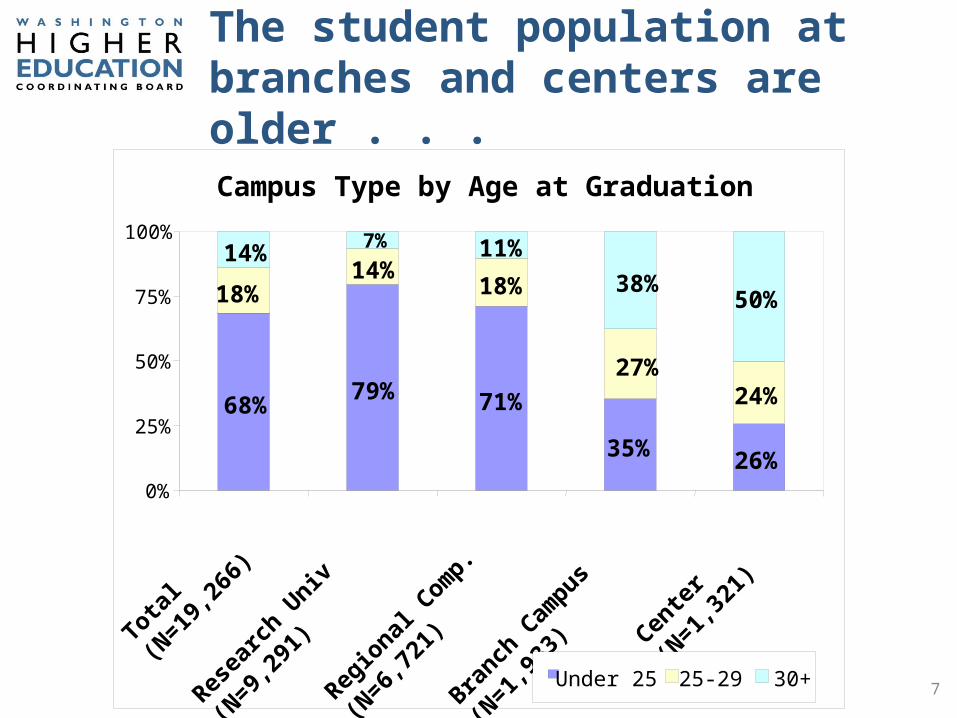
The student population at branches and centers are older . . .
7
Campus Type by Age at Graduation
68%79% 71%
35% 26%
18%14%
18%
27%24%
14%7% 11%
38%50%
0%
25%
50%
75%
100%
Total
(N=19
,266)
Resea
rch U
niv (N
=9,291
)
Region
al Com
p. (N=6,7
21)
Branch
Cam
pus (N
=1,933
)
Center
(N=1,3
21)
Under 25 25-29 30+
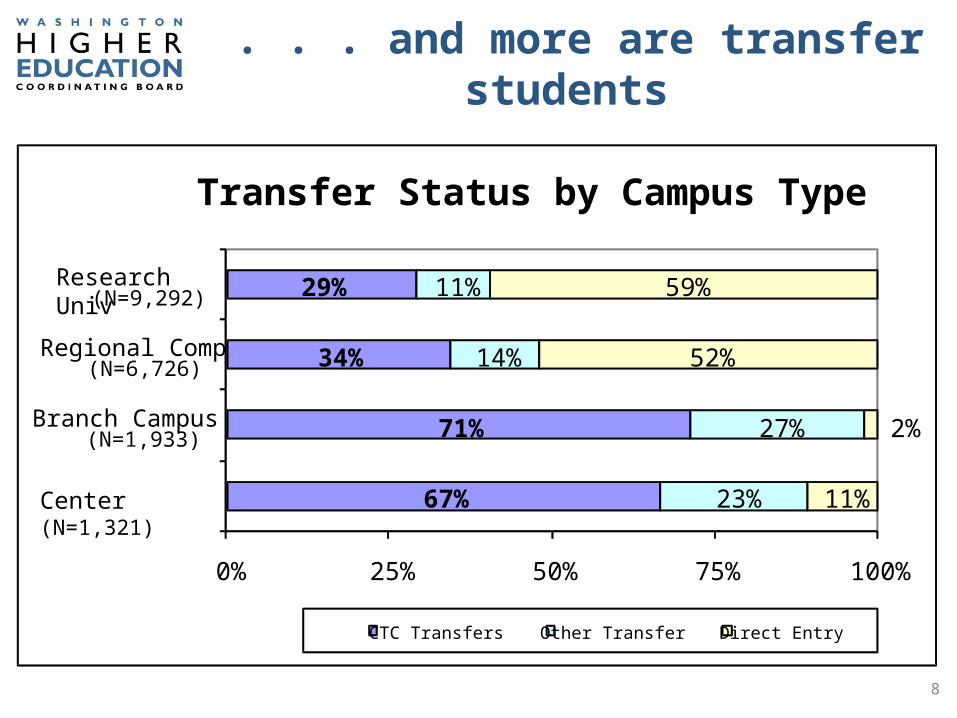
. . . and more are transfer students
8
67%
71%
34%
29%
23%
27%
14%
11%
11%
2%
52%
59%
0% 25% 50% 75% 100%
Center (N=1,321)
Branch Campus (N=1,933)
Regional Comp (N=6,726)
Research Univ (N=9,292)
Transfer Status by Campus Type
CTC Transfers Other Transfer Direct Entry
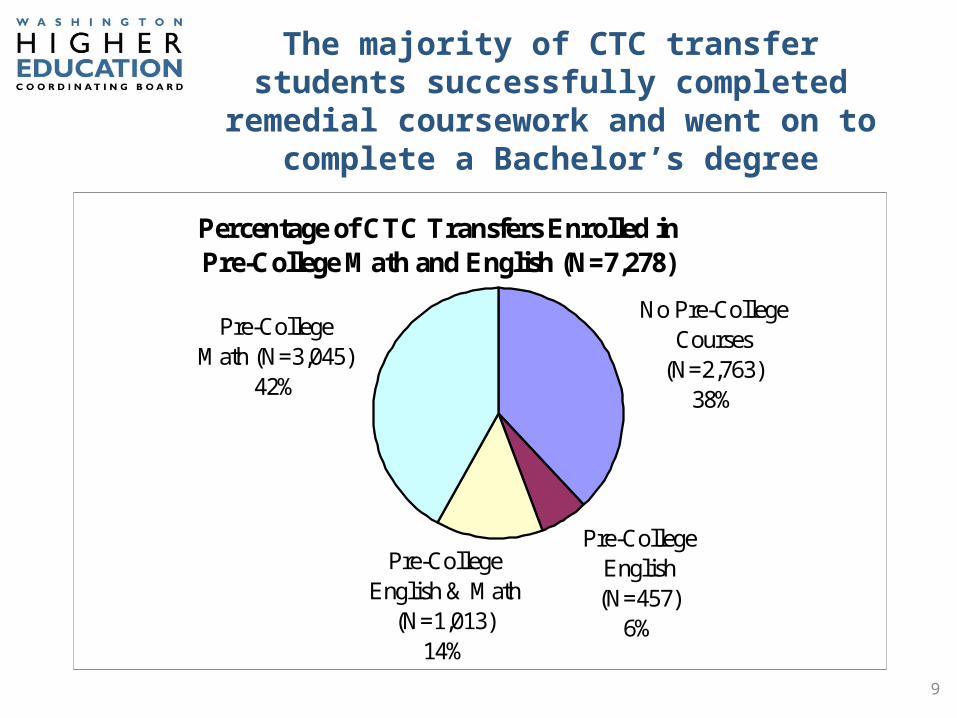
The majority of CTC transfer students successfully completed remedial
coursework and went on to complete a Bachelor’s degree
Percentage of CTC Transfers Enrolled inPre-College Math and English (N=7,278)
No Pre-College Courses
(N=2,763)38%
Pre-College English (N=457)
6%
Pre-College English & Math
(N=1,013)14%
Pre-College Math (N=3,045)
42%
9

More than 4,500 students successfully completed remedial coursework at a CTC in
English or Math and progressed to a bachelor’s degree
Percentage of CTC Transfers by Major Enrolled in Pre-College Math and English
18%25%
19% 20% 24%17%
22%
60%50%
65%
35%
56% 60%70%
0%
25%
50%
75%
100%
Arts &Letters
(N=1,835)
Business (N=1,413)
Education (N=526)
STEM (N=1,067)
Health (N=290)
Soc Sci (N=1,372)
Other (N=775)
Pre-College English Pre-College Math
35% of STEM graduates (n=232) and 50% of business graduates (n=505) took pre-college math
10

Mission Matters: Different types of institutions tend to specialize in
particular majors
Distribution of Majors by Campus Type
11
17% 16% 13%23%
31%
17% 24%13%
9% 1%5% 2%
9%4% 15%
4% 3%2% 16%
5%20% 25%
17%
11% 14%
27%24%
33%31%
12%
9% 6% 12%7%
22%
0%
25%
50%
75%
100%
Overall Research Univ Regional Comp Branch Campus Center
Majors by Campus Type
Other Arts and Letters Soc Sci & Psych Health Education STEM Business

Transfer Pathways seem to be effective
48 out of 53 students completing the Business DTA/MRP earned a bachelor’s degree in business
12
Median Credits Attempted/Earned Toward Business Degree
208.5 credits 199.5 207.0 211.0
242.0
Total (N=1,211)
BusinessDTA
(N=44)
DTA (N=923)
No AAEarned (N=175)
Technicaland OtherDegree (N=69)
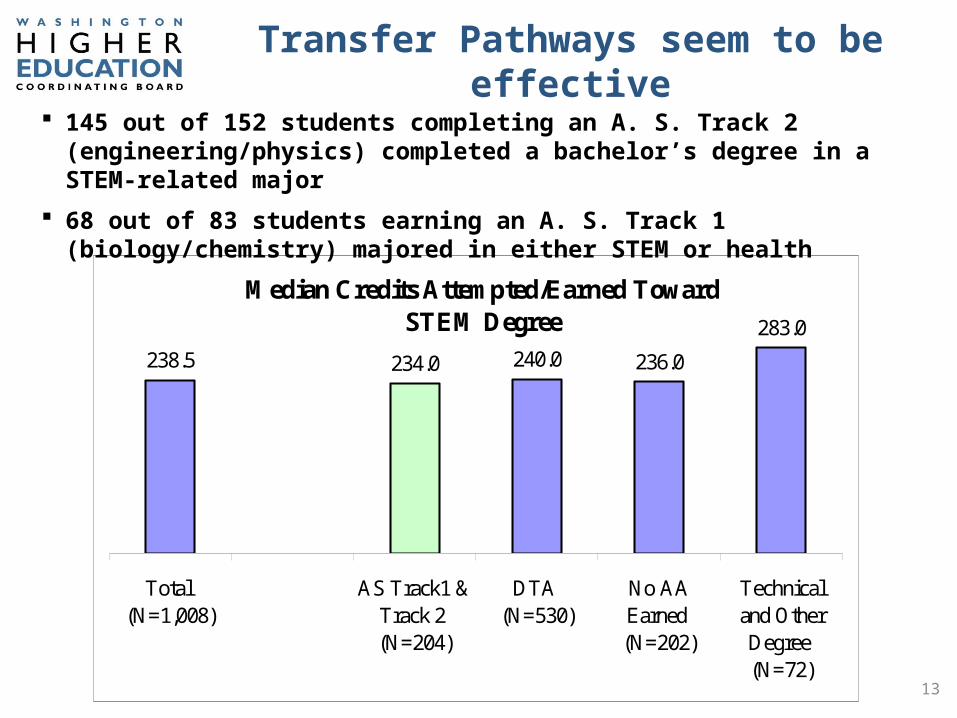
Transfer Pathways seem to be effective
Median Credits Attempted/Earned Toward STEM Degree
238.5 234.0 240.0 236.0
283.0
Total (N=1,008)
AS Track1 &Track 2 (N=204)
DTA (N=530)
No AAEarned (N=202)
Technicaland OtherDegree (N=72)
145 out of 152 students completing an A. S. Track 2 (engineering/physics) completed a bachelor’s degree in a STEM-related major
68 out of 83 students earning an A. S. Track 1 (biology/chemistry) majored in either STEM or health
13
Next Steps
• Continue working with Education Research and Data Center (ERDC) to improve PCHEES data set. – Capture earned as well as attempted credits
• Identify core questions for longitudinal studies about transfer, as well as any additional questions more suitable for periodic studies.
• Consider the pro’s and con’s in integrating the two transfer studies we currently conduct into one report.
14


