
Characterization of goat colostrum oligosaccharides by nano-liquid chromatography on chip quadrupole time-of-flight mass spectrometry and hydrophilic interaction liquid chromatography-quadrupole mass spectrometry
A. Martín-Ortiza, J. Salcedob, D. Barileb, A. Bunyatratchatab, F.J. Morenoc, I. Martin-Garcíad, A. Clemented, M.L. Sanza,*, and A.I. Ruiz-Matutea
aInstituto de Química Orgánica General (CSIC), Juan de la Cierva 3, 28006 Madrid, Spain
bDepartment of Food Science and Technology, University of California Davis, One Shields Avenue, Davis, CA 95616, USA
cInstituto de Investigación en Ciencias de la Alimentación, CIAL (CSIC-UAM), Universidad Autónoma de Madrid, C/Nicolás Cabrera 9, Campus de Cantoblanco, 28049 Madrid, Spain
dEstación Experimental del Zaidín, Consejo Superior de Investigaciones Científicas (CSIC), Profesor Albareda 1, 18008 Granada, Spain
Abstract
A detailed qualitative and quantitative characterization of goat colostrum oligosaccharides (GCO)
has been carried out for the first time. Defatted and deproteinized colostrum samples, previously
treated by size exclusion chromatography (SEC) to remove lactose, were analyzed by nanoflow
liquid chromatography-quadrupole-time of flight mass spectrometry (Nano-LC-Chip-Q-TOF MS).
Up to 78 oligosaccharides containing hexose, hexosamine, fucose, N-acetylneuraminic acid or N-
glycolylneuraminic acid monomeric units were identified in the samples, some of them detected
for the first time in goat colostra. As a second step, a hydrophilic interaction liquid
chromatography coupled to mass spectrometry (HILIC-MS) methodology was developed for the
separation and quantitation of the main GCO, both acidic and neutral carbohydrates. Among other
experimental chromatographic conditions, mobile phase additives and column temperature were
evaluated in terms of retention time, resolution, peak width and symmetry of target carbohydrates.
Narrow peaks (wh: 0.2–0.6 min) and good symmetry (As: 0.8–1.4) were obtained for GCO using
an acetonitrile:water gradient with 0.1% ammonium hydroxide at 40 °C. These conditions were
selected to quantify the main oligosaccharides in goat colostrum samples. Values ranging from
140 to 315 mg L−1 for neutral oligosaccharides and from 83 to 251 mg L−1 for acidic
oligosaccharides were found. The combination of both techniques resulted to be useful to achieve
a comprehensive characterization of GCO.
*Corresponding author. [email protected] (M.L. Sanz).
Appendix A. Supplementary dataSupplementary data associated with this article can be found, in the online version, at http://dx.doi.org/10.1016/j.chroma.2015.09.060.
HHS Public AccessAuthor manuscriptJ Chromatogr A. Author manuscript; available in PMC 2016 February 02.
Published in final edited form as:J Chromatogr A. 2016 January 8; 1428: 143–153. doi:10.1016/j.chroma.2015.09.060.
Author M
anuscriptA
uthor Manuscript
Author M
anuscriptA
uthor Manuscript

Keywords
Goat colostrum; Oligosaccharides; Mass spectrometry; Hydrophilic interaction liquid; chromatography; Nanoflow liquid; chromatography-quadrupole-time of flight; mass spectrometry
1. Introduction
Goat milk is a complex mixture of nutritive and bioactive components with reported health
benefits such as carbohydrates, lipids and proteins [1]. Although lactose is the main
carbohydrate, presence of other oligosaccharides (OS) similar to those found in human milk,
has been reported [2]. Among them, some studies indicate the existence of: (i) neutral
oligosaccharides, whose structures are mainly based on lactose with the addition of neutral
monosaccharides such as glucose or galactose (Hex), N-acetylglucosamine or N-
acetylgalactosamine (HexNAc) and fucose or deoxyhexose (Fuc) and (ii) acidic
oligosaccharides, containing acidic components such as N-acetylneuraminic (Neu5Ac) or N-
glycolylneuraminic acid (Neu5Gc) [3,4]. Some of these oligosaccharides, such as those
containing fucosyl- or sialyl-groups have been described to have prebiotic and pathogen
binding activities [5–9]. Although much effort has been focused on the composition,
structure and bioactiv-ity of OS in human milk, scarce information about both qualitative
and quantitative composition of goat milk OS is available. Since it is well known that
bioactive properties are directly related to OS chemical structure, the search of novel
sensitive and reproducible methods for the analysis of goat milk OS is of special relevance.
Moreover, it is expectable that goat colostrum has higher amounts of OS than goat milk in a
similar way to bovine or human milk [3,10], representing an interesting source of bioactive
OS.
Among the different techniques used for OS analysis, high performance liquid
chromatography (LC) is one of the most widespread. Human milk OS have been
successfully analyzed by normal phase [11] and reverse phase LC [11–13], although a
previous derivatization step is required to improve carbohydrates retention [14]. High
performance anion exchange chromatography (HPAEC) provides better separation without a
previous derivatization step and it has been widely used for goat milk OS characterization
and quantitation [2,15–19]. However, the complex profiles obtained for OS mixtures with
different linkage variants and the use of high pH and high salts concentrations in mobile
phases make this technique not compatible with mass spectrometry (MS), impairing their
complete characterization [20].
Hydrophilic interaction liquid chromatography (HILIC) is a powerful LC operation mode
for the analysis of complex OS mixtures (galactooligosaccharides, gentiooligosaccharides,
etc.), providing an appropriate resolution and good peak shapes [14,20]. Moreover, mobile
phases used in HILIC are compatible with MS and even the use of a high percentage of
organic solvents enhances the ionization and increase sensitivity which makes this technique
appropriate for structural and glycomic research [21]. However, applications of HILIC to the
analysis of mammal milks are scarce. Marino et al. [22] developed a methodology for the
analysis of bovine colostrum OS based on their fluorescent labeling, pre-fractionation by
Martín-Ortiz et al. Page 2
J Chromatogr A. Author manuscript; available in PMC 2016 February 02.
Author M
anuscriptA
uthor Manuscript
Author M
anuscriptA
uthor Manuscript
weak anionic exchange chromatography and separation by HILIC using an amide based
column and a fluorescence detector. Structural assignment of 37 free glycans was carried out
by a combination of HILIC analyses, exoglycosidase digestion, desalting and offline
MS/MS analyses. HILIC has also been used for the successful determination of six acidic
OS in bovine milk, bovine colostrum, and infant formulas [23] in combination with high-
resolution selected reaction monitoring mass spectrometry (HILIC-HRSRM-MS).
Nevertheless, to the best of our knowledge, HILIC-MS has not been previously used for
goat milk OS analysis, being the optimization of the method a requirement for their
comprehensive characterization.
In recent years, the use of nano-liquid chip-based technologies mainly coupled to MS or
tandem MS (MS/MS) techniques have demonstrated to be extremely helpful for OS
identification and it has been applied to milk characterization due to its high sensitivity and
capacity for compositional verification [4]. Nano-LC-Chip technology coupled to time of
flight (TOF) MS has been successfully used for OS analysis of human milk [24], porcine
milk [25] and bovine milk [26,27]. An exhaustive characterization of OS in goat’s milks
with and without the genetic ability to synthesize αs1-casein by nano flow liquid
chromatography-quadrupole-TOF MS (Nano-LC-Chip-Q-TOF MS) with a porous
graphitized carbon column has been recently reported [4]. Twenty nine goat milk OS, 11 of
which were detected by the first time, were identified and verified via MS/MS analyses.
Moreover, a goat milk oligosaccharide library was also created, which gathered information
available in the literature with the new identifications. This methodology has been proven to
be an excellent tool for the identification of OS in mammal milks due to its high sensitivity
and mass resolution; however, it has not been previously applied to the analysis of goat
colostrum samples which could be of interest for further exploitation of goat colostrum
oligosaccharides (GCO) as prebiotics.
In this study, goat colostrum samples, previously purified by size exclusion chromatography
(SEC) to remove lactose, were firstly submitted to Nano-LC-Chip-Q-TOF MS analysis in
order to exhaustively characterize their oligosaccharide fraction. As a second step, a HILIC-
MS methodology was developed for the separation and quantitation of the main GCO, both
acidic and neutral compounds.
2. Materials and methods
2.1. Chemicals and reagents
All reagents were of analytical grade or better. Acetic acid from Normasolv (Barcelona,
Spain), ammonium acetate, ammonium hydroxide from Panreac (Barcelona, Spain) and
ethanol of analytical grade were purchased from Lab-Scan (Gliwice, Poland). Acetonitrile
(ACN) and formic acid HPLC-MS grade were purchased from Fisher-Scientific (Fair Lawn,
NJ, USA). ESI-TOF Low concentration Tuning Mix G1969–85000 was purchased from
Agilent Technologies (Santa Clara, CA, USA).
Analytical standards of β-4-galactosyl-lactose, maltotriose and maltotetraose were obtained
from Sigma Chemical Co. (St. Louis, MO, USA). 6′-Sialyl-lactose (6′-SL) sodium salt, 3′-
sialyl-lactose (3′-SL) sodium salt, 2′-fucosyl-lactose (2′-FL) and 3′-sialyl-N-
Martín-Ortiz et al. Page 3
J Chromatogr A. Author manuscript; available in PMC 2016 February 02.
Author M
anuscriptA
uthor Manuscript
Author M
anuscriptA
uthor Manuscript

acetyllactosamine were purchased from Carbosynth (Berkshire, UK). Standard solutions in
ACN:water (50:50, v:v) were filtered through nylon FH membranes (0.22 µm; Millipore,
Bedford, MA, USA) before injection.
2.2. Colostrum samples
For this study, colostrum samples from four Murciano-Granadina goats (CS1–CS4) were
obtained from an experimental farm located at Estación Experimental del Zaidín (Granada,
Spain). In addition, colostrum from twelve individual Murciano-Granadina goats reared at
Hermanos Archiduque farm (Granada, Spain) were collected and pooled (CS5). Collected
samples were immediately frozen at −80°C until further analysis. Animals were cared and
handled in accordance with the Spanish guidelines for experimental animal protection
(Royal Decree 53/2013 on the protection of animals used for experimentation or other
scientific purposes) in line of corresponding European Directive (2010/63/EU). An
experimental protocol was approved by the Ethics Committee for Animal Research from the
Animal Nutrition Unit.
2.3. Fat and protein removal
Fat and proteins were removed from the samples following the methodology described by
Martinez-Ferez et al. [15] with small modifications. Briefly, samples were defatted by
centrifugation at 6500 × g for 15min at 5°C, then kept in an ice bath for 30min and filtrated
through Whatman No. 1 filter paper to remove the supernatant lipid layer, which was
discarded.
The total protein fraction was precipitated by adding two volumes of cold ethanol to the
skimmed colostrum samples and shaking for 2 h in an ice bath. The solution was then
centrifuged at 6500 × g for 30 min at 5 °C and supernatant was carefully collected. Ethanol
was evaporated from the sample in a rotary evaporator (Büchi Labortechnik AG, Flawil,
Switzerland) at 37 °C and the remaining aqueous solution containing the carbohydrate
fraction was frozen and lyophilized.
2.4. Colostrum oligosaccharides isolation
Considering the high amounts of lactose present in goat colostrum and the interference of
this disaccharide in the analysis of minor oligosaccharides, samples were submitted to SEC
fractionation to remove mono- and disaccharides, obtaining an enriched oligosaccharide
fraction. Briefly, 25 mL of colostrum carbohydrate solution (20% wt:v) was injected into a
Bio-Gel P2 (Bio-Rad, Hercules, CA, USA) column (90 cm × 5 cm) using water as the
mobile phase at a flow of 1.5mLmin−1 and maintained at 4°C. The degree of polymerization
(DP) of collected fractions was determined by electrospray ionization-mass spectrometry
(ESI-MS) on an Agilent 1200 series HPLC system (Hewlett-Packard, Palo Alto, CA, USA)
coupled to a quadrupole HP-1100 mass detector at positive polarity selecting the
corresponding m/z values. Fractions with DP ≥3 were pooled and freeze-dried.
2.5. Chromatographic analyses
2.5.1. Qualitative analysis (Nano-LC-Chip-Q-TOF MS)—Prior to MS analysis,
purified and dried OS of CS1–CS5 were reconstituted to a final concentration of 0.1 mg
Martín-Ortiz et al. Page 4
J Chromatogr A. Author manuscript; available in PMC 2016 February 02.
Author M
anuscriptA
uthor Manuscript
Author M
anuscriptA
uthor Manuscript
mL−1 with nanopure water. MS analysis was performed with an Agilent 6520 accurate-mass
Quadrupole-Time-of-Flight (Q-TOF) LC/MS with a microfluidic nano-electrospray chip
(Agilent Technologies, Santa Clara, CA, USA) as previously described [28]. The chip
employed contained enrichment and analytical columns, both packed with graphitized
carbon. Chromatographic elution was performed with a binary gradient of 3% ACN/0.1%
formic acid in water (solvent A), and 90% ACN/0.1% formic acid in water (solvent B). The
column was initially equilibrated and eluted with a flow rate of 0.3 µL min−1 for the nano
pump and 4 µL min−1 for the capillary pump. The 65-min gradient was programmed as
follows: 0–2.5 min, 0% B; 2.5–20 min, 0–16% B; 20–30 min, 16–44% B; 30–35 min, 44–
100% B; 35–45 min, 100% B; 45–65 min, 0% B. Data were acquired in the positive
ionization mode with a 450–2500 mass/charge (m/z) range. The electrospray capillary
voltage was 1600–1700 V. The acquisition rate was 0.63 spectra/s for both MS and MS/MS
modes. Automated precursor selection was employed based on abundance, with up to 6
MS/MS per MS. The precursor isolation window was narrow (1.3 m/z). Fragmentation
energy was set at 1.8V/100Da with an offset of −2.4 V. Internal calibration was performed
using m/z 922.009 and 1221.991 as the reference masses (ESI-TOF Low concentration
Tuning Mix G1969–85000, Agilent Technologies).
For OS identification, the Find Compounds by Formula function of Mass Hunter Qualitative
Analysis Version B.06.00 (Agilent Technologies) was used to generate a list of
deconvoluted masses selected to be in a range of 450–1500 m/z with a >1000 height count
and a typical isotopic distribution of small biological molecules. Charge states allowed were
1–2. The function matched the masses of oligosaccharides with the goat milk
oligosaccharide databases [4] creating a list of OS compositions with their specific retention
time (RT).
Oligosaccharide compositions were confirmed by tandem MS (MS/MS) analysis using the
same method previously described recording 6 MS/MS per each MS analysis. Compounds
selected for MS/MS analysis were those with a count higher than 1000. Once OS were
confirmed by MS/MS and their RT established, the relative abundance of each OS were
determined by integration of individual peaks using the Batch Targeted Feature Extractor
from MassHunter Profinder Version B.06.00 (Agilent Technologies) and using the MS
library created in a previous work [4]. The retention time window allowed for compound –
matching was ±0.5 min with the addition of ±0.25% of the RT at each time point.
2.5.2. Quantitative analysis (HILIC-QMS)—GCO analyses were performed on an
Agilent 1200 series HPLC system (Hewlett-Packard, Palo Alto, CA, USA) equipped with an
oven (Kariba Instruments, UK) and coupled to a quadrupole HP-1100 mass detector
(Hewlett-Packard, Palo Alto, CA, USA) provided with an electrospray ionization (ESI)
source. Samples (5 µL) were injected using a Rheodyne 7725 valve.
LC experiments were carried out on an ethylene bridge hybrid with trifunctionally-bonded
amide phase (BEH X-Bridge column); 150 mm × 4.6 mm; 3.5 µm particle size, 135Å pore
size, Waters (Hertfordshire, UK) at a flow rate of 0.4 mL min−1. Different binary gradients
consisting of acetonitrile (ACN):water with addition of different additives (0.1% ammonium
Martín-Ortiz et al. Page 5
J Chromatogr A. Author manuscript; available in PMC 2016 February 02.
Author M
anuscriptA
uthor Manuscript
Author M
anuscriptA
uthor Manuscript

hydroxide, 0.1% acetic acid or 5 mM ammonium acetate) and column temperatures (30–60
°C) were assayed. Injection volume was 5 µL.
The electrospray ionization source was operated under positive or negative polarity using
the following MS parameters: capillary voltage, 4kV; temperature, 300 °C; nitrogen drying
gas flow, 12 L min−1; nebulizer (N2, 99.5% purity) pressure, 276kPa; and fragmentor
voltage, 80–110 V. Adducts formed under optimal conditions were evaluated. In positive
mode, mono-sodiated adducts [M+Na]+ were primarily formed for the different samples and
only minor abundances of [M+K]+ and [M+H]+ were observed. Similarly, in negative mode,
[M−H]− were detected. Therefore, ions corresponding to [M+Na]+ in positive mode and [M
−H]− in negative mode of the oligosaccharides under analysis were monitored in SIM mode
using default variable fragmentor voltages. Data were processed using HPChem Station
software version 10.02 (Hewlett-Packard, Palo Alto, CA, USA).
Optimization of the method was carried out on the basis of RT, peak width at half height
(wh), peak tailing measured by the peak asymmetry factor (As): calculated as the ratio of the
back half to front half widths at 10% of the peak height, and resolution (Rs), calculated as
2(tR2 −tR1)/(wb1 +wb2), where 1 and 2 refer to two consecutive eluting carbohydrates and
wb is the peak width at base. Rs values should be higher than 1.0 to get an appropriate
separation and As close to 1 to get symmetric peaks.
Quantitative analysis was performed in triplicate by the external standard method, using
calibration curves within the range 0.25–100 mg L−1 for maltotriose, maltotetraose, 2′-FL,
3′-SL and 6′-SL. Prior to quantitation of OS in all colostrum samples, matrix effect was
evaluated by quantifying target analytes in solutions of CS5 before and after SEC treatment
diluted in water at different ratios (1:1–1:50, v/v). Reproducibility of the method was
estimated on the basis of the intra-day and inter-day precision, calculated as the relative
standard deviation (RSD) of retention times and concentrations of oligosaccharide standards
obtained in n = 5 independent measurements. Limit of detection (LOD) and limit of
quantitation (LOQ) were calculated as three and ten times, respectively, the signal to noise
ratio (S/N).
3. Results and discussion
3.1. Qualitative analysis of goat colostrum oligosaccharides
Several studies have pointed out the efficiency of MS related techniques to characterize OS
from different biological fluids [24,25,29].The Nano-LC-Chip-Q-TOF MS system is an
excellent tool for oligosaccharide characterization in different mammal milks, allowing the
identification of over 150 different OS in human milk and 55 in bovine milk [28–30]. In this
work, a great variety of GCO structures were identified (based on their RT and accurate
masses), showing a different profile than human or bovine milk.
Considering the high content of lactose in goat colostrum, qualitative structural analysis of
GCO required a previous purification step based on SEC, leading to a reduction of 99.9% in
lactose concentration (Fig. 1S in supplementary material). A partial loss of neutral OS
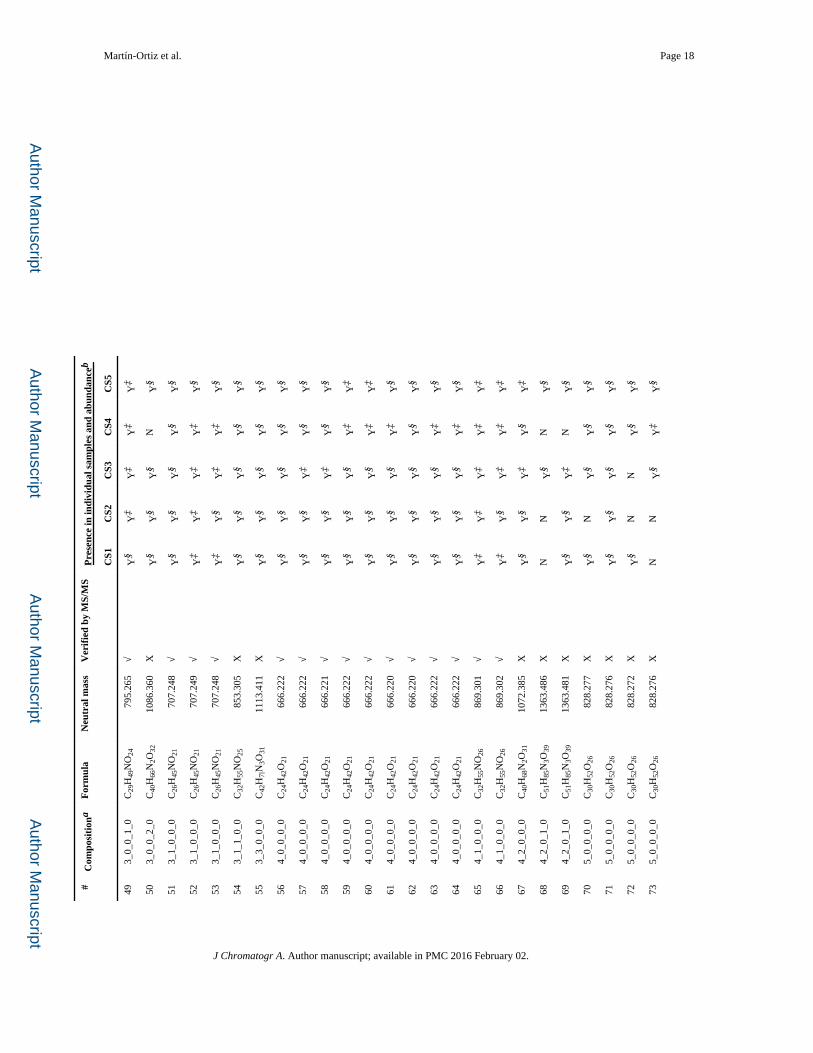
containing three monomeric units was also observed. Table 1 presents the list of OS
Martín-Ortiz et al. Page 6
J Chromatogr A. Author manuscript; available in PMC 2016 February 02.
Author M
anuscriptA
uthor Manuscript
Author M
anuscriptA
uthor Manuscript

identified by nano-LC-QTOF MS in the five goat colostrum samples previously purified by
SEC. A total of 78 compounds were identified as oligosaccharides, 59 of which have been
confirmed by their MS/MS spectrum. These results indicate that GCO show greater
complexity compared to those of other domestic animals [3,4,9,15,19,31]. Similar nano-LC
profiles were observed among the samples analyzed (see Fig. 1), although the whole set of
OS was not identified in all samples tested. Fig. 2 shows MS/MS spectrum of hexosyl-
lactose, 2′-FL, and 3′-SL as representative of each OS type (neutral, fucosylated and acidic).
The corresponding losses of the different monomeric units of these OS are indicated in the
figure. MS/MS spectra of all OS identified in the samples analyzed are also available in Fig.
2S of supplementary material.
From the 78 oligosaccharides identified, 40 (51.3%) are neutral non-fucosylated, 3 (3.8%)
neutral fucosylated and 35 (44.9%) corresponded to sialylated (Ne5Ac/Neu5Gc)
oligosaccharides. The predominant OS found in these colostrum fractions analyzed were
sialyl-lactoses (neutral mass 633.211) followed by Hex-HexNAc-Neu5Ac (neutral mass
674.238) and Hex-HexNAc-Neu5Gc (neutral mass 690.232) residues.
Regarding neutral OS, 7 isomers of the neutral oligosaccharide galactosyl-lactose (neutral
mass 504.169), 9 isomers of digalactosyl-lactose (neutral mass 666.222), 5 isomers of tri-
galactosyl-lactose (neutral mass 828.277) and 4 isomers of tetragalactosyl-lactose (neutral
mass 990.331) were also detected. Different isomers of N-acetylglucosaminyl-lactose
(neutral mass 545.195) and N-acetylglucosaminyl-hexosyl-lactose (neutral mass 707.249)
and N-acetylglucosaminyl-dihexosyl-lactose (neutral mass 869.301) were also found in all
the colostra. These results are in good agreement with those found by Meyrand et al. [4] in
goat milks, although a higher number of isomers of each oligosaccharide have been detected
in the present work. Additionally, three oligosaccharides containing fucose were found in
these samples (fucosyl-lactosamine, 2′-fucosyl-lactose and lacto-N-fuco-pentaose); some of
these OS were detected in low abundance which hindered our ability to achieve good
tandem spectra as further confirmation.
A total of 35 acidic OS, containing N-acetylneuraminic monomers (18), N-
glycolylneuraminic monomers (13) and 4 containing both (isomers of sialyl-N-glycolyl-
neuraminyl-lactose), were detected in goat colostrum (Table 1). To the best of our
knowledge, these results show the greatest number of acidic OS found in goat milk, also
including a higher Neu5Gc presence than that reported in previous studies (54.8% vs.
29.4%) [4,19,31].
Conventionally, a step of reduction of carbohydrate aldehydes into their alditols form is
performed using sodium borohydride. However, due to the low abundance of some
fucosylated OS, the reduction was not performed to avoid unwanted sample losses
associated with intense washing of residual borates (incompatible with the subsequent mass
spectrometry analysis). Therefore, in some cases, the oligosaccharide isomers separated by
nano-LC may include α and β anomers.
Martín-Ortiz et al. Page 7
J Chromatogr A. Author manuscript; available in PMC 2016 February 02.
Author M
anuscriptA
uthor Manuscript
Author M
anuscriptA
uthor Manuscript

3.2. Quantitative analysis of goat colostrum oligosaccharides
3.2.1. Optimization of HILIC-Q MS conditions—The pool goat colostrum CS5 sample
after SEC treatment was chosen as a representative sample for the optimization of the
HILIC-Q MS method. Molecular ion adducts for fucosyl-lactose, galactosyl-lactoses, sialyl-
lactoses, digalactosyl-lactoses, sialyl-lactosamines and glycolyl-neuraminyl-lactosamines
were selected for the optimization of HILIC-QMS conditions at both positive and negative
mode (Table 2). According to results shown in Table 1, several peaks were detected for
selected m/z ions depending on the different conditions; however, only the main ones were
considered for the optimization of the method. Chromatographic peaks corresponding to [M
+Na]+ 656 and 511 m/z ions under positive polarity and [M−H]− 632 and 487 m/z ions under
negative polarity were assigned to 6′-SL and 3′-SL and 2′-FL, respectively, by comparison
of their retention times and MS data with those of commercial standards.
The use of BEH-amide stationary phase was evaluated for the analysis of GCO. Different
gradients of acetonitrile:water using 0.1% ammonium hydroxide as additive were assayed
for the analysis of CS5 oligosaccharides. First of all, initial gradient conditions were
evaluated, using different percentages of aqueous phase (10, 15 and 20%); 15% was selected
for following experiments considering the appropriate retention times (14–16 min) of the
first eluting compounds (acidic OS). Percentage of the aqueous phase was also increased up
to 50% and 80% in 50 min; 50% was enough for the elution of target carbohydrates. Finally,
gradient rate was also evaluated: aqueous phase was modified from 15% to 50% in 30, 40
and 50 min; whereas 30 and 40 min were too fast for the appropriate elution of all the
compounds, 50 min provided the best conditions. These elution results were slightly
improved reducing final time to 46 min, when all target carbohydrates had eluted. In all
cases, 10 min were required at 50% aqueous phase to clean de column. Then, initial
conditions were recovered in 1 min and finally equilibrated for 15 min. These conditions
were also applied to both 0.1% acetic acid and 5 mM ammonium acetate additives.
Table 3 shows the chromatographic parameters (RT, wh, As and Rs) considered for the
selected carbohydrates under positive polarity. In all cases, acidic OS eluted before the
neutral ones; this effect was more notable working under basic conditions (0.1% ammonium
acetate as additive) where two eluting zones were clearly distinguished in CS5 profiles: (i)
acidic oligosaccharides (14.6–16.5 min) and (ii) neutral oligosaccharides (32.6–42.5 min).
The main separation mechanism in HILIC seems to be based on the partitioning between a
water-enriched layer on the surface of the polar stationary phase and the relatively
hydrophobic eluent [32] which mainly affect neutral carbohydrates. However, although
BEH is considered a neutral stationary phase, ionization of residual surface silanol groups in
this stationary phase at pH above 4 could impart negative charges to the column [32]. Under
working conditions, negatively charged acidic oligosaccharides (pKa of sialic acid = 2.6)
would be electrostatically repelled by the stationary phase and elute at shorter retention
times.
No noticeable differences in the resolution values for the different conditions assayed were
observed. Although, as previously mentioned, a better separation between acidic and neutral
oligosaccharides was achieved using 0.1% ammonium hydroxide as additive, coelutions
Martín-Ortiz et al. Page 8
J Chromatogr A. Author manuscript; available in PMC 2016 February 02.
Author M
anuscriptA
uthor Manuscript
Author M
anuscriptA
uthor Manuscript

between 3′-SL, sialyl-lactosamine and a glycolyl-neuraminyl-lactosamine and 6′-SL and a
glycolyl-neuraminyl-lactosamine were observed. This behavior was also detected using 5
mM ammonium acetate as additive. A better separation was observed under acidic
conditions except for 3′-SL and a glycolyl-neuraminyl-lactosamine. Different isomers of [M
+Na]+ 527 and 689 m/z coeluted at the same retention time under all conditions, resulting in
broad peaks mainly for digalactosyl-lactoses (wh: 2.0–3.6 min). Regarding the other
oligosaccharides, in general, good peak width and symmetry values were obtained under
both 0.1% ammonium hydroxide and 5 mM ammonium acetate (wh: 0.2–0.6 min and As:
1.0–1.4 and wh: 0.2–0.4min and As: 0.6–1.1, respectively), whereas slightly broader peaks
with poor symmetry were observed using 0.1% acetic acid as additive (wh: 0.3–0.6 min and
As: 0.7–2.8). Fig. 3a shows the HILIC-MS profile of registered CS5 oligosaccharides eluted
under basic conditions and positive polarity.
Under negative polarity, [M−H]− ions (632, 673 and 689 m/z) corresponding to acidic
carbohydrates (6′-SL and 3′-SL, sialyl-lactosamine and glycolyl-neuraminyl-lactosamine,
respectively) of CS5 were clearly detected using acetonitrile:water with 0.1% acetic acid,
0.1% ammonium hydroxide and 5 mM ammonium acetate as additives. However, in all
cases neutral carbohydrates could not be determined or were only slightly detected under
these conditions (Fig. 3b). Therefore, further works were carried out under positive polarity.
The effect of temperature was also evaluated using BEH amide column with
acetonitrile:water and 0.1% ammonium hydroxide as mobile phase. Three different
temperatures (30, 40, 60°C) were assayed (Table 3 and Table 4). As expected, as
temperature increased a higher decrease in RT of all the carbohydrates was observed (e.g.
differences in RT values of 3.6 min for 3′-SL and 2.3 min for 2′-FL between 30 and 60 °C
were observed). In general, narrower peaks with good symmetry were obtained at 40 and 60
°C (e.g. wh = 0.2–0.4 min; AS =0.7–1.3), compared to elutions at 30 °C (e.g. wh =0.2–0.6
min; AS = 0.7–1.4), whereas resolution was only slightly affected by temperature.
Considering these results and in order to avoid high temperatures which could affect the
stability of the stationary phase, 40 °C was selected for the analysis of the oligosaccharides
under study.
3.2.2. Analytical parameters—Once the chromatographic conditions were selected,
different analytical parameters were considered for the validation of the method before
quantitative analysis.
External standard method was used for the quantitative analysis using calibration curves
within the range 100–0.25 mg L−1 for 2′-FL, maltotriose, maltotetraose, 3′- and 6′-SL. These
compounds were selected as representative of neutral fucosylated trisaccharides, neutral
non-fucosylated trisaccharides, neutral tetrasaccharides and acidic OS, respectively. The
obtained correlation coefficients from these calibration curves ranged from 0.92 to 0.99.
Considering that GCO are present at low levels, limit of detection (LOD), limit of
quantitation (LOQ) and precision (RSD, %) data for a standard mixture including 6′-SL, 2′-
FL and maltotriose, as representative standards of target compounds, were calculated. As
shown in Table 5, the lowest LOD and LOQ values were obtained for 6′-SL(3.28 and
Martín-Ortiz et al. Page 9
J Chromatogr A. Author manuscript; available in PMC 2016 February 02.
Author M
anuscriptA
uthor Manuscript
Author M
anuscriptA
uthor Manuscript

10.94ngmL−1, respectively), whereas the highest were found for 2′-FL (160.62 and 535.41
ngmL−1, respectively). Good precision values were obtained for all standards analyzed
(RSD ranging 6.0–8.1%).
The potential effect on the quantitative determination of GCO of the sample matrix was also
considered by analyzing different dilutions (1:1–1:50, v/v) of CS5 before and after SEC
treatment. No differences in carbohydrates concentrations associated to a possible matrix
effect were found for the different dilutions.
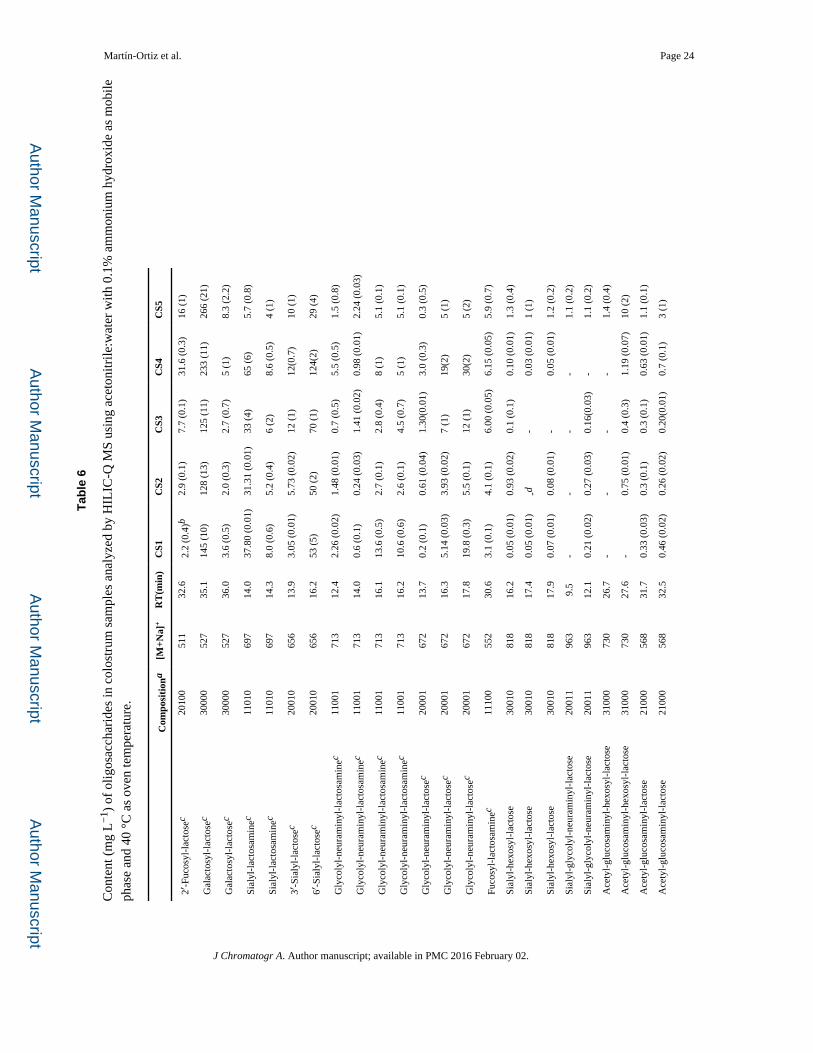
3.2.3. Quantitation of oligosaccharides in colostrum samples—Table 6 shows the
quantitative data (mg L−1 goat colostrum) of the most abundant GCO for the five samples.
Considering the potential loss of OS with three monomer units during SEC treatment,
oligosaccharides marked with an asterisk in the table (2′-FL, 3′-SL, 6′-SL, sialyl-
lactosamine, galactosyl-lactoses, fucosyl-lactosamine, glycolyl-neuraminyl-lactosamine and
glycolyl-neuraminyl-lactose) were quantified in the original samples only after fat and
protein removal (before performing SEC).
A high variability in quantified OS concentrations was observed among the different
colostrum samples. CS4 showed the highest concentrations of OS (572.24 mg L−1) whereas
CS2 and CS3 showed the lowest values (251.22 and 293.16 mg L−1, respectively). Values
ranging from 140 to 315 mg L−1 for neutral oligosaccharides and from 83 to 251 mg L−1 for
acidic oligosaccharides were found. The most abundant OS were galactosyl-lactoses
(separation of all the isomers was not possible and these compounds were quantified
together: 124.92–265.77 mg L−1). Concentration of these neutral carbohydrates in colostrum
samples are higher than those reported in the literature for goat milks [4]. Regarding
fucosyl-oligosaccharides, 2′-FL showed higher concentrations (2.21–31.59 mg L−1) than
fucosyl-lactosamine (3.08–6.15 mg L−1). As indicated before, concentration of 6′-SL
(28.85–123.76 mg L−1) was higher than that of 3′-SL (3.05–11.99 mg L−1) in all the
colostrum samples. These results could suggest an OS profile closer to human milk than
bovine milk, where 3′-SL is the predominant form in the latter. Relatively high amounts of
sialyl-lactosamine isomers were also found in colostrum samples (5.17–8.56 and 5.66–65.12
mg L−1), whereas lower concentrations of other acidic OS were observed (Table 6).
Although some of these oligosaccharides have been detected in previous works in mature
goat milks [4,10,15], to the best of our knowledge, this is the first time that such a large
number of oligosaccharides have been quantified in goat colostrum.
4. Conclusions
A high number of both neutral and acidic OS has been detected for the first time in different
goat colostrum samples by Nano-LC-Chip-Q-TOF MS. Moreover, a HILIC-QMS method
has successfully been developed for the first time for the quantitative analysis of these OS.
Regarding mobile phase, acetonitrile:water with 0.1% ammonium hydroxide as additive has
proven to be the most appropriate eluent to achieve good results in terms of peak width,
peak symmetry and resolution. This method has proven to be successful for the quantitation
of several OS in colostrum samples. Up to 0.57 g L−1 of total OS could be estimated,
galactosyl-lactoses being the predominant carbohydrates followed by sialyl- and fucosyl-
Martín-Ortiz et al. Page 10
J Chromatogr A. Author manuscript; available in PMC 2016 February 02.
Author M
anuscriptA
uthor Manuscript
Author M
anuscriptA
uthor Manuscript

oligosaccharides, respectively. Overall, findings contained in this work strengthen the
potential of goat colostrum as an efficient source of naturally-occurring bioactive OS.
Supplementary Material
Refer to Web version on PubMed Central for supplementary material.
Acknowledgments
This work has been funded by Junta de Andalucía (project AGR2011-7626), CSIC (project i-link0827), Comunidad Autónoma de Madrid (Spain) and European funding from FEDER program (AVANSECAL-CM S2013/ABI-3028) and Fundación Ramón Areces. This work was also supported by the UC Davis RISE program and the National Institutes of Health awards R21AT006180, R01AT007079, R01AT008759-02. Authors also thank I. Calvillo for her technical assistance.
References
1. Casado B, Affolter M, Kussmann M. OMICS-rooted studies of milk proteins oligosaccharides and lipids. J. Proteomics. 2009; 73:196–208. [PubMed: 19793547]
2. Martinez-Ferez A, Zapata JE, Guadixa A, Almecija MC, Gomez M, Guadix EM. Obtention ofgoat milk permeates enriched in lactose-derived oligosaccharides. Desalination. 2009; 245:730–736.
3. Urashima T, Saito T, Nakamura T, Messer M. Oligosaccharides of milk and colostrums in non-human mammals. Glycoconj. J. 2001; 18:357–371. [PubMed: 11925504]
4. Meyrand M, Dallas DC, Caillat H, Bouvier F, Martin P, Barile D. Comparison of milk oligosaccharides between goats with and without the genetic ability to synthesize αs1 -casein. Small Rumin. Res. 2013; 113:411–420. [PubMed: 24587592]
5. Wang B, Brand-Miller J, McVeagh P, Petocz P. Concentration and distribution of sialic acid in human milk and infant formulas. Am. J. Clin. Nutr. 2001; 74:510–515. [PubMed: 11566650]
6. Park, YW. Bioactive components in goat milk. In: Park, YW., editor. Bioactive Components in Milk and Dairy Products. UK: Wiley-Blackwell; 2009. p. 43-82.
7. Kunz C, Rudloff S. Health promoting aspects of milk oligosaccharides. Int. Dairy J. 2006; 16:1341–1346.
8. Yu Z-T, Chen C, Kling DE, Liu B, McCoy JM, Merighi M, Heidtman M, Newburg DS. The principal fucosylated oligosaccharides of human milk exhibit prebiotic properties on cultured infant microbiota. Glycobiology. 2013; 23:169–177. [PubMed: 23028202]
9. Viverge D, Grimmonprez L, Solere M. Chemical characterization of sialyl oligosaccharides isolated from goat (Capra hircus) milk. Biochim. Biophys. Acta. 1997; 1336:157–164. [PubMed: 9305785]
10. Mehra R, Kelly P. Milk oligosaccharides: structural and technological aspects. Int. Dairy J. 2006; 16:1334–1340.
11. Charlwood J, Tolson D, Dwek M, Camilleri P. A detailed analysis of neutral and acidic carbohydrates in human milk. Anal. Biochem. 1999; 273:261–277. [PubMed: 10469497]
12. Warren C, Chaturvedi P, Newburg A, Oftedal O, Tilden C, Newburg D. Comparison of oligosaccharides in milk specimens from humans and twelve other species. Adv. Exp. Med. Biol. 2001; 501:325–332. [PubMed: 11787698]
13. Asakuma S, Akahori M, Kimura K, Watanabe Y, Nakamura T, Tsunemi M, Arai I, Sanai Y, Urashima T. Sialyl oligosaccharides of human colostrum: changes in concentration during the first three days of lactation. Biosci. Biotechnol. Biochem. 2007; 71:1447–1451. [PubMed: 17587674]
14. Hernández-Hernández O, Calvillo I, Lebrón-Aguilar R, Moreno FJ, L Sanz M. Hydrophilic interaction liquid chromatography coupled to mass spectrometry for the characterization of prebiotic galactooligosaccharides. J. Chromatogr. 2012; A1220:57–67.
15. Martinez-Ferez A, Rudloff S, Guadix A, Henkel CA, Pohlentz G, Boza JJ, Guadix EM, Kunz C. Goats’ milk as a natural source of lactose-derived oligosaccharides: isolation by membrane technology. Int. Dairy J. 2006; 16:173–181.
Martín-Ortiz et al. Page 11
J Chromatogr A. Author manuscript; available in PMC 2016 February 02.
Author M
anuscriptA
uthor Manuscript
Author M
anuscriptA
uthor Manuscript

16. Martinez-Ferez A, Guadix A, Zapata-Montoya JE, Guadix EM. Influence of transmembrane pressure on the separation of caprine milk oligosaccharides from protein by cross-flow ultrafiltration. Int. J. Dairy Technol. 2008; 61:333–339.
17. Lara-Villoslada F, Debras E, Nieto A, Concha A, Galvez J, Lopez-Huertas E, Boza J, Obled C, Xaus J. Oligosaccharides isolated from goat milk reduce intestinal inflammation in a rat model of dextran sodium sulfate-induced colitis. Clin. Nutr. 2006; 25:477–488. [PubMed: 16375993]
18. Oliveira DL, Wilbey RA, Grandison AS, Duarte LC, Roseiro LB, Separation of oligosaccharides from caprine milk whey. prior to prebiotic evaluation. Int. Dairy J. 2012; 24:102–106.
19. Claps S, Di Napoli MA, Sepe L, Caputo AR, Rufrano D, Di Trana A, Annic-chiarico G, Fedele V. Sialyloligosaccharides content in colostrum and milk of two goat breeds. Small Rumin. Res. 2014; 121:116–119.
20. Brokl M, Hernández-Hernández O, CSoria A, L Sanz M. Evaluation of different operation modes of high performance liquid chromatography for the analysis of complex mixtures of neutral oligosaccharides. J. Chromatogr. 2011; A1218:7697–7703.
21. Wuhrer M, de Boer AR, Deelder AM. Structural glycomics using hydrophilic interaction liquid chromatography (HILIC) with mass spectrometry. Mass Spec-trom. Rev. 2009; 28:192–206.
22. Marino K, Lane JA, Abrahams JL, Struwe WB, Harvey DJ, Marotta M, Hickey RM, Rudd PM. Method for milk oligosaccharide profiling by 2-aminobenzamide labeling and hydrophilic interaction chromatography. Glycobiology. 2011; 21:1317–1330. [PubMed: 21566017]
23. Fong B, Ma K, McJarrow P. Quantification of bovine milk oligosaccharides using liquid chromatography-selected reaction monitoring-mass spectrometry. J. Agric. Food Chem. 2011; 59:9788–9795. [PubMed: 21790206]
24. Ninonuevo MR, Perkins PD, Francis J, Lamotte LM, LoCascio RG, Freeman SL, Mills DA, German JB, Grimm R, Lebrilla CB. Daily variations in oligosaccharides of human milk determined by microfluidic chips and mass spectrometry. J. Agric. Food Chem. 2008; 56:618–626. [PubMed: 18088092]
25. Tao N, Ochonicky KL, German JB, Donovan SM, Lebrilla CB. Structural determination and daily variations of porcine milk oligosaccharides. J. Agric. Food Chem. 2010; 58:4653–4659. [PubMed: 20369835]
26. Tao N, DePeters EJ, Freeman S, German JB, Grimm R. Bovine milkglycome. J. Dairy Sci. 2008; 91:3768–3778. [PubMed: 18832198]
27. Barile D, Marotta M, Chu C, Mehra R, Grimm R, Lebrilla CB, German JB. Neutral and acidic oligosaccharides in Holstein-Friesian colostrum during the first 3 days of lactation measured by high performance liquid chromatography on a microfluidic chip and time-of-flight mass spectrometry. J. Dairy Sci. 2010; 93:3940–3949. [PubMed: 20723667]
28. Wu S, Grimm R, German JB, Lebrilla CB. Annotation and structural analysis ofsialylated human milk oligosaccharides. J. Proteome Res. 2011; 10:856–868. [PubMed: 21133381]
29. Aldredge DL, Geronimo MR, Hua S, Nwosu CC, Lebrilla CB, Barile D. Annotation and structural elucidation of bovine milk oligosaccharides and determination of novel fucosylated structures. Glycobiology. 2013; 23:664–676. [PubMed: 23436288]
30. Wu S, Tao N, German JB, Grimm R, Lebrilla CB. Development of an annotated library of neutral human milk oligosaccharides. J. Proteome Res. 2010; 9:4138–4151. [PubMed: 20578730]
31. Albretch S, Lane JA, Marino K, Al-Bushada KA, Carrington SD, Hickey RM, Rudd PM. A comparative study of free oligosaccharides in the milk of domestic animals. Br.J. Nutr. 2014; 111:1313–1328. [PubMed: 24635885]
32. Buszewski B, Noga S. Hydrophilic interaction liquid chromatography (HILIC) - a powerful separation technique. Anal. Bioanal. Chem. 2012; 402:231–247. [PubMed: 21879300]
Martín-Ortiz et al. Page 12
J Chromatogr A. Author manuscript; available in PMC 2016 February 02.
Author M
anuscriptA
uthor Manuscript
Author M
anuscriptA
uthor Manuscript

Fig. 1. Nano-LC-Chip-Q-TOF MS profiles of goat colostrum oligosaccharides: CS1, CS2, CS3,
CS4, and CS5.
Martín-Ortiz et al. Page 13
J Chromatogr A. Author manuscript; available in PMC 2016 February 02.
Author M
anuscriptA
uthor Manuscript
Author M
anuscriptA
uthor Manuscript

Fig. 2. MS/MS spectra of: (a) hexosyl-lactose 3_0_0_0_0 (m/z 505.176), (b) 2′-FL (m/z 489.181),
and (c) 3′-SL (634.218). Light blue circle: hexose; dark blue circle: glucose; yellow circle:
galactose; red triangle: fucose; violet diamond: Neu5Ac. (For interpretation of the references
to color in this figure legend, the reader is referred to the web version of this article.)
Martín-Ortiz et al. Page 14
J Chromatogr A. Author manuscript; available in PMC 2016 February 02.
Author M
anuscriptA
uthor Manuscript
Author M
anuscriptA
uthor Manuscript

Fig. 3. Extracted ion chromatographic profile of CS5 oligosaccharides obtained using BEH amide
column and 0.1% ammonium hydroxide as mobile phase additive. (a) ESI interface working
under positive polarity and (b) under negative polarity. (1) 3′-Sialyl-lactose; (2) sialyl-
lactosamine; (3) glycolyl-neuraminyl-lactosamine; (4) 6í-sialyl-lactose; (5) 2′-fucosyl-
lactose; (6) galactosyl-lactoses; (7) di-hexosyl-lactoses.
Martín-Ortiz et al. Page 15
J Chromatogr A. Author manuscript; available in PMC 2016 February 02.
Author M
anuscriptA
uthor Manuscript
Author M
anuscriptA
uthor Manuscript

Author M
anuscriptA
uthor Manuscript
Author M
anuscriptA
uthor Manuscript
Martín-Ortiz et al. Page 16
Tab
le 1
Lis
t of
olig
osac
char
ides
fou
nd in
goa
t milk
col
ostr
um s
ampl
es. T
he e
mpi
rica
l for
mul
a as
wel
l as
neut
ral m
ass
and
MS/
MS
veri
fica
tion
are
repo
rted
for
olig
osac
char
ides
in a
ll sa
mpl
es.
#C
ompo
siti
ona
For
mul
aN
eutr
al m
ass
Ver
ifie
d by
MS/
MS
Pre
senc
e in
indi
vidu
al s
ampl
es a
nd a
bund
ance
b
CS1
CS2
CS3
CS4
CS5
11_
1_1_
0_0
C20
H35
N1O
1552
9.20
1X
Y§
Y§
Y§
Y§
Y§
21_
1_0_
0_1
C25
H42
N2O
2069
0.23
2√
Y§
NN
NN
31_
1_0_
0_1
C25
H42
N2O
2069
0.23
3√
Y‡
Y‡
Y‡
Y‡
Y‡
41_
1_0_
0_1
C25
H42
N2O
2069
0.23
2√
Y¥
Y‡
Y‡
Y‡
Y‡
51_
1_0_
1_0
C25
H42
N2O
1967
4.23
8√
Y‡
YY
‡Y
‡Y
¥
61_
1_0_
1_0
C25
H42
N2O
1967
4.23
8√
Y¥
Y¥
Y¥
Y¥
Y¥
71_
1_0_
1_0
C25
H42
N2O
1967
4.23
9√
NY
§Y
§Y
§Y
§
81_
1_0_
1_0
C25
H42
N2O
1967
4.23
6√
Y‡
NN
NN
91_
1_0_
1_0
C25
H42
N2O
1967
4.23
9√
NY
§Y
§Y
§Y
§
101_
1_0_
1_0
C25
H42
N2O
1967
4.23
8√
NY
‡Y
‡Y
§Y
‡
112_
0_0_
0_1
C23
H39
NO
2064
9.20
7√
Y‡
Y§
Y§
Y§
Y§
122_
0_0_
0_1
C23
H39
NO
2064
9.20
6√
Y¥
Y‡
Y‡
Y‡
Y‡
132_
0_0_
0_1
C23
H39
NO
2064
9.20
7√
Y¥
Y‡
Y‡
Y‡
Y‡
142_
0_0_
0_1
C23
H39
NO
2064
9.20
6√
Y‡
Y‡
Y‡
Y‡
Y‡
152_
0_0_
0_1
C23
H39
NO
2064
9.20
7√
Y‡
Y‡
Y‡
Y‡
Y‡
162_
0_0_
0_2
C34
H56
N2O
2995
6.29
6√
Y‡
Y§
Y‡
Y‡
Y§
172_
0_0_
0_2
C34
H56
N2O
2995
6.29
8√
Y‡
Y§
Y§
Y§
Y§
182_
0_0_
0_2
C34
H56
N2O
2995
6.29
6√
Y‡
NY
§N
Y§
192_
0_0_
0_2
C34
H56
N2O
2995
6.29
7√
Y‡
NN
NN
202_
0_0_
1_0
C23
H39
NO
1963
3.21
1√
Y¥¥
Y¥¥
Y¥¥
Y¥¥
Y¥¥
212_
0_0_
1_0
C23
H39
NO
1963
3.21
2√
Y¥
Y¥
Y¥
Y¥
Y¥
222_
0_0_
1_1
C34
H56
N2O
2894
0.30
3X
Y‡
Y§
Y‡
Y‡
Y‡
J Chromatogr A. Author manuscript; available in PMC 2016 February 02.

Author M
anuscriptA
uthor Manuscript
Author M
anuscriptA
uthor Manuscript
Martín-Ortiz et al. Page 17
#C
ompo
siti
ona
For
mul
aN
eutr
al m
ass
Ver
ifie
d by
MS/
MS
Pre
senc
e in
indi
vidu
al s
ampl
es a
nd a
bund
ance
b
CS1
CS2
CS3
CS4
CS5
232_
0_0_
1_1
C34
H56
N2O
2894
0.30
2√
Y‡
Y§
Y§
Y§
Y§
242_
0_0_
1_1
C34
H56
N2O
2894
0.30
1√
Y‡
Y§
Y§
Y§
Y§
252_
0_0_
1_1
C34
H56
N2O
2894
0.30
2√
Y‡
NN
NN
262_
0_0_
2_0
C34
H56
N2O
2792
4.30
6√
Y‡
Y‡
Y‡
Y§
Y‡
272_
0_0_
2_0
C34
H56
N2O
2792
4.30
7√
Y§
Y‡
Y‡
Y‡
Y‡
282_
0_0_
2_0
C34
H56
N2O
2792
4.30
7√
Y‡
Y‡
Y‡
Y‡
Y‡
292_
0_1_
0_0
C18
H32
O15
488.
174
√Y
§Y
§Y
§Y
‡Y
§
302_
1_0_
0_0
C20
H35
N16
545.
195
√Y
§Y
‡Y
‡Y
§Y
‡
312_
1_0_
0_0
C20
H35
NO
1654
5.19
5√
Y‡
Y‡
Y‡
Y‡
Y‡
322_
1_0_
0_0
C20
H35
NO
1654
5.19
5√
Y§
Y‡
Y‡
Y§
Y§
332_
1_0_
0_0
C20
H35
NO
1654
5.19
5√
Y‡
Y‡
Y‡
Y‡
Y‡
342_
1_0_
0_0
C20
H35
NO
1654
5.19
5√
Y‡
Y‡
Y‡
Y§
Y§
352_
1_0_
1_0
C31
H52
N2O
2483
6.29
3√
Y§
Y§
Y§
Y§
Y§
362_
2_0_
0_0
C28
H48
N2O
2174
8.27
6X
Y§
NN
NY
§
372_
2_0_
0_0
C28
H48
N2O
2174
8.27
5√
Y§
Y§
Y§
Y§
Y§
382_
2_0_
0_0
C28
H48
N2O
2174
8.27
5X
Y‡
NY
§Y
‡Y
§
393_
0_0_
0_0
C18
H32
O16
504.
169
√Y
‡Y
‡Y
‡Y
‡Y
§
403_
0_0_
0_0
C18
H32
O16
504.
168
√Y
‡Y
‡Y
‡Y
‡Y
‡
413_
0_0_
0_0
C18
H32
O16
504.
169
√Y
‡Y
‡Y
‡Y
‡Y
‡
423_
0_0_
0_0
C18
H32
O16
504.
169
√Y
‡Y
‡Y
‡Y
‡Y
‡
433_
0_0_
0_0
C18
H32
O16
504.
169
√Y
§Y
§Y
‡Y
‡Y
§
443_
0_0_
0_0
C18
H32
O16
504.
169
√Y
‡Y
‡Y
‡Y
‡N
453_
0_0_
0_0
C18
H32
O16
504.
169
√Y
‡Y
‡Y
‡Y
‡Y
‡
463_
0_0_
0_1
C29
H49
NO
2581
1.26
0√
Y‡
Y§
Y‡
Y‡
Y§
473_
0_0_
1_0
C29
H49
NO
2479
5.26
6√
Y§
Y§
Y§
Y§
Y§
483_
0_0_
1_0
C29
H49
NO
2479
5.26
4√
Y‡
Y‡
Y‡
Y‡
Y‡
J Chromatogr A. Author manuscript; available in PMC 2016 February 02.
Author M
anuscriptA
uthor Manuscript
Author M
anuscriptA
uthor Manuscript
Martín-Ortiz et al. Page 18
#C
ompo
siti
ona
For
mul
aN
eutr
al m
ass
Ver
ifie
d by
MS/
MS
Pre
senc
e in
indi
vidu
al s
ampl
es a
nd a
bund
ance
b
CS1
CS2
CS3
CS4
CS5
493_
0_0_
1_0
C29
H49
NO
2479
5.26
5√
Y§
Y‡
Y‡
Y‡
Y‡
503_
0_0_
2_0
C40
H66
N2O
3210
86.3
60X
Y§
Y§
Y§
NY
§
513_
1_0_
0_0
C26
H45
NO
2170
7.24
8√
Y§
Y§
Y§
Y§
Y§
523_
1_0_
0_0
C26
H45
NO
2170
7.24
9√
Y‡
Y‡
Y‡
Y‡
Y§
533_
1_0_
0_0
C26
H45
NO
2170
7.24
8√
Y‡
Y§
Y‡
Y‡
Y§
543_
1_1_
0_0
C32
H55
NO
2585
3.30
5X
Y§
Y§
Y§
Y§
Y§
553_
3_0_
0_0
C42
H7l
N3O
3111
13.4
11X
Y§
Y§
Y§
Y§
Y§
564_
0_0_
0_0
C24
H42
O21
666.
222
√Y
§Y
§Y
§Y
§Y
§
574_
0_0_
0_0
C24
H42
O21
666.
222
√Y
§Y
§Y
‡Y
§Y
§
584_
0_0_
0_0
C24
H42
O21
666.
221
√Y
§Y
§Y
‡Y
§Y
§
594_
0_0_
0_0
C24
H42
O21
666.
222
√Y
§Y
§Y
§Y
‡Y
‡
604_
0_0_
0_0
C24
H42
O21
666.
222
√Y
§Y
§Y
§Y
‡Y
‡
614_
0_0_
0_0
C24
H42
O21
666.
220
√Y
§Y
§Y
§Y
‡Y
§
624_
0_0_
0_0
C24
H42
O21
666.
220
√Y
§Y
§Y
§Y
§Y
§
634_
0_0_
0_0
C24
H42
O21
666.
222
√Y
§Y
§Y
§Y
‡Y
§
644_
0_0_
0_0
C24
H42
O21
666.
222
√Y
§Y
§Y
§Y
‡Y
§
654_
1_0_
0_0
C32
H55
NO
2686
9.30
1√
Y‡
Y‡
Y‡
Y‡
Y‡
664_
1_0_
0_0
C32
H55
NO
2686
9.30
2√
Y‡
Y§
Y‡
Y‡
Y‡
674_
2_0_
0_0
C40
H68
N2O
3110
72.3
85X
Y§
Y§
Y‡
Y§
Y‡
684_
2_0_
1_0
C51
H85
N3O
3913
63.4
86X
NN
Y§
NY
§
694_
2_0_
1_0
C51
H85
N3O
3913
63.4
81X
Y§
Y§
Y‡
NY
§
705_
0_0_
0_0
C30
H52
O26
828.
277
XY
§N
Y§
Y§
Y§
715_
0_0_
0_0
C30
H52
O26
828.
276
XY
§Y
§Y
§Y
§Y
§
725_
0_0_
0_0
C30
H52
O26
828.
272
XY
§N
NY
§Y
§
735_
0_0_
0_0
C30
H52
O26
828.
276
XN
NY
§Y
‡Y
§
J Chromatogr A. Author manuscript; available in PMC 2016 February 02.

Author M
anuscriptA
uthor Manuscript
Author M
anuscriptA
uthor Manuscript
Martín-Ortiz et al. Page 19
#C
ompo
siti
ona
For
mul
aN
eutr
al m
ass
Ver
ifie
d by
MS/
MS
Pre
senc
e in
indi
vidu
al s
ampl
es a
nd a
bund
ance
b
CS1
CS2
CS3
CS4
CS5
745_
0_0_
0_0
C30
H52
O26
828.
278
XY
§Y
§Y
§Y
§Y
§
756_
0_0_
0_0
C36
H62
O31
990.
327
XY
§Y
§Y
§Y
§Y
§
766_
0_0_
0_0
C36
H62
O31
990.
330
XY
§N
Y§
Y§
N
776_
0_0_
0_0
C36
H62
O31
990.
331
XY
§Y
§N
Y§
Y§
786_
0_0_
0_0
C36
H62
O31
990.
331
XN
NN
Y§
N
a Com
posi
tion
(in
orde
r): H
exos
e_H
exN
Ac_
Fuco
se_N
euA
c_N
euG
c.
b Rel
ativ
e ab
unda
nce
§ low
abu
ndan
ce (
<0.
2%)
‡ med
ium
abu
ndan
ce (
0.2–
5%)
¥ high
abu
ndan
ce(5
–20%
)
¥¥ve
ry h
igh
abun
danc
e (>
20%
)
x com
poun
d ab
unda
nce
was
too
low
to a
chie
ve g
ood
MS/
MS
spec
tra.
J Chromatogr A. Author manuscript; available in PMC 2016 February 02.

Author M
anuscriptA
uthor Manuscript
Author M
anuscriptA
uthor Manuscript
Martín-Ortiz et al. Page 20
Table 2
Molecular ion adducts registered for colostrum goat milk oligosaccharides ([M+Na]+ in positive ionization
mode and [M−H]− in negative ionization mode). Symbol code: neutral (N); acidic (A).
Peak no Oligosaccharides [M+Na]+ [M−H]−
1 α-2′Fucosyl-lactose 511 487 N
2 Galactosyl-lactoses 527 503 N
3 3′Sialyl-lactose and 6′sialyl-lactose 656 632 A
4 Di-hexosyl-lactoses 689 665 N
5 Sialyl-lactosamine 697 673 A
6 Glycolyl-neuraminyl-lactosamine 713 689 A
J Chromatogr A. Author manuscript; available in PMC 2016 February 02.

Author M
anuscriptA
uthor Manuscript
Author M
anuscriptA
uthor Manuscript
Martín-Ortiz et al. Page 21
Tab
le 3
Chr
omat
ogra
phic
par
amet
ers
obta
ined
usi
ng d
iffe
rent
add
itive
of
aque
ous
phas
e. A
ceto
nitr
ile:w
ater
elut
ion
prog
ram
: 15–
50%
aqu
eous
pha
se in
46m
in,
50%
aqu
eous
pha
se f
or 1
0min
at 3
0°C
.
0.1%
am
mon
ium
hyd
roxi
de (
))0.
1% a
ceti
c ac
id (
)5
mM
am
mon
ium
ace
tate
()
[M+N
a]+
RT
(min
)A
sW
h (m
in)
Rs
[M+N
a]+
RT
(m
in)
As
Wh
(min
)R
s[M
+Na]
+R
T(m
in)
As
Wh
(min
)R
s
656
14.6
1.3
0.3
0.2
656
22.0
2.8
0.5
0.4
713
26.4
1.1
0.3
0.1
697
14.7
1.3
0.4
0.0
713
22.3
1.8
0.5
0.1
697
26.4
0.6
0.2
0.2
713
14.7
1.0
0.5
2.5
697
22.4
0.8
0.6
2.2
656
26.5
1.0
0.2
4.1
656
16.4
1.4
0.3
0.1
656
24.4
1.2
0.5
6.4
713
28.1
1.1
0.3
0.3
713
16.5
1.4
0.3
18.5
511
28.3
0.8
0.3
6.5
656
28.2
0.9
0.3
0.7
511
32.6
1.3
0.4
3.3
527
31.1
0.7
0.6
0.6
713
28.6
0.7
0.4
4.3
527
35.6
1.2
0.6
1.9
527
31.4
1.3
0.3
1.0
511
30.8
1.1
0.2
5.8
527
36.5
1.0
0.2
1.8
527
32.1
1.1
0.4
3.6
527
33.8
0.6
0.4
1.4
689
42.5
0.7
3.6
689
41.3
1.6
2.8
527
34.5
1.1
0.2
12.2
689
40.0
0.8
2.0
J Chromatogr A. Author manuscript; available in PMC 2016 February 02.

Author M
anuscriptA
uthor Manuscript
Author M
anuscriptA
uthor Manuscript
Martín-Ortiz et al. Page 22
Tab
le 4
Chr
omat
ogra
phic
par
amet
ers
obta
ined
usi
ng d
iffe
rent
ove
ntem
pera
ture
s. A
ceto
nitr
ile:w
ater
+ 0
.1%
am
mon
ium
hyd
roxi
de e
lutio
n pr
ogra
m: 1
5–50
%
aque
ous
phas
e in
46
min
, 50%
aqu
eous
pha
se f
or 1
0 m
in.
40 °
C60
°C
[M+N
a]+
RT
(m
in)
As
Wh
(min
)R
sR
T(m
in)
As
Wh
(min
)R
s
656
13.9
0.9
0.3
0.2
11.0
0.7
0.4
0.4
713
14.0
1.1
0.4
0.0
11.4
1.3
0.5
0.4
697
14.0
1.2
0.4
3.5
11.8
0.7
0.4
2.4
656
16.1
0.7
0.2
0.1
13.6
0.7
0.4
0.2
713
16.1
1.1
0.3
35.6
13.7
1.1
0.2
40.0
511
31.9
1.1
0.2
6.5
30.3
1.0
0.3
7.4
527
35.1
0.7
0.3
1.7
33.9
0.7
0.3
1.8
527
36.0
1.1
0.2
2.2
34.8
1.1
0.2
2.2
689
42.0
0.8
3.0
40.7
0.7
3.0
J Chromatogr A. Author manuscript; available in PMC 2016 February 02.

Author M
anuscriptA
uthor Manuscript
Author M
anuscriptA
uthor Manuscript
Martín-Ortiz et al. Page 23
Table 5
Limits of detection (LOD) and of quantitation (LOQ) and precision (relative standard deviation, % RSD) for a
standard mixture analyzed by HILIC-Q MS using acetoni-trile:water with 0.1% ammonium hydroxide as
mobile phase and 40°C as oven temperature.
Compound LOD(ng mL−1)
LOQ(ng mL−1)
Precision(RSD, %)
2′-Fucosyl-lactose 160.62 535.41 6.9
6′-Sialyl-lactose 3.28 10.94 8.1
Maltotriose 19.76 65.87 6.0
Maltotetraose 114.21 380.69 7.2
J Chromatogr A. Author manuscript; available in PMC 2016 February 02.
Author M
anuscriptA
uthor Manuscript
Author M
anuscriptA
uthor Manuscript
Martín-Ortiz et al. Page 24
Tab
le 6
Con
tent
(m
g L
−1 )
of
olig
osac
char
ides
in c
olos
trum
sam
ples
ana
lyze
d by
HIL
IC-Q
MS
usin
g ac
eton
itrile
:wat
er w
ith 0
.1%
am
mon
ium
hyd
roxi
de a
s m
obile
phas
e an
d 40
°C
as
oven
tem
pera
ture
.
Com
posi
tion
a[M
+Na]
+R
T(m
in)
CS1
CS2
CS3
CS4
CS5
2′-F
ucos
yl-l
acto
sec
2010
051
132
.62.
2 (0
.4)b
2.9
(0.1
)7.
7 (0
.1)
31.6
(0.
3)16
(1)
Gal
acto
syl-
lact
osec
3000
052
735
.114
5 (1
0)12
8 (1
3)12
5 (1
1)23
3 (1
1)26
6 (2
1)
Gal
acto
syl-
lact
osec
3000
052
736
.03.
6 (0
.5)
2.0
(0.3
)2.
7 (0
.7)
5 (1
)8.
3 (2
.2)
Sial
yl-l
acto
sam
inec
1101
069
714
.037
.80
(0.0
1)31
.31
(0.0
1)33
(4)
65 (
6)5.
7 (0
.8)
Sial
yl-l
acto
sam
inec
1101
069
714
.38.
0 (0
.6)
5.2
(0.4
)6
(2)
8.6
(0.5
)4
(1)
3′-S
ialy
l-la
ctos
ec20
010
656
13.9
3.05
(0.
01)
5.73
(0.
02)
12 (
1)12
(0.7
)10
(1)
6′-S
ialy
l-la
ctos
ec20
010
656
16.2
53 (
5)50
(2)
70 (
1)12
4(2)
29 (
4)
Gly
coly
l-ne
uram
inyl
-lac
tosa
min
ec11
001
713
12.4
2.26
(0.
02)
1.48
(0.
01)
0.7
(0.5
)5.
5 (0
.5)
1.5
(0.8
)
Gly
coly
l-ne
uram
inyl
-lac
tosa
min
ec11
001
713
14.0
0.6
(0.1
)0.
24 (
0.03
)1.
41 (
0.02
)0.
98 (
0.01
)2.
24 (
0.03
)
Gly
coly
l-ne
uram
inyl
-lac
tosa
min
ec11
001
713
16.1
13.6
(0.
5)2.
7 (0
.1)
2.8
(0.4
)8
(1)
5.1
(0.1
)
Gly
coly
l-ne
uram
inyl
-lac
tosa
min
ec11
001
713
16.2
10.6
(0.
6)2.
6 (0
.1)
4.5
(0.7
)5
(1)
5.1
(0.1
)
Gly
coly
l-ne
uram
inyl
-lac
tose
c20
001
672
13.7
0.2
(0.1
)0.
61 (
0.04
)1.
30(0
.01)
3.0
(0.3
)0.
3 (0
.5)
Gly
coly
l-ne
uram
inyl
-lac
tose
c20
001
672
16.3
5.14
(0.
03)
3.93
(0.
02)
7 (1
)19
(2)
5 (1
)
Gly
coly
l-ne
uram
inyl
-lac
tose
c20
001
672
17.8
19.8
(0.
3)5.
5 (0
.1)
12 (
1)30
(2)
5 (2
)
Fuco
syl-
lact
osam
inec
1110
055
230
.63.
1 (0
.1)
4.1
(0.1
)6.
00 (
0.05
)6.
15 (
0.05
)5.
9 (0
.7)
Sial
yl-h
exos
yl-l
acto
se30
010
818
16.2
0.05
(0.
01)
0.93
(0.
02)
0.1
(0.1
)0.
10 (
0.01
)1.
3 (0
.4)
Sial
yl-h
exos
yl-l
acto
se30
010
818
17.4
0.05
(0.
01)
-d-
0.03
(0.
01)
1 (1
)
Sial
yl-h
exos
yl-l
acto
se30
010
818
17.9
0.07
(0.
01)
0.08
(0.
01)
-0.
05 (
0.01
)1.
2 (0
.2)
Sial
yl-g
lyco
lyl-
neur
amin
yl-l
acto
se20
011
963
9.5
--
--
1.1
(0.2
)
Sial
yl-g
lyco
lyl-
neur
amin
yl-l
acto
se20
011
963
12.1
0.21
(0.
02)
0.27
(0.
03)
0.16
(0.0
3)-
1.1
(0.2
)
Ace
tyl-
gluc
osam
inyl
-hex
osyl
-lac
tose
3100
073
026
.7-
--
-1.
4 (0
.4)
Ace
tyl-
gluc
osam
inyl
-hex
osyl
-lac
tose
3100
073
027
.6-
0.75
(0.
01)
0.4
(0.3
)1.
19 (
0.07
)10
(2)
Ace
tyl-
gluc
osam
inyl
-lac
tose
2100
056
831
.70.
33 (
0.03
)0.
3 (0
.1)
0.3
(0.1
)0.
63 (
0.01
)1.
1 (0
.1)
Ace
tyl-
gluc
osam
inyl
-lac
tose
2100
056
832
.50.
46 (
0.02
)0.
26 (
0.02
)0.
20(0
.01)
0.7
(0.1
)3
(1)
J Chromatogr A. Author manuscript; available in PMC 2016 February 02.

Author M
anuscriptA
uthor Manuscript
Author M
anuscriptA
uthor Manuscript
Martín-Ortiz et al. Page 25
Com
posi
tion
a[M
+Na]
+R
T(m
in)
CS1
CS2
CS3
CS4
CS5
Ace
tyl-
gluc
osam
inyl
-lac
tose
2100
056
832
.81.
4 (0
.2)
0.6
(0.2
)0.
60(0
.01)
3.9
(0.1
)1.
5 (0
.6)
Ace
tyl-
gluc
osam
inyl
-lac
tose
2100
056
833
.90.
11 (
0.01
)0.
06 (
0.01
)0.
29(0
.01)
0.21
(0.
01)
0.7
(0.2
)
Dih
exos
yl-l
acto
se40
000
689
39.5
0.22
(0.
01)
0.22
(0.
02)
-1.
31 (
0.05
)1.
6 (0
.1)
Dih
exos
yl-l
acto
se40
000
689
40.6
--
-1.
98 (
0.03
)2.
0 (0
.1)
Dih
exos
yl-l
acto
se40
000
689
41.9
1.2
(0.1
)0.
58 (
0.01
)-
4.65
(0.
05)
6.9
(0.1
)
Tot
al o
ligos
acch
arid
es31
1.84
251.
2229
3.16
572.
2440
4.11
a Com
posi
tion
(in
orde
r): H
ex_H
exN
Ac_
Fuco
se_N
euA
c_N
euG
c.
b Stan
dard
dev
iatio
n in
bra
cket
s.
c Olig
osac
char
ides
ana
lyze
d be
fore
SE
C tr
eatm
ent.
d Non
det
ecte
d O
S.
J Chromatogr A. Author manuscript; available in PMC 2016 February 02.


